Sequence‐ and activity‐based screening of microbial genomes for novel dehalogenases (original) (raw)
Summary
Dehalogenases are environmentally important enzymes that detoxify organohalogens by cleaving their carbon‐halogen bonds. Many microbial genomes harbour enzyme families containing dehalogenases, but a sequence‐based identification of genuine dehalogenases with high confidence is challenging because of the low sequence conservation among these enzymes. Furthermore, these protein families harbour a rich diversity of other enzymes including esterases and phosphatases. Reliable sequence determinants are necessary to harness genome sequencing‐efforts for accelerating the discovery of novel dehalogenases with improved or modified activities. In an attempt to extract dehalogenase sequence fingerprints, 103 uncharacterized potential dehalogenase candidates belonging to the α/β hydrolase (ABH) and haloacid dehalogenase‐like hydrolase (HAD) superfamilies were screened for dehalogenase, esterase and phosphatase activity. In this first biochemical screen, 1 haloalkane dehalogenase, 1 fluoroacetate dehalogenase and 5 l‐2‐haloacid dehalogenases were found (success rate 7%), as well as 19 esterases and 31 phosphatases. Using this functional data, we refined the sequence‐based dehalogenase selection criteria and applied them to a second functional screen, which identified novel dehalogenase activity in 13 out of only 24 proteins (54%), increasing the success rate eightfold. Four new l‐2‐haloacid dehalogenases from the HAD superfamily were found to hydrolyse fluoroacetate, an activity never previously ascribed to enzymes in this superfamily.
Introduction
Dehalogenases catalyse the cleavage of carbon‐halogen bonds and are critical to the detoxification and biodegradation of organohalogens. Of all types of dehalogenases discovered over the past few decades (Fetzner and Lingens, 1994; Hill et al., 1999; de Jong and Dijkstra, 2003), the hydrolytic dehalogenases are particularly attractive research targets (and have thus been studied the most) because they are cytosolic proteins, generally do not require cofactors, and use water as the sole co‐substrate. A large number of hydrolytic dehalogenases belong to two large enzyme superfamilies: the α/β hydrolases (ABH; 22 133 sequences in databases, July 2009) and the haloacid dehalogenase‐like hydrolases (HAD; 25 048 sequences). The ABH superfamily includes a variety of hydrolytic enzymes with carboxylesterase, thioesterase, peptidase, haloalkane dehalogenase and fluoroacetate dehalogenase activities (Holmquist, 2000). The vast majority of HAD members have unknown function; those with known function display one of five activities: ATPase, phosphatase, phosphoglucomutase, phosphonohydrolase or l‐2‐haloacid dehalogenase (Koonin and Tatusov, 1994; Allen and Dunaway‐Mariano, 2004). Collectively, the dehalogenases from the ABH and HAD superfamilies transform a relatively broad variety of substrates, which is an advantageous property for bioremediation as well as industrial biocatalysis (Table 1) (Swanson, 1999). Interestingly, despite the absence of any sequence similarities between the ABH and HAD dehalogenases, they all employ a similar two‐step dehalogenation mechanism that involves an aspartate nucleophile and a covalent ester intermediate (Fig. 1) (Verschueren et al., 1993; Liu et al., 1998; Schmidberger et al., 2007).
Table 1.
Substrate specificities of the ABH and HAD dehalogenases.
| Classification | Substrate range | Reference |
|---|---|---|
| ABH superfamily | ||
| Haloalkane dehalogenase | ||
| Type I (3R) | Short, primary, aliphatic alkyl chlorides and bromides | a |
| Type II (3B) | Long (> 3 carbon atoms), primary and secondary, aliphatic (including cyclic) alkyl chlorides and bromides | b |
| Fluoroacetate dehalogenase | Haloacetates, highest activity on fluoroacetate | c |
| HAD superfamily | ||
| l‐2‐Haloacid dehalogenase | _S_‐2‐chloro‐ and bromo‐aliphatic carboxylic acids | d |
Figure 1.
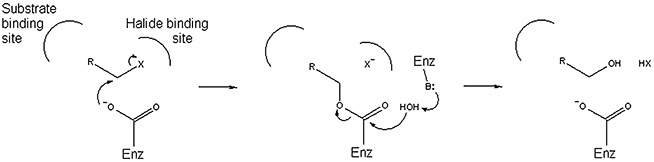
Generalized two‐step dehalogenation mechanism employed by several hydrolytic dehalogenases.
Proteome analysis of sequenced microbial genomes revealed that many organisms harbour multiple (occasionally more than 20) genes that share amino acid sequence similarity to ABH and HAD dehalogenases. Unfortunately, their high sequence diversity (e.g. less than 30% sequence identity for HADs) and the lack of robust sequence motif information prevent confident separation of dehalogenases from the much more commonly occurring family members such as esterases, peptidases and phosphatases (Heikinheimo et al., 1999; Nardini and Dijkstra, 1999; Holmquist, 2000; Allen and Dunaway‐Mariano, 2004). To our knowledge, only the following hydrolytic dehalogenases have been sequenced and biochemically characterized to date: 9 ABH haloalkane dehalogenases (Keuning et al., 1985; Newman et al., 1999; Jesenska et al., 2002; Jesenska et al., 2005; Kmunicek et al., 2005; Sato et al., 2005; Prudnikova et al., 2009); 2 ABH fluoroacetate dehalogenases (Kawasaki et al., 1992; Kurihara et al., 2003); at least 13 HAD l‐2‐haloacid dehalogenases (Schneider et al., 1991; van der Ploeg et al., 1991; Jones et al., 1992; Kawasaki et al., 1992; 1994; Murdiyatmo et al., 1992; Liu et al., 1994; Cairns et al., 1996; Hill et al., 1999; Rye et al., 2009); 2 d‐ and 9 dl‐2‐haloacid dehalogenases (Barth et al., 1992; Liu et al., 1994; Brokamp et al., 1996; Cairns et al., 1996; Nardi‐Dei et al., 1997; Stringfellow et al., 1997; Hill et al., 1999); 1 _cis_‐ and 1 _trans_‐3‐chloroacrylate dehalogenase (de Jong et al., 2004; 2007); and 3 4‐chlorobenzoyl‐CoA dehalogenases (Schmitz et al., 1992; Benning et al., 1996; Chae et al., 1999).
To facilitate the discovery of novel dehalogenases with potential for broader applicability, we selected for biochemical characterization 163 potential ABH and HAD dehalogenase candidates from the sequenced genomes of five common soil bacteria using a sequence‐similarity criterion. Improved dehalogenase prediction criteria were developed and validated using a second screen on potential dehalogenase candidates from additional microbial genomes. Finally, we explore the use of _E_‐values from database searches as an additional tool for assisting in the identification of novel microbial dehalogenases.
Results and discussion
Selection of dehalogenase genes from sequenced genomes
The potential dehalogenase candidates in the initial screen were selected from sequenced genomes of five common soil microorganisms with direct environmental relevance (Pseudomonas aeruginosa PAO1, Pseudomonas putida KT2440, Rhodopseudomonas palustris CGA009, Streptomyces avermitilis MA‐4680 and Sinorhizobium meliloti 1021). A total of 110 genes from the ABH superfamily were selected using the described procedures (Table S1A). For the HAD superfamily, a total of 53 target genes were selected (Table S2A). In the second screen, we selected 30 additional putative dehalogenases from 14 different microbial genomes (see Experimental procedures) using refined search criteria identified from the initial screen (Tables S1B and S2B).
Overexpression in E. coli and protein purification
Of the 163 gene sequences (110 ABH and 53 HAD) selected in the initial screen, 155 (95%) were cloned successfully, 111 (68%) expressed well and 85 clones (52%) produced soluble recombinant protein with high yields between 5 and 110 mg l−1 of bacterial culture. The remaining 70 cloned but poorly expressed and/or insoluble (i.e. primarily expressed as inclusion bodies) proteins yielded less than 5 mg l−1 of bacterial culture. The purity of high‐yield preparations was 75–95%, and that of the low‐yield samples was less than 35% (Fig. S1). Of the 30 gene sequences selected in the second round screen, 24 clones produced soluble recombinant protein (1–180 mg l−1 of bacterial culture). These results are provided in Table S3 and summarized in Table S4.
Enzymatic assays of purified proteins
Every protein preparation in the initial screen (155 samples) was assayed on every substrate regardless of protein family and sample purity. Enzyme assays were designed to test for dehalogenase, carboxylesterase, thioesterase and phosphatase activities. Proteins purified for the second screen were only assayed for dehalogenase activity. The organohalogen substrates used for the dehalogenase assays are listed in the experimental section.
Overall, the initial enzymatic screen identified seven novel dehalogenases from 155 tested protein preparations: two from the ABH and five from the HAD superfamilies. The overall success rate of the initial screen was 7% (7/103). The 52 low‐yield samples with no activity were not counted because these negative results may have been caused by insufficient levels of recombinant protein in the assays.
Specifically, of the 110 selected ABH targets, 102 were successfully cloned (and thus assayable), and only one (SAV4779) dehalogenated the haloalkanes 1,2‐dibromoethane, 1,3‐dichloropropane and chlorocyclohexane (Table 2). One (RPA1163) could hydrolyse fluoroacetate, and more slowly chloroacetate. Nineteen proteins hydrolysed palmitoyl‐CoA (Fig. S2) and two of these were also active on _p_‐nitrophenyl palmitate (both are substrates for carboxylesterases and thioesterases) (Table 3). No other protein samples displayed multiple activities and none were active in the phosphatase activity screen. Representative assay data are shown in Table S2.
Table 2.
Substrate profile of all identified dehalogenases.
| Enzyme | Substrates | ||||
|---|---|---|---|---|---|
| 1,2‐Dichloroethane | 1,3‐Dichloropropane | Chlorocyclohexane | 1,2‐Dibromoethane | ||
| Haloalkane dehalogenase | |||||
| SAV4779 | (1) | − | + | + | + |
| JANN2620 | (2) | + | + | + | + |
| Fluoroacetate | Chloroacetate | _S_‐2‐Chloropropionate | Bromoacetate | ||
| Fluoroacetate dehalogenase | |||||
| RPA1163 | (1) | + | + | − | − |
| Alr0039 | (2) | + | + | Not tested | + |
| Bcen2424–2964 | (2) | + | + | Not tested | + |
| Daro3835 | (2) | + | + | Not tested | + |
| Bpro4478 | (2) | + | + | Not tested | + |
| l‐2‐haloacid dehalogenase | |||||
| PA0810 | (1) | − | + | − | + |
| RPA4199 | (1) | − | + | + | + |
| RPA2507 | (1) | − | + | + | + |
| SAV737 | (1) | − | + | + | + |
| SMc00103 | (1) | − | + | + | + |
| Adeh3811 | (2) | + | + | Not tested | + |
| Bcen2424–2051 | (2) | − | + | Not tested | + |
| Jann1658 | (2) | − | + | Not tested | + |
| Bpro0530 | (2) | + | + | Not tested | + |
| Bpro4516 | (2) | + | + | Not tested | + |
| RSc1362 | (2) | − | + | Not tested | + |
| RHA1_ro00230 | (2) | + | + | Not tested | + |
| SCO3446 | (2) | − | + | Not tested | + |
Table 3.
Relative absorbance of active proteins in esterase and phoshatase activity screens.
| Superfamily | Gene locus | Purity | Substrates | Identified activity | |||
|---|---|---|---|---|---|---|---|
| pNP‐palmitate | Palmitoyl‐CoA | pNPP + Mg2+ | pNPP + cations | ||||
| ABH | PA5513 | High | 0.76 | 3.2 | 1.0 | 1.2 | Thioesterase |
| ABH | PA2949 | Low | 2.6 | 2.2 | 0.92 | 0.92 | Esterase |
| ABH | PP4164 | High | 0.83 | 2.8 | 0.90 | 0.95 | Thioesterase |
| ABH | PP2567 | High | 0.88 | 2.4 | 0.95 | 0.99 | Thioesterase |
| ABH | PP2083 | High | 0.74 | 2.1 | 0.92 | 0.96 | Thioesterase |
| ABH | RPA4646 | High | 1.2 | 1.8 | 0.81 | 0.94 | Thioesterase |
| ABH | RPA3430 | Low | 0.89 | 2.0 | 0.85 | 0.98 | Thioesterase |
| ABH | RPA1568 | High | 0.86 | 4.3 | 0.87 | 0.89 | Thioesterase |
| ABH | RPA0348 | Low | 1.7 | 3.1 | 0.88 | 0.94 | Esterase |
| ABH | RPA1212 | Low | 0.85 | 2.7 | 0.82 | 0.90 | Thioesterase |
| ABH | RPA0996 | Low | 0.86 | 2.7 | 0.88 | 0.89 | Thioesterase |
| ABH | SAV1548 | Low | 0.73 | 1.7 | 1.0 | 0.95 | Thioesterase |
| ABH | SAV298 | Low | 0.89 | 2.4 | 0.94 | 1.1 | Thioesterase |
| ABH | SMc03810 | High | 0.92 | 2.5 | 0.86 | 0.91 | Thioesterase |
| ABH | SMc01273 | High | 0.82 | 2.7 | 0.88 | 0.91 | Thioesterase |
| ABH | SMc00361 | High | 0.95 | 2.8 | 0.88 | 0.90 | Thioesterase |
| ABH | SMc00147 | Low | 0.87 | 2.2 | 0.90 | 1.1 | Thioesterase |
| ABH | SMc02818 | High | 0.87 | 1.8 | 0.90 | 0.92 | Thioesterase |
| ABH | SMc04041 | Low | 0.86 | 3.0 | 1.1 | 0.94 | Thioesterase |
| HAD | PA4458 | High | 0.73 | 1.1 | 1.4* | 2.6* | Phosphatase |
| HAD | PA0335 | High | 0.94 | 1.1 | 2.5 | 2.6* | Phosphatase |
| HAD | PA5177 | High | 0.91 | 0.96 | 16 | 1.9 | Phosphatase |
| HAD | PA0562 | High | 1.0 | 1.0 | 5.1 | 1.7 | Phosphatase |
| HAD | PA3172 | High | 1.0 | 0.98 | 16 | 3.2 | Phosphatase |
| HAD | PA2974 | High | 1.0 | 1.1 | 16 | 17 | Phosphatase |
| HAD | PA0608 | High | 0.96 | 1.1 | 7.0 | 2.2 | Phosphatase |
| HAD | PA3886 | High | 1.1 | 1.1 | 16 | 17 | Phosphatase |
| HAD | PA4960 | High | 0.92 | 1.1 | 16 | 17 | Phosphatase |
| HAD | PP0956 | High | 0.90 | 0.39 | 6.3 | 3.2 | Phosphatase |
| HAD | PP4761 | High | 0.87 | 1.1 | 16 | 17 | Phosphatase |
| HAD | PP0094 | High | 0.86 | 0.86 | 13 | 4.8 | Phosphatase |
| HAD | PP1721 | Low | 0.80 | 1.0 | 2.5 | 1.9 | Phosphatase |
| HAD | PP5147 | High | 0.86 | 1.3 | 9.7 | 2.5* | Phosphatase |
| HAD | PP0259 | Low | 0.79 | 1.3 | 16 | 7.5 | Phosphatase |
| HAD | PP1764 | High | 0.80 | 0.91 | 16 | 10 | Phosphatase |
| HAD | PP1907 | Low | 0.56 | 0.95 | 3.6 | 2.0 | Phosphatase |
| HAD | PP1789 | High | 0.84 | 1.2 | 1.8 | 1.4* | Phosphatase |
| HAD | PP5231 | Low | 0.73 | 0.8 | 2.8 | 1.3* | Phosphatase |
| HAD | PP0416 | Low | 0.85 | 1.1 | 16 | 7.4 | Phosphatase |
| HAD | PP4909 | Low | 0.54 | 0.92 | 16 | 11 | Phosphatase |
| HAD | RPA4522 | High | 1.1 | 1.3 | 2.3 | 1.7 | Phosphatase |
| HAD | SAV4726 | High | 1.1 | 1.2 | 2.0* | 1.4* | Phosphatase |
| HAD | SAV6660 | High | 1.0 | 0.95 | 1.7 | 3.4* | Phosphatase |
| HAD | SMc00081 | High | 0.86 | 1.2 | 16 | 10 | Phosphatase |
| HAD | SMc01276 | Low | 0.83 | 1.1 | 7.1 | 6.6 | Phosphatase |
| HAD | SMc00079 | High | 0.88 | 1.1 | 8.3 | 2.3 | Phosphatase |
| HAD | SMc01617 | High | 0.96 | 1.2 | 1.6 | 1.7* | Phosphatase |
| HAD | SMc00910 | High | 1.0 | 1.1 | 16 | 17 | Phosphatase |
| HAD | SMc01494 | Low | 0.99 | 1.2 | 9.1 | 3.9 | Phosphatase |
| HAD | SMc04299 | High | 0.97 | 0.99 | 1.5* | 0.94 | Phosphatase |
Of the 53 protein preparations of the HAD candidates, five possessed haloacid dehalogenase activity and 31 displayed phosphatase activity (Tables 2 and 3). These HAD dehalogenases exhibited a substrate profile similar to that of the previously characterized l‐2‐haloacid dehalogenases; they can hydrolyse various 2‐haloacids, but none were capable of hydrolysing fluoroacetate (van der Ploeg et al., 1991; Liu et al., 1994). However, the substrate specificity of PA0810 was restricted to the short haloacetates only. No HAD dehalogenases displayed phosphatase activity (and vice versa), and no HAD proteins were active against the tested haloalkanes and esters.
Refined criteria for identification of true dehalogenase sequences
Using the results from these enzymatic assays, additional search criteria were sought by comparing the sequence alignments of biochemically confirmed dehalogenases with those of esterases or phosphatases. A detailed analysis of all sequences is presented in the Supporting Information; the main conclusions are provided below.
For the identification of haloalkane dehalogenases in the ABH superfamily, the Asp catalytic nucleophile serves as an important selection criterion because it is fully conserved and essential for dehalogenation (Fig. 2). The pair of primary halide‐binding residues can act as an additional haloalkane dehalogenase indicator. It comprises: a Trp at the nucleophile + 1 position; and either a Trp that aligns with Trp175 of DhlA (a type I haloalkane dehalogenase) or an Asn equivalent to Asn28 of SAV4779 (a type II haloalkane dehalogenase) within the upstream His‐Gly‐Asn‐Pro motif.
Figure 2.
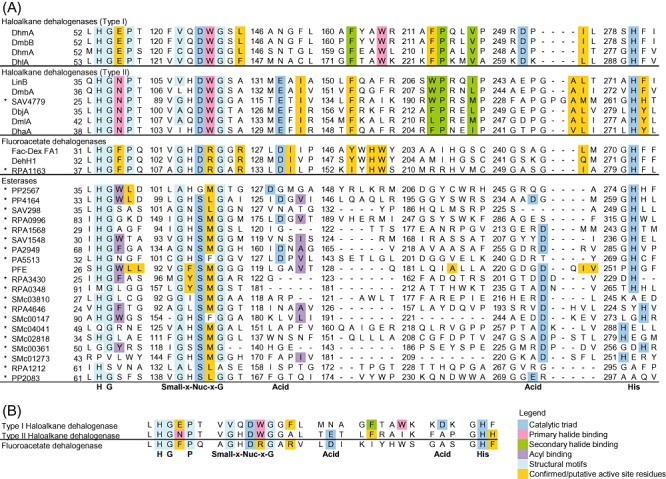
Sequence analyses of ABH targets in the initial screen. The residues' functions were inferred from the crystal structures of the haloalkane dehalogenases DhlA, LinB and DhaA, and the aryl esterase PFE. A. The sequence alignment of ABH targets identified in the initial screen (*). The catalytic triad (Nuc‐Acid‐His) and several structural motifs are well conserved. In haloalkane and fluoroacetate dehalogenases, the nucleophile is a fully conserved Asp, while it is generally a Ser in esterases. The catalytic acid, which is either an Asp or Glu, is located either 24 residues downstream of the catalytic nucleophile, or approximately 29 residues upstream of the catalytic His base found near the C‐terminus respectively. The numbers mark the residue number for the residue to their right. B. The key catalytic motifs extracted from the sequence analysis.
For the identification of fluoroacetate dehalogenases in the ABH superfamily, only a few active site residues are considered for distinguishing their activity. Such a restriction is imposed in order to reduce the number of false negatives during sequence screening given our current rather limited level of understanding. The residues comprise an Asp acting as nucleophile and two Arg at the nucleophile + 1 and nucleophile + 4 positions (Fig. 2).
For the identification of l‐2‐haloacid dehalogenases in the HAD superfamily, two motifs could serve as primary identifiers owing to the distinct functional requirements of such enzymes (Fig. 3). At the N‐terminus, the dehalogenases harbour Asp‐X‐[Tyr/Phe] instead of the Asp‐X‐[Asp/Glu] found in phosphatases. Near the C‐terminus, the dehalogenases possess the oxyanion hole motif Ser175‐Ser176‐Asn177 (L‐Dex YL) or Ala‐Ala‐His, which contrasts with the phosphatase Mg2+‐binding pair of carboxylates ([Asp/Glu]‐Asp, Gly‐[Asp/Glu]‐X3‐Asp or Gly‐[Asp/Glu]‐X4‐Asp); the aligning residues are underlined. These two carboxylate pair motifs may be applied to reliably filter out probable phosphoryl transferases before further screening with dehalogenase‐specific residues, because they were found in numerous phosphoryl transferases (Koonin and Tatusov, 1994; Burroughs et al., 2006; Kuznetsova et al., 2006).
Figure 3.
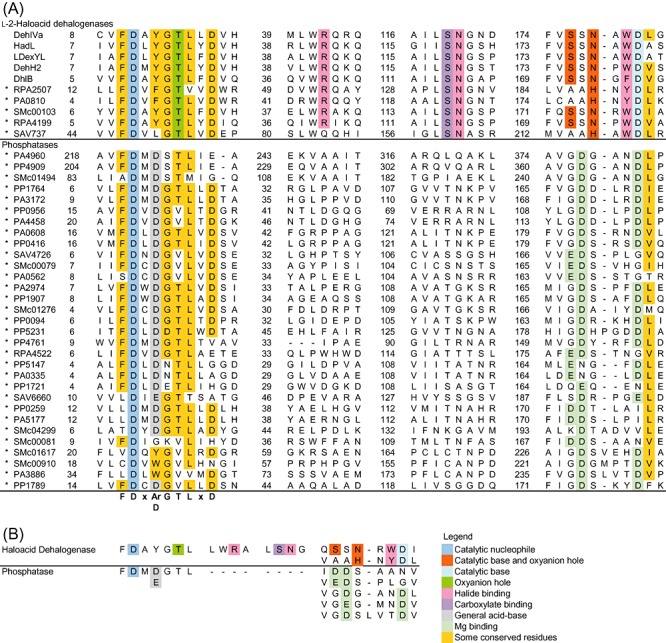
Sequence analyses of HAD targets in the initial screen. The conserved residues in both enzyme groups are presented. A. The sequence alignment of HAD targets identified in the initial screen (*). The overall sequence similarity is higher among the l‐2‐haloacid dehalogenases. The catalytic Asp nucleophile is located at the N‐terminal motif conserved in both enzyme groups. At position nucleophile + 2, the l‐2‐haloacid dehalogenases generally possess an aromatic residue while most phosphatases carry a second Asp. Near the C‐terminus, the dehalogenases and phosphatases have distinct sequence motifs containing catalytically important residues. The numbers mark the residue number for the residue to their right. B. The key catalytic motifs extracted from the sequence analysis. The conserved motif variations within each subfamily are also shown.
Retrospective analysis of sequences from the initial screen, using refined search criteria
Applying the Asp nucleophile and either pair of halide‐binding residues (Trp and Trp/Asn) to filter the initial list of ABH sequences would have narrowed the list to only four of the initial 110 candidates as true potential haloalkane dehalogenases (Fig. 4; only 61 sequences are shown because they correspond to high‐yield and/or active protein samples), increasing the chances of finding SAV4779 to 1 in 4. However, the absence of dehalogenase activity in the remaining three (which all carry the halide‐binding Trp pair of type I haloalkane dehalogenases) indicates that these features alone are not sufficient to pinpoint haloalkane dehalogenases. While the search may be refined by incorporating residues that line the active site or serve as supplementary halide binders, the low sequence conservation and the possibility of misalignment of true structural equivalents of the more diverse ABH proteins may lead to the dismissal of genuine dehalogenases. Nevertheless, the haloalkane dehalogenase search space could already be greatly reduced just by considering these catalytic residues. The criteria may be further customized to vary their stringency, such as by accommodating functional mutations as demonstrated in (Kennes et al., 1995; Damborsky et al., 1998).
Figure 4.
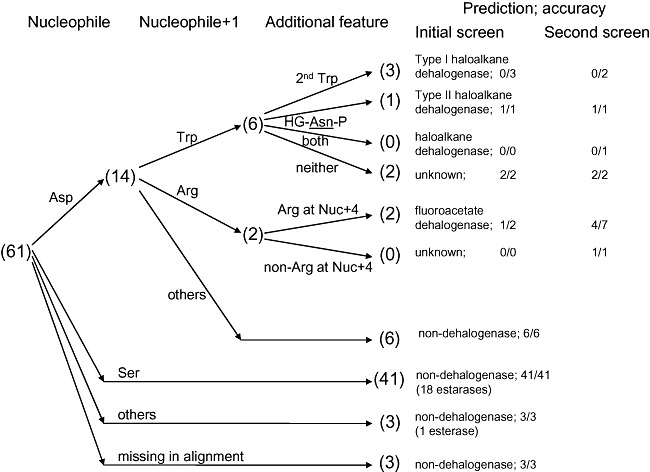
Decision tree for ABH sequences. The selection process for ABH dehalogenases is summarized. For haloalkane dehalogenases, it comprises the Asp nucleophile and a pair of halide‐binding residues. For fluoroacetate dehalogenases, it comprises the Asp nucleophile and a pair of Arg. Numbers in parentheses denote the outcome from the retrospective analysis of targets in the initial screen, accounting only for high‐yield and/or active proteins. Results from the validation screen are also presented.
Applying the Asp nucleophile and the Arg pair at positions nucleophile + 1 and nucleophile + 4 as additional fluoroacetate dehalogenase search criteria to filter the initial list of ABH sequences would have narrowed the list to only 2 of the initial 110 candidates as true potential fluoroacetate dehalogenases, increasing the hit rate for RPA1163 from 1 in 110 to 1 in 2 (Fig. 4). Only PA2086 would be falsely recognized as a potential fluoroacetate dehalogenase among all selected ABH sequences; further investigation should identify additional functionally important residues suitable to refine the search criteria for these enzymes to achieve even higher prediction accuracy.
Applying reliable HAD phosphoryl transferase sequence motifs to filter the initial list of HAD sequences would have narrowed the list to only 6 of the initial 53 candidates (Fig. 5, sum of the last two entries), eliminating the bulk of non‐dehalogenase HAD sequences; only the 42 sequences that correspond to high‐yield and/or active protein samples are shown in Fig. 5. The search space could be further reduced to 5 by dismissing the proteins lacking the Asp nucleophile. Interestingly, all sequences remaining after filtering for phosphoryl transferase sequence motifs emerge as genuine l‐2‐haloacid dehalogenases even before any dehalogenase fingerprints are applied. In principle, one may further screen these sequences using the conserved dehalogenase motifs. However, this may discard novel dehalogenases with undiscovered sequence variations such as the Ala‐Ala‐His oxyanion motif observed in PA0810, RPA2507 and SAV737 (Fig. 3). Therefore, it may be more beneficial to apply the more stringent criteria in cases where a large number of sequences still remain after eliminating the putative phosphoryl transferases.
Figure 5.
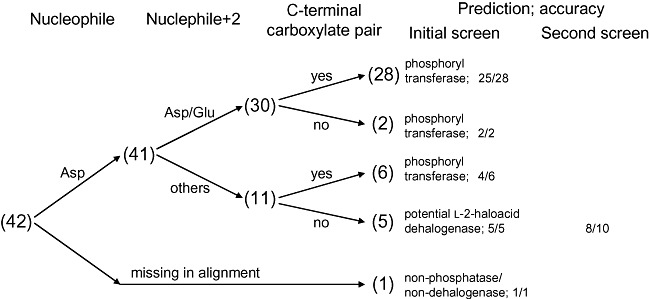
Decision tree for HAD sequences. The selection process for HAD dehalogenases is summarized. The elimination of probable phosphoryl transferases (carrying at least one of the two carboxylate pair motifs) was sufficient for obtaining l‐2‐haloacid dehalogenases with high accuracy. Numbers in parentheses denote the outcome from the retrospective analysis of targets in the initial screen, accounting only for high‐yield and/or active proteins. Results from the second screen are also presented.
Second screen to validate new search criteria
To further demonstrate the effectiveness of the identification criteria developed in this work, they were applied to screen 14 additional microbial genomes. The procedure began with the same BLASTP sequence similarity searches, followed by a screen using some of the identified sequence fingerprints: an Asp nucleophile and a Trp at position nucleophile + 1 for haloalkane dehalogenases; an Asp nucleophile and an Arg at position nucleophile + 1 for fluoroacetate dehalogenases; and the absence of both carboxylate pair motifs for l‐2‐haloacid dehalogenases. This process resulted in 30 candidates, 13 of which showed dehalogenase activity in enzymatic screens (Table 2), comprising 1 haloalkane dehalogenase, 4 fluoroacetate dehalogenases and 8 l‐2‐haloacid dehalogenases. Accounting only for the 24 targets that yielded soluble proteins, the hit rate for haloalkane dehalogenases, fluoroacetate dehalogenases and l‐2‐haloacid dehalogenases were 1 in 6 (Fig. 4, sum of the first four entries), 4 in 8 (Fig. 4, sum of the fifth and sixth entries) and 8 in 10 (Fig. 5), respectively. This trend resembles that of the retrospective sequence screens, where the accuracy improves significantly from haloalkane dehalogenases (Table S5) to fluoroacetate dehalogenases (Table S6) to l‐2‐haloacid dehalogenases.
Novel defluorinating l ‐2‐haloacid dehalogenases in the HAD superfamily
Intriguingly, 4 novel l‐2‐haloacid dehalogenases (Adeh3811, Bpro0530, Bpro4516 and RHA1_ro00230) were able to hydrolyse fluoroacetate. This is the first report of HAD dehalogenases with such capabilities, as the direct hydrolytic cleavage of the aliphatic carbon‐fluorine bond was previously thought to be exclusive to the fluoroacetate dehalogenases of the ABH superfamily. With respect to sequence similarities, the HAD defluorinases did not appear to be distinct from the non‐defluorinating HAD members (Table S7). Investigations are currently underway to elucidate their structural features that enable defluorination.
Evaluation of _E_‐values obtained from BLASTP
This work has developed sequence screening procedures for reliably discriminating against non‐dehalogenases. Obviously, however, dehalogenases can only be discovered if they exist within the genomes of interest. _E_‐values measure the statistical significance of the hits returned in a BLASTP search and are calculated from their overall sequence similarity with query sequences. They were thus examined in an attempt to identify prominent signs that may indicate the presence of dehalogenases within a list of BLASTP results. A detailed discussion is presented in Supporting Information.
In the genome‐wide BLASTP searches for haloalkane dehalogenases, the true positives possessed highly significant _E_‐values (less than 10−60) compared with proteins that were inactive against the screening substrates (greater than 10−25) (Fig. 6A). This suggests that _E_‐values may serve as reliable indicators for the activity of these enzymes.
Figure 6.
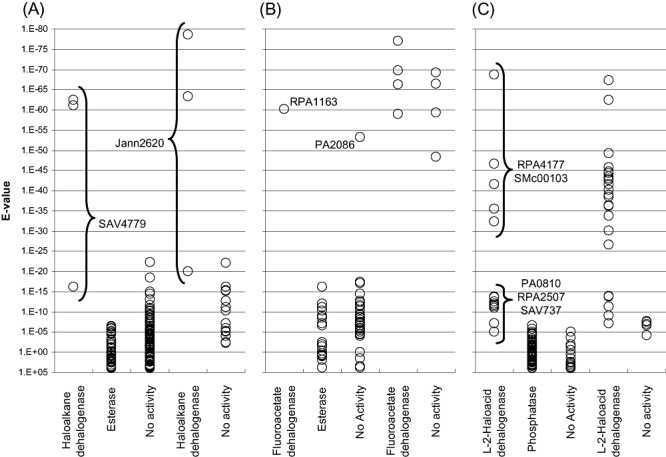
_E_‐value analyses of selected targets. The _E_‐values of the target genes were categorized by their identified enzymatic activity (_x_‐axis label). In each panel, the first three columns contain _E_‐values from the initial screen and the last two columns display results from the second screen. A. ABH sequences searched by haloalkane dehalogenases DhlA, LinB and DhaA. B. ABH targets obtained from the fluoroacetate dehalogenase DehH1. C. HAD targets retrieved using l‐2‐haloacid dehalogenases DhlB, HadL and DehH2. The _E_‐values of the dehalogenases are generally much smaller than those of the non‐dehalogenases. However, in the fluoroacetate dehalogenase searches (B), 5 non‐dehalogenases (PA2086 from the initial screen and 4 proteins from the validation screen) emerged with significant _E_‐values that are comparable to the active enzymes. Moreover, in the l‐2‐haloacid dehalogenase searches (C), 5 dehalogenases (3 initial targets and 2 validation targets) were retrieved at considerably less significant _E_‐values. These sequences were also the best hits within that particular BLASTP search. The _E_‐values distribution among the HAD dehalogenases suggests that there are at least two subtypes differing in overall protein sequence.
In the fluoroacetate dehalogenase searches, the _E_‐values were also clearly divided into two clusters: they were either highly significant (smaller than 10−45), or much less significant (larger than 10−20) (Fig. 6B). All five identified fluoroacetate dehalogenases belong to the former group. However, an additional five proteins with similar _E_‐values were inactive on the tested haloacetates. Meeting the very small _E_‐value requirement thus appears to be necessary but not sufficient for confirming the presence of fluoroacetate dehalogenases in microbial genomes.
In the l‐2‐haloacid dehalogenase searches, 8 of the confirmed enzymes possessed highly significant _E_‐values (less than 10−25) while the remaining 5 had _E_‐values (from 10−14 to 10−5) that were only marginally smaller than those of the non‐dehalogenases (Fig. 6C). Such _E_‐value distribution suggests that there are at least two sequence subfamilies among the HAD dehalogenases, which appears to correlate with their oxyanion hole motifs (Ser‐Ser‐Asn versus Ala‐Ala‐His). However, the _E_‐values of the four defluorinating members are not distinct from those of the non‐defluorinating members. Taken together, our results show that _E_‐values may serve as reliable indicators for detecting l‐2‐haloacid dehalogenases, and the analyses should be made using sequences from different subfamilies as search query.
Dehalogenase kinetics
The kinetic parameters for several dehalogenases were determined for comparison with previously characterized enzymes (Table 4). The novel fluoroacetate dehalogenases displayed significantly lower maximum specific activity for both fluoroacetate and chloroacetate, compared with DehH1 and FAc‐Dex FA1. However, the substrate affinity constants (_K_M) for fluoroacetate of RPA1163 and FAc‐Dex FA1 were of the same order of magnitude.
Table 4.
Quantitative dehalogenase activity assays.
| Enzyme | Substrates | |||||||
|---|---|---|---|---|---|---|---|---|
| Fluoroacetate | Chloroacetate | |||||||
| Specific activity (µmol min−1 mg−1) | _K_M (µM) | Note | Specific activity (µmol min−1 mg−1) | _K_M (µM) | _K_i (mM) | Note | Relative rate | |
| ClAc/FAc | ||||||||
| Fluoroacetate dehalogenase | ||||||||
| RPA1163 | (1) | 0.20 ± 0.01 | 3 300 ± 200 | a,f | 0.041 ± 0.002 | 1 400 ± 400 | a,f | 0.21 |
| Alr0039 | (2) | 0.108 ± 0.008 | n.d. | c,d,e | 0.12 | n.d. | c,d,e | 1.1 |
| Bcen2424–2964 | (2) | 0.102 ± 0.008 | n.d. | c,d,e | n.d. | n.d. | ||
| Bpro4478 | (2) | 0.38 ± 0.04 | n.d. | c,d,e | 0.041 | n.d. | c,d,e | 0.11 |
| DehH1 | 86.40 | p | 18 | p | 0.21 | |||
| FAc‐DexFA1 | 11.00 | 5 100 | q | 0.43 | q | 0.04 | ||
| L‐2‐haloacid dehalogenase | ||||||||
| RPA4199 | (1) | n.a. | 25 | 28 | 1 | a,f | ||
| SMc00103 | (1) | n.a. | 52 | 88 | 40 | b,g | ||
| 9.8 | 17 | b,g,z | ||||||
| Adeh3811 | (2) | 0.401 ± 0.008 | 13 500 ± 300 | a,f | 25 ± 3 | 10 ± 4 | c,j | 62 |
| Bcen2424–2051 | (2) | n.a. | 12.0 ± 0.3 | 17 ± 2 | c,f | |||
| Jann1658 | (2) | n.a. | 10 ± 3 | 7 ± 4 | c,g | |||
| Bpro0530 | (2) | 0.48 ± 0.06 | n.d. | c,d,e | 29 ± 1 | 4 ± 1 | c,f | 61 |
| Bpro4516 | (2) | 0.16 ± 0.02 | 19 000 ± 2000 | a,f | 64 ± 4 | 11 ± 2 | c,h | 400 |
| RSc1362 | (2) | n.a. | 100 ± 10 | 34 ± 9 | c,i | |||
| RHA1_ro00230 | (2) | 0.678 ± 0.004 | 20 000 ± 2000 | a,f | 1.5 ± 0.2 | 19 000 ± 2000 | a,f | 2.2 |
| DhlB | n.a. | 55.5 | r | |||||
| LDexYL | n.a. | 78 | 1 100 | s |
The specific activities of the novel l‐2‐haloacid dehalogenases towards chloroacetate, which ranged from 1.5 to 100 µmol min−1 per mg of protein, were comparable to those of the previously studied family members. The _K_M values for chloroacetate were generally in the µM range. For those that exhibited the novel defluorination capability, a strong preference (i.e. higher specific activity as well as lower _K_M) for chloroacetate hydrolysis was generally observed. Compared with the novel ABH fluoroacetate dehalogenases, these novel HAD defluorinases possessed a much higher _K_M for fluoroacetate even though their maximum specific activities were in the same order of magnitude (Table 4).
Conclusions
This work has significantly increased the sequence pool of microbial hydrolytic dehalogenases through the biochemical confirmation of 20 novel dehalogenases from diverse organisms. The discovery of four HAD defluorinases highlights the importance of carrying out broader functional screens to mine natural diversity. Additionally, the identification of numerous esterases and phosphatases should assist genomic annotations of sequences in the ABH and HAD superfamilies. Most importantly, the developed sequence‐based selection methods will facilitate the identification of hydrolytic dehalogenases from these superfamilies of proteins. These findings will accelerate the discovery of novel and potentially more powerful dehalogenases from the rapidly expanding genome sequence database. Knowledge of the ability and diversity of dehalogenating enzymes is vital for developing effective detoxification methods at organohalogen‐contaminated sites, and for guiding regulations for industrial production and use of organohalogens.
Experimental procedures
Strains, reagents and chemicals
The bacterial strains and genomic DNA were either purchased from ATCC (Manassas, VA) or obtained directly from research laboratories. The PCR primers were synthesized by Integrated DNA Technologies (Coralville, IA). Terrific Broth pellets were purchased from EMD Chemicals (Gibbstown, NJ) and the Bradford assay reagent from Bio‐Rad (Hercules, CA). Lysozyme, proteinase K, agarose, glycerol, ampicillin, kanamycin, SDS and IPTG were obtained from BioShop (Burlington, ON, Canada) and all other chemicals from Sigma‐Aldrich (St. Louis, MO). Ni‐NTA resin and the QIAquick PCR Purification Kit were purchased from Qiagen (Mississauga, ON, Canada), the In‐Fusion PCR Cloning Kit was purchased from Clontech (Palo Alto, CA). All chemicals were of the highest grade commercially available and all concentrations reported were the final concentrations in the reaction mixtures unless stated otherwise. The commercially available kits were used according to the manufacturers' instructions.
Target selection
In the initial screening study, five microbial genomes were screened for dehalogenase sequences: Pseudomonas aeruginosa PAO1, Pseudomonas putida KT2440, Rhodopseudomonas palustris CGA009, Streptomyces avermitilis MA‐4680 and Sinorhizobium meliloti 1021 (chromosomal genes only). The selected gene loci were prefixed by PA, PP, RPA, SAV and SMc respectively. The following dehalogenases were used as BLASTP (Altschul et al., 1990) search queries for each superfamily against the UniProt Knowledgebase: the ABH superfamily was searched with the haloalkane dehalogenases DhlA (UniProt accession number: P22643), LinB (P51698) and DhaA (P59336) and the fluoroacetate dehalogenase DehH1 (Q01398); and the HAD superfamily with the l‐2‐haloacid dehalogenases DhlB (Q60099), HadL (Q52087) and DehH2 (Q01399). The _E_‐value cut‐offs ranged from 10−3 to 10−1 depending on the overall alignment quality. An additional text search in the PEDANT database (Walter et al., 2009) was performed using ‘haloalkane dehalogenase’, ‘haloacetate dehalogenase’ and ‘haloacid dehalogenase’ to append several more distantly related superfamily members to the activity screens. The target list of the initial screen, including the selection parameters, is found in Tables S1A and S2A.
In the second screening study, the following 14 genomes were screened and the parenthesized codes denote the gene loci prefixes: Anabaena sp. PCC7120 (Alr or All), Anaeromyxobacter dehalogenans 2CP‐C (Adeh), Azotobacter vinelandii AvOP (AvinDRAFT), Burkholderia cenocepacia HI2424 (Bcen2424), Burkholderia vietnamiensis G4 (Bcep1808), Chromohalobacter salexigens DSM3043 (Csal), Dechloromonas aromatica RCB (Daro), Jannaschia sp. CCS1 (Jann), Polaromonas sp. JS666 (Bpro), Pseudomonas fluorescens Pf‐5 (PFL), Ralstonia eutropha JMP134 (Reut_A), Ralstonia solanacearum GMI1000 (RSc), Rhodococcus sp. RHA1 (RHA1_ro) and Streptomyces coelicolor A3(2) (SCO). The BLASTP searches employed the same queries as the initial screen, but the resulting sequences were filtered using the refined criteria developed herein. Not all potential candidates were selected; the 30 targets that were chosen are listed in Table S1B and S2B.
Cloning, overexpression and purification of selected targets
The target genes were amplified by PCR using primers carrying 5′‐overhangs (5′‐TTG‐TAT‐TTC‐CAG‐GGC‐3′ on the sense and 5′‐CAA‐GCT‐TCG‐TCA‐TCA‐3′ on the antisense primer) and cloned into a modified pET‐15b vector (Novagen, Madison, WI) (Zhang et al., 2001). Protein purification was carried out as described (Zhang et al., 2001), with the following modifications: overexpression in Terrific Broth was induced with 1 mM IPTG when OD600 reached approximately 1.2; no NP‐40, PMSF and benzamidine were added; the centrifugal supernatant was directly passed through the Ni‐NTA resin, washed with 300 ml of buffer containing 25 mM imidazole and eluted with the same buffer containing 250 mM imidazole; excision of the His6‐tag by the tobacco etch virus protease and the second pass through the Ni‐NTA resin were omitted. The purified proteins were concentrated, flash frozen as beads in liquid nitrogen, and stored at −80°C.
Enzymatic screening assays
Screening was performed using 20 µg of protein in a 200 µl volume at 30°C using 96‐well plates. All proteins were assayed twice. The assays were carried out as described (Holloway et al., 1998; Kuznetsova et al., 2005); they are summarized below.
The dehalogenase activity screen employed the following organohalogens as substrates: 1,2‐dichloroethane, 1,3‐dichloropropane, chlorocyclohexane, 1,2‐dibromoethane, fluoroacetate, chloroacetate, _S‐_2‐chloropropionate and bromoacetate. The reaction mixture was buffered at pH 7.0 using 1 mM HEPES. Detection was based on a pH decrease when hydrohalic acid is produced from the halogenated substrates (Holloway et al., 1998), and the colour transition of the pH indicator phenol red (from pink to orange to yellow) was monitored visually.
Two separate assays were developed in our laboratories to test for general esterase activity (Kuznetsova et al., 2005): one uses _p_‐nitrophenyl palmitate (pNP‐palmitate) to identify carboxylesterases, lipases and certain thioesterases through the release of _p_‐nitrophenolate (pNP) detected by absorbance at 405 nm; the other uses palmitoyl‐coenzyme A to identify thioester‐specific esterases and certain carboxylesterases through the reaction between the released coenzyme A and Ellman's reagent monitored by absorbance at 412 nm.
The general phosphatase assay also developed in our laboratories uses _p_‐nitrophenyl phosphate (pNPP) in the presence of divalent cations (either 5 mM Mg2+ alone or a cocktail containing 5 mM Mg2+ and 0.5 mM each of Co2+, Mn2+ and Ni2+) (Kuznetsova et al., 2005). The hydrolytic activity is detected through the release of pNP by measuring the absorbance at 405 nm.
Dehalogenase activity was determined by visual inspection. All other activities were quantified spectrophotometrically 3 and 24 h after initiating the reaction using the plate reader SpectraMax M5 (Molecular Devices, Sunnyvale, CA). The absorbance values were converted into ratios by dividing them with the absorbance value of the control without enzyme.
Quantitative dehalogenase assays
Dehalogenase activity was confirmed and quantified using alternative techniques for a number of novel dehalogenases. The reaction was performed in 100 mM of different buffers as listed in Table 4. Turnover at 30°C was detected through either halide release (by spectrophotometry (Iwasaki et al., 1952) or ion chromatography coupled with conductivity) or reaction enthalpy (i.e. calorimetry) (Todd and Gomez, 2001). The steady‐state kinetic parameters were extracted by non‐linear regression using the software package GraphPad Prism (GraphPad Software Inc., La Jolla, CA). The procedures are described in detail in Supporting Information.
Sequence alignments
The sequences within an activity group were aligned using the CLUSTAL algorithm (Thompson et al., 1994) in the Biology Workbench at the San Diego Supercomputer Center (http://workbench.sdsc.edu/) (Subramaniam, 1998), with the default parameters. Manual adjustments were made for sequences that did not align properly due to insertions or deletions of large stretches of sequence. Comparisons between different sequence groups within the same protein families were made by using the profile alignment function in the Biology Workbench.
_E_‐value analyses
For each category of BLASTP search (e.g. the search for haloalkane dehalogenases), the retrieved sequences were grouped according to their measured activities (e.g. dehalogenase, esterase or no activity) and their corresponding _E_‐values were plotted. The _E_‐values from the first and second screen were analysed separately. For target genes possessing several _E_‐values (because they could be retrieved by multiple search queries), all _E_‐values were plotted individually without averaging. Targets with low protein yield that displayed no activity were excluded from this analysis because it was not known whether the inactivity was genuine, or caused by insufficient amounts of protein assayed.
Acknowledgments
We gratefully acknowledge support from the National Science and Engineering Research Council – Strategic Grant Program for this project. We thank the following scientists for kindly providing us with the respective bacterial strains or genomic DNA: Thomas Beatty (University of British Columbia) for Rhodopseudomonas palustris CGA009; Turlough Finan (McMaster University) for Sinorhizobium meliloti 1021; Stephanie Curtis (North Carolina State University) for Anabaena sp. PCC7120; Robert Sanford (University of Illinois) and Frank Löffler (Georgia Institute of Technology) for Anaeromyxobacter dehalogenans 2CP‐C; Christina Kennedy (University of Arizona) for Azotobacter vinelandii AvOP; James Tiedje (Michigan State University) for Burkholderia cenocepacia HI2424 and Burkholderia vietnamiensis G4; Kathleen O'Connor (Purdue University) for Chromohalobacter salexigens DSM3043; John Coates (University of California) for Dechloromonas aromatica RCB; Mary Ann Moran (University of Georgia) for Jannaschia sp. CCS1; James Gossett (Cornell University) for Polaromonas sp. JS666; Alejandro Rooney (United States Department of Agriculture) for Pseudomonas fluorescens Pf‐5; Roberta Fulthorpe (University of Toronto) for Ralstonia eutropha JMP134; Christian Boucher (Institut National de la Recherche Agronomique) for Ralstonia solanacearum GMI1000; Lindsay Eltis and William Mohn (University of British Columbia) for Rhodococcus sp. RHA1 and David Hopwood (Norwich Research Park) for Streptomyces coelicolor A3(2). We also acknowledge the Structural Genomics Consortium (Toronto, ON, Canada), Greg Brown, Yuriy Korniyenko, Ekaterina Kuznetsova and Mike Proudfoot for their technical assistance.
Supporting Information
Additional Supporting Information may be found in the online version of this article:
Fig. S1. Representative SDS-PAGE analysis of P. aeruginosa protein targets.
The target proteins in well-expressed and soluble samples appear as large round patches on the gel (e.g. lanes C8, C10, A8 and C6). By inspection, the purity of these high-yield samples is generally above 75%. For samples that are poorly expressed or insoluble, a large number of expression host protein bands are detected. In such cases (e.g. lanes E1, E2, E5 and E7), the protein purity is approximately 35% at best. The identifiable target protein bands in low-yield samples have been circled. MW denotes molecular weight of the standards in kDa.
Fig. S2. Representative data in carboxylesterase and thioesterase screens.
The upper and lower panels display representative data from the carboxylesterase and thioesterase screens respectively. Absorbance was measured 3 h (light bars) and 24 h (dark bars) after initiation of the reaction. Data from the 24-hour time point for the carboxylesterase screen was not interpretable due to high backgrounds. The dashed lines mark the cut-off used for confirming activities.
Table S1. All ABH superfamily targets selected for biochemical characterization.
Table S2. All HAD superfamily targets selected for biochemical characterization.
Table S3. Cloning and purification results.
Table S4. Summary of cloning and purification results.
Table S5. Sequence identity and similarity of all predicted haloalkane dehalogenases.
Table S6. Sequence identity and similarity of all predicted fluoroacetate dehalogenases.
Table S7. Sequence identity and similarity of all predicted L-2-haloacid dehalogenases.
Please note: Wiley-Blackwell are not responsible for the content or functionality of any supporting materials supplied by the authors. Any queries (other than missing material) should be directed to the corresponding author for the article.
References
- Allen K.N., Dunaway‐Mariano D. Phosphoryl group transfer: evolution of a catalytic scaffold. Trends Biochem Sci. 2004;29:495–503. doi: 10.1016/j.tibs.2004.07.008. [DOI] [PubMed] [Google Scholar]
- Altschul S.F., Gish W., Miller W., Myers E.W., Lipman D.J. Basic local alignment search tool. J Mol Biol. 1990;215:403–410. doi: 10.1016/S0022-2836(05)80360-2. [DOI] [PubMed] [Google Scholar]
- Barth P.T., Bolton L., Thomson J.C. Cloning and partial sequencing of an operon encoding two Pseudomonas putida haloalkanoate dehalogenases of opposite stereospecificity. J Bacteriol. 1992;174:2612–2619. doi: 10.1128/jb.174.8.2612-2619.1992. [DOI] [PMC free article] [PubMed] [Google Scholar]
- Benning M.M., Taylor K.L., Liu R.Q., Yang G., Xiang H., Wesenberg G. Structure of 4‐chlorobenzoyl coenzyme A dehalogenase determined to 1.8 A resolution: an enzyme catalyst generated via adaptive mutation. Biochemistry. 1996;35:8103–8109. doi: 10.1021/bi960768p. et al. [DOI] [PubMed] [Google Scholar]
- Brokamp A., Happe B., Schmidt F.R. Cloning and nucleotide sequence of a D,L‐haloalkanoic acid dehalogenase encoding gene from Alcaligenes xylosoxidans ssp. denitrificans ABIV. Biodegradation. 1996;7:383–396. doi: 10.1007/BF00056422. [DOI] [PubMed] [Google Scholar]
- Burroughs A.M., Allen K.N., Dunaway‐Mariano D., Aravind L. Evolutionary genomics of the HAD superfamily: understanding the structural adaptations and catalytic diversity in a superfamily of phosphoesterases and allied enzymes. J Mol Biol. 2006;361:1003–1034. doi: 10.1016/j.jmb.2006.06.049. [DOI] [PubMed] [Google Scholar]
- Cairns S.S., Cornish A., Cooper R.A. Cloning, sequencing and expression in Escherichia coli of two Rhizobium sp. genes encoding haloalkanoate dehalogenases of opposite stereospecificity. Eur J Biochem. 1996;235:744–749. doi: 10.1111/j.1432-1033.1996.t01-1-00744.x. [DOI] [PubMed] [Google Scholar]
- Chae J.C., Kim Y., Min K.H., Kim Y.C., Kim C.K. Cloning and sequencing of the fcbB gene encoding 4‐chlorobenzoate‐coenzyme A dehalogenase from Pseudomonas sp. DJ‐12. Mol Cells. 1999;9:225–229. [PubMed] [Google Scholar]
- Damborsky J., Bohac M., Prokop M., Kuty M., Koca J. Computational site‐directed mutagenesis of haloalkane dehalogenase in position 172. Protein Eng. 1998;11:901–907. doi: 10.1093/protein/11.10.901. [DOI] [PubMed] [Google Scholar]
- Fetzner S., Lingens F. Bacterial dehalogenases: biochemistry, genetics, and biotechnological applications. Microbiol Rev. 1994;58:641–685. doi: 10.1128/mr.58.4.641-685.1994. [DOI] [PMC free article] [PubMed] [Google Scholar]
- Hasan A.K.M.Q., Takada H., Esaki N., Soda K. Catalytic action of L‐2‐halo acid dehalogenase on long‐chain L‐2‐haloalkanoic acids in organic solvents. Biotechnol Bioeng. 1991;38:1114–1117. doi: 10.1002/bit.260380921. [DOI] [PubMed] [Google Scholar]
- Heikinheimo P., Goldman A., Jeffries C., Ollis D.L. Of barn owls and bankers: a lush variety of alpha/beta hydrolases. Structure. 1999;7:R141–R146. doi: 10.1016/s0969-2126(99)80079-3. [DOI] [PubMed] [Google Scholar]
- Hill K.E., Marchesi J.R., Weightman A.J. Investigation of two evolutionarily unrelated halocarboxylic acid dehalogenase gene families. J Bacteriol. 1999;181:2535–2547. doi: 10.1128/jb.181.8.2535-2547.1999. [DOI] [PMC free article] [PubMed] [Google Scholar]
- Holloway P., Trevors J.T., Lee H. A colorimetric assay for detecting haloalkane dehalogenase activity. J Microbiol Methods. 1998;32:31–36. [Google Scholar]
- Holmquist M. Alpha/beta‐hydrolase fold enzymes: structures, functions and mechanisms. Curr Protein Pept Sci. 2000;1:209–235. doi: 10.2174/1389203003381405. [DOI] [PubMed] [Google Scholar]
- Iwasaki I., Utsumi S., Ozawa T. New colorimetric determination of chloride using mercuric thiocyanate and ferric ion. Bull Chem Soc Jpn. 1952;25:226. [Google Scholar]
- Jesenska A., Bartos M., Czernekova V., Rychlik I., Pavlik I., Damborsky J. Cloning and expression of the haloalkane dehalogenase gene dhmA from Mycobacterium avium N85 and preliminary characterization of DhmA. Appl Environ Microbiol. 2002;68:3724–3730. doi: 10.1128/AEM.68.8.3724-3730.2002. [DOI] [PMC free article] [PubMed] [Google Scholar]
- Jesenska A., Pavlova M., Strouhal M., Chaloupkova R., Tesinska I., Monincova M. Cloning, biochemical properties, and distribution of mycobacterial haloalkane dehalogenases. Appl Environ Microbiol. 2005;71:6736–6745. doi: 10.1128/AEM.71.11.6736-6745.2005. et al. [DOI] [PMC free article] [PubMed] [Google Scholar]
- Jones D.H., Barth P.T., Byrom D., Thomas C.M. Nucleotide sequence of the structural gene encoding a 2‐haloalkanoic acid dehalogenase of Pseudomonas putida strain AJ1 and purification of the encoded protein. J Gen Microbiol. 1992;138:675–683. doi: 10.1099/00221287-138-4-675. [DOI] [PubMed] [Google Scholar]
- De Jong R.M., Dijkstra B.W. Structure and mechanism of bacterial dehalogenases: different ways to cleave a carbon‐halogen bond. Curr Opin Struct Biol. 2003;13:722–730. doi: 10.1016/j.sbi.2003.10.009. [DOI] [PubMed] [Google Scholar]
- De Jong R.M., Brugman W., Poelarends G.J., Whitman C.P., Dijkstra B.W. The X‐ray structure of trans‐3‐chloroacrylic acid dehalogenase reveals a novel hydration mechanism in the tautomerase superfamily. J Biol Chem. 2004;279:11546–11552. doi: 10.1074/jbc.M311966200. [DOI] [PubMed] [Google Scholar]
- De Jong R.M., Bazzacco P., Poelarends G.J., Johnson W.H., Jr, Kim Y.J., Burks E.A. Crystal structures of native and inactivated cis‐3‐chloroacrylic acid dehalogenase. Structural basis for substrate specificity and inactivation by (R)‐oxirane‐2‐carboxylate. J Biol Chem. 2007;282:2440–2449. doi: 10.1074/jbc.M608134200. et al. [DOI] [PubMed] [Google Scholar]
- Kawasaki H., Tsuda K., Matsushita I., Tonomura K. Lack of homology between two haloacetate dehalogenase genes encoded on a plasmid from Moraxella sp. strain B. J Gen Microbiol. 1992;138:1317–1323. doi: 10.1099/00221287-138-7-1317. [DOI] [PubMed] [Google Scholar]
- Kawasaki H., Toyama T., Maeda T., Nishino H., Tonomura K. Cloning and sequence analysis of a plasmid‐encoded 2‐haloacid dehalogenase gene from Pseudomonas putida No. 109. Biosci Biotechnol Biochem. 1994;58:160–163. doi: 10.1271/bbb.58.160. [DOI] [PubMed] [Google Scholar]
- Kennes C., Pries F., Krooshof G.H., Bokma E., Kingma J., Janssen D.B. Replacement of tryptophan residues in haloalkane dehalogenase reduces halide binding and catalytic activity. Eur J Biochem. 1995;228:403–407. [PubMed] [Google Scholar]
- Keuning S., Janssen D.B., Witholt B. Purification and characterization of hydrolytic haloalkane dehalogenase from Xanthobacter autotrophicus GJ10. J Bacteriol. 1985;163:635–639. doi: 10.1128/jb.163.2.635-639.1985. [DOI] [PMC free article] [PubMed] [Google Scholar]
- Kmunicek J., Hynkova K., Jedlicka T., Nagata Y., Negri A., Gago F. Quantitative analysis of substrate specificity of haloalkane dehalogenase LinB from Sphingomonas paucimobilis UT26. Biochemistry. 2005;44:3390–3401. doi: 10.1021/bi047912o. et al. [DOI] [PubMed] [Google Scholar]
- Koonin E.V., Tatusov R.L. Computer analysis of bacterial haloacid dehalogenases defines a large superfamily of hydrolases with diverse specificity. Application of an iterative approach to database search. J Mol Biol. 1994;244:125–132. doi: 10.1006/jmbi.1994.1711. [DOI] [PubMed] [Google Scholar]
- Kurihara T., Liu J.Q., Nardi‐Dei V., Koshikawa H., Esaki N., Soda K. Comprehensive site‐directed mutagenesis of L‐2‐halo acid dehalogenase to probe catalytic amino acid residues. J Biochem (Tokyo) 1995;117:1317–1322. doi: 10.1093/oxfordjournals.jbchem.a124861. [DOI] [PubMed] [Google Scholar]
- Kurihara T., Yamauchi T., Ichiyama S., Takahata H., Esaki N. Purification, characterization, and gene cloning of a novel fluoroacetate dehalogenase from Burkholderia sp. FA1. J Mol Catal B Enzym. 2003;23:347–355. [Google Scholar]
- Kuznetsova E., Proudfoot M., Sanders S.A., Reinking J., Savchenko A., Arrowsmith C.H. Enzyme genomics: application of general enzymatic screens to discover new enzymes. FEMS Microbiol Rev. 2005;29:263–279. doi: 10.1016/j.femsre.2004.12.006. et al. [DOI] [PubMed] [Google Scholar]
- Kuznetsova E., Proudfoot M., Gonzalez C.F., Brown G., Omelchenko M.V., Borozan I. Genome‐wide analysis of substrate specificities of the Escherichia coli haloacid dehalogenase‐like phosphatase family. J Biol Chem. 2006;281:36149–36161. doi: 10.1074/jbc.M605449200. et al. [DOI] [PubMed] [Google Scholar]
- Liu J.Q., Kurihara T., Hasan A.K., Nardi‐Dei V., Koshikawa H., Esaki N., Soda K. Purification and characterization of thermostable and nonthermostable 2‐haloacid dehalogenases with different stereospecificities from Pseudomonas sp. strain YL. Appl Environ Microbiol. 1994;60:2389–2393. doi: 10.1128/aem.60.7.2389-2393.1994. [DOI] [PMC free article] [PubMed] [Google Scholar]
- Liu J.Q., Kurihara T., Ichiyama S., Miyagi M., Tsunasawa S., Kawasaki H. Reaction mechanism of fluoroacetate dehalogenase from Moraxella sp. B. J Biol Chem. 1998;273:30897–30902. doi: 10.1074/jbc.273.47.30897. et al. [DOI] [PubMed] [Google Scholar]
- Murdiyatmo U., Asmara W., Tsang J.S., Baines A.J., Bull A.T., Hardman D.J. Molecular biology of the 2‐haloacid halidohydrolase IVa from Pseudomonas cepacia MBA4. Biochem J. 1992;284:87–93. doi: 10.1042/bj2840087. [DOI] [PMC free article] [PubMed] [Google Scholar]
- Nardi‐Dei V., Kurihara T., Park C., Esaki N., Soda K. Bacterial D,L‐2‐haloacid dehalogenase from Pseudomonas sp. strain 113: gene cloning and structural comparison with D‐ and L‐2‐haloacid dehalogenases. J Bacteriol. 1997;179:4232–4238. doi: 10.1128/jb.179.13.4232-4238.1997. [DOI] [PMC free article] [PubMed] [Google Scholar]
- Nardini M., Dijkstra B.W. Alpha/beta hydrolase fold enzymes: the family keeps growing. Curr Opin Struct Biol. 1999;9:732–737. doi: 10.1016/s0959-440x(99)00037-8. [DOI] [PubMed] [Google Scholar]
- Newman J., Peat T.S., Richard R., Kan L., Swanson P.E., Affholter J.A. Haloalkane dehalogenases: structure of a Rhodococcus enzyme. Biochemistry. 1999;38:16105–16114. doi: 10.1021/bi9913855. et al. [DOI] [PubMed] [Google Scholar]
- Van Der Ploeg J., Van Hall G., Janssen D.B. Characterization of the haloacid dehalogenase from Xanthobacter autotrophicus GJ10 and sequencing of the dhlB gene. J Bacteriol. 1991;173:7925–7933. doi: 10.1128/jb.173.24.7925-7933.1991. [DOI] [PMC free article] [PubMed] [Google Scholar]
- Pries F., Wijngaard A.J., Bos R., Pentenga M., Janssen D.B. The role of spontaneous cap domain mutations in haloalkane dehalogenase specificity and evolution. J Biol Chem. 1994;269:17490–17494. [PubMed] [Google Scholar]
- Prudnikova T., Mozga T., Rezacova P., Chaloupkova R., Sato Y., Nagata Y. Crystallization and preliminary X‐ray analysis of a novel haloalkane dehalogenase DbeA from Bradyrhizobium elkani USDA94. Acta Crystallogr Sect F Struct Biol Cryst Commun. 2009;65:353–356. doi: 10.1107/S1744309109007039. et al. [DOI] [PMC free article] [PubMed] [Google Scholar]
- Rye C.A., Isupov M.N., Lebedev A.A., Littlechild J.A. Biochemical and structural studies of a L‐haloacid dehalogenase from the thermophilic archaeon Sulfolobus tokodaii. Extremophiles. 2009;13:179–190. doi: 10.1007/s00792-008-0208-0. [DOI] [PubMed] [Google Scholar]
- Sato Y., Monincova M., Chaloupkova R., Prokop Z., Ohtsubo Y., Minamisawa K. Two rhizobial strains, Mesorhizobium loti MAFF303099 and Bradyrhizobium japonicum USDA110, encode haloalkane dehalogenases with novel structures and substrate specificities. Appl Environ Microbiol. 2005;71:4372–4379. doi: 10.1128/AEM.71.8.4372-4379.2005. et al. [DOI] [PMC free article] [PubMed] [Google Scholar]
- Schmidberger J.W., Wilce J.A., Tsang J.S., Wilce M.C. Crystal structures of the substrate free‐enzyme, and reaction intermediate of the HAD superfamily member, haloacid dehalogenase DehIVa from Burkholderia cepacia MBA4. J Mol Biol. 2007;368:706–717. doi: 10.1016/j.jmb.2007.02.015. [DOI] [PubMed] [Google Scholar]
- Schmitz A., Gartemann K.H., Fiedler J., Grund E., Eichenlaub R. Cloning and sequence analysis of genes for dehalogenation of 4‐chlorobenzoate from Arthrobacter sp. strain SU. Appl Environ Microbiol. 1992;58:4068–4071. doi: 10.1128/aem.58.12.4068-4071.1992. [DOI] [PMC free article] [PubMed] [Google Scholar]
- Schneider B., Muller R., Frank R., Lingens F. Complete nucleotide sequences and comparison of the structural genes of two 2‐haloalkanoic acid dehalogenases from Pseudomonas sp. strain CBS3. J Bacteriol. 1991;173:1530–1535. doi: 10.1128/jb.173.4.1530-1535.1991. [DOI] [PMC free article] [PubMed] [Google Scholar]
- Stringfellow J.M., Cairns S.S., Cornish A., Cooper R.A. Haloalkanoate dehalogenase II (DehE) of a Rhizobium sp. – molecular analysis of the gene and formation of carbon monoxide from trihaloacetate by the enzyme. Eur J Biochem. 1997;250:789–793. doi: 10.1111/j.1432-1033.1997.00789.x. [DOI] [PubMed] [Google Scholar]
- Subramaniam S. The Biology Workbench – a seamless database and analysis environment for the biologist. Proteins. 1998;32:1–2. [PubMed] [Google Scholar]
- Swanson P.E. Dehalogenases applied to industrial‐scale biocatalysis. Curr Opin Biotechnol. 1999;10:365–369. doi: 10.1016/S0958-1669(99)80066-4. [DOI] [PubMed] [Google Scholar]
- Thompson J.D., Higgins D.G., Gibson T.J. CLUSTAL W: improving the sensitivity of progressive multiple sequence alignment through sequence weighting, position‐specific gap penalties and weight matrix choice. Nucleic Acids Res. 1994;22:4673–4680. doi: 10.1093/nar/22.22.4673. [DOI] [PMC free article] [PubMed] [Google Scholar]
- Todd M.J., Gomez J. Enzyme kinetics determined using calorimetry: a general assay for enzyme activity? Anal Biochem. 2001;296:179–187. doi: 10.1006/abio.2001.5218. [DOI] [PubMed] [Google Scholar]
- Verschueren K.H., Seljee F., Rozeboom H.J., Kalk K.H., Dijkstra B.W. Crystallographic analysis of the catalytic mechanism of haloalkane dehalogenase. Nature. 1993;363:693–698. doi: 10.1038/363693a0. [DOI] [PubMed] [Google Scholar]
- Walter M.C., Rattei T., Arnold R., Guldener U., Munsterkotter M., Nenova K. PEDANT covers all complete RefSeq genomes. Nucleic Acids Res. 2009;37:D408–D411. doi: 10.1093/nar/gkn749. et al. [DOI] [PMC free article] [PubMed] [Google Scholar]
- Zhang R.G., Skarina T., Katz J.E., Beasley S., Khachatryan A., Vyas S. Structure of Thermotoga maritima stationary phase survival protein SurE: a novel acid phosphatase. Structure. 2001;9:1095–1106. doi: 10.1016/s0969-2126(01)00675-x. et al. [DOI] [PMC free article] [PubMed] [Google Scholar]
Associated Data
This section collects any data citations, data availability statements, or supplementary materials included in this article.
Supplementary Materials
Fig. S1. Representative SDS-PAGE analysis of P. aeruginosa protein targets.
The target proteins in well-expressed and soluble samples appear as large round patches on the gel (e.g. lanes C8, C10, A8 and C6). By inspection, the purity of these high-yield samples is generally above 75%. For samples that are poorly expressed or insoluble, a large number of expression host protein bands are detected. In such cases (e.g. lanes E1, E2, E5 and E7), the protein purity is approximately 35% at best. The identifiable target protein bands in low-yield samples have been circled. MW denotes molecular weight of the standards in kDa.
Fig. S2. Representative data in carboxylesterase and thioesterase screens.
The upper and lower panels display representative data from the carboxylesterase and thioesterase screens respectively. Absorbance was measured 3 h (light bars) and 24 h (dark bars) after initiation of the reaction. Data from the 24-hour time point for the carboxylesterase screen was not interpretable due to high backgrounds. The dashed lines mark the cut-off used for confirming activities.
Table S1. All ABH superfamily targets selected for biochemical characterization.
Table S2. All HAD superfamily targets selected for biochemical characterization.
Table S3. Cloning and purification results.
Table S4. Summary of cloning and purification results.
Table S5. Sequence identity and similarity of all predicted haloalkane dehalogenases.
Table S6. Sequence identity and similarity of all predicted fluoroacetate dehalogenases.
Table S7. Sequence identity and similarity of all predicted L-2-haloacid dehalogenases.