Nitric Oxide Directly Promotes Vascular Endothelial Insulin Transport (original) (raw)
Abstract
Insulin resistance strongly associates with decreased nitric oxide (NO) bioavailability and endothelial dysfunction. In the vasculature, NO mediates multiple processes that affect insulin delivery, including dilating both resistance and terminal arterioles in skeletal muscle in vivo. However, whether NO directly regulates vascular endothelial cell (EC) insulin uptake and its transendothelial transport (TET) is unknown. We report in this article that l-_N_G-nitro-l-arginine methyl ester (l-NAME) pretreatment blocked, whereas l-arginine and sodium nitroprusside (SNP) each enhanced, EC uptake of fluorescein isothiocyanate (FITC)-labeled insulin. SNP also partly or fully reversed the inhibition of EC insulin uptake caused by l-NAME, wortmannin, the Src inhibitor PP1, and tumor necrosis factor-α. In addition, SNP promoted [125I]TyrA14insulin TET by ∼40%. Treatment with insulin with and without SNP did not affect EC cyclic guanosine monophosphate (cGMP) levels, and the cGMP analog 8-bromo-cGMP did not affect FITC-insulin uptake. In contrast, treatment with insulin and SNP significantly increased EC protein _S_-nitrosylation, the colocalization of _S_-nitrosothiol (S-NO) and protein-tyrosine phosphatase 1B (PTP1B), and Akt phosphorylation at Ser473 and inhibited PTP1B activity. Moreover, a high-fat diet significantly inhibited EC insulin-stimulated Akt phosphorylation and FITC-insulin uptake that was partially reversed by SNP in rats. Finally, inhibition of _S_-nitrosylation by knockdown of thioredoxin-interacting protein completely eliminated SNP-enhanced FITC-insulin uptake. We conclude that NO directly promotes EC insulin transport by enhancing protein _S_-nitrosylation. NO also inhibits PTP1B activity, thereby enhancing insulin signaling.
Before insulin can act on myocytes, it must first traverse the continuous vascular endothelium in skeletal muscle. Insulin delivery to muscle is affected by blood flow (1), flow distribution (2), and insulin transendothelial transport (TET) (3,4). Importantly, insulin delivery to muscle interstitial fluid is a rate-limiting step in the peripheral action of insulin (5,6) and is delayed in insulin-resistant, obese humans, suggesting a significant role for this transport process in peripheral insulin resistance (7,8). Endothelial dysfunction, secondary to reduced nitric oxide (NO) bioavailability, is an early and prominent feature of insulin resistance. Endothelial NO synthase (NOS-3 or eNOS) produces NO from l-arginine, and eNOS is activated by insulin at physiologic concentrations. Knockout of eNOS or inhibiting insulin signaling by endothelium-specific knockout of IRS2, leading to the reduction of eNOS activity in the vascular endothelial cell (EC), produces metabolic insulin resistance (9,26). In addition, endothelial-specific knockout of IRS2 inhibits insulin-induced microvascular recruitment and reduces insulin delivery to muscle interstitium. However, it is not known whether the reduced insulin delivery is a result of reduced blood flow, altered flow distribution, impaired insulin TET, or a combination of these (26). We and others have previously shown that insulin induces vasodilation by enhancing NO production to facilitate its own delivery to the peripheral tissues in vivo (1,2). Whether NO directly affects insulin uptake and TET has not been examined.
The insulin receptor and caveolae mediate EC insulin uptake (4,11–13), and this process is blunted by either inhibiting intracellular insulin signaling or treating with tumor necrosis factor-α (TNF-α). Conversely, stimulating intracellular insulin signaling by inhibiting protein-tyrosine phosphatase 1B (PTP1B) enhances insulin uptake (12).
In the current study, we found that exogenously delivered NO stimulated both the uptake and the TET of insulin by aortic ECs. We also found that NO partially or fully restored insulin uptake by the cells pretreated with inhibitors of insulin signaling pathways (12). To explain these findings, we examined pathways downstream of NO production by which the NO might act on insulin uptake. We found that exogenously delivered NO can directly promote insulin transport independent of eNOS activity through enhancing protein _S_-nitrosylation, including that of PTP1B, without affecting the soluble guanylyl cyclase (sGC)-cyclic guanosine monophosphate (cGMP) pathway and overcome the impaired insulin transport seen with experimental insulin resistance.
RESEARCH DESIGN AND METHODS
Cell culture.
Bovine aorta ECs (bAECs) (passage numbers 2–8; BioWhittaker, Inc., Walkersville, MD) were grown in microvascular endothelial cell growth medium.
Measurement of insulin TET.
These experiments were performed as previously described (4,14). Briefly, bAECs were seeded onto Transwell inserts (6.5 mm diameter, 0.4 μm pore size, polyester membrane) (Corning Incorporated, Corning, NY) treated with human fibronectin (Sigma-Aldrich, St. Louis, MO). The transendothelial electrical resistances were monitored daily with an Epithelial Voltohmmeter and EndOhm chamber (WPI, Sarasota, FL). After the transendothelial electrical resistance reached a plateau, the endothelial monolayers were washed twice at 37°C with endothelial basal medium (EBM), and the fluid in the top chamber was replaced with EBM containing [125I]TyrA14insulin (125I-insulin) 200 pmol/L (PerkinElmer, Boston, MA) with or without 0.3 μmol/L sodium nitroprusside (SNP) (Calbiochem). At selected times, 200 μL fluid was removed from the bottom chamber and replaced with 200 μL EBM to ensure hydrostatic balance. The concentration of 125I-insulin was measured with a γ counter. The percentage of insulin transported was calculated.
Animals.
Adult male Sprague-Dawley rats (Charles River Laboratories, Wilmington, MA) were housed in an animal room maintained at ∼22°C with a 12-h light/dark cycle and fed ad libitum. Rats were randomly assigned to either a high-fat diet (HFD) (60% fat, 20% protein, 20% carbohydrate) (product number D12492; Research Diets, New Brunswick, NJ) or a control regular chow diet (product number 7012; Harlan Laboratories) for 4 weeks. Rats were killed by CO2. The aorta was quickly dissected and put into 5% CO2 in O2-bubbled modified Krebs buffer (NaCl 119 mmol/L, KCl 4.7 mmol/L, CaCl2⋅2H2O 2.5 mmol/L, MgSO47H2O 1.17 mmol/L, NaHCO3 25 mmol/L, KH2PO4 1.18 mmol/L, EDTA 0.027 mmol/L, glucose 5.5 mmol/L). The surrounding fascia was carefully removed, and the vessel was divided into small segments and cut open. After stabilization in a cell culture incubator for 1 h, these aortic segments were treated with 0.3 or 30 μmol/L SNP with or without 50 nmol/L fluorescein isothiocyanate (FITC)-labeled insulin (Sigma-Aldrich) or regular insulin for 30 min. After fixation with cold methanol, the endothelial face of the vessel was placed face down onto a coverslip that was precoated with poly-l-lysine (Sigma-Aldrich), pressure was applied briefly, the vessel wall was removed, and the coverslip with adherent ECs was processed for immunocytochemical staining (see immunocytochemistry). The study procedure was approved by the animal care and use committee of the University of Virginia.
Western blotting.
Western blotting was performed as described previously (13,15). Briefly, after blocking with 5% low-fat milk in Tris-buffered saline (TBS) plus Tween 20, membranes were incubated overnight at 4°C with monoclonal antibody against thioredoxin-interacting protein (Txnip) (MBL International Corporation, Woburn, MA), polyclonal antibody against caveolin-1 (Santa Cruz Biotechnology, Santa Cruz, CA), or monoclonal antibody against GAPDH (Sigma-Aldrich). This procedure was followed by incubation with a species-specific secondary antibody coupled to horseradish peroxidase (Amersham [GE Healthcare Life Sciences], Piscataway, NJ), and the blots were developed with an enhanced chemiluminescence Western blotting kit (Amersham [GE Healthcare Life Sciences]). The developed films were scanned with a densitometer (Molecular Dynamics, Amersham, Piscataway, NJ) and quantified with the use of ImageQuant 5.0 software.
Real-time RT-PCR.
Real-time RT-PCR assay was performed as described previously (13,14). Briefly, total RNAs were extracted from the cultured bAECs with an RNeasy kit (Qiagen) and were reverse transcribed with the iScript cDNA synthesis kit (Bio-Rad). The cDNA products were then amplified with iQ SYBR Green Supermix on an iCycler apparatus (Bio-Rad). For the amplification of Txnip gene products, the following primers were designed: forward 5′-CATGTGGAGGAGAGCCAATTTA-3′ and reverse 5′-GCCCAGTTACTACTGCCTTATG-3′, and the Txnip mRNA levels were normalized to the housekeeping gene (GAPDH) mRNAs (primers designed: forward 5′-GGGTCATCATCTCTGCACCT-3′ and reverse 5′-GGTCATAAGTCCCTCCACGA-3′) (Integrated DNA Technologies, Coralville, IA). Standard curves for each mRNA were generated by serial dilution of cDNA synthesized from the extracted total RNA and was included in each iCycler real-time RT-PCR experiment. The specificity of the desired product was verified by analysis of the melting curve.
Small interfering RNA design and transfection.
A specific small interfering RNA (siRNA) duplex against bovine Txnip mRNA and a scrambled siRNA control were purchased from Dharmacon, Inc. (Lafayette, CO). Cells were seeded and transfected when they reached 30–50% confluency with siRNA duplex to a final concentration of 40 nmol/L with use of Oligofectamine (Invitrogen, Carlsbad, CA). Forty-eight hours after transfection, cells were serum starved for 6 h followed by insulin treatment as described previously (13,14).
Immunocytochemistry.
The double-staining protocols were the same as described previously (4,12). Briefly, the methanol-fixed bAECs were washed three times in TBS, permeabilized in TBS containing 0.05% Triton X-100 and 1% horse or goat serum for 30 min at room temperature, and incubated with two different primary antibodies against two different target proteins (double labeling) overnight at 4°C. The following primary antibodies were used: rabbit polyclonal anti-FITC (Molecular Probes, Inc., Eugene, OR), mouse monoclonal anti-Txnip (MBL International Corporation), monoclonal anti-PTP1B (Abcam, Cambridge, MA), and monoclonal antiphospho-Akt (Ser473) (Millipore). The cells were washed three times in TBS and then incubated with species-specific secondary antibodies conjugated with a fluorochrome cyanine (Cy2 or Cy3) (Jackson ImmunoResearch, West Grove, PA) at 1:200 dilutions for 45 min at room temperature. The cells were washed three times in TBS and then coverslipped with antifade mounting medium with DAPI.
Assay for cGMP.
Intracellular cGMP concentration of the cultured bAECs was measured with a cGMP enzyme immunosorbent assay kit (Cayman Chemical). The sensitivity of the assay was enhanced by the optional acetylation procedure according to the manufacturer’s protocol. Cells were treated with or without isobutylmethylxanthine 200 μmol/L (Sigma-Aldrich) for 10 min before insulin and/or SNP stimulation. Protein concentration was measured by the Bradford method. The measured cGMP values were normalized against the corresponding protein concentrations.
Rat’s blood analyses.
Arterial serum glucose concentrations were measured with a glucose colorimetric assay kit (Cayman Chemical). Serum insulin (Mercodia AB, Uppsala, Sweden) and triglyceride (Cayman Chemical) concentrations were measured with ELISA.
In situ detection of PTP1B _S_-nitrosylation.
The general protein _S_-nitrosylation in the ECs harvested from rat aortas (see previous discussion) was evaluated in situ with the use of the biotin-switch technology–based S-Nitrosylated Protein Detection Assay Kit (Cayman Chemical) according to the manufacturer’s protocol. The biotin derivatization was detected by the included fluorescein-conjugated avidin. In these experiments, assay of the protein _S_-nitrosylation was determined in combination with the immunocytochemical staining for PTP1B with the monoclonal primary antibody against PTP1B followed by a species-specific secondary antibody conjugated with Cy3 and visualized by confocal imaging.
PTP1B enzymatic activity assay.
The PTP1B activity of bAECs was measured after precipitation of PTP1B with a modified immunoprecipitation procedure described previously (15,16). Briefly, cultured bAECs were scraped in ice-cold lysis buffer (PBS containing 1% NP-40, 1% deoxycholate, 5 mmol/L EDTA, 1 mmol/L EGTA, 2 mmol/L phenylmethylsulfonyl fluoride, and 0.1 mmol/L leupeptin). The lysates were gently rocked at 4°C for 15 min and then centrifuged at 14,000_g_ for 10 min at 4°C. The supernatants were precleared by adding 20 μL/mL cell lysate protein A/G plus agarose (Santa Cruz Biotechnology) at 4°C for 10 min. Equal amounts of protein samples (500 μg of total protein) were immunoprecipitated with the monoclonal anti-PTP1B antibody at 4°C overnight. PTP1B immunocomplexes were further precipitated by the protein A/G plus agarose at 4°C for an additional 2 h. Immunoprecipitates were washed five times with TBS, and the residue TBS buffer was removed. The activity of purified PTP1B was assayed with a PTP1B assay kit (Calbiochem) according to the manufacturer’s protocol. Briefly, the phosphopeptide substrate IR5 (containing a sequence from the insulin receptor β subunit domain that must be autophosphorylated to achieve full receptor kinase activation) was added to a final concentration of 75 μmol/L in a total reaction volume of 100 μL in the assay buffer. The sample mixtures were incubated for 30 min at 30°C. After the reaction, 60-μL aliquots were placed into half-area 96-well plates, and 25 μL red reagent plus 40 μL assay buffer were added to each sample well and gently mixed. After incubation at room temperature for 30 min, the absorbance was measured at 620 nm with a plate reader.
Imaging.
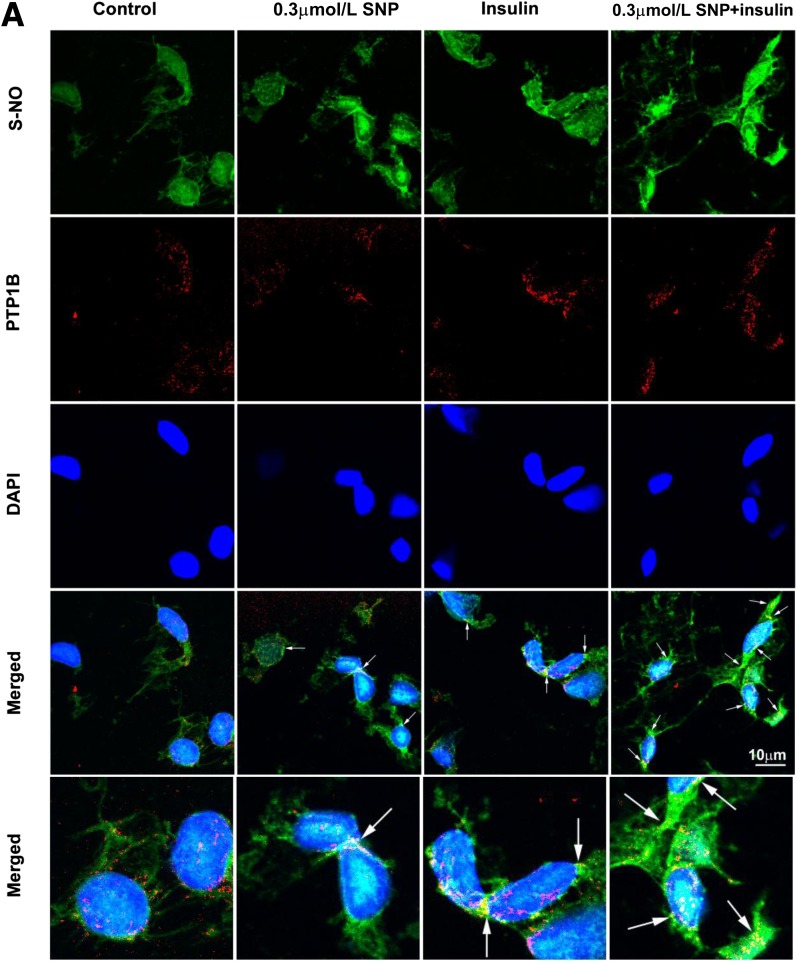
The immunocytochemical labeling was examined with a confocal microscope as described previously (4,12–15). Confocal imaging was performed with a Leica SP5 X imaging system equipped with ultraviolet (405 nm), tunable (470–670 nm) white light and argon ion lasers (458, 477, 488, 496, 514 nm); ×40 and ×60 1.4 numerical aperture oil-immersion lenses were used to acquire optical sections. During image acquisition, the individual microscopic field was selected to include a similar number of cells but was otherwise random. To quantify fluorescence intensity, the images from randomly selected microscopic fields containing a similar number of nuclei staining were outlined, and the integrated fluorescence intensities were measured with Image J software. In the case (Fig. 5_A_) where only a few cells were included in each microscopic field, as the protocol for the _S_-nitrosylated protein detection assay kit requires use of 4% paraformaldehyde with the specific wash buffer for cell fixation, which appeared to inhibit intact rat ECs attachment to the coverslip, individual cells were outlined by polygonal method (30 cells for each group were randomly selected), and the integrated fluorescence intensities were measured. Digital images were processed identically with Adobe Photoshop.
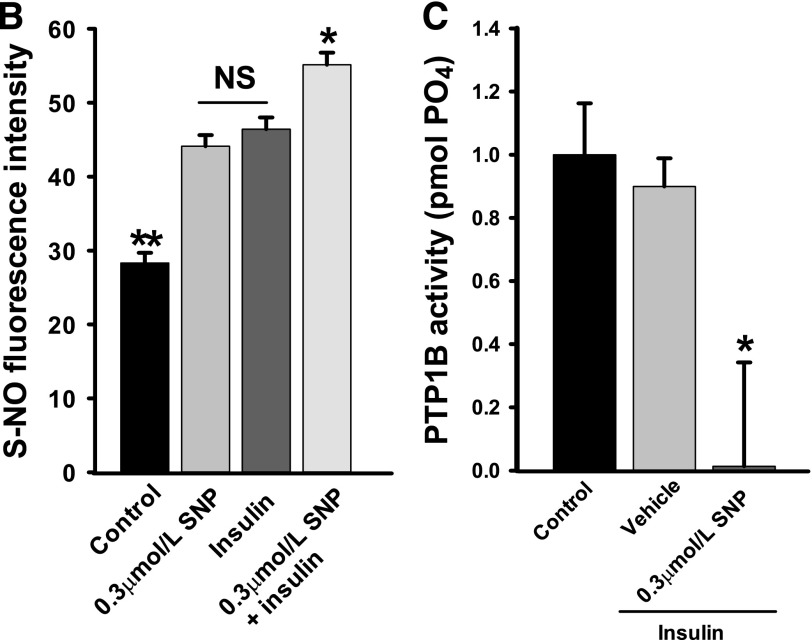
FIG. 5.
Effects of insulin and/or SNP on EC general protein _S_-nitrosylation and specific PTP1B _S_-nitrosylation and activity. Freshly harvested rat aortic ECs were used for in situ detection of protein _S_-nitrosylation (S-NO) (green, revealed by fluorescein) combined with immunocytochemical staining for PTP1B (red, revealed by Cy3). A: Representative confocal images from single optical sections. Arrows point to the colocalization of S-NO and PTP1B. B: The histograms that quantify S-NO. * and **P < 0.001 compared with the remaining groups. C: PTP1B activity of the bAECs that were serum starved for 6 h followed by incubation with 0.3 μmol/L SNP or vehicle with 50 nmol/L insulin for 30 min before being immunoprecipitated with anti-PTP1B antibody and the tyrosine phosphatase activity measured in the immunoprecipitate. *P < 0.05 compared with either vehicle or control group. Results were the sum of three independent experiments, with triplicates for each experiment.
Statistical analysis.
Data are presented as mean ± SEM. Statistical comparisons among different groups were made with one-way ANOVA with Student-Newman-Keuls post hoc testing. Statistical significance is defined as P ≤ 0.05.
RESULTS
NO production regulates FITC-insulin uptake.
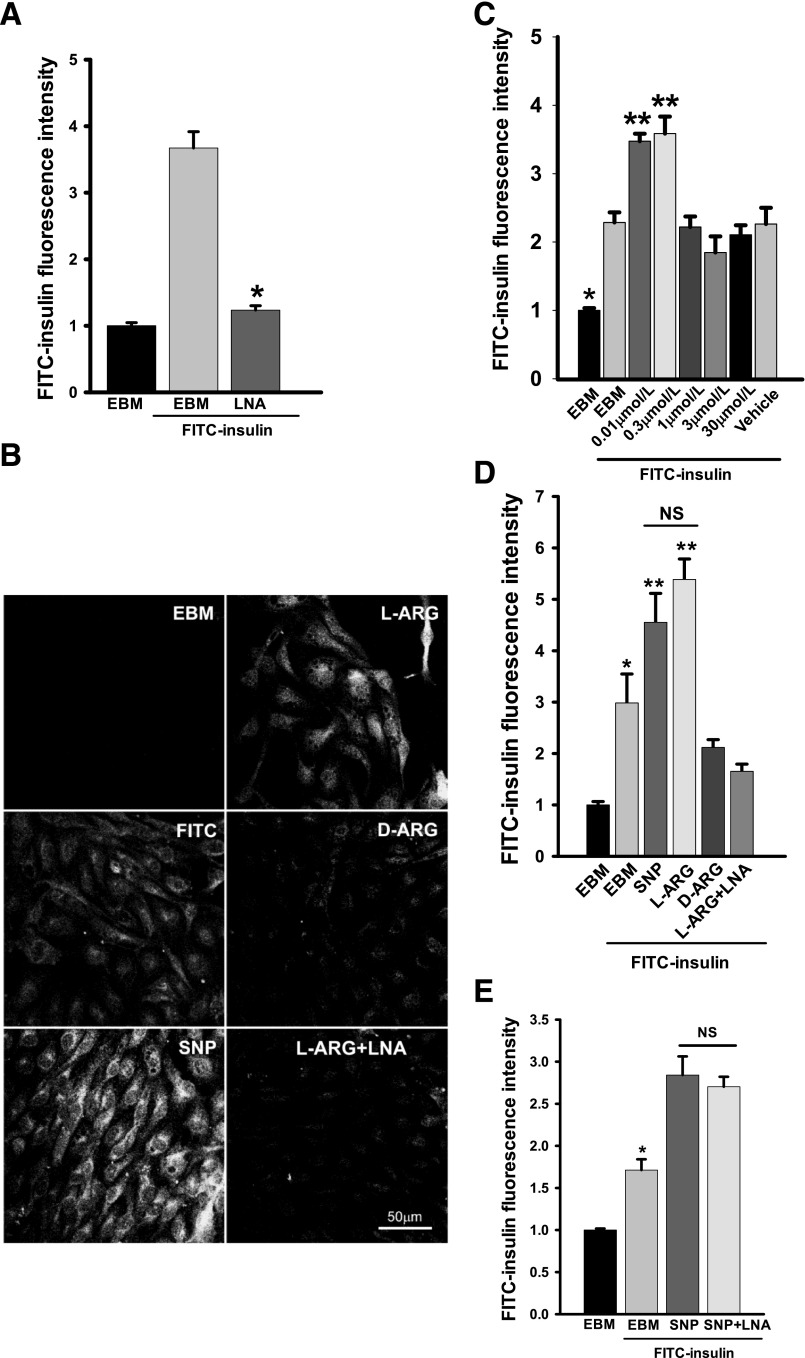
We first examined the effect of l-_N_G-nitro-l-arginine methyl ester (l-NAME) inhibition of NOS on FITC-insulin uptake. Figure 1_A_ shows that compared with control, pretreating bAECs with l-NAME strongly inhibited FITC-insulin uptake (P < 0.05). Conversely, pretreatment of bAECs with 500 μmol/L l-arginine (the substrate of eNOS) for 30 min significantly increased FITC-insulin uptake (Fig. 1_B_ and D), whereas pretreatment of cells with d-arginine had no effect. l-NAME added with l-arginine blocked the increased uptake seen with l-arginine alone (Fig. 1_B_ and D). We then examined whether the effect of l-arginine on FITC-insulin uptake could be mimicked by giving NO to bAECs. Adding modest concentrations (0.01∼0.3 μmol/L) of SNP, an NO donor, significantly increased FITC-insulin uptake by bAECs compared with FITC-insulin alone (P < 0.05) (Fig. 1_C_ and D) (also see Fig. 6_F_ and H). However, SNP at higher concentrations did not stimulate insulin uptake (Fig. 1_C_), suggesting a biphasic action with an inhibitory effect of higher SNP (NO) concentrations (17–19). Of note, 0.3 μmol/L SNP also eliminated the inhibitory effect of l-NAME on FITC-insulin uptake (Fig. 1_A_ and E).
FIG. 1.
NO directly promotes EC FITC-insulin uptake. bAECs were serum starved for 6 h then pretreated with or without 0.5 mmol/L l-arginine (L-ARG) or 0.5 mmol/L d-arginine (D-ARG) ± 100 μmol/L l-NAME (LNA) for 30 min followed by 50 nmol/L FITC-insulin ± 0.3 μmol/L SNP or vehicle for 30 min before fixation and immunocytochemical staining. A: Effects of LNA on FITC-insulin uptake. *P < 0.05 compared with EBM + FITC-insulin but _P_ > 0.05 compared with EBM (incubated in the basal medium without FITC-insulin). B: Representative confocal images of bAECs stained for FITC from three independent experiments. C: The histograms indicate the dose response of FITC-insulin uptake to SNP treatment. * and **P < 0.001 compared with all remaining groups. _D_: Quantification of the fluorescent intensity of FITC for each experimental condition indicated in the confocal images. *_P_ < 0.05 compared with EBM group, _P_ < 0.01 compared with SNP group, and _P_ < 0.001 compared with L-ARG group, but _P_ > 0.05 compared with D-ARG and L-ARG + LNA groups; **P < 0.001 compared with all remaining groups. E: Effects of LNA on SNP-stimulated increase of FITC-insulin uptake. *P < 0.01 compared with remaining groups.
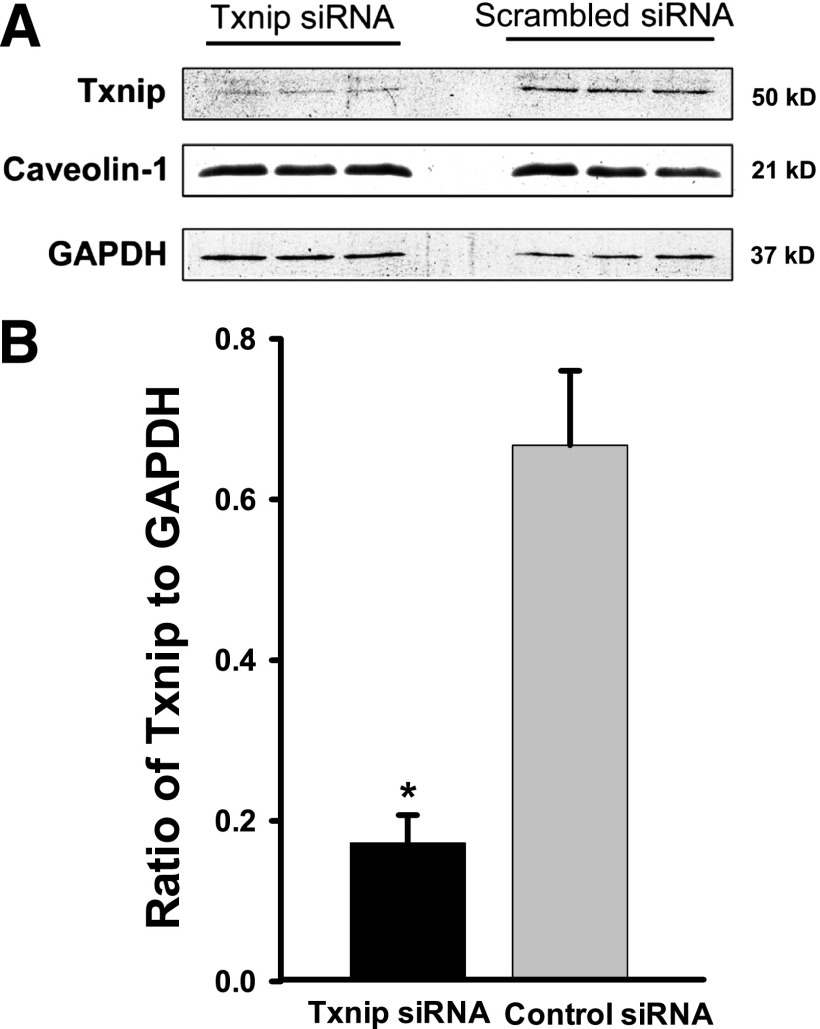
FIG. 6.
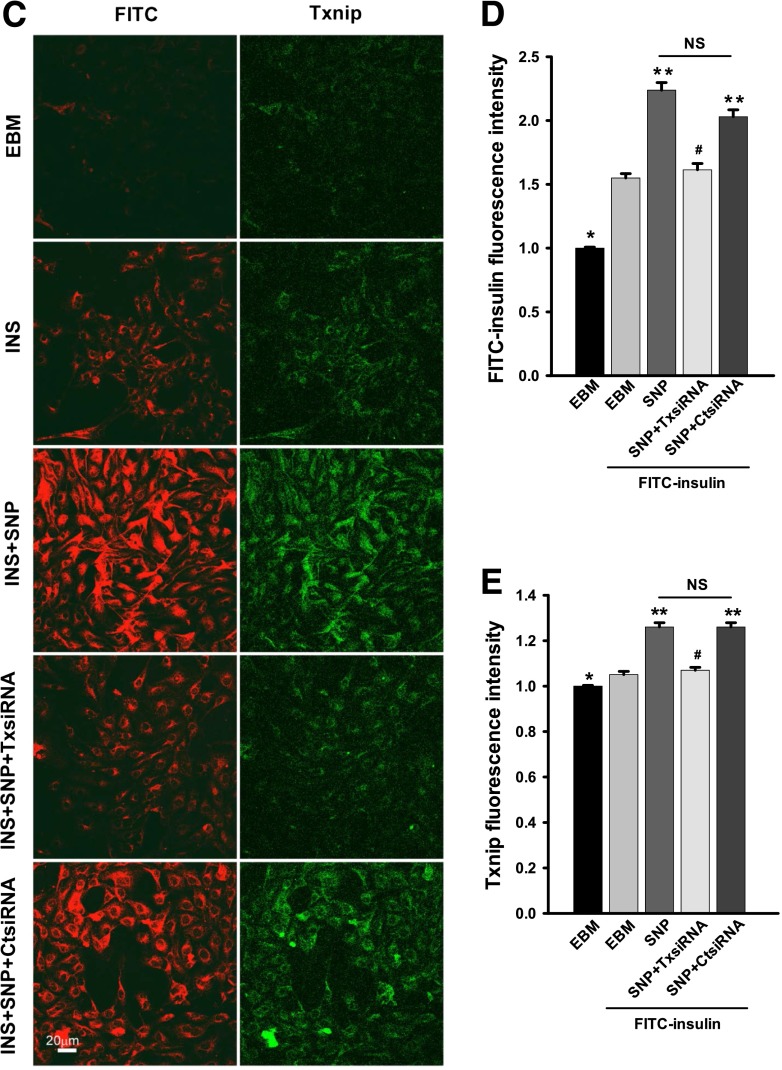
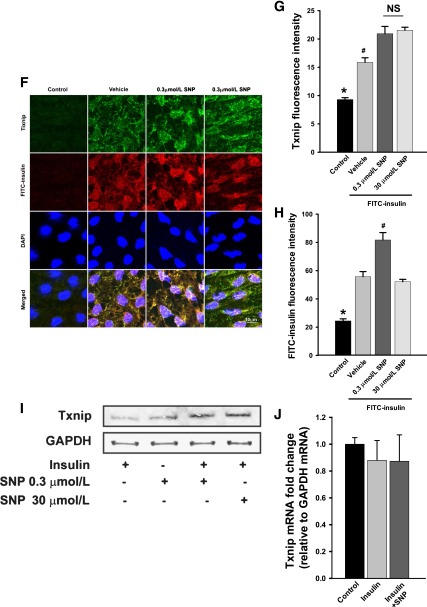
Effects of knockdown of Txnip on insulin uptake. bAECs were transfected with either Txnip siRNA or scrambled control siRNA. Forty-eight hours after the transfection, cells were processed for Western blotting or serum starved for 6 h followed by incubation with or without 50 nmol/L FITC-insulin ± 0.3 μmol/L SNP for 30 min before they were fixed and doubly stained with anti-FITC (red, revealed by Cy3) and anti-Txnip (green, revealed by Cy2) primary antibodies. A: Representative Western blots. Caveolin-1 was used as a control to assess nonspecific off-target effects of siRNA silencing. GAPDH was used as a loading control. B: Mean values for the ratio of Txnip to GAPDH measured by Western blotting. *P < 0.01 compared with scrambled control. _C_: Representative confocal images from single optical sections. _D_ and _E_: The histograms indicate the quantitation of FITC-insulin and Txnip fluorescence intensity, respectively, observed in three experiments. * and **_P_ < 0.05 compared with remaining groups; #_P_ > 0.05 compared EBM + FITC-insulin group (FITC-insulin treated without transfection of siRNA). F_–_H: Fresh rat aortic ECs were transferred to poly-L-lysine-coated coverslips (see research design and methods for details). After 1 h stabilization, these cells were treated with either 0.3 μmol/L or 30 μmol/L SNP or vehicle for 30 min before fixation and underwent immunocytochemical staining for both Txnip (green, revealed by Cy2) and FITC (red, revealed by Cy3). F: Representative confocal images of single optical sections from three independent experiments. G and H: The histograms indicate the quantitation of Txnip and FITC-insulin, respectively. * and #P < 0.05 compared with remaining groups. I: bAECs were serum starved for 6 h followed by incubation with 0.3 μmol/L SNP, 50 nmol/L insulin, or 50 nmol/L insulin with or without SNP for 30 min before processed for Western blotting of Txnip. The representative blots from three independent experiments are shown. GAPDH was used as a loading control. J: bAECs were serum starved for 6 h followed by incubation with 50 nmol/L insulin with or without 0.3 μmol/L SNP for 30 min. Cells were then processed for real-time RT-PCR (n = 3); no statistical difference was found between treatments. CtsiRNA, control siRNA; INS, insulin; TxsiRNA, Txnip siRNA.
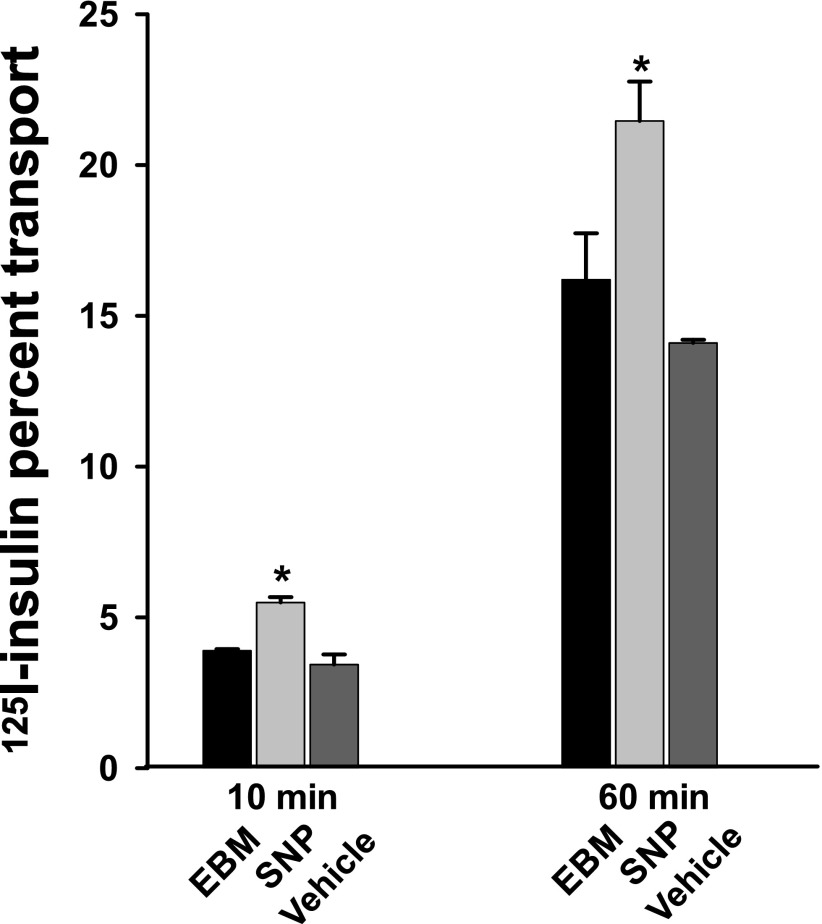
Next, we examined the effect of SNP on 125I-insulin TET with a Transwell device (4,14). Figure 2 shows that compared with control, adding SNP increased 125I-insulin TET by ∼40% at both 10 and 60 min (P < 0.05 for each time point). In aggregate, these data suggest that the NO donor SNP may directly promote insulin transport in an eNOS activity-independent fashion.
FIG. 2.
SNP promotes insulin TET. 125I-insulin 200 pmol/L alone or in the presence of either 0.3 μmol/L SNP or vehicle was added into the top chamber of Transwell plates, and samples were removed from the bottom chamber at both 10 and 60 min for measurement of the amount of 125I-insulin transported. Percent transport of total added 125I-insulin at 60 min was calculated. *P < 0.05 compared with both the EBM group and vehicle control (n = 3).
NO rescues the inhibition of insulin uptake induced by blocking intracellular insulin signaling pathways.
We previously reported that insulin transport by bAECs depends on its intracellular insulin signaling as either general inhibition of tyrosine kinases (genistein) or more-specific inhibition of Src (PP1), phosphatidyl-inositol-3 kinase (PI3K) (wortmannin), or mitogen-activated protein kinase (MAPK) (PD 098059) (12); each inhibited FITC-insulin uptake. Therefore, we tested whether adding SNP to bAECs relieved the inhibition of FITC-insulin uptake induced by blocking these intracellular insulin signaling pathways. Figure 3 and Supplementary Fig. 1 show that pretreatment of bAECs with wortmannin, genistein, PP1, or PD 098059 significantly inhibited FITC-insulin uptake as reported previously (12). Adding SNP, however, completely rescued both wortmannin- and PP1-inhibited insulin uptake (Fig. 3_A_–C) and partially restored FITC-insulin uptake that had been inhibited by PD 098059 (Supplementary Fig. 1_B_). SNP did not significantly affect genistein-inhibited FITC-insulin uptake (Supplementary Fig. 1_A_). These data indicate that NO is able to promote FITC-insulin uptake despite preinhibiting some intracellular insulin signaling pathways.
FIG. 3.
Effects of SNP on FITC-insulin uptake by ECs pretreated with inhibitors of insulin action. bAECs were serum starved for 6 h then pretreated with either 100 nmol/L wortmannin (WOT) or 10 μmol/L PP1 for 30 min followed by 50 nmol/L FITC-insulin ± 0.3 μmol/L SNP or vehicle (VEC) for 30 min before fixation and immunocytochemical staining. A: Representative confocal images of bAECs stained for FITC from three independent experiments. B and C: Quantitative analysis of cellular insulin uptake for each experimental condition. #, *, and **P < 0.05 compared with remaining groups (B); * and #P < 0.05 compared with remain groups (C). D: Representative confocal images of bAECs that were serum starved ± 5 ng/mL TNF-α for 6 h followed by 50 nmol/L FITC-insulin ± 0.3 μmol/L SNP or VEC for 30 min before fixation and immunocytochemical staining from three independent experiments. E: Quantitative analysis of the cellular insulin uptake presented in D. * and #P < 0.05 compared with remaining groups and with each other.
We previously used TNF-α treatment of ECs as an in vitro model of insulin resistance and showed that treatment of bAECs with TNF-α inhibited FITC-insulin uptake (12). Figure 3_D_ shows that adding 0.3 μmol/L SNP not only completely rescued TNF-α–induced inhibition of insulin uptake but strikingly stimulated FITC-insulin uptake.
SNP-enhanced insulin transport requires protein _S_-nitrosylation but not activation of sGC.
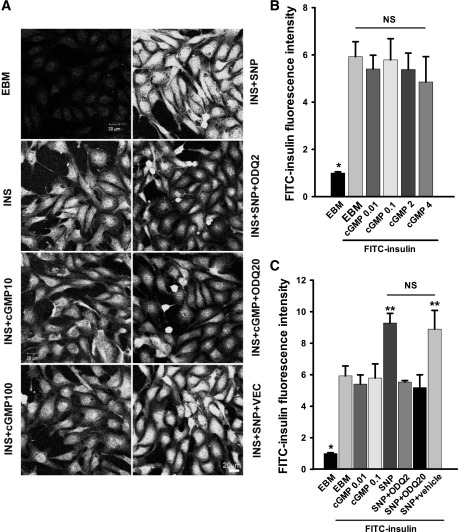
We next examined the pathways by which SNP promoted FITC-insulin transport. The selective, irreversible, heme-site inhibitor of sGC 1H-[1,2,4]oxadiazolo[4,3-a]quinoxalin-1-one (ODQ) (20) completely eliminated the enhanced FITC-insulin uptake induced by SNP compared with vehicle control (Fig. 4_A_ and C). However, the membrane-permeable cGMP analog 8-bromo-cGMP over a range of concentrations had no significant effects on FITC-insulin uptake (Fig. 4_B_). In addition, treatment of ECs with insulin with or without SNP did not significantly affect the intracellular cGMP levels (Supplementary Fig. 2), which is consistent with a previous report (21). This seeming inconsistency may be explained by the observation that to exert its biological effects as an NO donor, higher concentrations of SNP (>30 nmol/L) require intracellular bioactivation (metabolic NO formation) that is susceptible to inhibition by ODQ (22). In aggregate, these data suggest that SNP-enhanced insulin transport may not be mediated by activation of sGC.
FIG. 4.
Effects of cGMP analog and ODQ on insulin uptake. bAECs were serum starved for 6 h then pretreated with either 8-bromo-cGMP (0.01, 0.1, 2, or 4 mmol/L) for 5 min or ODQ (2 or 20 μmol/L or vehicle) for 15 min followed by FITC-insulin 50 nmol/L ± 0.3 μmol/L SNP for 30 min before fixation and immunocytochemical staining. A: Representative confocal images of bAECs stained for FITC from three independent experiments. B: The histograms indicate the dose response of FITC-insulin uptake to 8-bromo-cGMP treatment. *P < 0.01 compared with the remaining groups. C: Quantitative analysis of cellular insulin uptake for each experimental condition. * and **P < 0.05 compared with remaining groups. cGMP10, cGMP 0.01 mmol/L; cGMP100, cGMP 0.1 mmol/L; INS, insulin; ODQ2, ODQ 2 μmol/L; ODQ20, ODQ 20 μmol/L; VEC, vehicle.
Because NO also regulates cellular function by _S_-nitrosylation, we next examined the effect of SNP treatment on protein _S_-nitrosylation. Figure 5_A_ (top row) and B show that both insulin and SNP treatment increased the protein _S_-nitrosylation level, and SNP plus insulin treatment further significantly increased the protein _S_-nitrosylation compared with either insulin or SNP alone in the intact aortic ECs of rats ex vivo. Because the steady-state level of protein _S_-nitrosylation is determined by the balance between nitrosylation and denitrosylation, thioredoxin activity (a broad-spectrum denitrosylase) is important for determining the steady-state levels of protein _S_-nitrosylation (23). Txnip has been demonstrated to critically inhibit protein denitrosylation (19). To examine the effect of reducing _S_-nitrosylation on SNP-stimulated FITC-insulin uptake, we designed a specific siRNA against Txnip in bAECs to silence Txnip expression and thereby promote protein denitrosylation. Figure 6_A_ and B show that compared with the scrambled siRNA, the siRNA against Txnip reduced Txnip protein expression by ∼75%. Neither caveolin-1 nor GAPDH protein expression was affected by knockdown of Txnip. Figure 6_C_–H show that insulin significantly increased Txnip staining compared with the basal medium control (P < 0.05), and 0.3 μmol/L SNP plus insulin further increased Txnip staining compared with insulin alone (_P_ < 0.05) (Fig. 6_C_, E_–_G, and I) both in vitro and ex vivo, although a higher SNP dose (30 μmol/L) had no additional effect on Txnip staining (Fig. 6_F_, G, and I). Of note, the increased Txnip staining induced by insulin or insulin plus 0.3 μmol/L SNP was paralleled by enhanced protein _S_-nitrosylation (Fig. 5_A_ [_top row_] and _B_). On the other hand, insulin with or without 0.3 μmol/L SNP treatment did not affect Txnip mRNA expression (_P_ > 0.05) (Fig. 6_J_), suggesting that these treatments inhibit the rapid turnover of Txnip proteins, leading to an enhanced protein _S_-nitrosylation (19). Additionally, compared with the scrambled siRNA control, knockdown of Txnip with the specific siRNA against Txnip (Fig. 6_C_ [_right_] and E) strikingly reduced SNP-promoted FITC-insulin uptake (Fig. 6_C_ [_left_] and D) proportionately to the reduced level of Txnip found (Fig. 6_C_ [_right_] and E). These data indicate that NO may have promoted insulin transport not through activation of sGC but through promotion of protein _S_-nitrosylation.
Because we previously reported that inhibition of PTP1B with a specific PTP1B inhibitor significantly enhanced FITC-insulin uptake by aortic ECs (12), we next examined whether treatment of aortic ECs with insulin and/or 0.3 μmol/L SNP affected the _S_-nitrosylation of PTP1B and its enzymatic activity. Figure 5_A_ shows that although 0.3 μmol/L SNP- or insulin-only treatment increased PTP1B protein _S_-nitrosylation, 0.3 μmol/L SNP plus insulin treatment caused the most robust PTP1B protein _S_-nitrosylation as indicated by almost complete colocalization of S-NO and PTP1B (Fig. 5_A_ [_bottom row_]) compared with the basal medium control. In addition, vehicle plus insulin treatment tended to inhibit PTP1B activity, but it was not statistically significant; however, 0.3 μmol/L SNP plus insulin treatment almost completely inhibited PTP1B activity (P < 0.05) compared with either basal medium or vehicle plus insulin controls (Fig. 5_C_). These data suggest that NO may inhibit PTP1B activity through _S_-nitrosylation of PTP1B protein to regulate insulin transport.
NO stimulates intracellular insulin signaling and reverses HFD-induced impairments in insulin signaling and uptake in Sprague-Dawley rats.
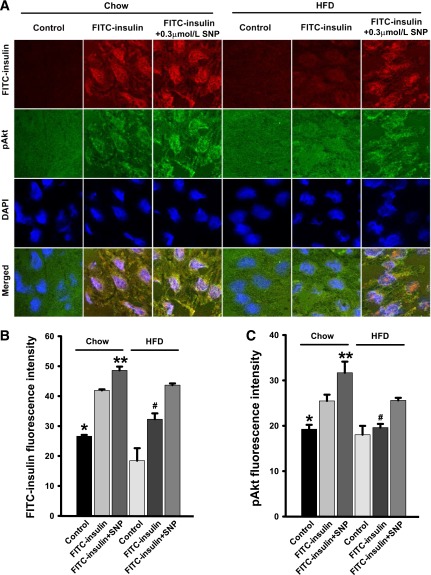
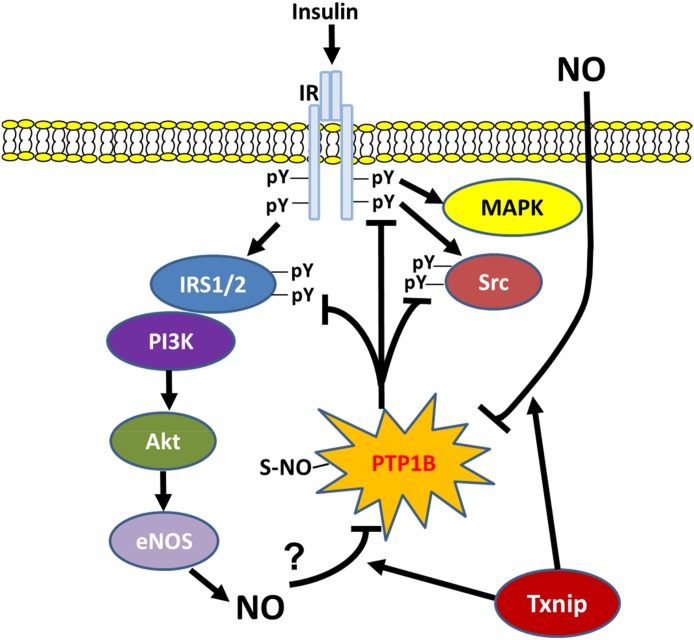
Finally, we examined the effects of NO on intracellular insulin signaling by in situ detection of changes in Akt phosphorylation at Ser473, using fresh rat aortic ECs attached to coverslips. Because high-fat feeding of rats for 3∼4 weeks has been shown to cause whole-body insulin resistance and vascular dysfunction (24,25), we also examined the effects of feeding rats an HFD for 4 weeks on vascular endothelial insulin signaling and uptake and responsiveness to SNP. Supplementary Fig. 3_A_–D show that although serum glucose concentrations were not changed, body weight and serum triglyceride and insulin levels were increased by HFD feeding consistent with a state of insulin resistance as previously reported (24,25). In the rats on the regular chow diet, 0.3 μmol/L SNP significantly increased insulin-stimulated Akt phosphorylation at Ser473 and FITC-insulin uptake (Fig. 7). In addition, 4 weeks of HFD feeding inhibited both FITC-insulin uptake and insulin-stimulated Akt phosphorylation at Ser473, and 0.3 μmol/L SNP treatment partially but significantly reversed both effects (Fig. 7). These data combined with those shown in Fig. 5 suggest that NO may enhance EC insulin signaling and uptake in part through inhibition of PTP1B activity (Fig. 8).
FIG. 7.
Effects of SNP on FITC-insulin uptake and Akt phosphorylation at Ser473 in both chow and HFD-fed rats. Rat aortic ECs were transferred to coverslips and then treated with 50 nmol/L FITC-insulin with either 0.3 μmol/L SNP or vehicle for 30 min followed by immunocytochemical staining for phosphorylated Akt (pAkt) (green, revealed by Cy2) and FITC (red, revealed by Cy3). A: Representative confocal images of single optical sections. B and C: The histograms indicate the quantitation of FITC-insulin. B: *P > 0.05 compared with HFD control but P < 0.05 compared with remaining groups; # and **P < 0.05 compared with remaining groups and pAkt. C: * and #P < 0.05 compared with chow FITC-insulin, chow FITC-insulin + SNP, and HFD FITC-insulin + SNP groups; **P < 0.05 compared with remaining groups. n = 4 for each group.
FIG. 8.
Summary of the new mechanistic findings of the present study. NO stimulates _S_-nitrosylation of PTP1B, which decreases its enzymatic activity, thereby limiting the dephosphorylation of tyrosine residues on key insulin signaling proteins (IR, IRS1/2, and Src), which facilitates insulin TET (42). Txnip promotes NO-mediated _S_-nitrosylation of PTP1B through inhibition of denitrosylases, leading to the inhibition of PTP1B and activation of insulin signaling. pY, tyrosine phosphorylation.
DISCUSSION
To our knowledge, the results provide the first demonstration that NO can directly promote both insulin uptake and TET by arterial ECs. Furthermore, NO (SNP, an NO donor) can completely or partially restore insulin uptake that was inhibited by agents that interfere with signaling through PI3K, Src, or MAPK as well as by TNF-α and high-fat feeding in vivo. SNP did not reverse the inhibition of insulin uptake provoked by genistein, a nonspecific tyrosine kinase inhibitor. Although NO exerts its diverse cellular actions through enhancing both sGC-cGMP-protein kinase G– and protein _S_-nitrosylation–mediated signaling pathways, the present data support an important role for the latter pathway in mediating NO-stimulated insulin uptake and transport. Taken together, the current results indicate a third role for NO related to facilitating insulin delivery to muscle tissue. This action, coupled with its vasodilatory actions to increase muscle blood flow (1) and improve flow distribution (2,26), suggests a highly coordinated physiological role for NO to promote insulin delivery.
In the current study, we found that pretreatment of bAECs with l-NAME 100 μmol/L completely inhibits FITC-insulin uptake and that SNP can overcome the inhibition induced by l-NAME, suggesting that the exogenous NO from SNP is enough to enhance insulin uptake regardless of endogenous NO production. Insulin clamp studies have shown that the eNOS−/− mouse is metabolically insulin resistant (9), and an in vivo study showed that these mice manifest increased inflammation and impaired insulin signaling in aortic tissues (27).
Previous in vivo studies showed that insulin delivery from the plasma to the interstitial fluid compartment of skeletal muscle is a rate-limiting step in the peripheral action of insulin (5,6). This process is delayed in insulin-resistant, obese subjects in whom a significantly lower interstitial insulin level is seen in the early phase of insulin infusion compared with normal control subjects (7,8,26). Whether the delayed interstitial delivery of insulin in insulin-resistant, obese subjects is due to a defective vasodilating response, a lower capillary density (8,26,28,29), a defective TET (3,4,11), or a combination of these is uncertain. To dissect the effects of NO specifically on insulin TET, we used a Transwell device on which a confluent bAEC monolayer mimics the endothelial boundary in the vasculature of peripheral tissues, such as muscle and adipose tissues. Previous in vitro studies by us and others used this approach and demonstrated that insulin TETis receptor mediated (3,4) and involves caveolae (11,13). This receptor-mediated process is regulated by intracellular insulin signaling (12,14). In the current study, we observed that NO acts directly on vascular ECs to promote insulin uptake and TET.
Endothelial dysfunction, characterized by a deficiency of bioavailable NO, has been found to precede the development of type 2 diabetes and is significantly correlated with insulin resistance (30). Endothelial NO production has been shown to be positively related to peripheral insulin sensitivity (31). Insulin itself is an important eNOS activator (32). Inhibiting insulin signaling inhibits insulin uptake and TET in vitro (12,14) and insulin transcapillary transport in vivo (26). In the current study, we observed that SNP partially or completely relieves the inhibition of insulin uptake provoked by wortmannin, PD 098059, and PP1 but not that caused by genistein. Another study reported that an NO donor can directly activate PI3K and MAPK signaling pathways in both human and rat vascular smooth muscle cells (33). On the other hand, TNF-α decreases EC NO bioavailability (34) by inhibiting eNOS expression and interfering with early events in insulin signaling (35,36) and inhibits insulin uptake by bovine aortic ECs (12). In the current study, we observed that SNP eliminates the TNF-α inhibition of insulin uptake and even enhances insulin uptake beyond that seen in control cells (Fig. 3_D_ and E). The NO donor diethylenetriamine/nitric oxide was reported to rescue the palmitate-induced inhibition of insulin-stimulated IRS1, Akt, and eNOS phosphorylation in human umbilical vein ECs, whereas knockout of eNOS in vivo increased the vascular inflammation and insulin resistance (27).
The rat on an HFD for 4 weeks provides a well-characterized insulin resistance model. HFD feeding for 4 weeks induces vascular insulin resistance characterized by loss of insulin-mediated microvascular perfusion in skeletal muscle and whole-body and muscle metabolic insulin resistance (24,25). Of note, HFD-fed mice demonstrate impaired intracellular insulin signaling in aortic tissue much earlier (within 1 week of HFD feeding) than that in liver, muscle, and adipose tissues (37). In the current study, we show that both insulin-stimulated Akt phosphorylation and insulin uptake are suppressed in aortic ECs from the rats fed an HFD for 4 weeks (Fig. 7). Treatment with 0.3 μmol/L SNP could inhibit PTP1B activity (Fig. 5_A_ and C) and enhance intracellular insulin signaling and partially reverse the HFD-induced impairments in both insulin signaling and insulin uptake.
NO regulation of cellular function is complex (38,39) and appears to involve at least two major mechanisms under physiological conditions: 1) activation of sGC (38) and 2) reversible posttranslational modification of proteins by _S_-nitrosylation (or for some proteins, _S_-nitrosylation could be an intermediate step leading to the glutathionylation that also regulates protein function) (40). _S_-nitrosylation has emerged as an important feature of NO signaling (39). Indeed, we observed that SNP treatment significantly increases in situ protein _S_-nitrosylation in intact aortic ECs ex vivo (Fig. 5). In addition, we observed that the intracellular cGMP levels in cultured bAECs are barely detectable, even after preinhibition of the intracellular cGMP phosphodiesterase with isobutylmethylxanthine. Furthermore, cGMP levels are not changed after stimulation with insulin, SNP, or both, which is consistent with findings reported by others (21). These results combined with the failure of 8-bromo-cGMP to stimulate insulin uptake suggest that in vascular ECs, enhanced cGMP generation is not necessary for SNP (or NO)-stimulated insulin uptake. This finding led us to explore whether SNP-stimulated insulin uptake might be acting through protein _S_-nitrosylation. To address this, we took advantage of the fact that Txnip inhibits thioredoxin (a broad-spectrum denitrosylase) and that cellular Txnip protein turnover is very fast (half-life 10–20 min) (19). By decreasing Txnip, siRNA directed against Txnip would be expected to enhance thioredoxin-mediated reduction of protein _S_-nitrosylation and in the current context, to diminish SNP-stimulated insulin uptake. Of note, in contrast to the results observed previously with either high concentrations of NO donor (≥10 μmol/L _S_-nitrosoglutathione) (18) or endogenously produced NO through the activation of inducible NOS by cytokine stimulation (19) in which the higher concentration of NO actually inhibited Txnip expression, we observed in the present study that adding insulin modestly, but significantly (P < 0.05), increased Txnip staining (i.e., enhanced protein _S_-nitrosylation) and that adding low concentrations of SNP with insulin further enhanced Txnip staining (Fig. 6_C_ [_right_], E, F [_top row_], G,and I and Fig. 5_A_ and B) and corresponded to a significant increase in insulin uptake (Fig. 6_C_ [_left_], D, F [_middle row_], and H). In addition, the mRNA of Txnip expression was not affected by these treatments (Fig. 6_J_), suggesting that these treatments may have attenuated the rapid turnover of Txnip (19). Conversely, knockdown of Txnip (which would be expected to reduce protein _S_-nitrosylation) (Fig. 6_C_ [_right_] and E) reduced insulin uptake (Fig. 6_C_ [_left_] and D). These data indicate that the NO-mediated protein _S_-nitrosylation plays a critical role in the regulation of insulin uptake.
The mechanism by which protein _S_-nitrosylation regulates insulin uptake is not clear. PTP1B plays a critical role in the inhibition of intracellular insulin signaling. Insulin signaling begins with tyrosine phosphorylation of the insulin receptor and subsequent tyrosine phosphorylation of its primary substrates, the IRS proteins. PTP1B dephosphorylates these proteins to reduce their activity. In this way, intracellular insulin signaling is balanced. Increasing evidence demonstrates that PTP1B activity under normal metabolic conditions is tightly regulated by oxidation/reduction reactions, including _S_-nitrosylation/denitrosylation involving the cysteine thiol moiety required for catalysis (41). Moreover, studies by us and others (12,14,26) have demonstrated that inhibiting insulin signaling significantly reduces insulin transport, whereas enhancing insulin signaling by inhibition of PTP1B significantly increases insulin uptake (12). In the current study, we used an in situ detection of protein _S_-nitrosylation combined with the immunohistochemical staining for PTP1B in ECs freshly harvested from rat aorta and found that NO not only increases protein _S_-nitrosylation, but also increases the colocalization of S-NO and PTP1B as well as enhances insulin-stimulated Akt phosphorylation at Ser473, a marker for enhanced insulin signaling through the IRS1/2-PI3K-Akt pathway. We also noted that cotreatment with SNP and insulin inhibits PTP1B activity in cultured aortic ECs. These new findings, combined with our previous report (12) that the inhibition of PTP1B enhances insulin uptake, indicate that the effects of NO observed in the present study may be mediated, at least in part, by the inactivation of PTP1B possibly through its _S_-nitrosylation (Fig. 8). The ability of NO to completely restore insulin uptake that had been inhibited by the Src kinase inhibitor PP1 is consistent with this hypothesis because Src activity is tightly regulated by PTP1B (41). Further studies are warranted to thoroughly clarify this complex mechanism. Taken together, the current data suggest that several pathways of NO-regulated signaling are required for NO-stimulated insulin uptake.
In summary, we report what we believe to be the first observations that NO can directly act on arterial ECs to promote insulin uptake and TETunder both physiological and pathophysiological conditions. Beyond that, the findings suggest a significant role for protein _S_-nitrosylation in the action of NO on insulin uptake and transport. Inhibition of PTP1B possibly induced by its _S_-nitrosylation appears to significantly contribute to NO-stimulated endothelial insulin uptake and transport.
Supplementary Material
Supplementary Data
ACKNOWLEDGMENTS
This work was supported by research grants from the National Institutes of Health (DK-057878 and DK-073059) and American Diabetes Association (11-BS6) to E.J.B.
No potential conflicts of interest relevant to this article were reported.
H.W. designed the study, conducted the experiments, performed the data analyses, and wrote the manuscript. A.X.W. and K.A. conducted the experiments. E.J.B. contributed to the discussion and reviewed and edited the manuscript. H.W. is the guarantor of this work and, as such, had full access to all the data in the study and takes responsibility for the integrity of the data and the accuracy of the data analysis.
Parts of this study were presented in abstract form at the 73rd Scientific Sessions of the American Diabetes Association, Chicago, Illinois, 21–25 June 2013.
Footnotes
See accompanying commentary, p. 4006.
REFERENCES
- 1.Baron AD, Steinberg H, Brechtel G, Johnson A. Skeletal muscle blood flow independently modulates insulin-mediated glucose uptake. Am J Physiol 1994;266:E248–E253 [DOI] [PubMed] [Google Scholar]
- 2.Vincent MA, Clerk LH, Lindner JR, et al. Microvascular recruitment is an early insulin effect that regulates skeletal muscle glucose uptake in vivo. Diabetes 2004;53:1418–1423 [DOI] [PubMed] [Google Scholar]
- 3.King GL, Johnson SM. Receptor-mediated transport of insulin across endothelial cells. Science 1985;227:1583–1586 [DOI] [PubMed] [Google Scholar]
- 4.Wang H, Liu Z, Li G, Barrett EJ. The vascular endothelial cell mediates insulin transport into skeletal muscle. Am J Physiol Endocrinol Metab 2006;291:E323–E332 [DOI] [PubMed] [Google Scholar]
- 5.Yang YJ, Hope ID, Ader M, Bergman RN. Insulin transport across capillaries is rate limiting for insulin action in dogs. J Clin Invest 1989;84:1620–1628 [DOI] [PMC free article] [PubMed] [Google Scholar]
- 6.Miles PD, Levisetti M, Reichart D, Khoursheed M, Moossa AR, Olefsky JM. Kinetics of insulin action in vivo. Identification of rate-limiting steps. Diabetes 1995;44:947–953 [DOI] [PubMed] [Google Scholar]
- 7.Miles PD, Li S, Hart M, et al. Mechanisms of insulin resistance in experimental hyperinsulinemic dogs. J Clin Invest 1998;101:202–211 [DOI] [PMC free article] [PubMed] [Google Scholar]
- 8.Sjöstrand M, Gudbjörnsdottir S, Holmäng A, Lönn L, Strindberg L, Lönnroth P. Delayed transcapillary transport of insulin to muscle interstitial fluid in obese subjects. Diabetes 2002;51:2742–2748 [DOI] [PubMed] [Google Scholar]
- 9.Shankar RR, Wu Y, Shen HQ, Zhu JS, Baron AD. Mice with gene disruption of both endothelial and neuronal nitric oxide synthase exhibit insulin resistance. Diabetes 2000;49:684–687 [DOI] [PubMed] [Google Scholar]
- 10.Laakso M, Edelman SV, Brechtel G, Baron AD. Impaired insulin-mediated skeletal muscle blood flow in patients with NIDDM. Diabetes 1992;41:1076–1083 [DOI] [PubMed] [Google Scholar]
- 11.Schnitzer JE, Oh P, Pinney E, Allard J. Filipin-sensitive caveolae-mediated transport in endothelium: reduced transcytosis, scavenger endocytosis, and capillary permeability of select macromolecules. J Cell Biol 1994;127:1217–1232 [DOI] [PMC free article] [PubMed] [Google Scholar]
- 12.Wang H, Wang AX, Liu Z, Barrett EJ. Insulin signaling stimulates insulin transport by bovine aortic endothelial cells. Diabetes 2008;57:540–547 [DOI] [PubMed] [Google Scholar]
- 13.Wang H, Wang AX, Barrett EJ. Caveolin-1 is required for vascular endothelial insulin uptake. Am J Physiol Endocrinol Metab 2011;300:E134–E144 [DOI] [PMC free article] [PubMed]
- 14.Wang H, Wang AX, Barrett EJ. Insulin-induced endothelial cell cortical actin filament remodeling: a requirement for trans-endothelial insulin transport. Mol Endocrinol 2012;26:1327–1338 [DOI] [PMC free article] [PubMed] [Google Scholar]
- 15.Wang H, Wang AX, Liu Z, Chai W, Barrett EJ. The trafficking/interaction of eNOS and caveolin-1 induced by insulin modulates endothelial nitric oxide production. Mol Endocrinol 2009;23:1613–1623 [DOI] [PMC free article] [PubMed]
- 16.Taghibiglou C, Rashid-Kolvear F, Van Iderstine SC, et al. Hepatic very low density lipoprotein-ApoB overproduction is associated with attenuated hepatic insulin signaling and overexpression of protein-tyrosine phosphatase 1B in a fructose-fed hamster model of insulin resistance. J Biol Chem 2002;277:793–803 [DOI] [PubMed]
- 17.Cirino G, Fiorucci S, Sessa WC. Endothelial nitric oxide synthase: the Cinderella of inflammation? Trends Pharmacol Sci 2003;24:91–95 [DOI] [PubMed] [Google Scholar]
- 18.Schulze PC, Liu H, Choe E, et al. Nitric oxide-dependent suppression of thioredoxin-interacting protein expression enhances thioredoxin activity. Arterioscler Thromb Vasc Biol 2006;26:2666–2672 [DOI] [PubMed]
- 19.Forrester MT, Seth D, Hausladen A et al. Thioredoxin-interacting protein (Txnip) is a feedback regulator of S-nitrosylation. J Biol Chem 2009;284:36160–36166 [DOI] [PMC free article] [PubMed]
- 20.Zhao Y, Brandish PE, Di Valentin M, Schelvis JP, Babcock GT, Marletta MA. Inhibition of soluble guanylate cyclase by ODQ [published correction appears in Biochemistry 2012;51:9593]. Biochemistry 2000;39:10848–10854 [DOI] [PubMed] [Google Scholar]
- 21.Chen H, Levine YC, Golan DE, Michel T, Lin AJ. Atrial natriuretic peptide-initiated cGMP pathways regulate vasodilator-stimulated phosphoprotein phosphorylation and angiogenesis in vascular endothelium. J Biol Chem 2008;283:4439–4447 [DOI] [PubMed]
- 22.Feelisch M, Kotsonis P, Siebe J, Clement B, Schmidt HH. The soluble guanylyl cyclase inhibitor 1H-[1,2,4]oxadiazolo[4,3,-a] quinoxalin-1-one is a nonselective heme protein inhibitor of nitric oxide synthase and other cytochrome P-450 enzymes involved in nitric oxide donor bioactivation. Mol Pharmacol 1999;56:243–253 [DOI] [PubMed] [Google Scholar]
- 23.Forrester MT, Thompson JW, Foster MW, Nogueira L, Moseley MA, Stamler JS. Proteomic analysis of S-nitrosylation and denitrosylation by resin-assisted capture. Nat Biotechnol 2009;27:557–559 [DOI] [PMC free article] [PubMed]
- 24.Anderson EJ, Lustig ME, Boyle KE, et al. Mitochondrial H2O2 emission and cellular redox state link excess fat intake to insulin resistance in both rodents and humans. J Clin Invest 2009;119:573–581 [DOI] [PMC free article] [PubMed] [Google Scholar]
- 25.St-Pierre P, Genders AJ, Keske MA, Richards SM, Rattigan S. Loss of insulin-mediated microvascular perfusion in skeletal muscle is associated with the development of insulin resistance. Diabetes Obes Metab 2010;12:798–805 [DOI] [PubMed] [Google Scholar]
- 26.Kubota T, Kubota N, Kumagai H, et al. Impaired insulin signaling in endothelial cells reduces insulin-induced glucose uptake by skeletal muscle. Cell Metab 2011;13:294–307 [DOI] [PubMed] [Google Scholar]
- 27.Rizzo NO, Maloney E, Pham M, et al. Reduced NO-cGMP signaling contributes to vascular inflammation and insulin resistance induced by high-fat feeding. Arterioscler Thromb Vasc Biol 2010;30:758–765 [DOI] [PMC free article] [PubMed] [Google Scholar]
- 28.Laakso M, Edelman SV, Brechtel G, Baron AD. Decreased effect of insulin to stimulate skeletal muscle blood flow in obese man. A novel mechanism for insulin resistance. J Clin Invest 1990;85:1844–1852 [DOI] [PMC free article] [PubMed] [Google Scholar]
- 29.Krotkiewski M, Bylund-Fallenius AC, Holm J, Björntorp P, Grimby G, Mandroukas K. Relationship between muscle morphology and metabolism in obese women: the effects of long-term physical training. Eur J Clin Invest 1983;13:5–12 [DOI] [PubMed] [Google Scholar]
- 30.Balletshofer BM, Rittig K, Enderle MD, et al. Endothelial dysfunction is detectable in young normotensive first-degree relatives of subjects with type 2 diabetes in association with insulin resistance. Circulation 2000;101:1780–1784 [DOI] [PubMed] [Google Scholar]
- 31.Petrie JR, Ueda S, Webb DJ, Elliott HL, Connell JM. Endothelial nitric oxide production and insulin sensitivity. A physiological link with implications for pathogenesis of cardiovascular disease. Circulation 1996;93:1331–1333 [DOI] [PubMed] [Google Scholar]
- 32.Kim JA, Montagnani M, Koh KK, Quon MJ. Reciprocal relationships between insulin resistance and endothelial dysfunction: molecular and pathophysiological mechanisms. Circulation 2006;113:1888–1904 [DOI] [PubMed] [Google Scholar]
- 33.Doronzo G, Viretto M, Russo I, et al. Nitric oxide activates PI3-K and MAPK signalling pathways in human and rat vascular smooth muscle cells: influence of insulin resistance and oxidative stress. Atherosclerosis 2011;216:44–53 [DOI] [PubMed] [Google Scholar]
- 34.Huang AL, Vita JA. Effects of systemic inflammation on endothelium-dependent vasodilation. Trends Cardiovasc Med 2006;16:15–20 [DOI] [PMC free article] [PubMed] [Google Scholar]
- 35.Zhang J, Patel JM, Li YD, Block ER. Proinflammatory cytokines downregulate gene expression and activity of constitutive nitric oxide synthase in porcine pulmonary artery endothelial cells. Res Commun Mol Pathol Pharmacol 1997;96:71–87 [PubMed] [Google Scholar]
- 36.Li G, Barrett EJ, Barrett MO, Cao W, Liu Z. Tumor necrosis factor-alpha induces insulin resistance in endothelial cells via a p38 mitogen-activated protein kinase-dependent pathway. Endocrinology 2007;148:3356–3363 [DOI] [PubMed] [Google Scholar]
- 37.Kim F, Pham M, Maloney E, et al. Vascular inflammation, insulin resistance, and reduced nitric oxide production precede the onset of peripheral insulin resistance. Arterioscler Thromb Vasc Biol 2008;28:1982–1988 [DOI] [PMC free article] [PubMed] [Google Scholar]
- 38.Murad F. Shattuck Lecture. Nitric oxide and cyclic GMP in cell signaling and drug development. N Engl J Med 2006;355:2003–2011 [DOI] [PubMed] [Google Scholar]
- 39.Seth D, Stamler JS. The SNO-proteome: causation and classifications. Curr Opin Chem Biol 2011;15:129–136 [DOI] [PMC free article] [PubMed] [Google Scholar]
- 40.Hill BG, Bhatnagar A. Protein S-glutathiolation: redox-sensitive regulation of protein function. J Mol Cell Cardiol 2012;52:559–567 [DOI] [PMC free article] [PubMed] [Google Scholar]
- 41.Yip SC, Saha S, Chernoff J. PTP1B: a double agent in metabolism and oncogenesis. Trends Biochem Sci 2010;35:442–449 [DOI] [PMC free article] [PubMed]
- 42.Barrett EJ, Wang H, Upchurch CT, Liu Z. Insulin regulates its own delivery to skeletal muscle by feed-forward actions on the vasculature. Am J Physiol Endocrinol Metab 2011;301:E252–E263 [DOI] [PMC free article] [PubMed] [Google Scholar]
Associated Data
This section collects any data citations, data availability statements, or supplementary materials included in this article.
Supplementary Materials
Supplementary Data
