Constitutive histone H2AX phosphorylation and ATM activation are strongly amplified during mitogenic stimulation of lymphocytes (original) (raw)
Abstract
Abstract. Objectives: We recently postulated that constitutive activation of Ataxia Telangiectasia, Mutated (CAA) and constitutive histone H2AX phosphorylation (CHP) seen in cells not treated with genotoxic agents are the events triggered by DNA damage caused by endogenous reactive oxygen species (ROS), the product of mitochondrial oxidative metabolism. The aim of this study was to seek further evidence in support of this postulate, namely to test whether the levels of CAA and CHP correlate with cells metabolic activity. Materials & Methods: Peripheral blood lymphocytes are non‐cycling (G0) cells characterized by minimal rate of oxidative metabolism. A dramatic rise in transcriptional and translational activity, an increase in number of mitochondria, and induction of DNA replication, occur during their mitogenic stimulation. This classic model of cell activation was chosen to study a possible correlation between CAA and CHP versus metabolic activity and generation of ROS. Results: The levels of CAA and CHP in lymphocytes were increased many‐fold during their stimulation. This increase was paralleled by the rise in extent of endogenously generated ROS. The growth of stimulated lymphocytes in the presence glucose antimetabolite 2‐deoxy‐D‐glucose led to markedly lowered translational activity, decreased ROS generation and correspondingly attenuated CHA and CAA. Conclusions: The present data are consistent with our postulate that CHP and CAA report DNA damage by endogenous oxidants whose level correlates with metabolic activity. Because cumulative DNA damage by ROS generated via oxidative metabolism is considered the key mechanism responsible for cell ageing and senescence the data imply that these processes are delayed in G0 quiescent lymphocytes or stem cells as compared with proliferating cells.
INTRODUCTION
In humans, DNA damage in live cells, particularly if it entails formation of DNA double‐strand breaks (DSBs), provides a signal for phosphorylation of histone H2AX on _Ser_139 (Rogakou et al. 1998; Sedelnikova et al. 2002). The phosphorylation is mediated by the PI‐3–like kinases ataxia telangiectasia mutated (ATM)‐ (Burma et al. 2001), ataxia‐telangiectasia‐mutated and Rad3‐related (ATR)‐ (Anderson et al. 2001) and/or DNA‐dependent protein kinase (DNA‐PK) (Park et al. 2003), and occurs in nucleosomes along a megabase domain of DNA on each flank of the DSB. Histone H2AX phosphorylated on _Ser_139, defined as γH2AX (Rogakou et al. 1999), can be detected immunocytochemically; it presents in the form of discrete nuclear immunofluorescent (IF) foci (1998, 1999; Sedelnikova et al. 2002). Numerous signalling and repair proteins including the M/R/N complex (Mre11/Rad50/Nbs1), Brca1 and the p53 binding protein 1 (53BP1) colocalize in these foci with γH2AX (Paull et al. 2000; Downs & Cote 2005; Foster & Downs 2005; Paull & Lee 2005). Cytometric assay of γH2AX, combined with analysis of cellular DNA content, has been used to assess DNA damage caused by genotoxic agents such as ionizing radiation (Banath & Olive 2003; Olive 2004; Halicka et al. 2005), anti‐tumour drugs (2003, 2004, 2005; Tanaka et al. 2006b) or presumed carcinogens (Albino et al. 2004), in relation to the cell cycle phase and initiation of apoptosis.
It should be noted, however, that H2AX is phosphorylated during physiological recombinatorial events such as in V(D)J and class‐switch recombination in the course of development of the immune system, and also during meiosis (Modesti & Kanaar 2001; Fernandez‐Capetillo et al. 2002; Sedelnikova et al. 2003). Massive H2AX phosphorylation also occurs in response to DNA fragmentation during apoptosis; its level is well above that induced by exogenous genotoxic agents (2003, 2004, 2005).
Activation of human ATM through its phosphorylation on Ser 1981, is an early response to DNA damage, and, as mentioned, H2AX is one of the substrates of this kinase (Zhou & Elledge 2000; Ward et al. 2004; Lee & Paull 2005). Whereas H2AX can be phosphorylated by ATR or DNA‐PK in response to other types of DNA damage, H2AX phosphorylation, when mediated by ATM, appears to be a quite specific reporter of the induction of DSBs (Ward et al. 2004; Abraham & Tibbetts 2005). Similar to H2AX phosphorylation, activation of ATM can be detected immunocytochemically using an antibody (Ab) reactive with the Ser 1981‐phosphorylated epitope (Bartkova et al. 2005; 2005, 2006a). The immunocytochemical detection of γH2AX concurrent with ATM‐S1981P using Abs tagged with a fluorochrome of the same emission provides a very sensitive assay of DNA damage that involves DSBs (Tanaka et al. 2006b).
It has been reported that in untreated cells of both normal and tumour lines, a fraction of the histone H2AX molecules remain phosphorylated (MacPhail et al. 2003; Huang et al. 2006b). The level of this constitutive H2AX phosphorylation (CHP) varies in lines of different cell types and is also related to cell cycle phase (Huang et al. 2006b). Constitutive activation of ATM (CAA) also takes place in cells of different lineage, and as with CHP, the CAA varies depending on cell type and cell cycle phase (2006a, 2006c). The level of CHP and CAA was reported to be distinctly higher (30–60%) in the cells with wt TP53 than with mutated or null TP53, suggesting that TP53 may facilitate DNA repair by enhancing the cell's capability to phosphorylate H2AX (Tanaka et al. 2006c). It should be noted, however, that the mechanisms of CHP and CAA are different in interphase and in mitotic cells (Ichijima et al. 2005; McManus & Hendzel 2005; Oricchio et al. 2006). Whereas CHP and CAA in interphase cells most likely reflect a response to DNA damage that may involve the presence of DSBs, in mitotic cells these events may be associated with topological stress on the DNA double helical structure associated with chromatin condensation (Huang et al. 2006a).
Several observations strongly suggested that CHP and CAA observed in interphase cells, to a large degree, reflect ongoing oxidative DNA damage induced by endogenous oxidants generated during metabolic activity. Thus, the extent of CHP and CAA has been seen to be markedly reduced in cells grown in the presence of the reactive oxygen species (ROS) scavenger N‐acetyl‐L‐cysteine (NAC) and enhanced by inhibition of glutathione synthesis. Furthermore, inhibition of glycolysis by cell growth in the presence of the glucose anti‐metabolite 2‐deoxy‐D‐glucose (2‐DG) led to a marked decrease in the levels of CHP and CAA (Tanaka et al. 2006d). These levels were also distinctly reduced in cells growing at confluency, a condition known to reduce metabolic activity (Tanaka et al. 2006a).
To further explore the relationship between CHP and CAA versus metabolic status of the cell, we compared CHP and CAA levels in quiescent (G0) cells with the levels in the lymphocytes induced to proliferate. We have chosen the experimental model of mitogenic stimulation of peripheral blood lymphocytes by the polyvalent mitogen phytohaemagglutinin (PHA). This model, which has been extensively studied over the last four decades (Darzynkiewicz et al. 1965; Darzynkiewicz et al. 1976; Darzynkiewicz et al. 1981), represents a classic example of quiescent cells with minimal metabolic activity, that when mitogenically stimulated, dramatically increase their mitochondrial activity and their rate of transcription and translation, then replicate DNA and divide.
MATERIALS AND METHODS
Lymphocyte cultures
Human peripheral blood lymphocytes, obtained from healthy volunteers (men, 50–70 years old) by venipuncture, were isolated by density gradient centrifugation as described previously (Halicka et al. 2002). The cells were washed twice with phosphate‐buffered saline (PBS) and resuspended in RPMI‐1640 supplemented with 10% foetal bovine serum, 100 units/ml of penicillin, 100 g/ml streptomycin and 2 mm l‐glutamine (all from Gibco/BRL Life Technologies, Inc., Grand Island, N.Y.) at a density of about 5 × 10⁵ cells/ml. The cells were then treated with 10 µg/m of PHA (Sigma Chemical Co., St. Louis MO) and were incubated in 25‐ml (12.5 cm2) polystyrene flasks (Becton Dickinson, Franklin Lakes, NJ) in a mixture of 95% air and 5% carbon dioxide at 37.5 °C for 24, 48 or 72 h as described in legends to figures and tables. Some cultures were left untreated with PHA, whereas other lymphocyte samples were analysed immediately after isolation, without having been cultured. 2‐deoxy‐D‐glucose (2‐DG) (Sigma) was included in some cultures of PHA‐stimulated lymphocytes at a final concentration of 5 mm at 0, 24 or 48 h after administration of PHA. All experiments were run and analysed in duplicate and were repeated at least twice, yielding essentially similar results.
Analysis of cellular RNA and DNA content
The assay employing the metachromatic dye acridine orange (AO) has been used to differentially stain cellular RNA and DNA (Darzynkiewicz et al. 1976; Darzynkiewicz 1994). The cells were stained with AO under conditions in which cellular DNA stains orthochromatically, emitting green fluorescence (about 530 nm), whereas interactions of AO with RNA result in metachromatic red fluorescence (> 630 nm). Following staining with AO the intensity of cellular green and red fluorescence was measured using a FACScan flow cytometer (Becton Dickinson, San Jose, CA) with standard settings of green (FL1) and red (FL3) fluorescence detection. Details of the methodology are presented elsewhere (Darzynkiewicz 1994).
Immunocytochemical detection of γH2AX and activated ATM
Following incubation with PHA, the cells were fixed in suspension in a solution of 1% methanol‐free formaldehyde (Polysciences, Inc., Warrington, PA) dissolved in PBS for 15 min on ice followed by suspension in 80% ethanol, and stored at −20 °C for 2–24 h. Cells were then washed twice in PBS and suspended in a 1% (w/v) solution of bovine serum albumin (BSA; Sigma) in PBS for 30 min to suppress non‐specific antibody binding. The cells were then incubated in 100 µl of 1% BSA containing 1 : 100 diluted anti‐phospho‐histone H2AX (_Ser‐_139) mAb (Upstate, Lake Placid, NY) or anti‐phospho‐ATM (_Ser‐_1981) Ab (1 : 100) (both from Millipore, Temecula, CA), and incubated for 2 h at room temperature. They were then rinsed with 1% BSA in PBS (200 g, 5 min) and, after centrifugation, the cell pellets were resuspended in 100 µl of 1% BSA containing FITC‐conjugated anti‐mouse goat F(ab′)2 fragment (DAKO, Carpinteria, CA, 1 : 30) for 30 min at room temperature in the dark. After washing with 1% BSA, the cells were counterstained with 10 µg/ml propidium iodide (PI, Molecular Probes, Eugene, OR) dissolved in PBS containing 100 µg/ml RNase A (Sigma) for 30 min at room temperature. The fluorescence of cells subjected to immunocytochemical detection of γH2AX and activated ATM was measured either by flow cytometry or by laser scanning cytometry (LSC – iCys; Darzynkiewicz et al. 1999), as described before (Huang et al. 2006a).
Intracellular ROS
The intracellular level of ROS was measured with the fluorescence probe, carboxyl‐dichlorodihydrofluorescein diacetate (H2DCF‐DA; Molecular Probes, Eugene, OR.) Briefly, the cells were washed twice with PBS, then re‐suspended in pre‐warmed PBS containing 10 m H2DCF‐DA and incubated at 37 °C for 30 min or 1 h. The cells were then washed and re‐suspended in PBS, and their green (FL1) fluorescence was immediately measured using a FACScan flow cytometer.
RESULTS
The data shown in Fig. 1 indicate that the non‐stimulated G0 lymphocytes exhibited minimal γH2AX IF, just slightly above the level of non‐specific fluorescence of the cells stained with the irrelevant IgG isotypic Ab, which served as a negative control (0 h). Their mitogenic stimulation led to a dramatic elevation in the level of H2AX phosphorylation concomitant with an increase in cellular DNA content, the marker of progression through S and G2M phases of the cell cycle. Thus, in cultures treated with PHA for 48 h (or for 72 h, not shown) a large proportion of cells expressed γH2AX at levels many‐fold higher than that of the non‐stimulated cells; the G1 cells from the 72‐h PHA culture had nearly 10‐fold (145.0 versus 15.5) higher mean γH2AX IF compared to G0 cells. The difference was even greater for the S and G2M cell populations whose mean γH2AX IF was about 17‐fold (263.4 versus 15.5) and 27‐fold (418.8 versus 15.5) higher, respectively, compared to unstimulated G0 cells. DNA content frequency histograms shown as insets in Fig. 1 demonstrate that 48 and 72 h after administration of PHA, the cells were distributed in all phases of the cycle, with a prominent proportion of cells in S and G2M phase. In the images displaying immunocytochemical detection of γH2AX, when the exposure time was adjusted to visualize its presence in mitogenically stimulated lymphocytes, the non‐stimulated cells were essentially unlabelled (Fig. 2).
Figure 1.
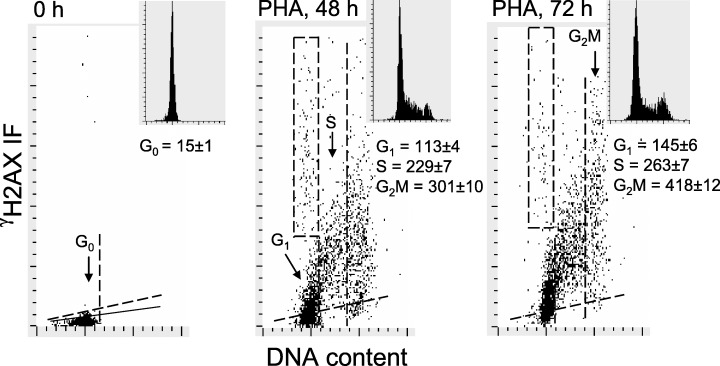
The increase in CHP level during mitogenic stimulation of lymphocytes. Bivariate distributions (scatterplots) of cellular DNA content versus γH2AX IF of non‐stimulated peripheral blood lymphocytes (0 h) and lymphocytes stimulated by PHA in 48‐h and 72‐h cultures. The skewed dashed line represents the upper level of γH2AX IF for over 97% of the non‐stimulated cells. Solid skewed lines show the maximal level of fluorescence of the cells stained with an irrelevant IgG isotypic Ab (negative control). The vertical dashed lines show the gates used to separate G0/1, S and G2M cell subpopulations to obtain their mean values of γH2AX IF. The rectangular (dashed‐line) gate shows the position of apoptotic cells identified by their relocation and imaging by LSC (Bedner et al. 1999). DNA content histograms are presented as insets in the respective panels. The mean values of γH2AX IF for G0, G1, S and G2M cell populations are listed under the respective DNA histograms. The mean value for the G1 cell population (in panels showing PHA 48 and 72 h cells) was estimated excluding both the G0 cells (below the dashed line) and apoptotic cells (within the rectangular gates).
Figure 2.
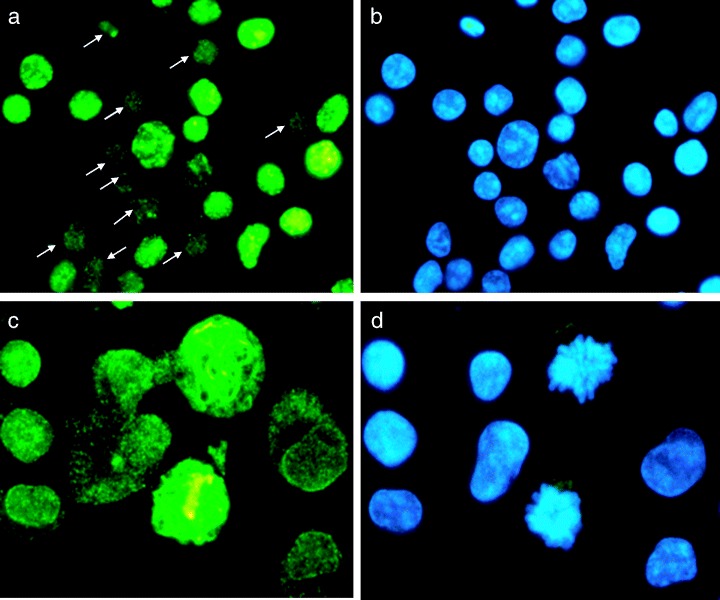
Expression of γH2AX and ATM in lymphocytes mitogenically stimulated with PHA for 48 h. The left panels show images of cells in which γH2AX (a) or ATM (c) were detected immunocytochemically, whereas the right panels show the same cells stained with DAPI to label DNA. Note that the small (G0) lymphocytes (marked by arrows in a) are essentially γH2AX‐negative, whereas large cells show distinct nuclear γH2AX‐immunofluorescence. Interestingly in mitotic cells, ATM localization is in characteristic structures that resemble the mitotic apparatus of these cells (c) (Nikon Microphpot FXA, Obj. 40x (a,b); 60x (c,d).
Changes in the level of expression of total ATM and of ATM‐S1981P during mitogenic stimulation of lymphocytes are shown in Fig. 3. Most G0 lymphocytes were characterized by low expression of total ATM, which, however, upon stimulation with PHA, became markedly elevated (Table 1). It is apparent that the level of total ATM in the majority of G1, S and G2M cells was distinctly higher than its level in G0 cells (Fig. 3, the cells displayed in the scatterplot above the skewed dashed line). Expression of ATM‐S1981P in G0 cells on the other hand, unlike the expression of total ATM, was essentially undetectable (fluorescence intensity at the level of negative control). However, after stimulation, the level of ATM‐S1981P IF dramatically increased and was high in cells progressing through all phases of the cell cycle (Fig. 3, Table 1). In PHA‐stimulated interphase cells ATM‐S1981P IF was localized in discrete nuclear foci, whereas in mitotic cells it appeared in the cytoplasm and at particularly high density in centrosomes, as describe elsewhere (not shown; see Oricchio et al. 2006). ATM IF in interphase cells was also localized in the nuclei, where unlike in ATM‐S1981P IF, it was distributed rather uniformly. In some cells, the ATM IF was also localized in the cytoplasm. Interestingly, however, in mitotic cells, ATM exhibited very characteristic localization in the fibrillar structures resembling mitotic apparatus, as well as in centrosomes (Fig. 2c).
Figure 3.
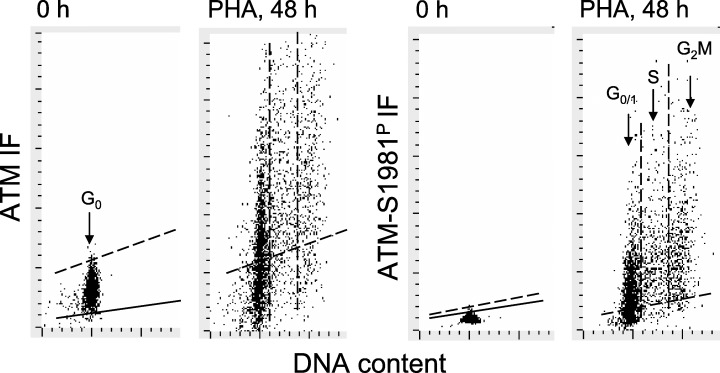
Increased expression of ATM and ATM‐S1981P during mitogenic stimulation of lymphocytes. Bivariate distributions of cellular DNA content versus ATM IF and DNA content versus ATM‐S1981P IF of non‐stimulated peripheral blood lymphocytes (0 h) and lymphocytes stimulated by PHA for 48 h in culture. The skewed dashed lines represent the upper level of ATM IF or ATM‐S1981P IF for over 97% of the non‐stimulated cells. Solid skewed lines show the maximal level of fluorescence of cells stained with the irrelevant IgG isotypic Ab. The vertical dashed lines indicate how the gates were used to separate G0/1, S and G2M cell subpopulations to obtain their mean values of ATM‐S1981P IF, which are presented in Table 1. The measurements were made by LSC.
Table 1.
Increase in expression of ATM and ATM phosphorylation on Ser 1981 during mitogenic stimulation of lymphocytes
| Detected protein | G0 | G0/1 | S | G2M |
|---|---|---|---|---|
| ATM IF | 125.0 ± 2.1 | 236.5 ± 5.8 | 431.2 ± 6.1 | 484.3 ± 9.1 |
| ATM‐S1981P IF | 38.2 ± 0.9 | 125.2 ± 4.3 | 242.0 ± 4.8 | 283.6 ± 6.1 |
Growth of PHA‐stimulated lymphocytes in the presence of 5 mm 2‐DG led to a marked decrease in the level of CHP, and even greater depression in the level of CAA (Fig. 4, Table 2). For example, after 24 h incubation with 2‐DG, the mean value of γH2AX IF of S‐phase cells was reduced by 45% (from 310.3 to 172.2), whereas the mean value of ATM‐S1981P was reduced by 64% (from 260.1 to 94.6). Decrease in the level of expression of γH2AX IF or ATM‐S1981P was observed for cells in all phases of the cycle. However, it should be noted that in cultures of PHA‐stimulated lymphocytes to which 2‐DG was added for 24 or 48 h, cell proliferation was distinctly suppressed, as was apparent from the reduction in frequency of S‐ and G2M‐phase cells in the DNA content histograms (Fig. 4, insets). We also observed that administration of 5 mm 2‐DG to cultures of stimulated lymphocytes for a relatively short period of time (4–8 h), whereas had no apparent effect on cell cycle distribution, it distinctly reduced (by 15–20%) the level of CHP and CAA (data not shown).
Figure 4.
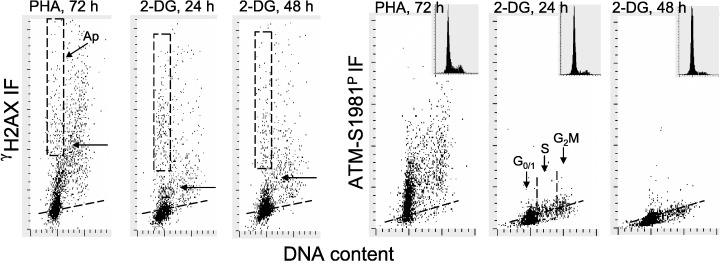
Effect of growth of PHA‐stimulated lymphocytes in the presence of 2‐DG on the level of CHP and CAA. Lymphocytes were stimulated with PHA at time 0 and maintained in culture for 72 h either in the absence of 2‐DG (PHA, 72 h) or with 2‐DG that was included at 5 mm concentration for the final 24 h (2‐DG, 24 h) or 48 h (2‐DG, 48 h). Expression of cellular γH2AX or ATM‐S1981P was detected immunocytochemically and was measured by LSC concurrently with DNA content. The rectangular dashed‐line gates in the γH2AX IF versus DNA content bivariate distributions show the position of apoptotic cells (Ap), identified by their relocation and imaging in LSC (Bedner et al. 1999). The skewed dashed lines show the upper limit (for 97% cells) of γH2AX IF or ATM‐S1981P IF of the non‐stimulated G0 cells. The arrows in the γH2AX IF versus DNA content scatterplots show the level of mean γH2AX IF of the S‐phase cells. Insets show DNA content frequency histograms from these cultures.
Table 2.
Effect of 2‐DG on H2AX phosphorylation and ATM activation in PHA‐stimulated lymphocytes
| Detected protein | Cell cycle phase | PHA, 72 h | 2‐DG, 24 h | 2‐DG, 48 h |
|---|---|---|---|---|
| γH2AX IF | G0/1 | 120.2 ± 1.4 | 86.6 ± 0.9 | 106.1 ± 1.0 |
| S | 310.3 ± 5.2 | 172.2 ± 5.5 | 220.1 ± 6.4 | |
| G2M | 464.9 ± 10.5 | 245.8 ± 10.3 | 301.8 ± 11.9 | |
| ATM‐S1981P IF | G0/1 | 184.1 ± 2.7 | 77.3 ± 1.1 | 62.2 ± 1.2 |
| S | 260.1 ± 5.6 | 94.6 ± 2.5 | 81.2 ± 2.2 | |
| G2M | 339.6 ± 8.5 | 112.9 ± 3.1 | 98.0 ± 2.6 |
Culturing PHA‐stimulated lymphocytes in the presence of 2‐DG also led to a reduction in the content of their RNA, concurrent with suppression of proliferation (as evidenced by a decrease in proportion of cells in S and G2M) compared to their counterparts that grew in the absence of this anti‐metabolite (Fig. 5). The effects depended on the duration of exposure to 2‐DG and were most pronounced when 2‐DG was added at the onset of the cultures (2‐DG, 72 h). The decrease in RNA content was comparable between cells in all phases of the cell cycle.
Figure 5.
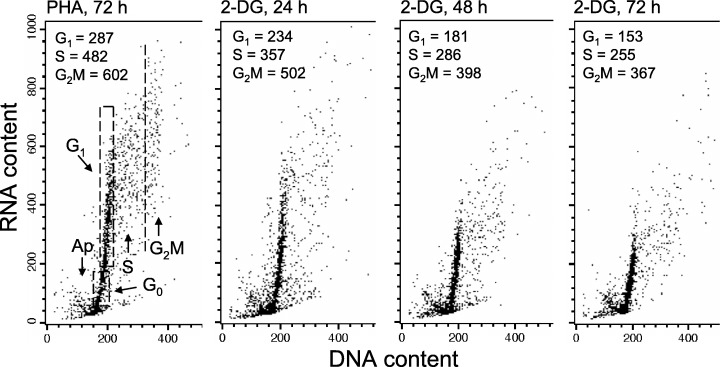
Effect of growth of PHA‐stimulated lymphocytes in the presence of 2‐DG on their RNA content in relation to cell cycle phase. Lymphocytes were stimulated with PHA at time 0 and were grown in the absence (PHA, 72 h) or presence of 5 mm 2‐DG, which was included into cultures for the final 24 h (2‐DG, 24 h), 48 h (2‐DG, 48 h) or 72 h (2‐DG, 72 h). Cellular DNA and RNA were differentially stained with the metachromatic fluorochrome AO, and were measured by flow cytometry as described elsewhere (1994, 1976). Based on differences in cellular DNA and RNA content, several cell subpopulations were identified as marked in the left (PHA, 72 h) panel. The mean values of RNA content for the G1, S and G2M cell subpopulations were estimated by gating analysis and are listed in each panel.
Figure 6 illustrates the level of ROS in PHA‐stimulated lymphocytes that were grown in the presence or absence of 2‐DG for 24, 48 or 72 h. The ROS level in these cells was detected by their ability to oxidize H2DCF‐DA, a probe that becomes fluorescent upon oxidation (Sheng‐Tanner et al. 1998). The cells maintained in the absence of 2‐DG displayed a bimodal distribution, which presumably reflected the presence of the population of non‐stimulated cells (low H2DCF‐DA fluorescence) and mitogenically stimulated ones (high H2DCF‐DA fluorescence). It is quite evident that, compared with the cells growing with PHA alone, the cells from the cultures containing 2‐DG had a distinctly reduced ability to oxidize this probe. Lymphocytes that were not stimulated with PHA had little ability to oxidize H2DCF‐DA, very much like cells treated with 2‐DG for 72 h (not shown).
Figure 6.

The ability of PHA‐stimulated lymphocytes growing in the absence or presence of 2‐DG to oxidize H2DCF‐DA. Lymphocytes were stimulated with PHA at time 0 and were grown in the absence (PHA, 72 h) or presence of 5 mm 2‐DG, which was included into cultures for the final 24 h (2‐DG, 24 h), 48 h (2‐DG, 48 h) or 72 h (2‐DG, 72 h). The cells were exposed to H2DCF‐DA for 30 min and their green fluorescence was measured by flow cytometry, as described in the Materials and Methods section. Nearly identical distribution was obtained following treatment of cells with H2DCF‐DA for 1 h (not shown).
DISCUSSION
In response to treatment with a polyvalent mitogen such as PHA, a large proportion of peripheral blood lymphocytes are triggered to mitogenic stimulation. However, some cells do not respond to PHA and remain in G0 and relatively few cells (from the G0 cell population) undergo ‘stimulation‐induced apoptosis’ (Halicka et al. 2002). All three cell subpopulations are present for a certain period of time in the cultures. This is the most investigated cell system in which quiescent G0 cells are induced to enter G1, progress through S and G2, divide and re‐enter subsequent cell cycles. The transition from G0 to G1 involves a dramatic rise in the level of transcription (Darzynkiewicz et al. 1965) and translation, resulting in a situation when G1 cells have over 10‐fold higher RNA and protein content than G0 cells (Darzynkiewicz et al. 1976). The G0 to G1 transition also involves a greater than 10‐fold rise in overall metabolic activity, as expressed by increased mitochondrial mass and transmembrane potential (Darzynkiewicz et al. 1981).
We postulated that the level of CHP and CAA reflects the ongoing DNA damage caused by the oxidants produced during metabolic cell activity (2006a, 2006d). Estimates of the extent of DNA damage by endogenous oxidants in proliferating cells vary. According to one, during a single cell cycle of average duration 24 h, about 5000 DNA single‐strand lesions are generated per nucleus and approximately 1% of them become converted to DNA double‐strand breaks (DSBs) at the time of DNA replication (Vilenchik & Knudson 2003). Thus, on average, about 50 DSBs (‘endogenous DSBs’) per nucleus are generated during a single cell cycle in human cells. Recombinatorial repair and non‐homologous DNA‐end joining (NHEJ) are the two pathways for repair of DSBs. The latter is error‐prone, often resulting in deletion of some base pairs (Pastwa & Blasiak 2003; Jeggo & Lobrich 2005). This causes accumulation of defective DNA with each cell cycle, which is considered to be the main mechanism of cell ageing (Beckman & Ames 1997; Gorbunova & Seluanov 2005). If CHP and CAA indeed reflect the DNA damage caused by endogenous metabolic oxidants, it would be expected that their level in non‐stimulated peripheral blood lymphocytes with minimal metabolic activity will be distinctly lower compared to their counterparts induced to proliferate. Indeed, the present data provide clear evidence that lymphocyte stimulation was associated with a dramatic rise in both CHP and CAA (1, 3, Table 1).
The level of CHP and CAA in stimulated lymphocytes was reduced during their growth in the presence of 2‐DG. As shown previously, CHP and CAA in B cell lymphoblastoid TK6, WTK1 and NH32 cells were also markedly attenuated by 2‐DG (Tanaka et al. 2006c). Apparently, the inhibition of glycolysis by 2‐DG, the glucose anti‐metabolite was responsible for the reduction of oxidants responsible for DNA damage, both in normal stimulated lymphocytes as seen in the present study, as well as in lymphoblastoid cell lines (Tanaka et al. 2006c). Indeed, we observed that the level of oxidants directly detected by the H2DCF‐DA probe was distinctly lower in cells treated with 2‐DG than in the untreated ones (Fig. 6). The evidence that lymphocytes grown in the presence of 2‐DG had markedly decreased overall RNA content (Fig. 5), and thus, diminished transcriptional activity, further confirms that the cells grown in the presence of 2‐DG had a reduced metabolic rate. Because over 95% of total cellular RNA is rRNA (Darzynkiewicz 1994), our data demonstrate that the translational machinery was markedly reduced in these cells. It should be pointed out that the RNA content was diminished in 2‐DG treated cells regardless of the phase of the cell cycle (Fig. 5). Likewise, levels of both CHP and CAA also were reduced in all phases of the cell cycle upon treatment with 2‐DG (Fig. 4). These results collectively demonstrate a strong association between the cell's metabolic rate, the level of internal oxidants and the level of CHP and CAA in lymphocytes undergoing mitogenic stimulation. Thus, they provide further evidence that the CHP and CAA detected and measured by multiparameter cytometry, in relation to cell cycle phase, report the extent of DNA damage by endogenous oxidants (Tanaka et al. 2006a).
It has been suggested that, caloric restriction or the use of a ‘caloric restriction mimetic’ such as 2‐DG might lower the extent of DNA damage resulting from oxidative stress (Roth et al. 2005). Reduced oxygen levels (Parrinello et al. 2003) and a decreased rate of accumulation of oxidants in mitochondria (Schriner et al. 2005), have been shown to extend the life span of cells or whole organisms markedly. The present results are fully consistent with these findings and underscore the risk of the cumulative oxidative DNA damage in rapidly proliferating cells. As would be expected, quiescent cells with low metabolic activity such as peripheral blood lymphocytes or non‐proliferating stem cells may have a much lower rate of accumulation of DNA damage as a function of time. Although association between the rate of metabolic activity and extent of oxidative DNA damage has been demonstrated before, for example by analysis of nucleotide oxidation products such as 8‐oxoguanine (Sekiguchi & Tsuzuki 2002), the present findings by providing evidence of ATM activation and H2AX phosphorylation yield more straightforward information about the formation of DSBs. Such lesions are potentially the most deleterious and are likely to be mechanistically involved in cell ageing as well as in pre‐conditioning cells to neoplastic transformation.
ACKNOWLEDGEMENT
This work was supported by grant NCI RO1 CA 28 704. We thank Millipore Corporation for kindly providing free samples of the antibodies used in this study.
REFERENCES
- Abraham RT, Tibbetts RS (2005) Guiding ATM to broken DNA. Science 308, 510–511. [DOI] [PubMed] [Google Scholar]
- Albino AP, Huang X, Yang J, Gietl D, Jorgensen E, Traganos F, Darzynkiewicz Z (2004) Induction of histone H2AX phosphorylation in A549 human pulmonary epithelial cells by tobacco smoke and in human bronchial epithelial cells by smoke condensate: a new assay to detect the presence of potential carcinogens in tobacco. Cell Cycle 3, 1062–1068. [PubMed] [Google Scholar]
- Anderson L, Henderson C, Adachi Y (2001) Phosphorylation and rapid relocalization of 53BP1 to nuclear foci upon DNA damage. Mol. Cell. Biol. 21, 1719–1729. [DOI] [PMC free article] [PubMed] [Google Scholar]
- Banath JP, Olive PL (2003) Expression of phosphorylated histone H2AX as a surrogate of cell killing by drugs that created DNA double‐strand breaks. Cancer Res. 63, 4347–4350. [PubMed] [Google Scholar]
- Bartkova J, Bakkenist CJ, Rajpert‐De Meyts E, Skakkebaek NE, Sehested M, Lukas J, Kastan MB, Bartek J (2005) ATM activation in normal human tissues and testicular cancer. Cell Cycle 4, 838–845. [DOI] [PubMed] [Google Scholar]
- Beckman KB, Ames BN (1997) Oxidative decay of DNA. J. Biol. Chem. 272, 13300–13305. [DOI] [PubMed] [Google Scholar]
- Bedner E, Li X, Gorczyca W, Melamed MR, Darzynkiewicz Z (1999) Analysis of apoptosis by laser scanning cytometry. Cytometry 35, 181–195. [DOI] [PubMed] [Google Scholar]
- Burma S, Chen BP, Murphy M, Kurimasa A, Chen DJ (2001) ATM phosphorylates histone H2AX in response to DNA double‐strand breaks. J. Biol. Chem. 276, 42462–42467. [DOI] [PubMed] [Google Scholar]
- Darzynkiewicz Z (1994) Simultaneous analysis of cellular RNA and DNA content. Methods Cell Biol. 43, 401–420. [DOI] [PubMed] [Google Scholar]
- Darzynkiewicz Z, Krassowski T, Skopinska E (1965) Effect of phytohemagglutinin on synthesis of ‘rapidly labelled’ ribonucleic acid in human lymphocytes. Nature 207, 1402–1403. [DOI] [PubMed] [Google Scholar]
- Darzynkiewicz Z, Traganos F, Sharpless T, Melamed MR (1976) Lymphocyte stimulation: a rapid multiparameter analysis. Proc. Natl. Acad. Sci. USA 73, 2881–2884. [DOI] [PMC free article] [PubMed] [Google Scholar]
- Darzynkiewicz Z, Staiano‐Coico L, Melamed MR (1981) Increased mitochondrial uptake of rhodamine 123 during lymphocyte stimulation. Proc. Natl. Acad. Sci. USA 78, 2383–2387. [DOI] [PMC free article] [PubMed] [Google Scholar]
- Darzynkiewicz Z, Bedner E, Gorczyca W, Melamed MR (1999) Laser scanning cytometry. A new instrumentation with many applications. Exp. Cell Res. 249, 1–12. [DOI] [PubMed] [Google Scholar]
- Downs JA, Cote J (2005) Dynamics of chromatin during the repair of DNA double‐strand breaks. Cell Cycle 4, 1373–1376. [DOI] [PubMed] [Google Scholar]
- Fernandez‐Capetillo O, Chen H‐T, Celecte A, Ward I, Romanienko P, Morales JC, Naka K, Xia Z, Camerini‐Otero RD, Motoyama N, Carpenter PB, Bonner WM, Chen J, Nussenzweig A (2002) DNA damage‐induced G2‐M checkpoint activation by histone H2AX and 53BP1. Nat. Cell Biol. 4, 993–997. [DOI] [PubMed] [Google Scholar]
- Foster ER, Downs JA (2005) Histone H2AX phosphorylation in DNA double‐strand break repair. FEBS J. 272, 3231–3240. [DOI] [PubMed] [Google Scholar]
- Gorbunova V, Seluanov A (2005) Making ends meet in old age: DSB repair and aging. Mech. Ageing Dev. 126, 621–628. [DOI] [PubMed] [Google Scholar]
- Halicka HD, Pozarowski P, Ita M, Ardelt W, Mikulski SM, Shogen K, Darzynkiewicz Z (2002) Enhancement of activation‐induced apoptosis of lymphocytes by the cytotoxic ribonuclease onconase (ranpirnase). Int. J. Oncol. 21, 1245–1250. [DOI] [PubMed] [Google Scholar]
- Halicka HD, Huang X, Traganos F, King MA, Dai W, Darzynkiewicz Z (2005) Histone H2AX phosphorylation after cell irradiation with UV‐B: relationship to cell cycle phase and induction of apoptosis. Cell Cycle 4, 339–345. [PubMed] [Google Scholar]
- Huang X, Traganos F, Darzynkiewicz Z (2003) DNA damage induced by DNA topoisomerase I‐ and topoisomerase II‐ inhibitors detected by histone H2AX phosphorylation in relation to the cell cycle phase and apoptosis. Cell Cycle 2, 614–619. [PubMed] [Google Scholar]
- Huang X, Okafuji M, Traganos F, Luther E, Holden E, Darzynkiewicz Z (2004) Assessment of histone H2AX phosphorylation induced by DNA topoisomerase I and II inhibitors topotecan and mitoxantrone and by DNA crosslinking agent cisplatin. Cytometry 58A, 99–110. [DOI] [PubMed] [Google Scholar]
- Huang X, Halicka HD, Traganos F, Tanaka T, Kurose A, Darzynkiewicz Z (2005) Cytometric assessment of DNA damage in relation to cell cycle phase and apoptosis. Cell Prolif. 38, 223–243. [DOI] [PMC free article] [PubMed] [Google Scholar]
- Huang X, Kurose A, Tanaka T, Traganos F, Dai W, Darzynkiewicz Z (2006a) Sequential phosphorylation of Ser‐10 on histone H3 and Ser‐139 on histone H2AX and ATM activation during premature chromosome condensation: relationship to cell‐cycle and apoptosis. Cytometry 69A, 222–229. [DOI] [PubMed] [Google Scholar]
- Huang X, Tanaka T, Kurose A, Traganos F, Darzynkiewicz Z (2006b) Constitutive histone H2AX phosphorylation on _Ser_‐139 in cells untreated by genotoxic agents is cell‐cycle phase specific and attenuated by scavenging reactive oxygen species. Int. J. Oncol. 29, 495–501. [PubMed] [Google Scholar]
- Ichijima Y, Sakasai R, Okita N, Asahina K, Mizutani S, Teraoka H (2005) Phosphorylation of histone H2AX at M phase in human cells without DNA damage response. Biochem. Biophys. Res. Commun. 336, 807–812. [DOI] [PubMed] [Google Scholar]
- Jeggo PA, Lobrich M (2005) Artemis links ATM to double strand end rejoining. Cell Cycle 4, 359–362. [DOI] [PubMed] [Google Scholar]
- Lee J‐H, Paull TT (2005) ATM activation by DNA double‐strand breaks through the Mre11‐Rad50‐Nbs1 complex. Science 308, 551–554. [DOI] [PubMed] [Google Scholar]
- MacPhail SH, Banath JP, Yu Y, Chu E, Olive PL (2003) Cell cycle‐dependent expression of phosphorylated histone H2AX: reduced expression in unirradiated but not X‐irradiated G1‐phase cells. Radiat. Res. 159, 759–767. [DOI] [PubMed] [Google Scholar]
- McManus KJ, Hendzel MJ (2005) ATM‐dependent DNA‐damage independent mitotic phosphorylation of H2AX in normally growing mammalian cells. Mol. Biol. Cell 16, 5013–5025. [DOI] [PMC free article] [PubMed] [Google Scholar]
- Modesti M, Kanaar R (2001) DNA repair: spot (light) s on chromatin. Curr. Biol. 11, R229–R232. [DOI] [PubMed] [Google Scholar]
- Olive PL (2004) Detection of DNA damage in individual cells by analysis of histone H2AX phosphorylation. Methods Cell Biol. 75, 355–373. [DOI] [PubMed] [Google Scholar]
- Oricchio E, Saladino C, Iacovelli S, Soddu S, Cundari E (2006) ATM is activated by default in mitosis, localizes at centrosomes and monitors mitotic spindle integrity. Cell Cycle 5, 88–92. [DOI] [PubMed] [Google Scholar]
- Park EJ, Chan DW, Park JH, Oettinger MA, Kwon J (2003) DNA‐PK is activated by nucleosomes and phosphorylated H2AX within the nucleosomes in an acetylation‐dependent manner. Nucl. Acids Res. 31, 6819–6827. [DOI] [PMC free article] [PubMed] [Google Scholar]
- Parrinello S, Samper E, Krtolica A, Goldstein J, Melov S, Campisi J (2003) Oxygen sensitivity severely limits the replicative lifespan of murine fibroblasts. Nat. Cell Biol. 5, 741–747. [DOI] [PMC free article] [PubMed] [Google Scholar]
- Pastwa E, Blasiak J (2003) Non‐homologous DNA end joining. Acta Biochim. Pol. 50, 891–908. [PubMed] [Google Scholar]
- Paull TT, Lee JH (2005) The Mre11/Rad50/Nbs1 complex and its role as DNA double‐strand break sensor for ATM. Cell Cycle 4, 737–740. [DOI] [PubMed] [Google Scholar]
- Paull TT, Rogakou EP, Yamazaki V, Kirchgesser CU, Gellert M, Bonner WM (2000) A critical role for histone H2AX in recruitment of repair factors to nuclear foci after DNA damage. Curr. Biol. 10, 886–895. [DOI] [PubMed] [Google Scholar]
- Rogakou EP, Pilch DR, Orr AH, Ivanova VS, Bonner WM (1998) DNA double‐stranded breaks induce histone H2AX phosphorylation on serine 139. J. Biol. Chem. 273, 5858–5868. [DOI] [PubMed] [Google Scholar]
- Rogakou EP, Boon C, Redon C, Bonner WM (1999) Megabase chromatin domains involved in DNA double‐strand breaks in vivo. J. Cell Biol. 146, 905–916. [DOI] [PMC free article] [PubMed] [Google Scholar]
- Roth GS, Lane MA, Ingram DK (2005) Caloric restriction mimetics: the next phase. Ann. NY Acad. Sci. 1057, 365–371. [DOI] [PubMed] [Google Scholar]
- Schriner SE, Linford NJ, Martin GM, Treuting P, Ogburn CE, Emond M, Coskun PE, Ladiges W, Wolf N, Van Remmen H, Wallace DC, Rabinovitch PS (2005) Extension of murine life span by overexpression of catalase targeted to mitochondria. Science 308, 1875–1878. [DOI] [PubMed] [Google Scholar]
- Sedelnikova OA, Rogakou EP, Panuytin IG, Bonner W (2002) Quantitative detection of 125IUdr‐induced DNA double‐strand breaks with γ‐H2AX antibody. Radiat. Res. 158, 486–492. [DOI] [PubMed] [Google Scholar]
- Sedelnikova OA, Pilch DR, Redon C, Bonner WM (2003) Histone H2AX in DNA damage and repair. Cancer Biol. Ther. 2, 233–235. [DOI] [PubMed] [Google Scholar]
- Sekiguchi M, Tsuzuki T (2002) Oxidative nucleotide damage: consequences and prevention. Oncogene 16, 8895–8905. [DOI] [PubMed] [Google Scholar]
- Sheng‐Tanner X, Bump EA, Hedley DW (1998) An oxidative stress‐mediated death pathway in irradiated human leukemia cells mapped using multilaser flow cytometry. Radiat. Res. 150, 636–647. [PubMed] [Google Scholar]
- Tanaka T, Halicka HD, Huang X, Traganos F, Darzynkiewicz Z (2006a) Constitutive histone H2AX phosphorylation and ATM activation, the reporters of DNA damage by endogenous oxidants. Cell Cycle 5, 1940–1945. [DOI] [PMC free article] [PubMed] [Google Scholar]
- Tanaka T, Kurose A, Huang X, Dai W, Darzynkiewicz Z (2006b) ATM kinase activation and histone H2AX phosphorylation as indicators of DNA damage by DNA topoisomerase I inhibitor topotecan and during apoptosis. Cell Prolif. 39, 49–60. [DOI] [PMC free article] [PubMed] [Google Scholar]
- Tanaka T, Kurose A, Huang X, Traganos F, Dai W, Darzynkiewicz Z (2006c) Extent of constitutive histone H2AX phosphorylation on _Ser_‐139 varies in cells with different TP53 status. Cell Prolif. 39, 313–323. [DOI] [PMC free article] [PubMed] [Google Scholar]
- Tanaka T, Kurose A, Halicka HD, Traganos F, Darzynkiewicz Z (2006d) 2‐Deoxy‐D‐glucose reduces the level of constitutive activation of ATM and phosphorylation of histone H2AX. Cell Cycle 5, 878–882. [DOI] [PubMed] [Google Scholar]
- Vilenchik MM, Knudson AG (2003) Endogenous DNA double‐strand breaks: production, fidelity of repair, and induction of cancer. Proc. Natl. Acad. Sci. USA 100, 12871–12876. [DOI] [PMC free article] [PubMed] [Google Scholar]
- Ward IM, Minn K, Chen J (2004) UV‐induced ataxia‐telangiectasia‐mutated and Rad3‐related (ATR) activation requires replication stress. J. Biol. Chem. 279, 9677–9680. [DOI] [PubMed] [Google Scholar]
- Zhou BB, Elledge SJ (2000) The DNA damage response: putting checkpoints in perspective. Nature 408, 433–439. [DOI] [PubMed] [Google Scholar]