Coding-sequence determinants of gene expression in Escherichia coli (original) (raw)
. Author manuscript; available in PMC: 2014 Jan 27.
Published in final edited form as: Science. 2009 Apr 10;324(5924):255–258. doi: 10.1126/science.1170160
Abstract
Synonymous mutations do not alter the encoded protein, but they can influence gene expression. To investigate the mechanisms, we engineered a synthetic library of 154 genes that vary randomly at synonymous sites, but all encode the same green fluorescent protein. When expressed in E. coli, GFP protein levels varied 250-fold across the library. GFP mRNA levels, mRNA degradation patterns, and bacterial growth rates also varied, but codon bias did not correlate with gene expression. Rather, the stability of mRNA folding near the ribosomal binding site explained over half the variation in protein levels. In our analysis, mRNA folding and associated rates of translation initiation play a predominant role in shaping expression levels of individual genes, whereas codon bias influences global translation efficiency and cellular fitness.
The theory of codon bias posits that preferred codons correlate with the abundances of iso-accepting tRNAs (1,2), thereby increasing translational efficiency (3) or accuracy (4). Recent experiments have revealed other effects of silent mutations (5,6,7). We synthesized a library of green fluorescent protein (GFP) genes that vary randomly in their codon usage, but encode the same amino acid sequence. By placing these constructs in identical regulatory contexts and measuring their expression, we can isolate the effects of synonymous variation on gene expression.
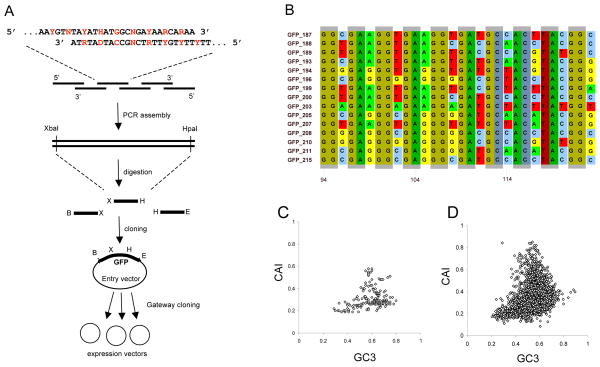
The GFP gene consists of 240 codons. For 226 of these codons we introduced random silent mutations in the third base position, while keeping the first and second positions constant (Fig. 1A). The resulting synthetic GFP constructs differed by up to 180 silent substitutions, with an average of 114 substitutions between pairs of constructs (Figs. 1B, S1, S2). The range of third-position GC content (GC3) across the library of constructs encompassed virtually all (99%) of the GC3 values among endogenous E. coli genes; and the variation in the codon adaptation index (CAI, 8) contained most (96%) of the CAI values of E. coli genes (Fig. 1).
FIGURE 1. Synthetic library of GFP genes with randomized codon usage.
(A) Degenerate oligonucleotides were mixed and assembled by PCR. Fragments were then cloned, sequenced, and assembled into complete GFP genes. Red indicates third-codon positions. Degenerate symbols are as follows: D (A or G or T); H (A or C or T); N (A or C or G or T); R (A or G); Y (C or T). (B) Example alignment illustrating sequence diversity among fifteen synthetic genes. Shadowed boxes indicate first and second codon positions, which are conserved across the library. (C, D) The distribution of GC3 and CAI among the 154 synthetic GFP genes (C) is representative of the diversity among the 4,288 endogenous E. coli genes (D).
We expressed the GFP genes in E. coli using a T7-promoter vector, and we quantified expression by spectrofluorometry. Fluorescence levels varied 250-fold across the library, and they were highly reproducible for each GFP construct (Spearman _r_=0.98 between biological replicates, Fig. S3). Fluorescence variation was consistent across a broad range of experimental conditions (Fig. S4). An alternative plasmid with bacterial promoter reduced overall expression levels, but the correlation between the two expression systems remained high (_r_=0.9, Fig. S4). A similar pattern of fluorescence variation was observed in FACS measurements (Fig. S5). Since the encoded protein sequence was identical for all genes, we attributed fluorescence variation to differences in protein levels. This was confirmed by a strong correlation between fluorescence and total GFP levels in western blots (Fig. S5) and Coomassie staining (_r_=0.9, p<1E-15).
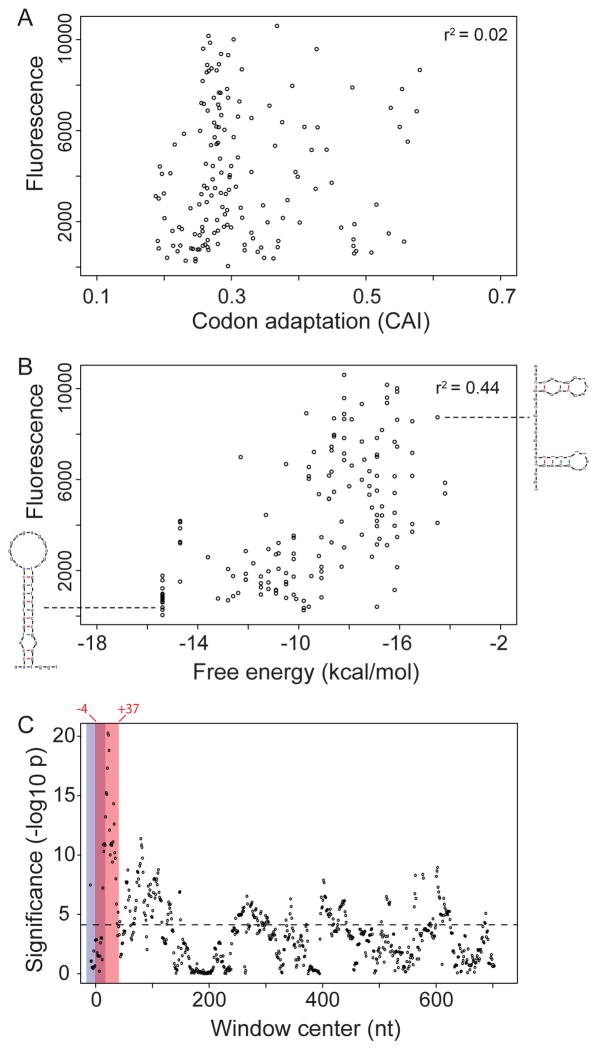
To test the theory that E. coli translation rates and eventual protein levels depend on the concordance between codon usage and cellular tRNA abundances (9–11), we compared codon usage to fluorescence among the 154 synonymous GFP variants. Notably, neither of the two most common measures of codon bias, the codon adaptation index or the frequency of optimal codons (3), was significantly correlated with fluorescence levels (_r_=0.14, _p=_0.09; and _r_=0.11, _p_=0.16 respectively, Fig. 2A). Moreover, some of the genes expressed most highly featured low CAI, and vice versa.
FIGURE 2. The determinants of gene expression.
(A) Codon adaptation was not significantly correlated with fluorescence among the 154 GFP constructs (_r_=0.14, _p=_0.09). (B) Predicted 5’ mRNA folding energy was strongly correlated with fluorescence (_r=_0.66, p<1E-15). For each construct, folding energy was calculated in a window spanning positions −4 to +37 relative to translation start; two example structures are shown. (C) Sliding window analysis of mRNA folding and fluorescence. Local mRNA folding energies were calculated in a sliding window of length 42 nt. The significance of the correlation between local folding energy and fluorescence (negative log10 p-value) is plotted as a function of window position along the sequence. Note the overlapping locations of the 30-nt ribosomal binding site (blue bar) and the window of strongest correlation between folding energy and fluorescence (red bar, nt −4 through nt +37).
Although codon adaptation near the 5’ terminus is considered particularly important for expression (11,12), the CAI value of the first 42 bases in a GFP gene was not significantly correlated with the gene’s fluorescence intensity (_r_=0.1, _p_=0.2). Similarly, the number of rare codons (sites with CAI<0.1) in a sequence was not significantly correlated with fluorescence (_r=_−0.02, p=.7), and neither was the number of pairs of consecutive rare codons (_r_=−0.14, _p_=0.09). Although specific consecutive codon pairs have been proposed to influence translation (13,14), the frequency of such rare pairs in a gene was not significantly correlated with its fluorescence (_r_=0.07, _p_=0.35; see Methods).
Statistical analyses of which nucleotide positions influenced gene expression (Fig. S6) indicated the importance of local sequence patterns, as opposed to global codon bias. This pattern is consistent with studies of base content (24,27) that suggest mRNA structure may shape expression levels (15–18). Therefore, for each GFP construct we computed the predicted minimum free energy associated with the secondary structure of its entire mRNA, or specific regions of its mRNA. The folding energy of the entire mRNA was not significantly correlated with fluorescence (_r_=0.16, _p_=0.051), but the folding energy of the first third of the mRNA was strongly correlated: mRNAs with stronger structure produced lower fluorescence (_r_=0.60, p<1E-15). A moving window analysis identified a region, from nt −4 to +37 relative to start, for which predicted folding energy explained 44% of the variation in fluorescence levels across the GFP library (_r_=0.66, p<1E-15, Fig. 2B). The same folding energies explained 59% of fluorescence variation when constructs were expressed using a bacterial promoter (_r_=0.77, p<4E-16, Fig S7). mRNA folding also correlated with fluorescence in a separate analysis of GFP constructs differing by single mutations (see Methods).
The strong correlation between mRNA folding and fluorescence suggests the simple mechanistic explanation that tightly folded messages obstruct translation initiation, thereby reducing protein synthesis (19). Predicted structures for high-expression GFP mRNAs characteristically contained many unpaired nucleotides near the start codon, whereas low-expression constructs featured long hairpin loops (Fig. 2B, S8), consistent with known obstructions to initiation (19). The region of strongest correlation between folding energy and expression did not overlap with the Shine-Dalgarno sequence, suggesting that SD occlusion by secondary structure (19,20) did not play a major role in inhibiting expression – probably because our constructs contained no non-coding mutations. By contrast, the region of strongest effect overlapped significantly with the 30-nt ribosome binding site centered around the start codon (Fig. 2C).
In a multiple regression, mRNA folding energy near the start codon (nt -4 through +37) explained nearly 10-fold more variation in expression levels than any other predictor variable, including the global GC content, CAI, the number of rare-codon sites or consecutive pairs, the length of the longest rare-codon stretch, the number of predicted transcription termination signals, the propensity for conformation changes into Z-DNA, and the number of predicted RNase E cleavage sites (see Methods). RNase E cleavage sites tended to reduce expression, as expected (22), explaining 4.7% of fluorescence variation.
Although global GC content was not significantly correlated with fluorescence (_r_=−0.031, _p_=0.7), GC content near the start codon was strongly correlated. But this was likely mediated by mRNA secondary structure: GC content was itself correlated with folding energy, and folding energy explained 10-fold more variation in fluorescence than was explained by GC content (see Methods).
mRNA levels, as quantified by northern blotting, varied across the library, but three-times less than corresponding fluorescence levels. We also observed 3’-truncated mRNA species that differed among GFP variants, likely reflecting different stabilities of mRNA degradation intermediates (Fig. S9). mRNA levels were highly correlated with fluorescence (_r_=0.53) and also with folding energy near the start codon (_r_=0.33). These relationships are consistent with the hypothesis that secondary structure influences both mRNA and protein levels through occlusion of ribosome subunit binding. Reduced ribosome binding increases mRNA exposure to nuclease digestion, thereby decreasing stability (23).
Bacterial growth rates were strongly influenced by codon bias in the expressed GFP construct. Elevated CAI was correlated with faster growth (_r_=0.54, p<9E-13), whereas 5’ mRNA folding energy showed no significant correlation with growth (_r_=0.12, _p_=0.15). These results support the hypothesis that low codon adaptation in an over-expressed gene decreases cellular fitness (24), likely because retarded elongation sequesters ribosomes on the GFP mRNA, hindering translation of essential mRNAs. The growth rate data could alternatively be explained by high codon adaptation reducing the rate of deleterious protein mis-folding (6,25,26). However, in our experiments CAI was not correlated with the degree of mis-folding, quantified either by the ratio of Coomassie to fluorescence or by the ratio of mRNA to fluorescence (see Methods).
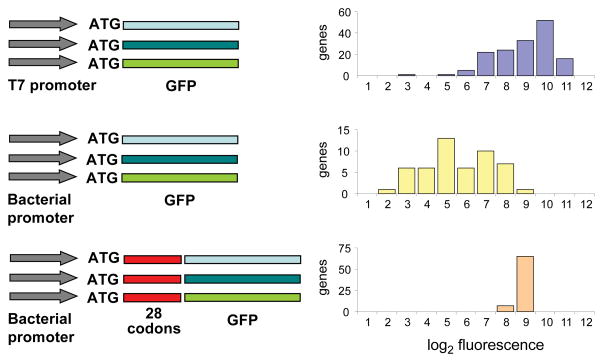
Our findings lead to the following prediction: Adding a stretch of codons with weak mRNA structure to the 5’ end of a gene with originally strong structure should increase expression, even if the additional codons have low CAI. To test this prediction we fused a 28-codon tag to the 5’ terminus of 72 GFP constructs. The tagged constructs, which featured weak mRNA secondary structure and low CAI (see Methods), produced consistently high expression, including those GFPs poorly expressed in non-tagged form (Fig. 3). These results suggest that endogenous E. coli genes may have undergone selection for weak 5’ secondary structure. Consistent with this hypothesis, we found that the predicted secondary structures for the 4,294 E. coli genes are significantly weaker near their start codons (nt −4 to +37) than immediately downstream (nt +38 to +79; Wilcoxon p<1E-15).
FIGURE 3. Expression levels of alternative GFP constructs.
The distribution of log2 normalized fluorescence levels for pGK8 (T7 promoter, no leader sequence, top panel), pGK14 (PBAD bacterial promoter, no leader sequence, middle panel) and pGK16 (trp/lac bacterial promoter, 28-codon leader sequence, bottom panel) expression vectors. Fluorescence varied substantially when expressed using T7 or bacterial promoter. The addition of a 28-codon leader sequence with low secondary structure produced uniformly high expression levels.
Here we have systematically quantified the effects of synonymous variation on gene expression in E. coli, based on unbiased sequences that control for regulatory context. The data reveal a predominant role for mRNA structure around the ribosome binding site in shaping mRNA and protein levels. By contrast, neither local nor global codon bias had significant effects on mRNA or protein levels. This finding is consistent with the view that translation initiation, not elongation, is rate-limiting for gene expression (28), but it seems to contradict the well-known correspondence between codon bias and expression level for endogenous genes (8,10,29). There is a simple explanation to this apparent contradiction, which reverses the arrow of causality between codon adaptation and gene expression. In one view, high CAI induces strong protein expression (9–11), whereas we argue that strong expression induces selection for high CAI. Unlike genome-wide correlations between CAI and expression levels (e.g. (10)), our analyses control for non-coding regulation and thus can distinguish between these two alternatives.
We propose that the correspondence between codon adaptation and expression level among endogenous E. coli genes arises from selection to make translation efficient at a global level, rather than at the level of individual genes. High CAI increases the elongation rate, but since initiation is rate-limiting in translation, elongation rate does not significantly affect expression. On the other hand, rapid elongation sequesters fewer ribosomes on the message, thereby increasing the total rate of protein synthesis and accelerating cell growth. A similar model for codon preference has been proposed by Andersson and Kurland (24). Well-adapted codons could also confer a metabolic advantage by reducing the load of mis-folded proteins (25_,26_). In either case, increasing a gene’s codon adaptation should not increase its expression. High codon adaptation in a gene should, however, improve cellular fitness to an extent that depends on its expression level.
Supplementary Material
Figure
Supplemental
References and notes
- 1.Zuckerkandl E, Pauling L. J Theor Biol. 1965;8:357. doi: 10.1016/0022-5193(65)90083-4. [DOI] [PubMed] [Google Scholar]
- 2.Ikemura T. Mol Biol Evol. 1985;2:13. doi: 10.1093/oxfordjournals.molbev.a040335. [DOI] [PubMed] [Google Scholar]
- 3.Ikemura T. J Mol Biol. 1981;151:389. doi: 10.1016/0022-2836(81)90003-6. [DOI] [PubMed] [Google Scholar]
- 4.Akashi H. Genetics. 1994;136:927. doi: 10.1093/genetics/136.3.927. [DOI] [PMC free article] [PubMed] [Google Scholar]
- 5.Parmley JL, Hurst LD. Bioessays. 2007;29:515. doi: 10.1002/bies.20592. [DOI] [PubMed] [Google Scholar]
- 6.Kimchi-Sarfaty C, et al. Science. 2007;315:525. doi: 10.1126/science.1135308. [DOI] [PubMed] [Google Scholar]
- 7.Nackley AG, et al. Science. 2006;314:1930. doi: 10.1126/science.1131262. [DOI] [PubMed] [Google Scholar]
- 8.Sharp PM, Li WH. Nucleic Acids Res. 1987;15:1281. doi: 10.1093/nar/15.3.1281. [DOI] [PMC free article] [PubMed] [Google Scholar]
- 9.Gustafsson C, Govindarajan S, Minshull J. Trends Biotechnol. 2004;22:346. doi: 10.1016/j.tibtech.2004.04.006. [DOI] [PubMed] [Google Scholar]
- 10.Lithwick G, Margalit H. Genome Res. 2003;13:2665. doi: 10.1101/gr.1485203. [DOI] [PMC free article] [PubMed] [Google Scholar]
- 11.Rosenberg AH, Goldman E, Dunn JJ, Studier FW, Zubay G. J Bacteriol. 1993;175:716. doi: 10.1128/jb.175.3.716-722.1993. [DOI] [PMC free article] [PubMed] [Google Scholar]
- 12.Gonzalez de Valdivia EI, Isaksson LA. Nucleic Acids Res. 2004;32:5198. doi: 10.1093/nar/gkh857. [DOI] [PMC free article] [PubMed] [Google Scholar]
- 13.Boycheva S, Chkodrov G, Ivanov I. Bioinformatics. 2003;19:987. doi: 10.1093/bioinformatics/btg082. [DOI] [PubMed] [Google Scholar]
- 14.Coleman JR, et al. Science. 2008;320:1784. doi: 10.1126/science.1155761. [DOI] [PMC free article] [PubMed] [Google Scholar]
- 15.Hall MN, Gabay J, Debarbouille M, Schwartz M. Nature. 1982;295:616. doi: 10.1038/295616a0. [DOI] [PubMed] [Google Scholar]
- 16.Griswold KE, Mahmood NA, Iverson BL, Georgiou G. Protein Expr Purif. 2003;27:134. doi: 10.1016/s1046-5928(02)00578-8. [DOI] [PubMed] [Google Scholar]
- 17.Qing G, Xia B, Inouye M. J Mol Microbiol Biotechnol. 2003;6:133. doi: 10.1159/000077244. [DOI] [PubMed] [Google Scholar]
- 18.Duan J, et al. Hum Mol Genet. 2003;12:205. doi: 10.1093/hmg/ddg055. [DOI] [PubMed] [Google Scholar]
- 19.Kozak M. Gene. 2005;361:13. doi: 10.1016/j.gene.2005.06.037. [DOI] [PubMed] [Google Scholar]
- 20.de Smit MH, van Duin J. Proc Natl Acad Sci USA. 1990;87:7668. doi: 10.1073/pnas.87.19.7668. [DOI] [PMC free article] [PubMed] [Google Scholar]
- 21.Takyar S, Hickerson RP, Noller HF. Cell. 2005;120:49. doi: 10.1016/j.cell.2004.11.042. [DOI] [PubMed] [Google Scholar]
- 22.Mudd EA, Krisch HM, Higgins CF. Mol Microbiol. 1990;4:2127. doi: 10.1111/j.1365-2958.1990.tb00574.x. [DOI] [PubMed] [Google Scholar]
- 23.Iost I, Dreyfus M. Embo J. 1995;14:3252. doi: 10.1002/j.1460-2075.1995.tb07328.x. [DOI] [PMC free article] [PubMed] [Google Scholar]
- 24.Andersson SG, Kurland CG. Microbiol Rev. 1990;54:198. doi: 10.1128/mr.54.2.198-210.1990. [DOI] [PMC free article] [PubMed] [Google Scholar]
- 25.Drummond DA, Bloom JD, Adami C, Wilke CO, Arnold FH. Proc Natl Acad Sci USA. 2005;102:14338. doi: 10.1073/pnas.0504070102. [DOI] [PMC free article] [PubMed] [Google Scholar]
- 26.Stoletzki N, Eyre-Walker A. Mol Biol Evol. 2007;24:374. doi: 10.1093/molbev/msl166. [DOI] [PubMed] [Google Scholar]
- 27.Eyre-Walker A, Bulmer M. Nucleic Acids Res. 1993;21:4599. doi: 10.1093/nar/21.19.4599. [DOI] [PMC free article] [PubMed] [Google Scholar]
- 28.Jacques N, Dreyfus M. Mol Microbiol. 1990;4:1063. doi: 10.1111/j.1365-2958.1990.tb00679.x. [DOI] [PubMed] [Google Scholar]
- 29.Ghaemmaghami S, et al. Nature. 2003;425:737. doi: 10.1038/nature02046. [DOI] [PubMed] [Google Scholar]
- 30.We thank Aleksandra Helwak, Julius Lucks, Paul Sharp, Laurence Hurst, and members of the Tollervey lab for conceptual input; Ashley Heath (Sigma), Alastair Aitken, Jeff Skerker, Tom Shimizu, Isabelle Iost, and Jeff Han for reagents and protocols. Support provided by the Burroughs Wellcome Fund, James S. McDonnell Foundation, Penn Genome Frontiers Institute, and Defense Advanced Research Projects Agency HR0011-05-1-0057 (JBP); Foundation for Polish Science and EMBO (GK); Wellcome Trust/BBSRC grant BB/DO19621/1 (DT).
Associated Data
This section collects any data citations, data availability statements, or supplementary materials included in this article.
Supplementary Materials
Figure
Supplemental


