Mismatch repair protein hMSH2–hMSH6 recognizes mismatches and forms sliding clamps within a D-loop recombination intermediate (original) (raw)
Significance
Recombination between divergent DNA sequences (homeologous recombination) is generally suppressed to preserve cellular genetic integrity and to ultimately introduce genetic barriers between species. Decades of genetic and cell biology studies have identified the involvement of the mismatch repair (MMR) machinery in the quality control of homologous recombination. However, the molecular mechanism by which this remarkable control is achieved is unknown. Here, we report the biophysical reconstitution and analysis of the early steps in the rejection of divergent DNA sequences by the MMR machinery during recombination initiation. We have determined that the first responder of MMR, human MutS-homolog hMSH2–hMSH6, efficiently recognizes mismatches within a D-loop recombination initiation intermediate, even in the presence of recombination initiation proteins HsRAD51 and human replication protein A (HsRPA).
Keywords: homologous recombination, homeologous recombination, mismatch DNA repair, single-molecule, total internal reflection fluorescence microscopy
Abstract
High fidelity homologous DNA recombination depends on mismatch repair (MMR), which antagonizes recombination between divergent sequences by rejecting heteroduplex DNA containing excessive nucleotide mismatches. The hMSH2–hMSH6 heterodimer is the first responder in postreplicative MMR and also plays a prominent role in heteroduplex rejection. Whether a similar molecular mechanism underlies its function in these two processes remains enigmatic. We have determined that hMSH2–hMSH6 efficiently recognizes mismatches within a D-loop recombination initiation intermediate. Mismatch recognition by hMSH2–hMSH6 is not abrogated by human replication protein A (HsRPA) bound to the displaced single-stranded DNA (ssDNA) or by HsRAD51. In addition, ATP-bound hMSH2–hMSH6 sliding clamps that are essential for downstream MMR processes are formed and constrained within the heteroduplex region of the D-loop. Moreover, the hMSH2–hMSH6 sliding clamps are stabilized on the D-loop by HsRPA bound to the displaced ssDNA. Our findings reveal similarities and differences in hMSH2–hMSH6 mismatch recognition and sliding-clamp formation between a D-loop recombination intermediate and linear duplex DNA.
DNA mismatch repair (MMR) ensures the fidelity of both DNA replication and homologous recombination (HR) (1, 2) and is responsible for DNA damage checkpoint signaling (3). Cells deficient in MMR have a mutator phenotype characterized by an elevated spontaneous mutation rate and chromosome rearrangements. Alterations in human MMR genes predispose to Lynch syndrome or hereditary nonpolyposis colorectal cancer (LS/HNPCC) (4).
MMR catalyzes a replication-coupled excision reaction that removes mispaired nucleotides from newly synthesized DNA (5, 6). The mispaired nucleotides are recognized by the MutS homodimer in bacteria (7, 8) and by two partially redundant MutS-homolog (MSH) heterodimers, MSH2-MSH6 and MSH2-MSH3, in eukaryotes (1, 9). Sequence analysis indicates that MSH proteins are members of the ATP binding cassette (ABC) superfamily of ATPases (10). Multiple crystal structures of the prokaryotic MutS and human hMSH2–hMSH6 revealed nearly identical, sometimes ADP-bound, clamp-like architectures that encircle a mismatch-containing DNA (11–13). Single-molecule studies have suggested that this initial clamp-like structure persists for a few seconds during the mismatch search and recognition process (14). The structure of an ATP-bound MSH dimer has yet to be solved. However, numerous biochemical and single-molecule studies have demonstrated that mismatch recognition triggers ADP→ATP nucleotide exchange, which results in a conformational transition that converts the MSH dimer into an ATP-bound stable sliding clamp that disengages from the mismatch and freely diffuses on the adjacent dsDNA for 8–10 min (14–21). The formation of an ATP-bound MSH sliding clamp is followed by recruitment of MutL homologs (MLH/PMS) (22, 23). With the exception of Gram-negative enteric bacteria such as Escherichia coli, the MLH/PMS of most species including the human hMLH1-hPMS2 contain an endogenous endonuclease activity required for processing the error-containing DNA strand (17, 24).
RAD51 is the prototypical eukaryotic DNA strand exchange protein. It mediates strand invasion into homologous dsDNA during HR (25, 26). If the parental DNAs contain sequence heterology, the strand-exchange process results in the formation of a mismatch-containing heteroduplex DNA (27). A role for MMR in controlling recombination between divergent DNA sequences was initially suggested in λ heteroduplex transfection studies and then clearly demonstrated during intergeneric recombination between E. coli and Salmonella typhimurium (28, 29). In these latter experiments, the recombination frequency between an Hfr donor increased nearly 10,000-fold when the F− recipient bacteria contained a mutation in one of the core bacterial MMR genes MutS, MutL, MutH, or UvrD (MutU) (29). Subsequent studies in bacteria, yeast, and human cells have confirmed the central role of MMR in suppressing recombination between divergent sequences (termed: homeologous recombination) (3, 30, 31). This replication-independent function of MMR is critical for preventing potentially lethal or tumorigenic genome rearrangements such as chromosomal translocations, deletions, or inversions mediated by repetitive genomic elements (32).
Despite the critical role of MMR in ensuring recombination fidelity, how heteroduplex rejection is initiated remains poorly defined. MutS and MutL inhibit RecA-catalyzed strand transfer between heterologous DNAs in vitro presumably by blocking the RecA-mediated branch migration (33) and act in concert with UvrD helicase to antagonize illegitimate recombination (34). These studies brought forward the idea that the MMR proteins may operate in the context of the recombination intermediate, where the structure of the D-loop and the presence of the postsynaptic filament may interfere with the formation or stability of the MutS–mismatch complex. This idea, however, has not been confirmed directly. Moreover, the biochemical differences between bacterial RecA and human RAD51 recombinases may lead to differences in the initiation of the hetroduplex rejection reactions. Here, we have reconstituted the initial recognition step of human heteroduplex rejection by constructing mismatch-containing D-loop structures and examining their interaction with combinations of hMSH2–hMSH6, HsRPA, and HsRAD51 proteins. The data suggest a simple model that highlights the similarities and differences in downstream processing during postreplication MMR and heteroduplex rejection.
Results
hMSH2–hMSH6 Recognizes a Mismatch within a D-loop Structure.
hMSH2–hMSH6 recognizes eight possible mismatched nucleotide combinations, as well as a subset of single-nucleotide insertions/deletions (35, 36). To ensure robust recognition, our model substrates contained a G/T mismatch surrounded by symmetric 3′-purines, a preferred target of hMSH2–hMSH6 (37). We prepared a 90-bp dsDNA, which contained a (dT)50 ssDNA loop opposite an annealed 50-bp segment containing a central G/T mismatch or A/T homoduplex (D50G/T or D50A/T) (Tables S1 and S2). This D-loop structure represented a recombination intermediate in which an invading ssDNA formed a heteroduplex with the complementary strand of a recipient parental dsDNA whereas the remaining strand was displaced to form a D-loop. We also prepared a 90-bp linear dsDNA containing a G/T mismatch or A/T homoduplex with an identical location and sequence context to the duplex portion of the D-loop (L90G/T and L90A/T) (Tables S1 and S2). All DNA substrates (except bio-flapD50G/T) were labeled with Cy3 at the 5′ terminus of the continuous “bottom” strand. All reactions contained 25 µM ADP.
As expected, an extremely weak binding of hMSH2–hMSH6 to L90A/T DNA was observed by EMSA in the presence of ADP (Fig. 1_A_, Left). In contrast, hMSH2–hMSH6 formed a stable complex with L90G/T DNA (Fig. 1_A_, Right). Similarly, we observed specific binding of hMSH2–hMSH6 to the mismatch-containing D-loop DNA (Fig. 1_B_). Although the shifted bands appear fainter than the free substrate, this difference in appearance is due to Cy3 quenching by the bound protein as similar amounts of DNA were detected following the extraction of the DNA and DNA–protein complex from the EMSA gel. We found that hMSH2–hMSH6 bound the L90G/T and D50G/T mismatch substrates with equivalent affinities (K_D_•L90 G/T = 29 ± 9 nM and K_D_•D50 G/T = 16 ± 4 nM) (Fig. 1_C_). hMSH2–hMSH6 bound L90A/T and D50A/T homoduplex DNA with significantly lower affinity. These results indicate that the D-loop structure does not impede mismatch recognition by hMSH2–hMSH6. The binding of hMSH2–hMSH6 to the Cy3 labeled L90G/T is comparable with that previously reported for an 81-bp G/T mismatch containing substrate (_K_D = 20 ± 5 nM) (38). This observation suggests that the 5′-Cy3, 45 nt away from G/T mismatch and 20 nt from the D-loop branch point, has little or no effect on the mismatch recognition by hMSH2–hMSH6.
Fig. 1.

hMSH2–hMSH6 binds mismatch-containing D-loop DNA. (A) Ten nanomolar 90-bp homoduplex dsDNA (L90A/T, lanes 1–8) or 90-bp dsDNA containing a single G/T mismatch (L90G/T, lanes 9–16) were incubated with the indicated concentrations of hMSH2–hMSH6 (lanes 1–8 and 9–16) in the presence of 25 μM ADP. The bound and free DNA was resolved by EMSA. (B) Ten nanomolar D-loop (D50A/T, lanes 1–8) and mismatch containing D-loop (D50G/T, lanes 9–16) were incubated with the indicated concentrations of hMSH2–hMSH6. (C) The relative intensities of the mobility-shifted species shown in A and B were quantified and plotted as a function of protein concentration. The apparent _K_D was calculated assuming 1:1 binding stoichiometry.
Previous structural studies have suggested that hMSH2–hMSH6 occludes between 20 and 25 bp around the mismatch, with a distinct polarity of the subunits relative to the mismatch (11, 38). We found that, in the presence of ADP, hMSH2–hMSH6 specifically binds to mismatch-containing D-loop substrates of different sizes and different mismatch orientation with comparable affinities (Fig. S1), suggesting that hMSH2–hMSH6 is capable of recognizing a broad range of D-loop substrates.
hMSH2–hMSH6 Sliding Clamp Is Constrained within the D-Loop but Can Be Released at the D-Loop Branch Point.
The ATP-dependent release of hMSH2–hMSH6 from the mismatch followed by diffusion along the adjacent duplex DNA is a critical step in MMR (Fig. 2_A_) (15, 39, 40). It was formally possible that the hMSH2–hMSH6 bound to a mismatch-containing D-loop might encompass both the heteroduplex and the displaced ssDNA strand. If true, the D-loop should not impede the dissociation of the ATP-bound sliding clamp from the open ends. In contrast, if the interaction uniquely involves the heteroduplex region, the D-loop branch point might be expected to block the dissociation of hMSH2–hMSH6 (Fig. 2_A_, D-loop). To test whether the D-loop traps the ATP-bound sliding clamp, we first formed the stable D-loop·hMSH2–hMSH6 complex. We then challenged this complex with ATP (Fig. 2_B_). Even a very low concentration of ATP easily provoked the release of hMSH2–hMSH6 from the L90G/T (Fig. 2_B_, lanes 2–5). The EC50•L90G/T•ATP was calculated to be 0.37 ± 0.01 µM (Fig. 2_H_). It required more than 10-fold higher ATP concentration to release hMSH2–hMSH6 from the D-loop DNA (Fig. 2_B_, lanes 7–10 and Fig. 2_H_, EC50• D50G/T•ATP = 5.9 ± 0.1 µM). It is important to note that the EC50 for ATP and ATPγS serve as an indicator of sliding-clamp stability on DNA and account for a multistep process that starts with the ADP–ATP exchange by the mismatch-bound clamp and leads to the formation of the sliding clamp, and its subsequent dissociation promoted by ATP hydrolysis (21, 41, 42).
Fig. 2.

Binding analysis of hMSH2–hMSH6 to D-loop DNA in the presence of ATP. (A) Schematic depiction of the ADP→ATP exchange, the formation of an ATP-bound hMSH2–hMSH6 sliding clamp, and the release of an ATP-bound hMSH2–hMSH6 sliding clamp from an open dsDNA end or a mismatch within a D-loop. In the case of the D-loop, the sliding clamp may remain trapped with the heteroduplex region. (B) hMSH2–hMSH6 (100 nM) was prebound with 10 nM L90G/T linear or D50G/T D-loop DNA substrates and then challenged with the indicated concentrations of ATP. (C) hMSH2–hMSH6 (100 nM) was prebound to bio-D50G/T (10 nM) that contains a biotin moiety on both the 5′ and 3′ end of the heteroduplex DNA. Streptavidin (1.5 μM) was added before hMSH2–hMSH6 and ATP to form streptavidin-bio-D50G/T (SA-D50G/T) in which both ends of the invading strand were blocked. (D) hMSH2–hMSH6 (100 nM) was prebound to D50G/T containing a dual T15 flap at both 5′ and 3′ ends of the heteroduplex DNA (Flap-D50G/T). (E) ATPγS-induced dissociation (indicated concentrations) of hMSH2–hMSH6 (100 nM) from D50G/T (10 nM) (lanes 1–5). (F) The binding of indicated concentrations of hMSH2–hMSH6 to D50G/T (10 nM) in the absence (lanes 1–5) and presence (lanes 6–10) of HsRPA (48 nM). The binding reactions contained 25 µM ADP (G) ATP-induced dissociation (indicated concentrations) of hMSH2–hMSH6 (100 nM) from D50G/T (10 nM) in the presence of 48 nM HsRPA (lanes 1–5). (H) Quantification of the bound fraction of the DNA substrates as a function of ATP (all red curves) or ATPγS (all black curves) concentrations for B_–_E and G and Figs. S2–S4. Curves were fit as described in Materials and Methods, and the effective concentration that induced 50% dissociation (EC50) was calculated. Error bars indicate the SE for at least two independent experiments.
Substituting ATP with the poorly hydrolyzable ATP analog, ATPγS had only a marginal effect on the hMSH2–hMSH6 release from the L90G/T substrate. The EC50•L90G/T•ATPγS was 1.39 ± 0.05 µM (Fig. S2). This effect is similar to that previously reported for hMSH2–hMSH6 (21) and bacterial MutS (43). It is likely that the sliding-clamp dissociation in the presence of ATPγS results from the clamp sliding of the dsDNA end, which may be prevented by blocking the ends of the duplex. As expected, ATP was much less effective at inducing the release of hMSH2–hMSH6 from the streptavidin-bound bio-L90G/T, SA-L90G/T (Fig. S3_A_, lanes 4–8 and Fig. S3_B_, EC50_•_SA-L90G/T•ATP = 87.4 ± 1.3 µM) than from bio-L90G/T or L90G/T (Fig. S4_A_, lanes 1–3). ATPγS had a similar effect on hMSH2–hMSH6 dissociation from SA-L90G/T (Fig. S3 C and D, EC50_•_SA-L90G/T•ATPγS = 56.7 ± 0.5 µM) as ATP. Interestingly, hMSH2–hMSH6 sliding clamps formed on the D-loop were less stable (EC50• D50G/T•ATP = 5.9 ± 0.1 µM) than those formed on double-blocked end SA-L90G/T, suggesting a D-loop–specific dissociation mechanism of hMSH2–hMSH6 sliding clamp.
Once hMSH2–hMSH6 forms an ATP-bound sliding clamp, it diffuses from the mismatch and may ultimately encounter the upstream or downstream branch point of the D-loop. Two recent reports have demonstrated that duplex discontinuities promoted dissociation of an ATP-bound MutS sliding clamp from linear mismatched DNA whose ends were blocked to prevent sliding from the open-ends (14, 44). We considered the possibility that the displaced ssDNA at the branch point of the D-loop may present a similar discontinuity that would provoke hMSH2–hMSH6 sliding-clamp release. First, we examined hMSH2–hMSH6 sliding-clamp release from the substrates in which both 5′ and 3′ ends of the invading DNA strand were blocked by biotin–streptavidin (SA) (Table S2). Importantly, the presence of biotin or biotin-SA did not affect hMSH2–hMSH6 binding to the mismatched DNA (Fig. 2_C_, lanes 2 and 5). The addition of ATP induced release of hMSH2–hMSH6 from bio-D50G/T similar to that observed for D50G/T (Fig. 2_C_, lane 3). In contrast, ATP was 25-fold less effective at inducing the release of hMSH2–hMSH6 from the streptavidin-bound bio-D50G/T, SA-D50G/T (Fig. 2_C_, lanes 6–8 and Fig. 2_H_, EC50_•_SA-D50G/T•ATP = 148.4 ± 0.1 µM). These results are consistent with the conclusion that hMSH2–hMSH6 forms stable ATP-bound sliding clamps on the SA-D50G/T DNA. The enhanced stability of hMSH2–hMSH6 on SA-D50G/T DNA in the presence of ATP was consistent with the hypothesis that blocking the ends of the heteroduplex prevented hMSH2–hMSH6 contact with the strand scissions and/or the displaced ssDNA. To determine whether the strand scissions at the branch points promoted the dissociation of ATP-bound sliding clamps, we examined hMSH2–hMSH6 binding and stability on a mismatch-containing dual-T15 flap D-loop (Flap-D50G/T) (Table S2). ATP challenge resulted in the release of hMSH2–hMSH6 from Flap-D50G/T that was similar to the ATP-induced release of hMSH2–hMSH6 from D50G/T (Fig. 2_D_, lanes 1–5 and Fig. 2_H_, EC50•Flap-D50G/T•ATP = 8.2 ± 0.1 µM). Thus, elimination of the strand scissions at the branch points of the D-loop was not sufficient to stabilize an ATP-bound hMSH2–hMSH6 sliding clamp. Moreover, when the shorter heteroduplex region was flanked by the ssDNA gaps near the branch point of the D-loop (Fig. S4 A and B), we observed an increase in the hMSH2–hMSH6 sliding-clamp stability (EC50• D50+20G/T•ATP = 41.4 ± 0.7 µM), suggesting that the structure of the D-loop branch point and not the presence of ssDNA at the junction induces hMSH2–hMSH6 dissociation.
To further confirm that hMSH2–hMSH6 sliding clamp does not slide of the ends of the D-loop, we tested its ATP-induced release from the D-loop with double-blocked ends (Table S2). The EC50•SA-flapD50G/T•ATP was 7.7 ± 0.1 µM, which is almost identical to that determined for D50G/T (Fig. S4) and for the dual flap containing D-loop Flap-D50G/T (Fig. 2).
Remarkably, ATPγS was nearly 50-fold less effective in provoking hMSH2–hMSH6 release from the mismatch-containing D-loop (Fig. 2_E_, lanes 6–10 and Fig. 2_H_, EC50_•_D50G/T_•_ATPγS = 359 ± 1.2 µM). These results strongly suggest that hMSH2–hMSH6 release from a mismatch-containing D-loop requires ATP hydrolysis.
HsRPA Bound to the Displaced ssDNA of the D-Loop Suppresses hMSH2–hMSH6 Release.
Eukaryotic ssDNA binding protein RPA associates with and protects single-stranded DNA in vivo (45). To determine whether HsRPA affects mismatch recognition and/or hMSH2–hMSH6 sliding-clamp release from the mismatch-containing D-loop, we first examined the binding of HsRPA to D50G/T by EMSA (Fig. S5). At low concentrations of HsRPA, a single complex with reduced mobility was observed. As the protein concentration was increased, a second complex with even slower mobility became dominant. These results suggest that two RPAs were bound to the 50 nt displaced ssDNA of the D-loop, which is consistent with the ∼30-nt binding site size of RPA (45). Using an EMSA assay, we demonstrated that hMSH2–hMSH6 bound D50G/T (Fig. 2_F_, lanes 1–5) and HsRPA-coated D50G/T complex with similar apparent affinities (K_D_•RPA-D50 G/T = 20 ± 5 nM) (Fig. 2_F_, lanes 6–10). These results indicate that HsRPA does not contribute positively or negatively to hMSH2–hMSH6 binding affinity. Moreover, these results confirmed that the displaced ssDNA of the D-loop is unlikely to be encompassed by the bound hMSH2–hMSH6 because the clamp cavity is clearly too small to encompass an HsRPA-bound displaced ssDNA: the dsDNA binding cavity of hMSH2–hMSH6 clamp is 24 Å × 32 Å × 38 Å (11), whereas RPA–ssDNA complex is ∼70 Å × 80 Å × 70 Å (46).
The amount of ATP required to release hMSH2–hMSH6 from the RPA-D50G/T D-loop was increased sixfold compared with D50G/T (Fig. 2_G_, lanes 1–5 and Fig. 2_H_, EC50_•_RPA-D50G/T_•_ATP· = 36.3 ± 0.2 µM). Taken together with analysis of the SA-D50G/T substrate in which the heteroduplex region is blocked by streptavidin (Fig. 2_C_), these results are consistent with the hypothesis that physical interaction with the D-loop branched structure including the displaced ssDNA contributes to hMSH2–hMSH6 sliding-clamp release.
Collectively, these results lead to the conclusion that hMSH2–hMSH6 efficiently binds mismatches within the heteroduplex region of a D-loop and that ADP→ATP exchange results in the formation of a stable ATP-bound sliding clamp capable of transiting the heteroduplex region. However, contact with the displaced ssDNA or with the branch points of the D-loop may provoke ATP hydrolysis that releases the hMSH2–hMSH6 sliding clamps.
Single-Molecule Analysis Reveals DNA Binding Dynamics of Individual hMSH2–hMSH6 Complexes.
To quantify the binding kinetics of hMSH2–hMSH6 to the D-loop DNAs, we applied a TIRFM-based single-molecule colocalization analysis (47, 48). To facilitate surface tethering, the C terminus of hMSH2 was modified to include a BirA recognition sequence that allows covalent incorporation of a biotin moiety (bio-hMSH2–hMSH6). The bio-hMSH2–hMSH6 was expressed in Sf9 insect cells with the E. coli BirA, and the biotinylated heterodimer was purified as previously described (42). The bio-hMSH2–hMSH6 retained mismatched DNA binding activity comparable with that of the untagged protein (Fig. S6). To mediate protein tethering and to triangulate surface-bound bio-hMSH2–hMSH6 molecules, we injected Cy5-labeled streptavidin into the TIRFM flow chamber coated with PEG and biotinylated PEG. Bio-hMSH2–hMSH6 (100 pM) was then immobilized on the Cy5-streptavidin/bio-PEG coated surface via a streptavidin–biotin interaction. The locations of surface-tethered hMSH2–hMSH6 molecules were then identified using a TIRF field illumination with a 641-nm red laser specific for exciting Cy5 (Fig. 3_A_, Left). After 20 s, the laser was switched from red to green (532 nm) to monitor the binding of Cy3-labeled DNA substrates to the surface-tethered hMSH2–hMSH6 (Fig. 3_A_, Right). When the surface-bound bio-hMSH2–hMSH6 was exposed to 1 nM Cy3-D50G/T, about 100–300 fluorescence trajectories were observed that showed both Cy5 and Cy3 signals. On the contrary, very few (n < 10) trajectories displayed both Cy5 and Cy3 signals in the absence of bio-hMSH2–hMSH6, suggesting that the vast majority of binding events resulted from specific hMSH2–hMSH6-DNA interaction. A representative profile of a binding event with surface-bound bio-hMSH2–hMSH6 details the time-dependent appearance and disappearance of the Cy3-D50G/T (Fig. 3_B_).
Fig. 3.

Single-molecule analysis of hMSH2–hMSH6 binding to mismatch-containing DNA. (A) hMSH2–hMSH6 was immobilized on the surface of the TIRFM flow cell chamber via biotin-streptavidin interaction. The experiment was carried out in two steps: (i) the positions of hMSH2–hMSH6 molecules were triangulated by exciting Cy5 label in the streptavidin with a red laser (640 nm) and (ii) DNA-hMSH2–hMSH6 interaction was monitored using green TIR illumination (532 nm). (B) Representative Cy3 (green) and Cy5 (red) fluorescence intensity trajectories from a single hMSH2–hMSH6 molecule. Black line represents the fitted data. Durations 1 and 2 depict periods of red and green excitation, respectively. τon (bound) and τoff (free) dwells are indicated. Binding of a Cy3-DNA molecule to the surface-tethered hMSH2–hMSH6 constrains the DNA within the evanescent field where its Cy3 dye is excited. Thus, the duration of each binding event (τon) corresponds to the presence of the Cy3 signal at the location of tethered hMSH2–hMSH6. Dissociation (τoff) results in loss of Cy3 fluorescence because the fluorophore diffuses out of the evanescent field. (C) Normalized probability distributions for all τon (Left) and τoff (Right) event durations detected in 100 trajectories of individual hMSH2–hMSH6 molecules in the presence of 1 nM L90G/T (black) and D50G/T (red) and 100 μM ADP. The average dwell times, τon and τoff, were obtained by fitting the respective dwell-time distributions to a single exponential decay. (D) Effect of DNA concentration on the τon and τoff. Shaded part of Right corresponds to the linear range of the association rate dependence on the substrate concentration. The data within this range were used to calculate the association rate constants and the _K_Ds.
We examined the binding of L90A/T, L90G/T, D50A/T, and D50G/T DNA substrates to surface-tethered hMSH2–hMSH6 (Fig. S7). Individual fluorescence trajectories were easily fitted to a two-state binding and dissociation model, suggesting that each observed event corresponded to binding of a single Cy3-labeled DNA to a single surface-tethered hMSH2–hMSH6 molecule (Fig. S7_C_). Because of the poor binding of hMSH2–hMSH6 to L90A/T and D50A/T homoduplex DNA, we were unable to collect the number of Cy3-DNA binding events sufficient to accurately fit the data (n < 20). Previously, Gorman et al. reported that Sacchromyces cerevisae ScMsh2–ScMsh6 heterodimer undergoes 1D diffusion on the homoduplex dsDNA with the apparent unidirectional diffusion rate of 820 bp/s (20). Time resolution and the signal/noise (S/N) threshold of our experimental system exacerbated by the 90-bp length of the DNA substrates prevented accurate analysis of such transient interactions between hMSH2–hMSH6 and homoduplex DNA.
The dwell times of the bound state (τon) and the dwell times between binding events (τoff) for hMSH2–hMSH6 interaction with the linear and D-loop mismatch-containing substrates (L90G/T and G50G/T) were extracted from the individual trajectories, binned, and plotted as histograms. These histograms were fit to a single exponential decay (Fig. 3_C_) to determine the dissociation rate constant (_k_off = 1/τon), the association rate constant (_k_on = 1/τoff•[DNA]), and the equilibrium dissociation constant (_K_D = _k_off/_k_on). Both, the linear duplex and the D-loop mismatch-containing DNA substrates bound with similar kinetics and affinity to the surface-tethered hMSH2–hMSH6 (compare τon•L90G/T = 6.6 ± 0.01 s and _K_D•L90G/T = 5.4 ± 0.1 nM with τon•D50G/T = 7.5 ± 0.04 s and _K_D•D50G/T = 4.5 ± 0.1 nM) (Table 1). Binding affinities derived from the single-molecule analysis were similar to published surface plasmon resonance (SPR) studies (37) and were severalfold more avid than those determined by EMSA (Fig. 1_C_). It is likely that EMSA underestimates the binding affinity due to dissociation of transient protein–DNA complexes during electrophoretic separation. As expected for the first order rate constant, the _k_off (and the respective “on” dwell time, τon) was independent of DNA concentration (Fig. 3_D_, Left) whereas the association rate (_v_on = 1/τoff = _k_on•[DNA]) displayed a linear dependence on the DNA concentration in the range between 0 and 1 nM DNA (Fig. 3_D_, Right, shaded portion).
Table 1.
DNA binding kinetics and stabilities of hMSH2–hMSH6·DNA complexes
| Substrate* | Cofactor† | τon‡, s | τsc, s | τoff, s | _k_off, s−1 × 10⁻¹ | _k_on, M-1⋅s−1 × 10⁷ | _K_D§, nM |
|---|---|---|---|---|---|---|---|
| L90A/T | ADP | n.d.¶ | n.d. | n.d. | n.d. | n.d. | n.d. |
| L90G/T | ADP | 6.6 ± 0.1 | n.d. | 35.3 ± 2.6 | 1.5 ± 0.1 | 2.8 ± 0.2 | 5.4 ± 0.1 |
| 6.9 ± 0.7[| | ](#tfn6) | ||||||
| D50A/T | ADP | n.d. | n.d. | n.d. | n.d. | n.d. | n.d. |
| D50G/T | ADP | 7.5 ± 0.4 | n.d. | 34.2 ± 2.4 | 1.3 ± 0.1 | 2.9 ± 0.2 | 4.5 ± 0.1 |
| 7.9 ± 0.8 | |||||||
| SA-L90G/T | ADP | 5.5 ± 0.7 | n.d. | 21.6 ± 2.9 | 1.8 ± 0.2 | 4.6 ± 0.6 | 3.9 ± 0.3 |
| 5.7 ± 0.9 | |||||||
| D50G/T +RAD51 | ADP | 6.6 ± 0.3 | n.d. | 52.4 ± 9.3 | 1.1 ± 0.2 | 1.8 ± 0.3 | 6.1 ± 0.2 |
| 6.9 ± 0.7 | |||||||
| L90G/T | ATP | 4.9 ± 0.5 (94.7%) | 67.2 (5.3%) | 33.1 ± 4.0 | 2.1 ± 0.2 | 0.5 ± 0.1 | n.d. |
| 5.0 ± 0.7 | 113.9 | ||||||
| L90G/T | ATPγS | 6.4 ± 0.6 (93.6%) | 88.3 (6.4%) | 49.4 ± 5.7 | 1.6 ± 0.2 | 0.3 ± 0.1 | n.d. |
| 6.7 ± 0.9 | 191.3 | ||||||
| D50G/T | ATP | 8.6 ± 0.8 (84.5%) | 86.4 (15.5%) | 48.1 ± 6.6 | 1.2 ± 0.1 | 0.3 ± 0.1 | n.d. |
| 9.1 ± 1.2 | 182.6 | ||||||
| D50G/T +RPA | ATP | 9.2 ± 1.1 (77.2%) | 92.5 (22.8%) | 51.2 ± 8.7 | 1.1 ± 0.1 | 0.24 ± 0.04 | n.d. |
| 9.7 ± 1.4 | 212.2 | ||||||
| D50G/T | ATPγS | 14.3 ± 2.3 (64.7%) | 105.8 (35.8%) | 131.9 ± 27.4 | 0.7 ± 0.1 | 0.16 ± 0.02 | n.d. |
| 15.7 ± 2.7 | 298.1 | ||||||
| SA-L90G/T | ATP | 26.8 ± 4.2 (61.2%) | 112.8 (38.8%) | 111.0 ± 12.4 | 0.4 ± 0.1 | 0.09 ± 0.02 | n.d. |
| 32.0 ± 4.9 | 361.3 | ||||||
| D50G/T +RAD51 | ATP | 19.8 ± 2.1 (79.4%) | 112.9 (20.6%) | 192.0 ± 85.7 | 0.5 ± 0.1 | 0.1 ± 0.01 | n.d. |
| 22.5 ± 2.9 | 362 |
ATP Promotes Formation of Long-Dwelling Complexes Between hMSH2–hMSH6 and a Mismatch-Containing D-Loop.
To quantify the binding/dissociation/sliding-clamp kinetics, we performed single-molecule binding analysis in the presence of ATP or ATPγS. Our EMSA results suggested that ATP binding by hMSH2–hMSH6 results in the formation of a sliding clamp that is released from the mismatch and is capable of diffusion along dsDNA where it may encounter and dissociate from the D-loop branch point (Fig. 4_A_). Unlike DNA binding in the absence of ATP (Fig. 3), the distribution of τon events in the presence of ATP could not be fit to a simple single exponential (Fig. 4_B_, Left). Instead, the distribution could be roughly divided into two segments at about 50 s. The first segment (τon) (Fig. 4_B_) follows a single exponential decay. The second segment (τSC) (Fig. 4_B_) represents longer dwelling species whose lifetime and decomposition likely reflect sliding-clamp (SC) formation that proceeds via multiple kinetic steps. The number of these steps is unclear, which precludes calculation of the respective rate constants and _K_D. Interestingly, the τon•ATP (τon •L90G/T•ATP = 4.9 ± 0.5 s and τon•D50G/T•ATP = 8.6 ± 0.8 s in Table 1) appeared quite similar to τon•ADP (τon •L90G/T•ADP = 6.6 ± 0.1 s and τon•D50G/T•ADP = 7.5 ± 0.4 s in Table 1). These results suggest that a large fraction of the DNA binding events in the presence of ATP are simple mismatch association–dissociation similar to those observed in the absence of ATP.
Fig. 4.

Single-molecule analysis of hMSH2–hMSH6 binding to mismatch-containing DNA in the presence of ATP or ATPγS. (A) ATPase cycle of hMSH2–hMSH6 starts with mismatch recognition by the ADP-bound clamp. ADP→ATP exchange induces a conformational transition that converts hMSH2–hMSH6 into sliding clamp that encircles dsDNA but is free to diffuse along the duplex. (B_–_D) D-loop binding by hMSH2–hMSH6 in the presence of 100 μM ATP or ATPγS. (B) Normalized distribution of all τon event durations detected in 100 trajectories of individual hMSH2–hMSH6 molecules for SA-L90G/T·ATP (see Table 1 for the analysis of all substrates). Binding events for these and all other substrates were separated as short 0–50 s and long-lived species (>50 s). (C) The fraction of long binding events >50 s for each substrate. (D) τoff for each substrate was determined by fitting the off time distributions to the single exponentials.
The number of long-lived binding intermediates (τSC, Table 1) was threefold greater for the D50G/T D-loop DNA substrate (15.5%) (Fig. 4_B_, Inset and Table 1) compared with the L90G/T linear DNA substrate (5.3%) (Fig. 4_B_, Inset and Table 1). These observations are consistent with the EMSA results suggesting that the long-lived intermediates corresponding to ATP-bound hMSH2–hMSH6 sliding clamps are confined within a mismatch-containing D-loop and persist longer than on linear open-ended DNA. The typical dwell times of these stable complexes were comparable with the photobleaching time constant of the Cy3 dye (τbleaching = 164 ± 16 s). The calculated average dwell times were adjusted for Cy3 photobleaching. We found that the dwell time (>50 s) of the D50G/T D-loop DNA substrate with hMSH2–hMSH6 marginally increased compared with the L90G/T linear DNA substrate (τSC•L90G/T•ATP = 113.9 s and τSC•D50G/T•ATP = 191.3 s) (Table 1). Notably, both the fraction of the long-dwelling species (38.8%) and their average life time (τSC•SA-L90G/T•ATP = 361.3 s) were significantly higher when the ends of the linear mismatched DNA (SA-L90G/T) were blocked (Fig. S8), suggesting difference in the stability of the hMSH2–hMSH6 sliding clamps trapped inside the D-loops compared with linear DNA with blocked ends.
The addition of HsRPA or substituting ATPγS for ATP increased the fraction of the long-lived complexes to 22.8% and 35.8%, respectively (Fig. 4_B_, Inset), and their average dwell time also increased (τSC•RPA-D50G/T•ATP = 212.2 s and τSC•D50G/T•ATPγS = 298.1 s) (Table 1). Consistent with the EMSA studies, these observations suggest that protection of the exposed ssDNA loop by HsRPA or including the poorly hydrolyzable analog of ATP, ATPγS, enhances the stability of bound D-loop substrates. This ATPγS effect is D-loop structure specific because substitution of ATP with ATPγS on L90G/T did not significantly affect the dwell time of the complex (Fig. 4 B and C and Table 1). Interestingly, the association rate constant (_k_on) for the L90G/T and D50G/T DNA substrates decreased 6- to 10-fold in the presence of ATP (Fig. 4_C_ and Table 1). This observation suggests that ATP may induce a transient conformation of hMSH2–hMSH6 that has reduced mismatch-binding activity. Indeed, ATPγS increases the k on ∼20-fold, suggesting that the hMSH2–hMSH6 must undergo complete hydrolysis of the bound ATP into the mismatch binding competent ADP-bound form, as proposed by previous studies (42).
The Ability of hMSH2–hMSH6 to Bind a Mismatch Is Not Hindered by HsRAD51.
The D-loop strand invasion intermediate of HR is expected to be coated with RAD51 nucleoprotein filament (NPF) in vivo, which then remains associated with heteroduplex after the strand exchange (49, 50). To determine whether the postsynaptic human HsRAD51–dsDNA nucleoprotein filament affects mismatch recognition by hMSH2–hMSH6, we constructed a 28-bp duplex containing a single central G/T mismatch and corresponding homoduplex control (L28G/T and L28A/T) (Table S2). These DNA substrates engender the binding-site size of hMSH2–hMSH6 and should be fully occluded by a single bound hMSH2–hMSH6 (11, 38).
Adenosine nucleotide and salt affect the formation of an HsRAD51 NPF on duplex DNA (51). We used buffer conditions in which HsRAD51 bound to the 28-bp dsDNA with or without mismatch in the presence of ADP or ATP yielding slow migrating species in EMSA (52). We found that hMSH2–hMSH6 did not bind to the HsRAD51-coated L28A/T homoduplex DNA in the presence of ADP (Fig. 5_A_, lanes 1 and 2) or ATP (Fig. 5_B_, lanes 1 and 2). In contrast, specific binding of the L28G/T-mismatched DNA was readily observed in the presence of ADP (Fig. 5_A_, lane 6 and Fig. 5_B_, lane 10) but not in the presence of ATP (Fig. 5_B_, lane 6). When the HsRAD51·L28G/T NPF complex was challenged with hMSH2–hMSH6 in the presence of ADP, the HsRAD51·L28G/T NPF band was reduced to a faster migrating band that corresponded to the hMSH2–hMSH6-L28G/T DNA complex (Fig. 5_A_, lanes 7–9). This observation is consistent with the conclusion that hMSH2–hMSH6 efficiently competes for HsRAD51 binding to the mismatched DNA in the presence of ADP. A similar competition did not occur in the presence of ATP (Fig. 5_B_, lanes 7–9). We consider at least two possibilities: (i) ATP enhances the stability of the HsRAD51 NPF, or (ii) ATP binding by hMSH2–hMSH6 converts it into a form that has reduced mismatch binding activity or into a sliding clamp that dissociates from the open end of the L28G/T DNA substrate. Unfortunately, the EMSA-based studies were unable to resolve the large size of an HsRAD51-bound D-loop DNA substrate for similar hMSH2–hMSH6 binding studies.
Fig. 5.

The effect of HsRAD51 on DNA binding by hMSH2–hMSH6. (A and B) An L28 DNA substrate (20 nM) with or without a central G/T mismatch was incubated with HsRAD51 (1.5 μM). hMSH2–hMSH6 at indicated concentrations was introduced in the presence of 1 mM ADP (A) or ATP (B). Reaction mixture was then subjected to EMSA. The location of HsRAD51-bound, hMSH2–hMSH6-bound and unbound DNA is indicated on the Left. The red dots indicate the hMSH2–hMSH6-bound species. (C) Single-molecule binding experiment to define interactions between hMSH2–hMSH6 and an HsRAD51-coated D-loop. The experimental design is schematically illustrated on the Left. Normalized distributions of τon (Center) and τoff (Right) dwell times detected in the 100 trajectories derived from individual hMSH2–hMSH6 molecules were fit to single exponentials. (D) The same as in C, but in the presence of ATP. D50G/T concentrations in C and D were 1 nM and 5 nM, respectively.
Instead, we used smTIRFM analysis to examine the binding of HsRAD51-coated DNA substrates to the surface-tethered bio-hMSH2–hMSH6 (Fig. 5 C and D). Under the binding conditions used in this study, HsRAD51 forms an NPF on the displaced ssDNA as well as the duplex or heteroduplex regions (52). The histogram of τon and τoff events for HsRAD51-D50G/T binding to hMSH2–hMSH6 in the presence of ADP could be fit to a single exponential decay and ultimately yielding the equilibrium dissociation constant (τon•RAD51-D50G/T•ADP = 6.6 ± 0.3 s and _K_D = 6.1 ± 0.2 nM). The duration of τon and _K_D were comparable with those measured for D50G/T in the absence of HsRAD51 (compare rows 4 and 5 in Table 1), suggesting that hMSH2–hMSH6 efficiently recognizes a D-loop containing a mismatch that is coated by the HsRAD51 NPF in the presence of ADP. The addition of ATP significantly increased both the τon and τoff of HsRAD51-D50G/T with hMSH2–hMSH6 (Fig. 5_D_ and Table 1) thereby decreasing both the association and dissociation rates of the complex. These results suggest that, in the presence of ATP, hMSH2–hMSH6 does not access the HsRAD51-coated D-loop containing a mismatch as efficiently as naked DNA or in the presence of ADP (_k_on decreases ∼3- and 18- fold, respectively) (Table 1), suggesting that hMSH2–hMSH6 access to mismatch may rely on the dynamic nature of the postsynaptic RAD51 nucleoprotein.
Nevertheless, 20.6% of the HsRAD51-D50G/T binding events to hMSH2–hMSH6 were long-lived (τSC) and appear to result in the formation of an ATP-bound sliding clamp that persists for nearly 6 min (Table 1). Moreover, similar binding was observed when D-loops were produced by the HsRAD51-mediated invasion of a 50-mer oligonucleotide into ϕX-174 supercoiled DNA (Fig. S9 and Table S3). Of the ϕX-174/Cy3-50G/T D-loop binding events to hMSH2–hMSH6, 14.1% were long-lived (τSC) and can be attributed to the formation of an ATP-dependent sliding clamp (Table S3). Interestingly, binding events were observed for the ϕX-174 D-loop without mismatch (ϕX-174/Cy3-50G/C). These events likely represent transient mismatch-searching processes by hMSH2–hMSH6 on the substrate, which is more than 5,000 bp in length (14, 20). The off dwell time distributions were fitted to double exponential in which τoff1 and τoff2 represent binding of Cy3-labeled ssDNA (4 nM) and D-loop (200 pM), respectively, because only τoff1 component was detected by removing supercoiled DNA from the reaction (Cy3-50G/T + RPA + RAD51) (Table S3). In the presence of ADP and ATP, the _k_on2 were 2.5- and 30-fold faster than the _k_on for the HsRAD51-bound short synthetic D-loop obtained under identical conditions (Table 1 and Table S3). These results support previous studies that demonstrated that MSH proteins search and then bind to a DNA mismatch through a 2D sliding mechanism (14, 17–20). Taken as a whole, we conclude that hMSH2–hMSH6 recognizes mismatch within D-loop formed by RAD51 and is capable of forming an ATP-bound sliding clamp.
Discussion
HR is initiated by formation of a RAD51 NPF on ssDNA that is then followed by a homology recognition and strand exchange (25). An important step ensuring the fidelity of this process is the assessment of sequence identity between paired strands of heteroduplex DNA (31, 53). A large body of evidence has suggested that the MMR machinery plays a central role in rejecting heteroduplex DNA containing a mismatch and that this role is particularly important during repair of highly repetitive DNA and of the common fragile sites (1, 3, 54). Here, we demonstrated that the first MMR responder in humans, hMSH2–hMSH6, is able to recognize a mismatch within the heteroduplex region of a D-loop recombination intermediate (Figs. 1 and 3). Recognition of a mismatch-containing D-loop by hMSH2–hMSH6 readily occurs in the presence of HsRPA and HsRAD51, which are expected to be associated with this HR intermediate in vivo (Figs. 2 and 5). At this point, it is not clear whether hMSH2–hMSH6 can displace RAD51 NPF. Additional factors such as RAD54 might be necessary to dissociate the RAD51 NPF from the newly formed heteroduplex dsDNA (55). Alternatively, multiple events of hMSH2–hMSH6 loading may enhance disassembly of the dynamic RAD51 filament by a mechanism similar to hMSH2–hMSH6-mediated nucleosome remodeling (56).
ATP binding by hMSH2–hMSH6 results in the formation of a sliding clamp that is released from the mismatch and diffuses along the DNA duplex (17, 21). In the case of HR intermediates, the ATP-bound hMSH2–hMSH6 sliding clamp is confined within the mismatch-containing D-loop until it comes in contact with displaced ssDNA strand or with the branch points at the end of the D-loop (Figs. 2 and 4). The stability of the trapped hMSH2–hMSH6 is greatly enhanced by blocking the ends of the heteroduplex region with biotin-streptavidin, including ATPγS instead of ATP, or sequestering the ssDNA loop by HsRPA. Our EMSA and TIRF binding assays showed that ATP-bound hMSH2–hMSH6 sliding clamps on mismatch-containing D-loops are less stable than on a duplex DNA containing a mismatch and no other discontinuities (exemplified in our studies by the double-blocked dsDNA) (Fig. S4 and Fig. S9) consistent with the previous studies using SPR or TIRF system (14, 18, 42). These results suggest that the mismatch processing during replication-coupled MMR is likely to be more efficient than heteroduplex rejection that blocks homeologous recombination. This observation has important implications for the DNA transactions that are implicit in Mendelian genetics because extremely efficient heteroduplex rejection during HR could eliminate all gene-conversion events and perhaps a substantial number of crossovers.
We note that the release of hMSH2–hMSH6 by a D-loop branch point is qualitatively similar to the observation that an ssDNA tail or gap on a mismatched duplex DNA provokes the release of a Thermus aquaticus TaqMutS sliding clamp (14, 44). These results are consistent with the possibility that the release of hMSH2–hMSH6 is the result of branch point-induced ATP hydrolysis (Fig. 2 and 4) that may open the sliding clamp. The ATPase domains of hMSH2 and hMSH6 contain nucleotide binding motifs of ABC ATPase superfamily (10). A comparable arrangement of two complementing ABC ATPase domains is also observed in the DNA repair protein RAD50 (57), RecF (58), and other SMC-related proteins. Interestingly, structural and functional studies of RAD50 and RecF suggest that both proteins use similar mechanisms of dsDNA boundary recognition (58). Encountering ssDNA–dsDNA boundaries or dsDNA discontinuities induces conformational changes that may be important for regulating RAD50 and RecF interactions with protein partners and thereby for the downstream functional processes or signaling (59). Thus, related ABC ATPases involved in DNA repair may retain general features that couple an encounter of dsDNA discontinuities to ATP processing and/or protein recruiting.
Combined with previous studies, the data presented here suggest a simple model that explains the similarities and differences in downstream processing during postreplication MMR and heteroduplex rejection (Fig. 6). The initial mismatch recognition and sliding-clamp formation during both MMR and heteroduplex rejection depends on hMSH2–hMSH6 mismatch binding nucleotide exchange. Our data suggest that this process is identical whether the mismatch is within a duplex DNA or within the heteroduplex region of a D-loop coated with RPA and/or RAD51 (Fig. 6 A and B). During postreplication MMR, the ATP-bound hMSH2–hMSH6 sliding clamps encounter replication machinery such as PCNA and attract downstream MMR components such as hMLH1-hPMS2 and hExoI to complete the MMR excision reaction (Fig. 6_C_) (5). The mechanism by which hMSH2–hMSH6 distinguishes the mismatch-containing HR intermediate and activates downstream effectors of heteroduplex rejection is unknown. Ample genetic evidence suggests that UvrD helicase in E. coli and Sgs1 helicase in S. cerevisiae are involved in heteroduplex rejection (60, 61). Msh2 localizes to recombination intermediates in vivo (62), and subsequent heteroduplex rejection during single-strand annealing requires the Sgs1 helicase and Msh2-Msh6 (30). Moreover, the human RecQ family helicases BLM and WRN (63, 64) and FANCJ helicase (65) physically and functionally interact with the MMR-components. And a single G/T mismatch located ahead of the fork junction increased the efficiency of the hMSH2–hMSH6-dependent unwinding by WRN helicase (63). This observation is consistent with the idea that, when an ATP-bound hMSH2–hMSH6 sliding clamp encounters a duplex–ssDNA junction, it may undergo structural changes that facilitate loading of the helicase. Similarly, ATP-bound hMSH2–hMSH6 sliding clamps with or without hMLH1-hPMS2 might recruit antirecombinogenic helicases that are specific for the duplex–ssDNA branch points where they may catalyze unwinding of the D-loop (Fig. 6_D_). Further studies will be required to fully detail the mechanics of heteroduplex rejection and involvement of different MMR and HR components in this process.
Fig. 6.

A role for hMSH2–hMSH6 in MMR and heteroduplex rejection. (A) hMSH2–hMSH6 recognizes G/T mismatch within linear DNA or D-loop. (B) hMSH2–hMSH6 forms an ATP-bound sliding clamp following the exchange of ADP→ATP. (C) In postreplication MMR, the sliding clamp recruits downstream MMR factors such as hMLH1-hPMS2 and hExoI and interacts with replication factors such as PCNA. Duplex discontinuity (nick) and perhaps PCNA allow these factors to identify the correct strand for excision (3). (D) In heteroduplex rejection, the ATP-bound hMSH2–hMSH6 sliding clamp recruits downstream heteroduplex rejection factors that may include a subset of the MMR machinery such as hMLH1-hPMS2 and hExoI or perhaps helicases capable of unwinding the D-loop such as BLM, WRN, or FANCJ. An encounter with a nick (MMR) and/or the branch points (heteroduplex rejection) of the D-loop may result in distinct downstream processing and thereby distinguish the two mechanisms.
Materials and Methods
Protein and DNA Substrates.
hMSH2–hMSH6, biotinylated hMSH2–hMSH6, HsRPA, and HsRAD51 were expressed and purified as previously described (42, 52, 66). Cy5-labeled streptavidin was purchased from GE healthcare and purified from excess of unincorporated dye by size exclusion chromatography using a Superdex 200 column. Oligonucleotide substrates were purchased from IDT. The sequences, modifications, D-loop configurations, and purification procedures for all substrates are shown in Tables S1 and S2 and SI Materials and Methods.
EMSA DNA Binding Assay.
Indicated concentrations of hMSH2–hMSH6 were mixed with 10 nM Cy3-labeled DNA substrates in 10 μL of standard reaction buffer containing 20 mM Hepes (pH 7.5), 150 mM KCl, 2 mM MgCl2, 10% (vol/vol) Glycerol, 0.1 mg/mL BSA, 2 ng/μL poly(dI/dC), and 1 mM DTT. The reaction mixtures were incubated at 37 °C for 5 min, supplemented with 25 μM ADP indicated and incubated for another 5 min at 37 °C. The bound and free DNA species were resolved by the nondenaturing 3.5% polyacrylamide gel electrophoresis in TAE buffer [40 mM Tris-Acetate (pH 8.0) and 1 mM EDTA]. The gel was imaged using a Typhoon 9400 fluorescence imager (GE Healthcare) or ChemiDoc (Bio-Rad) by exciting and monitoring Cy3 fluorescence.
The fractions of mobility shifted substrate were quantified, plotted and analyzed using GraphPad Prism. The apparent equilibrium binding constants were obtained by fitting the data to the 1:1 binding equation:
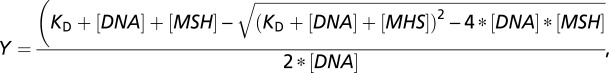
where _K_D is the equilibrium dissociation constant, [DNA] is concentration of the DNA substrate (10 nM), and [MSH] is the concentration of hMSH2–hMSH6.
EMSA RAD51 Nucleoprotein Filament Binding Assay.
To assemble HsRAD51 nucleoprotein filaments, 20 nM Cy3-labeled L28G/T or L28A/T were combined with 1.5 µM HsRAD51 protein and preincubated for 10 min at 37 °C in a buffer containing 20 mM Hepes (pH 7.5), 150 mM KCl, 2 mM MgCl2, 10% Glycerol, 0.1 mg/mL BSA, 2 ng/μL dI/dC DNA, 1 mM DTT, 1mM nucleotide (ATP or ADP), and the indicated concentration of HsRAD51. After preincubation, HsRAD51-coated DNA was challenged with indicated concentrations of hMSH2–hMSH6 and further incubated for 10 min at 37 °C.
ATP Challenge Assay.
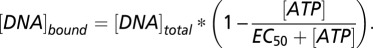
The hMSH2–hMSH6–DNA complexes were assembled in the standard reaction buffer as described above for the EMSA-based binding assays. The hMSH2–hMSH6 release from the mismatch was then initiated by addition of ATP at indicated concentrations. The effective concentration of ATP for 50% hMSH2–hMSH6 release (EC50) was determined by quantitating the EMSA bound fraction and fitting the curve to the following equation:
Single-Molecule Analysis.
Bio-hMSH2–hMSH6 was immobilized on a PEG (Laysan Bio)-coated quartz slide via a streptavidin linkage to biotinylated PEG (Nectar Therapeutics). Cy5-labeled streptavidin (GE Healthcare) was used to triangulate possible locations of the immobilized hMSH2–hMSH6 protein on the microscope slide. The single-molecule standard reaction buffer consisted of 20 mM Hepes (pH 7.5), 150 mM KCl, 2 mM MgCl2, 10% Glycerol, 0.1 mg/mL BSA, 1 mM DTT, 1 mg/mL Trolox (6-hydroxy-2,5,7,8-tetramethylchroman-2-carboxylic acid; Sigma-Aldrich), 1 mg/mL glucose oxidase (Sigma-Aldrich), 0.4% (wt/vol) D-glucose (Sigma-Aldrich), and 0.04 mg/mL catalase (Calbiochem). Immobilization of 100 pM Cy5-SA followed by addition of 100 pM biotinylated hMSH2–hMSH6 resulted in 100–300 surface-tethered hMSH2–hMSH6 molecules in the field of view. After Cy5-SA and bio-hMSH2–hMSH6 immobilization on the slide surface, Cy3-labeled DNA was added and incubated for 5 min at 25 °C in the reaction buffer, in the presence of 100 μM nucleotide cofactor (ADP, ATP, or ATPγS as indicated in Table 1), HsRPA, and/or HsRAD51 before the start of data collection. In the case of mismatch-containing DNA, we routinely detected 100–300 fluorescence trajectories originating from the individual molecules of surface-tethered hMSH2–hMSH6 per slide.
Prism-type TIRFM was used to excite fluorophores present on the streptavidin (Cy5) and DNA (Cy3) molecules. Cy3 and Cy5 fluorophores were excited by a DPSS laser (532 nm, 75mW; Coherent) and diode laser (640 nm, 100mW; Coherent), respectively. The fluorescence signals originated from the Cy3 and Cy5 dyes were collected by a water immersion 60× objective (Olympus), separated by a 630-nm dichroic mirror, passed through a 550-nm long-pass filter to eliminate laser scattering, and detected by EMCCD camera (Andor) with a time resolution of 100 ms. Single-molecule trajectories were extracted from the recorded video file by IDL software. An in-house MATLAB program was used to confirm the presence of Cy5-labeled streptavidin and of multiple substrate binding/dissociation events in the extracted trajectories. After visually inspecting the acquired data and removing the initial section that corresponded to the red laser illumination, two-state model fitting was performed using the QuB software (State University of New York, Buffalo, NY). Ten frames (1 s) was set as the signal/noise (S/N) threshold (longest undetected event) to cut off noise resulting from accidental appearance of the Cy3-labeled DNA within the evanescent field in the vicinity of the surface-tethered hMSH2–hMSH6. The extracted τon and τoff dwell-time events were binned and plotted in Origin using the embedded binning algorithm to select the appropriate bin size. The resulting distributions were fitted to single exponentials using GraphPad Prism software to extract the kinetic parameters.
To test whether the Cy3 dye photobleaching influences our analysis, we immobilized biotinylated Cy3-labeled DNA molecules (bio-Cy3DNA) (Table S1) on a PEG-coated surface and measured Cy3 bleaching times under conditions identical to the hMSH2–hMSH6 experiments. The lifetime of the Cy3 dye was calculated to be  = 164 ± 16 s, which is longer than most τon dwell times. This time constant was used to calculate the actual binding times as

Supplementary Material
Supporting Information
Acknowledgments
We thank Dr. M. Todd Washington (University of Iowa) and the M.S. laboratory and R.F. laboratory members for critically reading the manuscript. This work was supported by National Institutes of Health Grant CA67007 (to R.F.) and American Cancer Society Grant RSG-09-182-01-DMC (to M.S.).
Footnotes
The authors declare no conflict of interest.
This article is a PNAS Direct Submission.
References
- 1.Modrich P, Lahue R. Mismatch repair in replication fidelity, genetic recombination, and cancer biology. Annu Rev Biochem. 1996;65:101–133. doi: 10.1146/annurev.bi.65.070196.000533. [DOI] [PubMed] [Google Scholar]
- 2.Petit MA, Dimpfl J, Radman M, Echols H. Control of large chromosomal duplications in Escherichia coli by the mismatch repair system. Genetics. 1991;129(2):327–332. doi: 10.1093/genetics/129.2.327. [DOI] [PMC free article] [PubMed] [Google Scholar]
- 3.Jiricny J. The multifaceted mismatch-repair system. Nat Rev Mol Cell Biol. 2006;7(5):335–346. doi: 10.1038/nrm1907. [DOI] [PubMed] [Google Scholar]
- 4.Peltomäki P. Role of DNA mismatch repair defects in the pathogenesis of human cancer. J Clin Oncol. 2003;21(6):1174–1179. doi: 10.1200/JCO.2003.04.060. [DOI] [PubMed] [Google Scholar]
- 5.Kolodner RD, Marsischky GT. Eukaryotic DNA mismatch repair. Curr Opin Genet Dev. 1999;9(1):89–96. doi: 10.1016/s0959-437x(99)80013-6. [DOI] [PubMed] [Google Scholar]
- 6.Hombauer H, Campbell CS, Smith CE, Desai A, Kolodner RD. Visualization of eukaryotic DNA mismatch repair reveals distinct recognition and repair intermediates. Cell. 2011;147(5):1040–1053. doi: 10.1016/j.cell.2011.10.025. [DOI] [PMC free article] [PubMed] [Google Scholar]
- 7.Su SS, Lahue RS, Au KG, Modrich P. Mispair specificity of methyl-directed DNA mismatch correction in vitro. J Biol Chem. 1988;263(14):6829–6835. [PubMed] [Google Scholar]
- 8.Iyer RR, Pluciennik A, Burdett V, Modrich PL. DNA mismatch repair: Functions and mechanisms. Chem Rev. 2006;106(2):302–323. doi: 10.1021/cr0404794. [DOI] [PubMed] [Google Scholar]
- 9.Fishel R, Wilson T. MutS homologs in mammalian cells. Curr Opin Genet Dev. 1997;7(1):105–113. doi: 10.1016/s0959-437x(97)80117-7. [DOI] [PubMed] [Google Scholar]
- 10.Gorbalenya AE, Koonin EV. Superfamily of UvrA-related NTP-binding proteins. Implications for rational classification of recombination/repair systems. J Mol Biol. 1990;213(4):583–591. doi: 10.1016/S0022-2836(05)80243-8. [DOI] [PubMed] [Google Scholar]
- 11.Warren JJ, et al. Structure of the human MutSalpha DNA lesion recognition complex. Mol Cell. 2007;26(4):579–592. doi: 10.1016/j.molcel.2007.04.018. [DOI] [PubMed] [Google Scholar]
- 12.Obmolova G, Ban C, Hsieh P, Yang W. Crystal structures of mismatch repair protein MutS and its complex with a substrate DNA. Nature. 2000;407(6805):703–710. doi: 10.1038/35037509. [DOI] [PubMed] [Google Scholar]
- 13.Lamers MH, et al. The crystal structure of DNA mismatch repair protein MutS binding to a G x T mismatch. Nature. 2000;407(6805):711–717. doi: 10.1038/35037523. [DOI] [PubMed] [Google Scholar]
- 14.Jeong C, et al. MutS switches between two fundamentally distinct clamps during mismatch repair. Nat Struct Mol Biol. 2011;18(3):379–385. doi: 10.1038/nsmb.2009. [DOI] [PMC free article] [PubMed] [Google Scholar]
- 15.Spies M. There and back again: New single-molecule insights in the motion of DNA repair proteins. Curr Opin Struct Biol. 2013;23(1):154–160. doi: 10.1016/j.sbi.2012.11.008. [DOI] [PubMed] [Google Scholar]
- 16.Qiu R, et al. Large conformational changes in MutS during DNA scanning, mismatch recognition and repair signalling. EMBO J. 2012;31(11):2528–2540. doi: 10.1038/emboj.2012.95. [DOI] [PMC free article] [PubMed] [Google Scholar]
- 17.Gorman J, et al. Single-molecule imaging reveals target-search mechanisms during DNA mismatch repair. Proc Natl Acad Sci USA. 2012;109(45):E3074–E3083. doi: 10.1073/pnas.1211364109. [DOI] [PMC free article] [PubMed] [Google Scholar]
- 18.Cho WK, et al. ATP alters the diffusion mechanics of MutS on mismatched DNA. Structure. 2012;20(7):1264–1274. doi: 10.1016/j.str.2012.04.017. [DOI] [PMC free article] [PubMed] [Google Scholar]
- 19.Gorman J, Plys AJ, Visnapuu ML, Alani E, Greene EC. Visualizing one-dimensional diffusion of eukaryotic DNA repair factors along a chromatin lattice. Nat Struct Mol Biol. 2010;17(8):932–938. doi: 10.1038/nsmb.1858. [DOI] [PMC free article] [PubMed] [Google Scholar]
- 20.Gorman J, et al. Dynamic basis for one-dimensional DNA scanning by the mismatch repair complex Msh2-Msh6. Mol Cell. 2007;28(3):359–370. doi: 10.1016/j.molcel.2007.09.008. [DOI] [PMC free article] [PubMed] [Google Scholar]
- 21.Gradia S, et al. hMSH2-hMSH6 forms a hydrolysis-independent sliding clamp on mismatched DNA. Mol Cell. 1999;3(2):255–261. doi: 10.1016/s1097-2765(00)80316-0. [DOI] [PubMed] [Google Scholar]
- 22.Grilley M, Welsh KM, Su SS, Modrich P. Isolation and characterization of the Escherichia coli mutL gene product. J Biol Chem. 1989;264(2):1000–1004. [PubMed] [Google Scholar]
- 23.Acharya S, Foster PL, Brooks P, Fishel R. The coordinated functions of the E. coli MutS and MutL proteins in mismatch repair. Mol Cell. 2003;12(1):233–246. doi: 10.1016/s1097-2765(03)00219-3. [DOI] [PubMed] [Google Scholar]
- 24.Kadyrov FA, et al. Saccharomyces cerevisiae MutLalpha is a mismatch repair endonuclease. J Biol Chem. 2007;282(51):37181–37190. doi: 10.1074/jbc.M707617200. [DOI] [PMC free article] [PubMed] [Google Scholar]
- 25.San Filippo J, Sung P, Klein H. Mechanism of eukaryotic homologous recombination. Annu Rev Biochem. 2008;77:229–257. doi: 10.1146/annurev.biochem.77.061306.125255. [DOI] [PubMed] [Google Scholar]
- 26.Heyer WD. Biochemistry of eukaryotic homologous recombination. Top Curr Genet. 2007;17:95–133. doi: 10.1007/978-3-540-71021-9. [DOI] [PMC free article] [PubMed] [Google Scholar]
- 27.Holliday R. A mechanism for gene conversion in fungi. Genet Res. 1964;5:282–304. doi: 10.1017/S0016672308009476. [DOI] [PubMed] [Google Scholar]
- 28.Jones M, Wagner R, Radman M. Mismatch repair and recombination in E. coli. Cell. 1987;50(4):621–626. doi: 10.1016/0092-8674(87)90035-3. [DOI] [PubMed] [Google Scholar]
- 29.Rayssiguier C, Thaler DS, Radman M. The barrier to recombination between Escherichia coli and Salmonella typhimurium is disrupted in mismatch-repair mutants. Nature. 1989;342(6248):396–401. doi: 10.1038/342396a0. [DOI] [PubMed] [Google Scholar]
- 30.Sugawara N, Goldfarb T, Studamire B, Alani E, Haber JE. Heteroduplex rejection during single-strand annealing requires Sgs1 helicase and mismatch repair proteins Msh2 and Msh6 but not Pms1. Proc Natl Acad Sci USA. 2004;101(25):9315–9320. doi: 10.1073/pnas.0305749101. [DOI] [PMC free article] [PubMed] [Google Scholar]
- 31.Harfe BD, Jinks-Robertson S. DNA mismatch repair and genetic instability. Annu Rev Genet. 2000;34:359–399. doi: 10.1146/annurev.genet.34.1.359. [DOI] [PubMed] [Google Scholar]
- 32.Putnam CD, Hayes TK, Kolodner RD. Specific pathways prevent duplication-mediated genome rearrangements. Nature. 2009;460(7258):984–989. doi: 10.1038/nature08217. [DOI] [PMC free article] [PubMed] [Google Scholar]
- 33.Worth L, Jr, Clark S, Radman M, Modrich P. Mismatch repair proteins MutS and MutL inhibit RecA-catalyzed strand transfer between diverged DNAs. Proc Natl Acad Sci USA. 1994;91(8):3238–3241. doi: 10.1073/pnas.91.8.3238. [DOI] [PMC free article] [PubMed] [Google Scholar]
- 34.Tham KC, et al. Mismatch repair inhibits homeologous recombination via coordinated directional unwinding of trapped DNA structures. Mol Cell. 2013;51(3):326–337. doi: 10.1016/j.molcel.2013.07.008. [DOI] [PMC free article] [PubMed] [Google Scholar]
- 35.Acharya S, et al. hMSH2 forms specific mispair-binding complexes with hMSH3 and hMSH6. Proc Natl Acad Sci USA. 1996;93(24):13629–13634. doi: 10.1073/pnas.93.24.13629. [DOI] [PMC free article] [PubMed] [Google Scholar]
- 36.Drummond JT, Li GM, Longley MJ, Modrich P. Isolation of an hMSH2-p160 heterodimer that restores DNA mismatch repair to tumor cells. Science. 1995;268(5219):1909–1912. doi: 10.1126/science.7604264. [DOI] [PubMed] [Google Scholar]
- 37.Mazurek A, Johnson CN, Germann MW, Fishel R. Sequence context effect for hMSH2-hMSH6 mismatch-dependent activation. Proc Natl Acad Sci USA. 2009;106(11):4177–4182. doi: 10.1073/pnas.0808572106. [DOI] [PMC free article] [PubMed] [Google Scholar]
- 38.Gradia S, Acharya S, Fishel R. The human mismatch recognition complex hMSH2-hMSH6 functions as a novel molecular switch. Cell. 1997;91(7):995–1005. doi: 10.1016/s0092-8674(00)80490-0. [DOI] [PubMed] [Google Scholar]
- 39.Fishel R. Mismatch repair, molecular switches, and signal transduction. Genes Dev. 1998;12(14):2096–2101. doi: 10.1101/gad.12.14.2096. [DOI] [PubMed] [Google Scholar]
- 40.Kolodner RD. Mismatch repair: Mechanisms and relationship to cancer susceptibility. Trends Biochem Sci. 1995;20(10):397–401. doi: 10.1016/s0968-0004(00)89087-8. [DOI] [PubMed] [Google Scholar]
- 41.Snowden T, Acharya S, Butz C, Berardini M, Fishel R. hMSH4-hMSH5 recognizes Holliday Junctions and forms a meiosis-specific sliding clamp that embraces homologous chromosomes. Mol Cell. 2004;15(3):437–451. doi: 10.1016/j.molcel.2004.06.040. [DOI] [PubMed] [Google Scholar]
- 42.Heinen CD, et al. Human MSH2 (hMSH2) protein controls ATP processing by hMSH2-hMSH6. J Biol Chem. 2011;286(46):40287–40295. doi: 10.1074/jbc.M111.297523. [DOI] [PMC free article] [PubMed] [Google Scholar]
- 43.Selmane T, Schofield MJ, Nayak S, Du C, Hsieh P. Formation of a DNA mismatch repair complex mediated by ATP. J Mol Biol. 2003;334(5):949–965. doi: 10.1016/j.jmb.2003.10.010. [DOI] [PubMed] [Google Scholar]
- 44.Heo SD, Cho M, Ku JK, Ban C. Steady-state ATPase activity of E. coli MutS modulated by its dissociation from heteroduplex DNA. Biochem Biophys Res Commun. 2007;364(2):264–269. doi: 10.1016/j.bbrc.2007.09.130. [DOI] [PubMed] [Google Scholar]
- 45.Wold MS. Replication protein A: A heterotrimeric, single-stranded DNA-binding protein required for eukaryotic DNA metabolism. Annu Rev Biochem. 1997;66:61–92. doi: 10.1146/annurev.biochem.66.1.61. [DOI] [PubMed] [Google Scholar]
- 46.Fan J, Pavletich NP. Structure and conformational change of a replication protein A heterotrimer bound to ssDNA. Genes Dev. 2012;26(20):2337–2347. doi: 10.1101/gad.194787.112. [DOI] [PMC free article] [PubMed] [Google Scholar]
- 47.Haghighat Jahromi A, Honda M, Zimmerman SC, Spies M. Single-molecule study of the CUG repeat-MBNL1 interaction and its inhibition by small molecules. Nucleic Acids Res. 2013;41(13):6687–6697. doi: 10.1093/nar/gkt330. [DOI] [PMC free article] [PubMed] [Google Scholar]
- 48.Gourse RL, Landick R. CoSMoS unravels mysteries of transcription initiation. Cell. 2012;148(4):635–637. doi: 10.1016/j.cell.2012.01.042. [DOI] [PMC free article] [PubMed] [Google Scholar]
- 49.Krejci L, Altmannova V, Spirek M, Zhao X. Homologous recombination and its regulation. Nucleic Acids Res. 2012;40(13):5795–5818. doi: 10.1093/nar/gks270. [DOI] [PMC free article] [PubMed] [Google Scholar]
- 50.Holthausen JT, Wyman C, Kanaar R. Regulation of DNA strand exchange in homologous recombination. DNA Repair (Amst) 2010;9(12):1264–1272. doi: 10.1016/j.dnarep.2010.09.014. [DOI] [PubMed] [Google Scholar]
- 51.Shim KS, et al. Magnesium influences the discrimination and release of ADP by human RAD51. DNA Repair (Amst) 2006;5(6):704–717. doi: 10.1016/j.dnarep.2006.03.004. [DOI] [PubMed] [Google Scholar]
- 52.Amunugama R, et al. RAD51 protein ATP cap regulates nucleoprotein filament stability. J Biol Chem. 2012;287(12):8724–8736. doi: 10.1074/jbc.M111.239426. [DOI] [PMC free article] [PubMed] [Google Scholar]
- 53.Evans E, Alani E. Roles for mismatch repair factors in regulating genetic recombination. Mol Cell Biol. 2000;20(21):7839–7844. doi: 10.1128/mcb.20.21.7839-7844.2000. [DOI] [PMC free article] [PubMed] [Google Scholar]
- 54.Vernole P, et al. Common fragile sites in colon cancer cell lines: Role of mismatch repair, RAD51 and poly(ADP-ribose) polymerase-1. Mutat Res. 2011;712(1-2):40–48. doi: 10.1016/j.mrfmmm.2011.04.006. [DOI] [PubMed] [Google Scholar]
- 55.Solinger JA, Kiianitsa K, Heyer WD. Rad54, a Swi2/Snf2-like recombinational repair protein, disassembles Rad51:dsDNA filaments. Mol Cell. 2002;10(5):1175–1188. doi: 10.1016/s1097-2765(02)00743-8. [DOI] [PubMed] [Google Scholar]
- 56.Javaid S, et al. Nucleosome remodeling by hMSH2-hMSH6. Mol Cell. 2009;36(6):1086–1094. doi: 10.1016/j.molcel.2009.12.010. [DOI] [PMC free article] [PubMed] [Google Scholar]
- 57.Hopfner KP, et al. Structural biology of Rad50 ATPase: ATP-driven conformational control in DNA double-strand break repair and the ABC-ATPase superfamily. Cell. 2000;101(7):789–800. doi: 10.1016/s0092-8674(00)80890-9. [DOI] [PubMed] [Google Scholar]
- 58.Koroleva O, Makharashvili N, Courcelle CT, Courcelle J, Korolev S. Structural conservation of RecF and Rad50: Implications for DNA recognition and RecF function. EMBO J. 2007;26(3):867–877. doi: 10.1038/sj.emboj.7601537. [DOI] [PMC free article] [PubMed] [Google Scholar]
- 59.Lee JH, Paull TT. ATM activation by DNA double-strand breaks through the Mre11-Rad50-Nbs1 complex. Science. 2005;308(5721):551–554. doi: 10.1126/science.1108297. [DOI] [PubMed] [Google Scholar]
- 60.Myung K, Datta A, Chen C, Kolodner RD. SGS1, the Saccharomyces cerevisiae homologue of BLM and WRN, suppresses genome instability and homeologous recombination. Nat Genet. 2001;27(1):113–116. doi: 10.1038/83673. [DOI] [PubMed] [Google Scholar]
- 61.Spell RM, Jinks-Robertson S. Examination of the roles of Sgs1 and Srs2 helicases in the enforcement of recombination fidelity in Saccharomyces cerevisiae. Genetics. 2004;168(4):1855–1865. doi: 10.1534/genetics.104.032771. [DOI] [PMC free article] [PubMed] [Google Scholar]
- 62.Evans E, Sugawara N, Haber JE, Alani E. The Saccharomyces cerevisiae Msh2 mismatch repair protein localizes to recombination intermediates in vivo. Mol Cell. 2000;5(5):789–799. doi: 10.1016/s1097-2765(00)80319-6. [DOI] [PubMed] [Google Scholar]
- 63.Saydam N, et al. Physical and functional interactions between Werner syndrome helicase and mismatch-repair initiation factors. Nucleic Acids Res. 2007;35(17):5706–5716. doi: 10.1093/nar/gkm500. [DOI] [PMC free article] [PubMed] [Google Scholar]
- 64.Pedrazzi G, et al. The Bloom’s syndrome helicase interacts directly with the human DNA mismatch repair protein hMSH6. Biol Chem. 2003;384(8):1155–1164. doi: 10.1515/BC.2003.128. [DOI] [PubMed] [Google Scholar]
- 65.Peng M, et al. The FANCJ/MutLalpha interaction is required for correction of the cross-link response in FA-J cells. EMBO J. 2007;26(13):3238–3249. doi: 10.1038/sj.emboj.7601754. [DOI] [PMC free article] [PubMed] [Google Scholar]
- 66.Honda M, Okuno Y, Yoo J, Ha T, Spies M. Tyrosine phosphorylation enhances RAD52-mediated annealing by modulating its DNA binding. EMBO J. 2011;30(16):3368–3382. doi: 10.1038/emboj.2011.238. [DOI] [PMC free article] [PubMed] [Google Scholar]
Associated Data
This section collects any data citations, data availability statements, or supplementary materials included in this article.
Supplementary Materials
Supporting Information