Distinct enzyme combinations in AKAP signalling complexes permit functional diversity (original) (raw)
. Author manuscript; available in PMC: 2014 Feb 13.
Published in final edited form as: Nat Cell Biol. 2005 Nov;7(11):1066–1073. doi: 10.1038/ncb1315
Abstract
Specificity in cell signalling can be influenced by the targeting of different enzyme combinations to substrates. The A-kinase anchoring protein AKAP79/150 is a multivalent scaffolding protein that coordinates the subcellular localization of second-messenger-regulated enzymes, such as protein kinase A, protein kinase C and protein phosphatase 2B. We developed a new strategy that combines RNA interference of the endogenous protein with a protocol that selects cells that have been rescued with AKAP79/150 forms that are unable to anchor selected enzymes. Using this approach, we show that AKAP79/150 coordinates different enzyme combinations to modulate the activity of two distinct neuronal ion channels: AMPA-type glutamate receptors and M-type potassium channels. Utilization of distinct enzyme combinations in this manner provides a means to expand the repertoire of cellular events that the same AKAP modulates.
Cellular regulation must be accomplished through the synchronized actions of a limited number of gene products, as the number of mammalian genes that are required to sustain life is significantly less than was originally anticipated1,2. Signal-transduction pathways are created when enzymes, often with broad substrate specificities, act sequentially to evoke cellular responses3. Restricting the subcellular localization of these enzymes with scaffolding proteins contributes to the fidelity of each response4. Prototypic examples of these are the A-kinase anchoring proteins (AKAPs) that target the cyclic-AMP-dependent protein kinase (protein kinase A, PKA) and other enzymes to defined subcellular locations5.
AKAP signalling complexes often include signal-transduction and signal-termination enzymes to regulate the forward and backward steps of a given process. The notion of multivalent anchoring proteins was first proposed for the AKAP79 family, which consists of a group of three structurally similar orthologues: human AKAP79, murine AKAP150 and bovine AKAP75 (ref. 6). These AKAPs contain binding sites for PKA, the calcium/phospholipid-dependent kinase (protein kinase C, PKC) and the calcium/calmodulin-dependent phosphatase (protein phosphatase 2B, PP2B)7. They are tethered to the inner face of the plasma membrane, where they can respond to the generation of second messengers, such as cAMP, calcium and phospholipid7. Functional studies have shown that this AKAP family controls the phosphorylation status and action of several ion channels, including AMPA (α-amino-3-hydroxy-5-methyl-4-isoxazole propionic acid)-type glutamate receptors, L-type calcium channels, aquaporin water channel, and M-type potassium channels8–10. One theory that accounts for this diversity of action is that unique combinations of anchored enzymes are recruited to individual ion channels. We tested this hypothesis in cells in which the endogenous anchoring protein was silenced and replaced with AKAP forms that were unable to anchor selected binding partners.
Results
Functional characterization of AKAP79-depleted cells
Plasmid-based RNA interference (RNAi) of AKAP79 was initially performed in HEK293 cells. The effect was maximal 3–5 d after transfection of the plasmid when AKAP79 levels were reduced to ∼25% of the control (Fig. 1a). The pSAKAP79i-positive cultures were enriched by co-expression of the cell-surface marker CD4, followed by magnetic sorting with anti-CD4-coupled magnetic beads (Fig. 1b). Cell extracts from pSAKAP79i/CD4-positive cultures exhibited almost complete loss of AKAP79 compared with controls when assessed by immunoblot (Fig. 1c, top panel). Control immunoblots confirmed that both samples contained equivalent amounts of a standard protein (Fig. 1c, bottom panel). Next, the CD4-positive cells were transfected with plasmids encoding ion channels, modified AKAP forms and a green fluorescent protein (GFP) marker (Fig. 1b). Functional confirmation of AKAP79 knockdown was provided by whole-cell patch-clamp recording experiments from GFP cells expressing the GluR1 subunit of the AMPA-type glutamate receptor channel (Fig. 1b). _AKAP79_-silenced cells did not exhibit agonist-dependent downregulation of current (Fig. 1d, red circles) compared with recordings from control cells (Fig. 1d, black triangles). Importantly, downregulation of the GluR1 current was rescued following expression of the murine orthologue AKAP150 that is refractory to pSAKAP79i RNAi (Fig. 1c, middle panel; Fig. 1d, green squares). Comparison of the GluR1 response 5 min post-agonist to the response at time zero showed statistically significant recovery of current rundown with expression of AKAP150 (representative traces and amalgamated data, Fig. 1e, f). In control experiments, RNAi knockdown with pSAKAP150i did not prevent AKAP79 expression (Fig. 1c, lane 3) or agonist-dependent rundown of GluR1 current (Fig. 1e, f)
Figure 1.
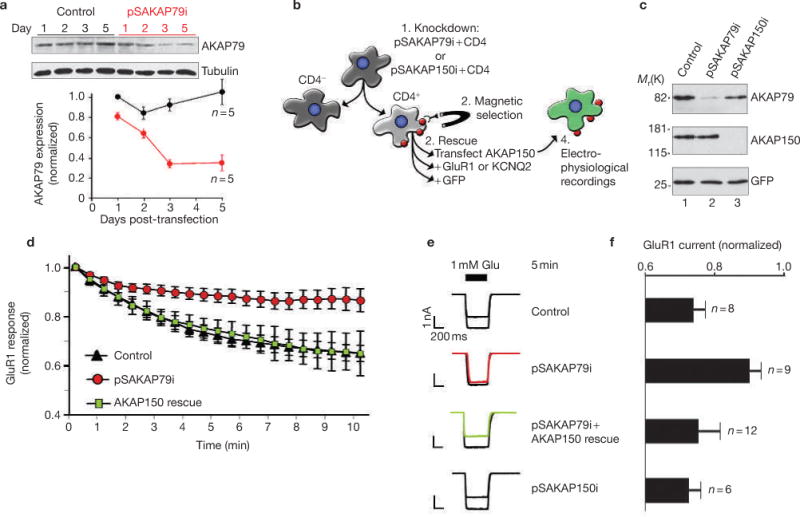
RNA interference of AKAP79 in HEK293 cells. (a) Immunoblot showing AKAP79 (top panel) and tubulin (loading control, middle panel) expression levels in cell lysates from cells transfected with control or pSAKAP79i plasmids (indicated above lanes). The time (days) post-transfection is indicated above each lane. (Bottom panel) AKAP79 expression levels from control (black circles) and gene-silenced (red circles) cells were quantified by densitometry from immunoblots using an NIH image. Amalgamated data from five experiments is presented. (b) Flowchart depicting the selection protocol used to isolate CD4/pSAKAP79i double-positive cells and green fluorescent protein (GFP) cells expressing modified AKAP forms and ion-channels. (c) Characterization of AKAP79 knockdown and rescue with recombinant AKAP150 in CD4/pSAKAP79i double-positive cells (lane 2). Immunoblot detection of AKAP79 (top panel), recombinant AKAP150 (middle panel) and tubulin (bottom panel) in cell lysates is shown. The reciprocol experiment with AKAP150 knockdown in CD4/pSAKAP150i double-positive cells and rescue with recombinant AKAP79 is shown in lane 3. (d) Electrophysiological recording of recombinant GluR1 channels time course from control (black triangles, n = 8), _AKAP79_-silenced (red circles, n = 9) and CD4/pSAKAP79i double-positive cells expressing recombinant AKAP150 (AKAP150 rescue, green squares, n = 12). Normalized GluR1 currents (relative to time 0, 1 mM glutamate) over a time course of 10 min are presented. The PKA inhibitor PKI was included in the pipette solution. (e) Representative traces at time 0 and 5 min after the first application of 1 mM glutamate are presented. A representative trace from an additional control group of cells transfected with the pSAKAP150i construct specific for the murine orthologue is shown (n = 6). (f) Amalgamated data depicting the level of normalized current for all experimental groups taken 5 min after the application of agonist. The statistical significance of electrophysiology data shown in this figure, part f, was calculated using one-way ANOVA followed by two-tailed Student's _t_-test. Statistical significance of control versus pSAKAP79i is P = 0.0050 and of pSAKAP79i + AKAP150 rescue versus pSAKAP79i is P = 0.0050. Error bars indicate SEM.
Signalling to AMPA channels requires anchored PP2B and SAP97
AKAP-bound PKA enhances the phosphorylation of Ser 845 in the cytoplasmic tail of GluR1 and is believed to stabilize AMPA currents11,12. Conversely, the AKAP-bound phosphatase PP2B may mediate the rundown of GluR1 currents13 (Fig. 2a). We tested this hypothesis by measuring GluR1 currents from _AKAP79_-silenced HEK293 cells that had been reconstituted with modified AKAP150 forms (Fig. 2b). Agonist-dependent rundown of GluR1 currents was sustained in cells expressing AKAP150ΔPKA (Δ675–697) and AKAP150ΔPKC (Δ31–51) deletion mutants that are unable to anchor PKA or PKC, respectively14–16 (Fig. 2c, d). By contrast, expression of AKAP150ΔPP2B (Δ605–647), which is unable to anchor PP2B, prevented current rundown, indicating that dephosphorylation is a predominant regulatory event (Fig. 2c, d). This is believed to occur because the PP2B-AKAP complex is optimally positioned in relation to the channel by the MAGUK adapter protein SAP97 (ref 17; Fig. 2a). Accordingly, gene silencing of SAP97, which is endogenously expressed in HEK293 cells (Fig. 3a), uncoupled the AKAP-mediated regulation of GluR1 currents (Fig. 3b–d). Normal regulation was restored following rescue with mouse SAP97 that is refractory to RNAi (Fig. 2c–e).
Figure 2.
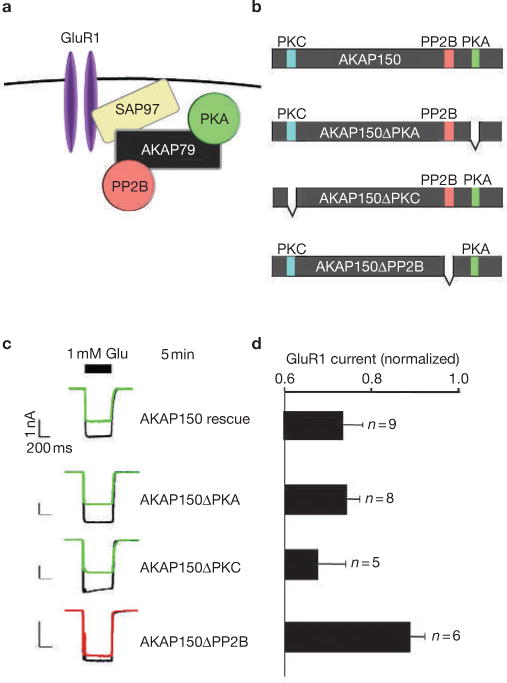
PP2B is a fundamental component of the GluR1–AKAP79/150 signalling network in HEK293 cells. (a) Diagram depicting a proposed configuration of the GluR1–AKAP signalling network. (b) Schematic representation of AKAP150 deletion mutants lacking enzyme-binding sites for protein kinase A (PKA; green), protein kinase C (PKC; blue) or protein phosphatase 2B (PP2B; red) used to reconstitute modified GluR1–AKAP signalling networks. (c) Representative traces at time 0 and 5 min after the initial application of 1 mM glutamate and (d) amalgamated data depicting the level of normalized current for each experimental group taken 5 min after the application of agonist (n values are indicted). The PKA inhibitor PKI was included in the pipette solution. The statistical significance of electrophysiology data shown in this figure, part d, was calculated using one-way ANOVA followed by two-tailed Student's _t_-test. Statistical significance of AKAP150ΔPP2B rescue versus AKAP150 rescue is P = 0.0090. Error bars indicate SEM.
Figure 3.
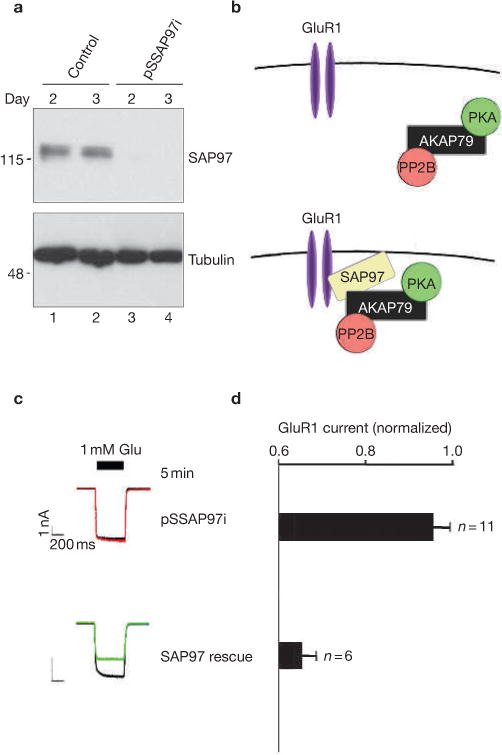
RNA interference of SAP97 in HEK293 cells. (a) Plasmid-based RNA interference knockdown of the adapter protein SAP97. (Top panel) Immunoblot detection of SAP97 and (Bottom panel) immunoblot detection of tubulin in lysates from control and pSSAP97i-transfected cells 2 and 3 d after transfection. (b) Schematic representation depicting the disruption of the GluR1–AKAP79 signalling network following removal of SAP97. (c) Representative traces at time 0 and 5 min after the application of 1 mM glutamate and (d) amalgamated data depicting the level of normalized current for each experimental group taken 5 min after the application of agonist. The protein kinase A (PKA) inhibitor PKI was included in the pipette solution. (e) Schematic depicting the reformation of the GluR1–AKAP79 signalling network following the expression of rat SAP97. The statistical significance of electrophysiology data shown in this figure, part d, was calculated using one-way ANOVA followed by two-tailed Student's _t_-test. Statistical significance of SAP97 rescue versus pSSAP97i knockdown is P = 0.00011. Error bars indicate SEM.
Function of AMPA channels with modified AKAP complexes
A reciprocal RNAi-rescue procedure was developed in cultured rat hippocampal neurons, where the endogenous AKAP150 gene was silenced following electroporation of plasmids and was rescued with AKAP79 forms. In situ changes in AKAP150 protein expression were detected by immunofluorescence, whereas co-expression of GFP was used as a transfection marker and to identify positive neurons for whole-cell electrophysiological recording (Fig. 4a–f). Gene silencing of AKAP150 abolished glutamate-dependent attenuation of AMPA currents (Fig. 4g, red triangles) compared with controls (Fig. 4g, black diamonds), whereas ectopic expression of AKAP79 rescued this phenomenon (Fig. 4g, green circles). Representative current traces were taken 5 min after the application of glutamate (Fig. 4h), and amalgamated data are presented (Fig. 4i). Functional rescue of AMPA-channel regulation was obtained with AKAP79 complexes that lacked PKA or PKC, whereas reconstruction with AKAP79 forms that were unable to bind PP2B were ineffective (Fig. 4j–l). Collectively, the data so far (Fig. 1–4) indicates that downregulation of AMPA channels involves two AKAP-mediated binding events: the cross-linking of AKAP to GluR1 and the anchoring of PP2B.
Figure 4.
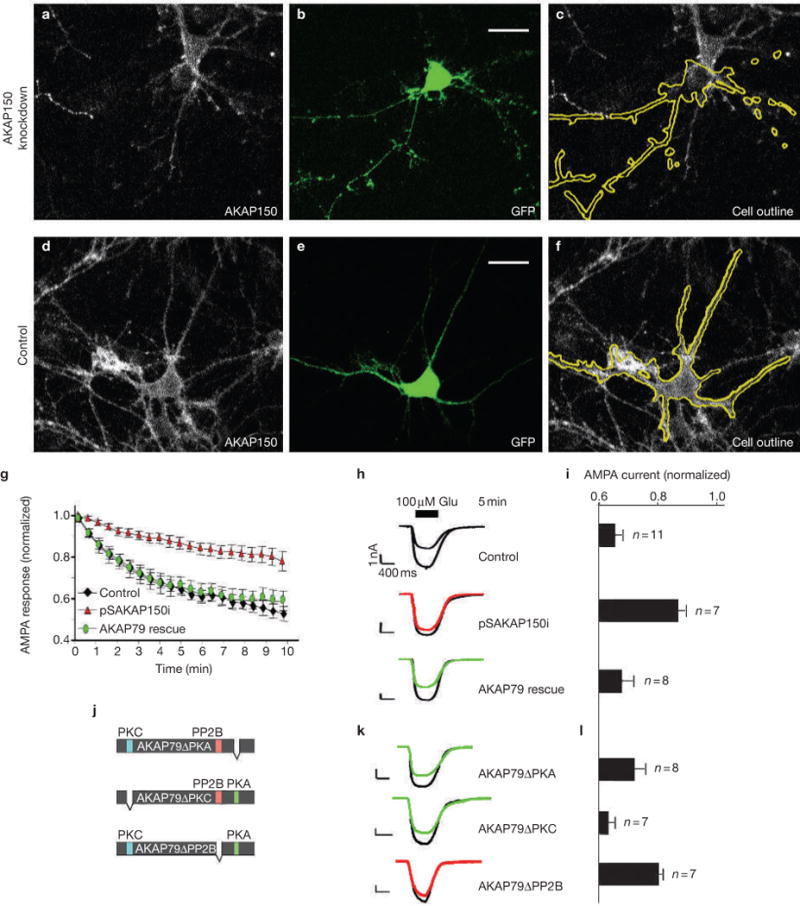
Modulation of AMPA channels with modified AKAP complexes. Gene silencing of AKAP150 was achieved by electroporation of cultured hippocampal neurons with the pSAKAP150i plasmid. (a, d) Immunofluorescent detection of AKAP150; (b, e) fluorescent detection of green fluorescent protein (GFP); (c, f) composite images of AKAP150 and the outline of GFP-positive cells in cultured hippocampal neurons transfected with pSAKAP150i or a control plasmid. Fluorescent emission from GFP and anti-AKAP150 labelled with Cy5-conjugated secondary antibodies was detected using a confocal microscope (scale bar, 20 μm). (g) Whole-cell electrophysiological recording of AMPA currents in control (black diamonds, n = 11), _AKAP150_-silenced (red triangles, n = 7) or AKAP79-rescued (green circles, n = 8) neurons. The protein kinase A (PKA) inhibitor PKI was included in the pipette solution. Time courses of normalized AMPA currents are presented for 0–10 min after the application of 100 μM glutamate. (h) Representative traces at time 0 and 5 min after the application of 100 μM glutamate. (i) Amalgamated data depicting the level of normalized current for each experimental group taken 5 min after the application of agonist. (j) Diagram of AKAP79 deletion mutants lacking enzyme-binding sites for PKA (green), protein kinase C (PKC; blue) or protein phosphatase 2B (PP2B; red) used to reconstitute modified signalling complexes in _AKAP150_-silenced neurons. (k) Representative traces at time 0 and 5 min after the application of 100 μM glutamate and (l) amalgamated data depicting the level of normalized current for each experimental group taken 5 min after the application of agonist (n values are indicted). The statistical significance of electrophysiology data shown in this figure, parts i and l, was calculated using one-way ANOVA followed by two-tailed Student's _t_-test. Statistical significance of pSAKAP150i versus control is P = 0.000093, and of AKAP79ΔPP2B rescue versus AKAP79 rescue is P = 0.018. Error bars indicate SEM.
We were intrigued by evidence that the AKAP79(ΔPKA)-rescued neurons showed minimal effects on the downregulation of the AMPA current (Fig. 4k–l). Therefore, we wondered if the PKA inhibitor peptide (PKI), which was included in the pipette solution, masked the anchored-PKA-deficient phenotype. To address this question, we examined the AMPA current with or without PKI. The downregulation of AMPA currents is induced by inclusion of PKI in the patch pipette solution in control neurons (Fig. 5a). However PKI is not required to downregulate the channel in cells in which AKAP79(ΔPKA) replaced the endogenous anchoring protein (Fig. 5b). Collectively, these findings strongly indicate that anchored PKA is crucial for maintaining AMPA currents during glutamate stimulation.
Figure 5.
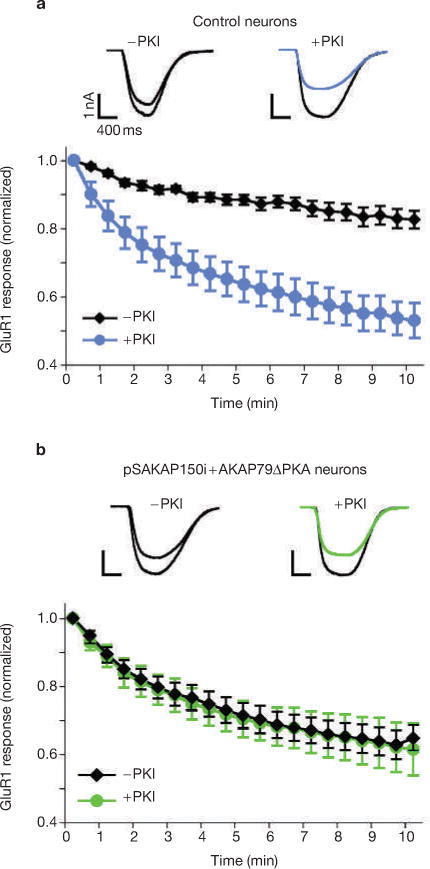
PKA activation is required for maintaining AMPA currents. (a) Whole-cell electrophysiological recording of AMPA currents in control hippocampal neurons without (−PKI, n = 5, black diamonds) and with (+PKI, n = 7, blue circles) PKI (10 μM) in the pipette solution. Time courses of normalized AMPA currents are presented for 0–10 min after the application of 100 μM glutamate. Representative traces from both −PKI (black) and +PKI (blue) at time 0 and 5 min after the application of 100 μM glutamate. (b) Similar recordings of AMPA currents in _AKAP150_-silenced and AKAP79(ΔPKA)-rescued neurons (−PKI, n = 9, black diamonds; +PKI, n = 5, green circles).
AKAP150 coordinates muscarinic suppression of M currents
Our RNAi/rescue approach was used to examine a second AKAP79/150-mediated event: the suppression of ‘M current’, a K+ conductance that negatively regulates neuronal excitability in a variety of brain regions18,19. Muscarinic agonists inhibit this channel via a Gq-coupled pathway that evokes phosphoinositide turnover20,21 (Fig. 6a). Although a role for PKC in this process has been elusive22, recent pharmacological studies imply that an anchored pool of the kinase facilitates this suppression of M current in superior cervical ganglion (SCG) neurons10. PKC phosphorylation of Ser 534 and Ser 541 on the KCNQ2 channel subunit has been implicated in the suppression of recombinant M currents10. The net result is a hyperexcitability of neurons because firing of action potentials is favoured when M currents are suppressed18,19.
Figure 6.
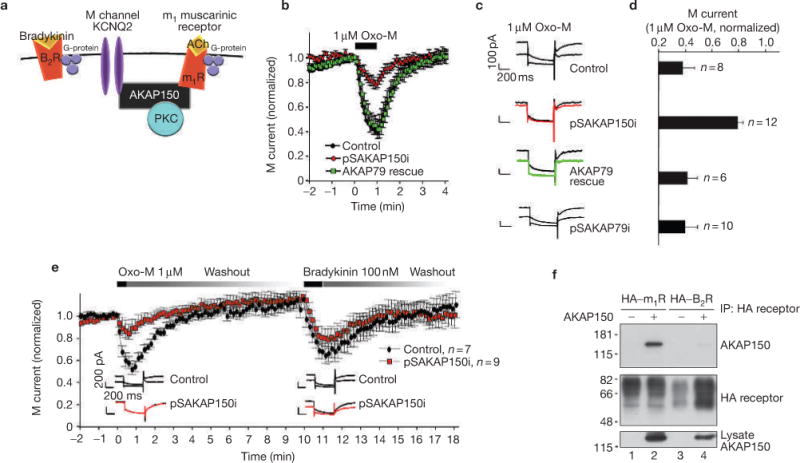
AKAP150 facilitates selective M-current suppression. (a) Schematic diagram of receptor-mediated G-protein-coupled pathways that modulate M channels. (b) Muscarinic suppression of M channels in dissociated superior cervical ganglion (SCG) neurons. The muscarinic agonist oxotremorine-M (Oxo-M; 1 μM) was applied through the flow pipette for 1 min. Whole-cell electrophysiological recording was continued for another 4 min in control (black circles, n = 8), _AKAP150_-silenced (red circles, n = 12) and AKAP79-rescued (green squares, n = 6) SCG neurons. (c) Representative traces at time 0 and 1 min after the application of 1 μM Oxo-M and (d) amalgamated data depicting the level of normalized current 1 min after the application of agonist are presented for each experimental group. An additional control group of cells transfected with the pSAKAP79i construct specific for the human orthologue is also shown (n = 10). (e) M currents recorded from control (black circles, n = 7) and _AKAP150_-silenced (red squares, n = 9) neurons following Oxo-M (1 μM) treatment. After a recovery period of 10 min, a second agonist, bradykinin (100 nM), was applied to the same cells. Representative traces from control (top) and _AKAP150_-silenced (below) neurons at time zero and 1 min after the application of Oxo-M (left inset) and bradykinin (right inset). (f) AKAP150 and the m1 muscarinic receptor interact. HEK293 cells were co-transfected with plasmids encoding AKAP150 and HA-tagged m1 muscarinic receptor or HA-tagged B2 bradykinin receptor, followed by immunoprecipitation with monoclonal antibodies against the HA epitope tag. (Top panel) Immunoblot detection of AKAP150 and (middle panel) immunoblot detection of HA-tagged receptors present in immune complexes isolated with anti-HA. (Bottom panel) Shows immunoblot detection of AKAP150 presence in cell lysates. The statistical significance of electrophysiology data shown in this figure, part d, was calculated using one-way ANOVA followed by two-tailed Student's _t_-test. Statistical significance of pSAKAP150i versus control is P = 0.00021. Error bars indicate SEM.
_AKAP79_-silenced HEK293 cells expressing a KCNQ2 subunit, a core component of the M current, showed reduced muscarinic inhibition by acetylcholine (see Supplementary Information, Fig. S1). RNAi knockdown of AKAP150 in cultured rat SCG neurons (see Supplementary Information, Fig. S2) permitted examination of the role of AKAP150 anchoring in endogenous M-current suppression. Accordingly, gene silencing of AKAP150 in cultured rat SCG neurons reduced suppression of M currents in response to the muscarinic agonist oxotremorine-M (Oxo-M) (Fig. 6b, red circles) compared with controls (Fig. 6b, black circles). Ectopic expression of AKAP79 rescued this phenomenon (Fig. 6b, green squares). Representative traces and amalgamated data using 1 μM Oxo-M as agonist are presented (Fig. 6c–d). Moreover, the anchoring protein is required for the muscarinic suppression of M current as the _AKAP150_-silenced SCG neurons were refractory to higher doses of Oxo-M (see Supplementary Information, Fig. S3). Surprisingly, loss of AKAP150 did not alter the response to bradykinin, another physiological agonist that suppresses M currents via a Gq-coupled pathway that also involves phosphoinositides and calcium23 (Fig. 6e; and see Supplementary Information, Fig. S4). Further support for this unexpected selectivity in AKAP action was provided by evidence that the recombinant m1 muscarinic receptor co-precipitated AKAP150, whereas the B2 bradykinin receptor did not (Fig. 6f).
AKAP150 binds to the KCNQ2 subunit, a core component of the M current, presumably to direct PKC towards phosphorylation sites in the cytoplasmic tail of the channel10 (Fig. 6a). Therefore, RNAi/rescue experiments tested the hypothesis that PKC is recruited into a muscarine-sensitive signalling network that includes the m1 receptor, the anchoring protein and the M channel. Initially, the complement of AKAP binding partners that contribute to M-current regulation was examined by expression of various AKAP79 deletion mutants in _AKAP150_-silenced rat SCG neurons. Only the PKC-anchoring-deficient form of AKAP79 failed to rescue muscarinic suppression of the M current (Fig. 7a–c). In complementary experiments, muscarinic inhibition of M current was restored following expression of AKAP79 amino acids (aa) 1–153 that encompasses the phosphoinositide binding sites and PKC anchoring region24 (Fig. 7a–c). Importantly, this effect was lost when AKAP79 aa 1–153 was co-expressed with a catalytically inactive PKCβII isoform25 (Fig. 7a–c). AKAP79 aa 1–153 shares 77% homology with the corresponding region of AKAP150. These studies imply that AKAP150 facilitates muscarinic suppression of M current by bringing PKC and the m1 muscarinic receptor in close proximity to the channel.
Figure 7.
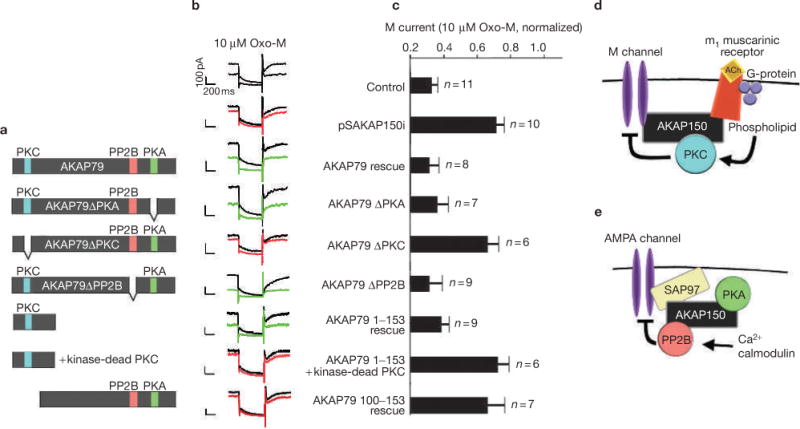
Functional dissection of an M-channel–AKAP complex. (a) Schematic diagram of AKAP79 deletion mutants and fragments used in functional rescue experiments. Enzyme binding sites for protein kinase C (PKC; blue), protein phosphatase 2B (PP2B; red) and protein kinase A (PKA; green) are indicated. (b) Representative traces at time 0 and 1 min after the application of 10 μM Oxo-M and (c) amalgamated data depicting the level of normalized current for each experimental group taken 1 min after the application of agonist. Summary diagrams depicting the functionally relevant components required for (d) muscarinic suppression of M channels in superior cervical ganglion neurons and (e) glutamate-mediated downregulation of AMPA channels in hippocampal neurons. The statistical significance of electrophysiology data shown in part c was calculated using one-way ANOVA followed by two-tailed Student's _t_-test. Statistical significance of pSAKAP150i versus control is P = 0.0000047, AKAP79ΔPKC versus AKAP79 rescue is P = 0.0022, AKAP79 aa 1–153 + kinase-dead PKC versus AKAP79 rescue is P = 0.00069, AKAP79 aa 100–427 versus AKAP79 rescue is P = 0.0058. Error bars indicate SEM.
Discussion
The important components of M-channel configuration (Fig. 7d) are distinct from the anchored signalling complex that functions to downregulate AMPA channels (Fig. 7e). Apparently, the only common functional element is the anchoring protein itself. This raises the intriguing possibility that these AKAP complexes, built on the same scaffold, use different components to modulate individual signalling events. There may be contextual cues that drive the preferential assembly of different AKAP complexes, such as the initial binding event of the anchoring protein with its target substrate. For example, direct association of AKAP150 with the M channel may provide a configuration that retains the membrane tethering and anchoring of PKC. Similarly, a GluR1–MAGUK–AKAP ternary complex may be established before PKA and PP2B can be oriented towards the channel. Other factors that could influence the composition of these signalling networks include co-translational assembly of protein complexes through localized protein synthesis26 and either species-specific or cell-type-specific expression of particular binding partners27. However, whether or not every enzyme is engaged on the scaffold simultaneously, our results show that AKAPs not only regulate the spatial restriction of broad-specificity enzymes, but also may regulate different signalling pathways by using only a subset of the AKAP signalling complex. Use of different signalling molecules on the same AKAP is a mechanism that permits maximum flexibility from a limited gene pool. This may be particularly important in a highly polarized cell, such as the neuron, in which the synaptic environment could take advantage of an array of AKAP79/150 signalling complexes in the regulation of distinct molecules and cellular events. For example, we show that downregulation of AMPA currents requires anchored PP2B, but we are unable to demonstrate a role for the same enzyme in the repression of muscarine-dependent M-current inhibition. This observation is supported by a detailed biochemical analysis showing that PP2B is not present in KCNQ2–AKAP79 complexes that are isolated from mammalian neurons28. It is, therefore, reasonable to propose that parallel AKAP signalling complexes may recruit different combinations of signalling enzymes. This hitherto unappreciated function of AKAPs could resolve an apparent paradox in second-messenger signalling — namely, that parallel pathways that are composed of broad-specificity enzymes frequently trigger precise, localized cellular events.
Methods
Antibodies
The following primary antibodies were used for immunoblotting and immunoprecipitation: rabbit polyclonal antibody to AKAP150 (VO88), rabbit polyclonal antibody to AKAP79 (ICOS), mouse monoclonal MAGUK-family antibody (Upstate Biotechnology, Lake Placid, NY), mouse monoclonal HA (Sigma, St Louis, MO), rabbit polyclonal HA (Sigma), mouse monoclonal tubulin and mouse monoclonal FLAG M2 (Sigma).
Cell cultures
HEK293 cells were grown in Dulbecco's modified Eagle medium with 10% fetal bovine serum. SCG neurons were isolated from 2–3-week-old rats and cultured as described previously10. Hippocampal neurons were isolated from 1–2-d-old rats and cultured as described previously29. Acquisition of primary cultures was under the regulation of the Institutional Animal Care and Use Committee at Oregon Health and Science University.
RNAi constructs and induction
Sequences from AKAP79 or AKAP150 were ligated into pSilencer U6 vectors (Ambion, Austin, TX) according to the manufacturers' instructions. The sequences were as follows: for AKAP79 (pSAKAP79i), 5′-GACTCAGACTGCAGCATCAAAGTTCAAGAGACTTTGATGCTGCAGT CTGAGTCTTTTTT-3′; for AKAP150 (pSAKAP150i), 5′-GAAGAAGACAAA ATCCAAACTTTCAAGAGAAGTTTGGATTTTGTCTTCTTCTTTTTTGG-3′; for hSAP97 (pSSAP97i-1), 5′-GAGCATATTTCCCCACAAATTCAAGAG ATTTGTGGGGAAATATGCTCTTTTTTGG-3′, and (pSSAP97i-2), 5′-GAA CTTATCAGAGATTGAGAATTCAAGAGATTCTCAATCTCTGATAAGTTC TTTTTTGG-3′. To induce RNAi in HEK293 cells, the appropriate construct in the pSilencer vector (pSAKAP79i or a mixture of pSSAP97i-1 and pSSAP97i-2) and the CD4 expression vector (pJPACD4) were co-transfected using Fugene6 (Roche Diagnostics, Indianapolis, IN). At 48 h after transfection, these cultures were enriched for transfected cells by selecting the CD4-positive cells with anti-CD4-magnetic beads (Dynal, Oslo, Norway) (Fig. 1b). Pilot experiments using pDsRED2 as a fluorescent marker and pJPACD4 showed that the magnetic selection process increased DsRED-positive cells from 45% ± 4.1% (n = 3 fields, 841 cells) to 82% ± 1.7% (n = 3 fields, 393 cells). Enrichment of transfected cells facilitated re-transfection and further experiments on a gene-silenced background (Fig. 1b). Re-transfection was done with AKAP150 full-length wild type and mutants in pcDNA3, GluR1flip in pRK5 vector and pEGFP-N1. Cells positive for both CD4 beads and GFP were visually selected for electrophysiological recording 2 d after re-transfection. For experiments in _AKAP150_-silenced hippocampal neurons, suspensions of hippocampal cells from newborn rats were transfected with pSAKAP150i, various AKAP79 forms in pcDNA3, and either pEGFP-N1 or pDsRED2 using a Nucleofector kit (Amaxa, Koeln, Germany). Treated cells were overlaid onto a glial feeder layer and cultured for 4–7 d. For _AKAP150_-silenced SCG neurons, the same constructs were introduced by nuclear injection as described previously10 and cultured for 3 d.
Immunohistochemistry
Rat hippocampal neurons cultured on coverslips were fixed by 3.7% formaldehyde and permeabilized with 0.2% Triton X-100 in phosphate-buffered saline (PBS). Following incubation in blocking buffer (0.2% bovine serum albumin in PBS) for 1 h, they were incubated with AKAP150 antibody (1:1000 dilution). After three washes with blocking buffer, the coverslips were incubated in goat anti-rabbit Cy5 (1:100 dilution; Jackson Immunoresearch, West Grove, PA) for 1 h, washed as before and mounted with ProLong mounting medium (Molecular Probes, Eugene, OR). Cells were imaged with a Bio-Rad MRC1024 UV/VIS confocal microscope.
Immunoprecipitation
HA-tagged receptor/AKAP150 complexes were immunoprecipitated from one 10 cm dish of HEK293 cells that had been transfected with 1 μg pcDNA3–AKAP150 and 9 μg of either HA-tagged bradykinin B2 receptor or muscarinic m1 receptor cDNA (University of Missouri-Rolla, cDNA Resource Center). Cells were harvested 48 h after transfection and lysed in 500 μl HSE buffer (150 mM NaCl, 5 mM EDTA, 5 mM EGTA, 20 mM HEPES, pH 7.4, 1% Triton X-100 and Roche protease inhibitor cocktail). Supernatants were incubated with 1 μg mouse anti-HA and 40 μl protein G agarose beads. Following overnight incubation at 4°C, immunoprecipitates were washed twice in HSE, twice in HSE with 650 mM NaCl, twice in HSE and once in TE buffer. Bound proteins were analysed by SDS–PAGE and immunoblotted with rabbit antibody to AKAP150 (1:5000 dilution) and HA-tag (1:1000 dilution).
Electrophysiological measurements
Whole-cell recordings were performed on isolated cells using an Axopatch 200B patch-clamp amplifier (Axon Instruments, Sunnyvale, CA). Signals were sampled at 2 kHz, filtered at 1 kHz, and acquired using pClamp software (version 7, Axon Instruments). Series resistance (90–95%) and whole-cell capacitance compensation were used. To measure the GluR1 response in HEK293 cells, patch pipettes (2–4 MΩ) were filled with an intracellular solution containing 140 mM Cs methanesulphonate, 5 mM ATP, 1 mM BAPTA, 5 mM MgCl2, 300 μM CaCl2, 10 mM HEPES (pH 7.3) and 10 μM PKI. The external solution consisted of 150 mM NaCl, 5 mM KCl, 2 mM CaCl2, 10 mM glucose, 100 μM cyclothiazide and 10 mM HEPES (pH 7.4). Rapid solution exchanges were accomplished through a two-barrel pipe controlled by a solution stimulus delivery device, SF-77B (Warner Instruments, Hamden, CT). GluR1 receptor currents were evoked by a 500-ms application of 1 mM glutamate at 30-s intervals at a holding potential of −70 mV. For recording AMPA currents in hippocampal neurons, the pipette solution was the same as above except that it contained no calcium. Hippocampal cells were perfused with a solution containing 150 mM NaCl, 3 mM KCl, 1 mM CaCl2, 11 mM glucose, 10 mM HEPES (pH 7.4), 100 μM cyclothiazide, 10 μM bicuculline, 10 μM ZD7288 and 1 μM TTX. Neuronal glutamate responses were evoked as above, but with a lower glutamate concentration (100 μM) and a slower washout because the cells were not lifted. Adding cyclothiazide increased the responses to glutamate from 0.43 ± 0.11 nA to 3.9 ± 0.52 nA (n = 4), which indicates that the majority of the recorded currents were through the AMPA receptor. Control measurements without PKI revealed a relatively stable AMPA response (84.2% ± 3.3% at 10 min, n = 4). Data are presented as mean ± SEM. For recording M currents in SCG neurons, the perforated patch method was used as described previously10. Briefly, amphotericin B (0.1–0.2 mg ml−1) was dissolved in an intracellular solution containing 130 mM potassium acetate, 15 mM KCl, 3 mM MgCl2, 6 mM NaCl and 10 mM HEPES (pH 7.3). When filled with this internal solution, pipette resistance was 1.5–2 MΩ. Access resistances after permeabilization ranged from 7–22 MΩ. The external solution consisted of 120 mM NaCl, 6 mM KCl, 1.5 mM MgCl2, 2.5 mM CaCl2, 11 mM glucose and 10 mM HEPES (pH 7.4). Amplitudes of the M currents were measured as deactivating currents during 500-ms test pulses to −50 mV from a holding potential of −20 mV. Data are presented as mean ± SEM.
Statistical analysis
All statistical tests were carried out using one-way ANOVA, followed by two-tailed unpaired Student's _t_-tests using Excel (Microsoft) and Instat (Graphpad software). All alpha levels were set to 0.05. For each data set, Gaussian distribution was confirmed by the method used by Kolmogorov and Smirnov (Instat, Graphpad software).
BIND identifiers
One BIND identifier (www.bind.ca) is associated with this manuscript: 335775.
Supplementary Material
Figure S1 The muscarinic inhibition of KCNQ2 channels is blunted in AKAP79 gene-silenced HEK293 cells. RNAi knockdown and cell selection was as described in Fig. 1B. Cells were then transfected with KCNQ2 and GFP, plus or minus AKAP150. (a) Electrophysio-logical recording of the KCNQ2 response to 10 mM acetylcholine. Control cells show muscarinic inhibition of KCNQ2 (black squares, n = 8), which is ablated in AKAP79 silenced cells (red triangles, n = 9). Inhibition of the response is rescued in AKAP150 expressing cells (green circle, n = 6). (b) Representative traces at time 0 and 1 minute after the application of 10 μM acetylcholine are shown for control, AKAP79 silenced and AKAP150 rescued cells. (c) For all experimental conditions the amalgamated data depicting normalized current (relative to time 0) taken 1 minute after the application of agonist is shown. An additional control group of cells transfected with the pSAKAP79i construct specific for the murine ortholog is also shown (n=9). The statistical significance of electrophysiology data shown in this figure part c was calculated using ANOVA followed by two-tailed Student's t-test. Statistical significance of pSAKAP79i vs control has P value=0.011. Error bars indicate S.E.M.
Figure S2 Gene silencing of AKAP150 in SCG. Cultured superior cervical ganglion (SCG) neurons nuclear injected with AKAP150-GFP and DsRED2 expression constructs were coinjected either withpSAKAP150i or without pSAKAP150i (control). (a)Three days after injection, images of the cells were collected using a Zeiss Axiovert135TV and MetaMorph 4.6 (scale bar equals 20 μm). (b) The fluorescent intensity of DsRED and AKAP150-GFP within a defined region of interest in each cell body was measured and plotted. The GFP fluorescence in the AKAP150 silenced neurons was minimal regardless of the injection volume as detected by DsRED expression levels. (c) Amalgamated data from (b) presented as the ratio of AKAP150-GFP/DsRED fluorescent intensity shows gene silencing of AKAP150 in pSAKAP150i injected neurons. (P<0.0001, two-tailed Student's t-test)
Figure S3 AKAP150 is required for Oxo-M suppression of M current. Muscarinicinhibition of M-current in SCG neurons was recorded three days after injection with pSAKAP150i. Recordings were taken at 1 minute intervals following each step of the sequential application of 0.0, 0.1, 0.3 1.0, 3.0, and 10 μM Oxo-M. Representative traces of this dose-response in (a) control and (b) AKAP150 silenced neurons are shown. (c) Amalgamated data from control (n = 7) and pSAKAP150i (n = 13) experiments show blunting of the muscarinic inhibition of M current in the AKAP150 silenced cells when compared to controls. Error bars indicate S.E.M. Curves show the best fit to Hill equation,
where y is the normalized response, Rmax is fraction of maximal response, [L] is the ligand concentration, n is the Hill coefficient. The fitted values are as follows; EC50 = 0.97 μM, n = 1.3, Rmax = 0.78 for control and EC50 = 4.3 μM, n = 0.84, Rmax= 0.5 for AKAP150 silenced cells. Knockdown of AKAP150 reduced the population of M currents that can respond to Oxo-M, suggesting that endogenous AKAP150 does not merely increase the sensitivity of the response in SCG but is required for the muscarinic inhibition of M current.
Figure S4 The M current inhibition that is induced by 3 nM bradykinin mirrors the response with a higher dose. M currents recorded from control (black circles, n = 5) and AKAP150 silenced (red circles, n = 5) SCG neurons. Cells were treated with 3 nM bradykinin at time 0 for 1 min. After a recovery period of 10 min a second train of agonist, Oxo-M (1 M, 1 min) was applied to the same cells. Responses to this concentration of bradykinin which is near its EC50 (∼ 1 nM) were essentially the same as those presented in Fig. 6e. This data provides additional evidence that AKAP150-silenced neurons are responsive to physiological concentrations of bradykinin and that this agonist suppresses M currents via an AKAP150 independent pathway. Error bars indicate S.E.M.
Acknowledgments
We thank J. J. Carlisle Michel and R. Goodman for insightful comments on the manuscript and R. Mouton for technical assistance. This work was supported by grant no. GM48231 from the National Institutes of Health to J.D.S.
Footnotes
Note: Supplementary Information is available on the Nature Cell Biology website.
Competing Financial Interests: The authors declare that they have no competing financial interests.
References
- 1.Venter JC, et al. The sequence of the human genome. Science. 2001;291:1304–1351. doi: 10.1126/science.1058040. [DOI] [PubMed] [Google Scholar]
- 2.Lander ES, et al. Initial sequencing and analysis of the human genome. Nature. 2001;409:860–921. doi: 10.1038/35057062. [DOI] [PubMed] [Google Scholar]
- 3.Hunter T. Signaling — 2000 and beyond. Cell. 2000;100:113–127. doi: 10.1016/s0092-8674(00)81688-8. [DOI] [PubMed] [Google Scholar]
- 4.Pawson T, Nash P. Assembly of cell regulatory systems through protein interaction domains. Science. 2003;300:445–452. doi: 10.1126/science.1083653. [DOI] [PubMed] [Google Scholar]
- 5.Wong W, Scott JD. AKAP signalling complexes: Focal points in space and time. Nature Rev Mol Cell Biol. 2004;5:959–971. doi: 10.1038/nrm1527. [DOI] [PubMed] [Google Scholar]
- 6.Carr DW, Stofko-Hahn RE, Fraser IDC, Cone RD, Scott JD. Localization of the cAMP-dependent protein kinase to the postsynaptic densities by A-kinase anchoring proteins: characterization of AKAP79. J Biol Chem. 1992;24:16816–16823. [PubMed] [Google Scholar]
- 7.Klauck TM, et al. Coordination of three signaling enzymes by AKAP79, a mammalian scaffold protein. Science. 1996;271:1589–1592. doi: 10.1126/science.271.5255.1589. [DOI] [PubMed] [Google Scholar]
- 8.Gao T, et al. cAMP-dependent regulation of cardiac L-type Ca2+ channels requires membrane targeting of PKA and phosphorylation of channel subunits. Neuron. 1997;19:185–196. doi: 10.1016/s0896-6273(00)80358-x. [DOI] [PubMed] [Google Scholar]
- 9.Fraser ID, Scott JD. Modulation of ion channels: a ‘current’ view of AKAPs. Neuron. 1999;23:423–426. doi: 10.1016/s0896-6273(00)80795-3. [DOI] [PubMed] [Google Scholar]
- 10.Hoshi N, et al. AKAP150 signaling complex promotes suppression of the M-current by muscarinic agonists. Nature Neurosci. 2003;6:564–571. doi: 10.1038/nn1062. [DOI] [PMC free article] [PubMed] [Google Scholar]
- 11.Banke TG, et al. Control of GluR1 AMPA receptor function by cAMP-dependent protein kinase. J Neurosci. 2000;20:89–102. doi: 10.1523/JNEUROSCI.20-01-00089.2000. [DOI] [PMC free article] [PubMed] [Google Scholar]
- 12.Esteban JA, et al. PKA phosphorylation of AMPA receptor subunits controls synaptic trafficking underlying plasticity. Nature Neurosci. 2003;6:136–143. doi: 10.1038/nn997. [DOI] [PubMed] [Google Scholar]
- 13.Tavalin SJ, et al. Regulation of GluR1 by the A-kinase anchoring protein 79 (AKAP79) signaling complex shares properties with long-term depression. J Neurosci. 2002;22:3044–3051. doi: 10.1523/JNEUROSCI.22-08-03044.2002. [DOI] [PMC free article] [PubMed] [Google Scholar]
- 14.Carr DW, Hausken ZE, Fraser ID, Stofko-Hahn RE, Scott JD. Association of the type II cAMP-dependent protein kinase with a human thyroid RII-anchoring protein Cloning and characterization of the RII-binding domain. J Biol Chem. 1992;267:13376–13382. [PubMed] [Google Scholar]
- 15.Faux MC, Scott JD. Regulation of the AKAP79-protein kinase C interaction by Ca2+/calmodulin. J Biol Chem. 1997;272:17038–17044. doi: 10.1074/jbc.272.27.17038. [DOI] [PubMed] [Google Scholar]
- 16.Dell'Acqua ML, Dodge KL, Tavalin SJ, Scott JD. Mapping the protein phosphatase-2B anchoring site on AKAP79 Binding and inhibition of phosphatase activity are mediated by residues 315–360. J Biol Chem. 2002;277:48796–48802. doi: 10.1074/jbc.M207833200. [DOI] [PMC free article] [PubMed] [Google Scholar]
- 17.Garner CC, Nash J, Huganir RL. PDZ domains in synapse assembly and signalling. Trends Cell Biol. 2000;10:274–280. doi: 10.1016/s0962-8924(00)01783-9. [DOI] [PubMed] [Google Scholar]
- 18.Brown DA, Adams PR. Muscarinic suppression of a novel voltage-sensitive K+ current in a vertebrate neurone. Nature. 1980;283:673–676. doi: 10.1038/283673a0. [DOI] [PubMed] [Google Scholar]
- 19.Marrion NV. Control of M-current. Annu Rev Physiol. 1997;59:483–504. doi: 10.1146/annurev.physiol.59.1.483. [DOI] [PubMed] [Google Scholar]
- 20.Suh BC, Hille B. Recovery from muscarinic modulation of M current channels requires phosphatidylinositol 4,5-bisphosphate synthesis. Neuron. 2002;35:507–520. doi: 10.1016/s0896-6273(02)00790-0. [DOI] [PubMed] [Google Scholar]
- 21.Zhang H, et al. PIP(2) activates KCNQ channels, and its hydrolysis underlies receptor-mediated inhibition of M currents. Neuron. 2003;37:963–975. doi: 10.1016/s0896-6273(03)00125-9. [DOI] [PubMed] [Google Scholar]
- 22.Bosma MM, Hille B. Protein kinase C is not necessary for peptide-induced suppression of M current or for desensitization of the peptide receptors. Proc Natl Acad Sci USA. 1989;86:2943–2947. doi: 10.1073/pnas.86.8.2943. [DOI] [PMC free article] [PubMed] [Google Scholar]
- 23.Cruzblanca H, Koh DS, Hille B. Bradykinin inhibits M current via phospholipase C and Ca2+ release from IP3-sensitive Ca2+ stores in rat sympathetic neurons. Proc Natl Acad Sci USA. 1998;95:7151–7156. doi: 10.1073/pnas.95.12.7151. [DOI] [PMC free article] [PubMed] [Google Scholar]
- 24.Dell'Acqua ML, Faux MC, Thorburn J, Thorburn A, Scott JD. Membrane-targeting sequences on AKAP79 bind phosphatidylinositol-4, 5- bisphosphate. EMBO J. 1998;17:2246–2260. doi: 10.1093/emboj/17.8.2246. [DOI] [PMC free article] [PubMed] [Google Scholar]
- 25.Edwards AS, Newton AC. Phosphorylation at conserved carboxyl-terminal hydrophobic motif regulates the catalytic and regulatory domains of protein kinase C. J Biol Chem. 1997;272:18382–18390. doi: 10.1074/jbc.272.29.18382. [DOI] [PubMed] [Google Scholar]
- 26.Smith WB, Starck SR, Roberts RW, Schuman EM. Dopaminergic stimulation of local protein synthesis enhances surface expression of GluR1 and synaptic transmission in hippocampal neurons. Neuron. 2005;45:765–779. doi: 10.1016/j.neuron.2005.01.015. [DOI] [PubMed] [Google Scholar]
- 27.Marrion NV. Calcineurin regulates M channel modal gating in sympathetic neurons. Neuron. 1996;16:163–173. doi: 10.1016/s0896-6273(00)80033-1. [DOI] [PubMed] [Google Scholar]
- 28.Cooper EC, et al. Colocalization and coassembly of two human brain M-type potassium channel subunits that are mutated in epilepsy. Proc Natl Acad Sci USA. 2000;97:4914–4919. doi: 10.1073/pnas.090092797. [DOI] [PMC free article] [PubMed] [Google Scholar]
- 29.Westphal RS, et al. Regulation of NMDA receptors by an associated phosphatase-kinase signaling complex. Science. 1999;285:93–96. doi: 10.1126/science.285.5424.93. [DOI] [PubMed] [Google Scholar]
Associated Data
This section collects any data citations, data availability statements, or supplementary materials included in this article.
Supplementary Materials
Figure S1 The muscarinic inhibition of KCNQ2 channels is blunted in AKAP79 gene-silenced HEK293 cells. RNAi knockdown and cell selection was as described in Fig. 1B. Cells were then transfected with KCNQ2 and GFP, plus or minus AKAP150. (a) Electrophysio-logical recording of the KCNQ2 response to 10 mM acetylcholine. Control cells show muscarinic inhibition of KCNQ2 (black squares, n = 8), which is ablated in AKAP79 silenced cells (red triangles, n = 9). Inhibition of the response is rescued in AKAP150 expressing cells (green circle, n = 6). (b) Representative traces at time 0 and 1 minute after the application of 10 μM acetylcholine are shown for control, AKAP79 silenced and AKAP150 rescued cells. (c) For all experimental conditions the amalgamated data depicting normalized current (relative to time 0) taken 1 minute after the application of agonist is shown. An additional control group of cells transfected with the pSAKAP79i construct specific for the murine ortholog is also shown (n=9). The statistical significance of electrophysiology data shown in this figure part c was calculated using ANOVA followed by two-tailed Student's t-test. Statistical significance of pSAKAP79i vs control has P value=0.011. Error bars indicate S.E.M.
Figure S2 Gene silencing of AKAP150 in SCG. Cultured superior cervical ganglion (SCG) neurons nuclear injected with AKAP150-GFP and DsRED2 expression constructs were coinjected either withpSAKAP150i or without pSAKAP150i (control). (a)Three days after injection, images of the cells were collected using a Zeiss Axiovert135TV and MetaMorph 4.6 (scale bar equals 20 μm). (b) The fluorescent intensity of DsRED and AKAP150-GFP within a defined region of interest in each cell body was measured and plotted. The GFP fluorescence in the AKAP150 silenced neurons was minimal regardless of the injection volume as detected by DsRED expression levels. (c) Amalgamated data from (b) presented as the ratio of AKAP150-GFP/DsRED fluorescent intensity shows gene silencing of AKAP150 in pSAKAP150i injected neurons. (P<0.0001, two-tailed Student's t-test)
Figure S3 AKAP150 is required for Oxo-M suppression of M current. Muscarinicinhibition of M-current in SCG neurons was recorded three days after injection with pSAKAP150i. Recordings were taken at 1 minute intervals following each step of the sequential application of 0.0, 0.1, 0.3 1.0, 3.0, and 10 μM Oxo-M. Representative traces of this dose-response in (a) control and (b) AKAP150 silenced neurons are shown. (c) Amalgamated data from control (n = 7) and pSAKAP150i (n = 13) experiments show blunting of the muscarinic inhibition of M current in the AKAP150 silenced cells when compared to controls. Error bars indicate S.E.M. Curves show the best fit to Hill equation,
where y is the normalized response, Rmax is fraction of maximal response, [L] is the ligand concentration, n is the Hill coefficient. The fitted values are as follows; EC50 = 0.97 μM, n = 1.3, Rmax = 0.78 for control and EC50 = 4.3 μM, n = 0.84, Rmax= 0.5 for AKAP150 silenced cells. Knockdown of AKAP150 reduced the population of M currents that can respond to Oxo-M, suggesting that endogenous AKAP150 does not merely increase the sensitivity of the response in SCG but is required for the muscarinic inhibition of M current.
Figure S4 The M current inhibition that is induced by 3 nM bradykinin mirrors the response with a higher dose. M currents recorded from control (black circles, n = 5) and AKAP150 silenced (red circles, n = 5) SCG neurons. Cells were treated with 3 nM bradykinin at time 0 for 1 min. After a recovery period of 10 min a second train of agonist, Oxo-M (1 M, 1 min) was applied to the same cells. Responses to this concentration of bradykinin which is near its EC50 (∼ 1 nM) were essentially the same as those presented in Fig. 6e. This data provides additional evidence that AKAP150-silenced neurons are responsive to physiological concentrations of bradykinin and that this agonist suppresses M currents via an AKAP150 independent pathway. Error bars indicate S.E.M.