Comprehensive Cysteine-scanning Mutagenesis Reveals Claudin-2 Pore-lining Residues with Different Intrapore Locations (original) (raw)
Background: The composition of the claudin paracellular pore region is incompletely known.
Results: Cysteine-scanning mutagenesis of the first extracellular domain of claudin-2 was used to identify all pore-lining residues and their intrapore locations.
Conclusion: This study maps out the claudin-2 pore region.
Significance: This advances understanding of the structure-function relationship of claudin pores.
Keywords: Epithelial Cell, Ion Channels, Membrane Transport, Sodium Transport, Tight Junctions
Abstract
The first extracellular loop (ECL1) of claudins forms paracellular pores in the tight junction that determine ion permselectivity. We aimed to map the pore-lining residues of claudin-2 by comprehensive cysteine-scanning mutagenesis of ECL1. We screened 45 cysteine mutations within the ECL1 by expression in polyclonal Madin-Darby canine kidney II Tet-Off cells and found nine mutants that displayed a significant decrease of conductance after treatment with the thiol-reactive reagent 2-(trimethylammonium)ethyl methanethiosulfonate, indicating the location of candidate pore-lining residues. Next, we stably expressed these candidates in monoclonal Madin-Darby canine kidney I Tet-Off cells and exposed them to thiol-reactive reagents. The maximum degree of inhibition of conductance, size selectivity of degree of inhibition, and size dependence of the kinetics of reaction were used to deduce the location of residues within the pore. Our data support the following sequence of pore-lining residues located from the narrowest to the widest part of the pore: Ser68, Ser47, Thr62/Ile66, Thr56, Thr32/Gly45, and Met52. The paracellular pore appears to primarily be lined by polar side chains, as expected for a predominantly aqueous environment. Furthermore, our results strongly suggest the existence of a continuous sequence of residues in the ECL1 centered around Asp65–Ser68 that form a major part of the lining of the pore.
Introduction
Epithelia are sheets of cells that act as barriers between different body compartments. Ions can be transported across epithelia via both transcellular and paracellular pathways. The tight junction is the most apical intercellular junctional complex and constitutes the paracellular barrier. Most transcellular ion channels are formed by amphipathic transmembrane α-helixes that cross the lipid bilayer, with the hydrophilic faces of the helixes lining the pore and the selectivity filter. In contrast, paracellular ion transport occurs exclusively in the extracellular space parallel to the plane of the lateral membrane of adjacent cells. The three-dimensional structure of paracellular ion pores is unknown. Paracellular ion permselectivity is determined by a family of tight junction tetratransmembrane proteins known as claudins (1, 2). All claudins have a large first extracellular loop (ECL1)2 that is believed to form the lining of paracellular ion pores (3, 4), probably by the interaction of two claudin molecules on adjacent cells (in trans), as well as the interaction of two or more neighboring molecules within the same cell (in cis). Claudins also have a second, smaller extracellular loop (ECL2) that shares no homology with ECL1. There is no evidence that ECL2 plays any role in determining pore selectivity (4); rather, it seems to be important primarily for trans interactions (5).
The structure and molecular mechanism of claudin-2 has been particularly well studied. It forms high conductance, paracellular cation-selective pores (6–8). The pore is estimated to be 6.5–7.5 Å in diameter (8, 9). Cations are thought to permeate through the pore in a partially dehydrated form (8). The energy for dehydration is derived from the electrostatic interaction between an intrapore acidic residue, Asp65, and the permeating cation (8) with a smaller contribution from cation-π interaction with Tyr67 (10). The substituted cysteine accessibility method is commonly used to map the pore region of ion channels by showing inhibition of pore function when thiol-reactive reagents modify the substituted cysteines in the pore region (11, 12). Claudins have two extracellular cysteines located in the ECL1. In claudin-2, it has been shown that these cysteines form an intramolecular disulfide bond and are inaccessible to thiol-reactive reagents (13). Selective cysteine mutagenesis of four residues in claudin-2 identified Ile66 as a pore-lining residue (14). Thus, the adjacent residues Asp65, Ile66, and Tyr67 in ECL1 are all known to line the paracellular pore.
In this study we set out to map out all the pore-lining residues of claudin-2 by comprehensive cysteine-scanning mutagenesis of the entire ECL1. The goal was to provide new insights into the structure-function relationships of the claudin-2 pore, which might also be generalizable to other pore-forming claudins.
EXPERIMENTAL PROCEDURES
Generation of Polyclonal MDCK II Tet-Off Cell Lines Transduced with Cysteine Mutations of ECL1 of Claudin-2
For the screening phase, the MDCK II strain of renal epithelial cells was chosen to establish polyclonal cell lines because they have a more stable and homogenous epithelial phenotype than MDCK I cells, making them more amenable to high throughput screening. Arg31–Ala82 were predicted using TMHMM 2.0 (15) (online server) to constitute the ECL1 of mouse claudin-2. Constructs in which each residue (excluding the two conserved cysteines: Cys54 and Cys64, and five residues already mutated to cysteine: Tyr35, His57, Asp65, Ile66 (14), and Tyr67 (10)) was changed to cysteine were synthesized (GenScript, Piscataway, NJ) and cloned into the pRevTREP vector (16). All plasmids are deposited in the PSI:Biology Materials Repository at Arizona State University. These 45 plasmids were lipofected into the viral packaging cell line, PT67, on a 96-well plate, and stable clones were selected in 0.3 mg/ml hygromycin for 7–10 days. Viral particles were collected from the PT67 cell growth medium and used to transduce MDCK II Tet-Off cells (Clontech). After 7–10 days in a 0.3 mg/ml hygromycin-selective medium, stably transduced polyclonal MDCK II Tet-Off cell lines were selected.
Immunoblotting
The protein expression of claudin-2 mutants was tested by SDS-PAGE and immunoblotting. Confluent cells grown on tissue culture dishes were mechanically lysed by passing through 25-gauge needles 10 times in a sucrose-histidine lysis buffer containing 0.25 m sucrose, 30 mm histidine, 1 mm EDTA at pH 7 with a protease inhibitor mixture (cOmplete Mini; Roche Diagnostics). Cell lysates were dissolved in a reducing SDS-PAGE buffer (1% (v/v) 2-mercaptoethanol added) and heated at 75 °C for 10 min. 20 μg of protein samples were loaded into a 12% polyacrylamide gel, electrotransferred to a PVDF membrane, blotted with 1:500 mouse anti-claudin-2 antibody and 1:1000 rabbit anti-β-actin antibody (both from Invitrogen) and appropriate horseradish peroxidase-conjugated secondary antibodies (GE Healthcare Bio-Sciences), detected with the ECL chemiluminescent method (Thermo Fisher Scientific), and digitally imaged and quantitated in an ImageQuant LAS-4000 (GE Healthcare Bio-Sciences). Because MDCK II Tet-Off cells have endogenous claudin-2 expression, the total claudin-2 expression in both uninduced conditions (Dox+) and induced conditions (Dox−) was first normalized to its level of β-actin expression. The fold increase of β-actin-normalized claudin-2 expression of the induced state (Dox−) over the uninduced state (Dox+) was then used as a metric for the relative expression level of exogenous claudin-2 mutants.
Immunofluorescent Staining
In the screening phase, MDCK II Tet-Off cells were plated at confluent density on a 96-well glass-bottomed plate. In the confirmatory phase (see below), MDCK I Tet-Off cells were plated at a density of 105 cells/1.16 cm2 on 12-well Transwell plates and grown for 7 days. The cells were washed in ice-cold PBS, fixed with 4% paraformaldehyde at 4 °C for 15 min, permeabilized, and blocked in 0.3% Triton X-100, 1% BSA, 5% goat serum in PBS for 1 h. They were then incubated in primary antibodies (mouse anti-claudin-2, 1:500; rabbit anti-ZO-1, 1:500) for 2 h at room temperature, washed with PBS, incubated in secondary antibodies (Alexa Fluor 488-conjugated anti-rabbit IgG and Alexa Fluor 555-conjugated anti-mouse IgG, both 1:1000) for 1 h, and washed with PBS. All of the antibodies were purchased from Invitrogen. The 96-well glass-bottomed plate was imaged directly with an inverted epifluorescence microscope. To demonstrate clearly the subcellular localization of each of the claudin-2 mutants (see Fig. 2), the brightness of each digitally acquired image was adjusted using Adobe Photoshop CS3. Each adjustment was applied to the entire image field without altering the contrast or the gamma setting. For cells grown on Transwells, the membrane were cut out from the holder and mounted in ProLong anti-fade mounting medium (Invitrogen). Slides were imaged with a Leica TCS SP2 multiphoton confocal microscope all at the same settings.
FIGURE 2.
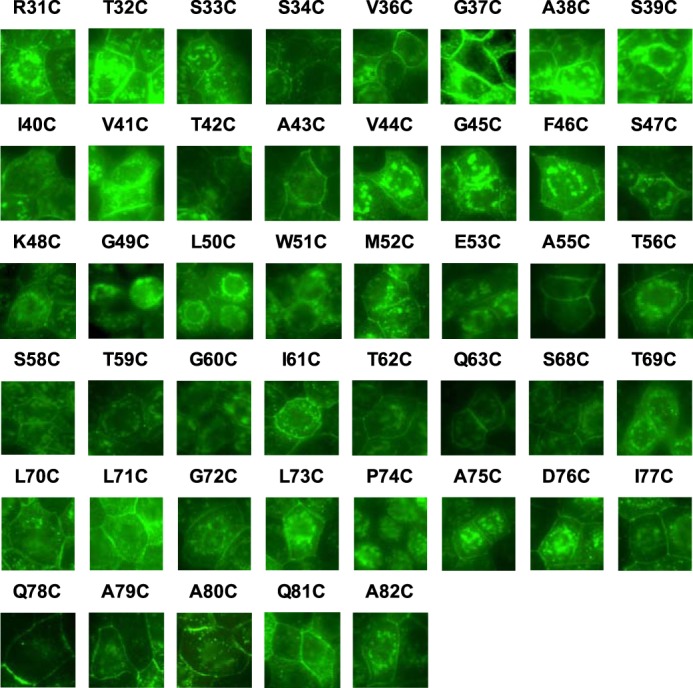
Immunofluorescence screening of protein localization in polyclonal MDCK II Tet-Off cells expressing 45 single cysteine mutations. Cells were plated at confluent density on a 96-well glass-bottomed plate, grown for 7 days, and stained with anti-claudin-2 antibody (green). The exposure of each image was individually adjusted to use the full dynamic range of intensities.
Measuring the Transepithelial Resistance of the Polyclonal MDCK II Tet-Off Cell Lines
Cells were plated at a density of 105 cells/1.16 cm2 on 12-well Transwell plates either in the presence of 50 ng/ml doxycycline to suppress transcription of exogenously transfected claudin-2 (uninduced, Dox+) or in the absence of doxycycline (induced, Dox−). On day 6, the filters were transferred to the culture wells of a CellZscope automated cell monitoring system (Nanoanalytics, Münster, Germany) and equilibrated overnight. On day 7, the transepithelial resistance was measured at 1-h intervals for a period of 48 h. The maximum transepithelial resistance in the Dox+ and Dox− filters during this period was recorded and converted to its reciprocal, conductance (_G_Dox+ and _G_Dox−, expressed in mS). The inducible conductance attributable to expression of each exogenous claudin-2 mutant was calculated by subtracting the mean of the _G_Dox+ values from the _G_Dox− measurement in each individual well for that particular mutant (at least three experimental replicates for each).
Screening Assay of Pore Conductance Inhibition by MTSET
The mutants (V44C, K48C, G49C, L50C, W51C, G60C, P74C, and A79C) whose inducible conductance values were not significantly greater than 0 were excluded in this assay. Cells were plated at a density of 105 cells/1.16 cm2 on 12-well Transwell plates in uninduced conditions (Dox+) or induced conditions (Dox−), transferred to the CellZscope on day 6, and equilibrated overnight. On day 7, 100× concentrated stock of (2-(trimethylammonium)ethyl methanethiosulfonate (MTSET) bromide (Biotium, Hayward, CA) in PBS was added to the apical and basolateral compartments of each well to reach a final concentration of 1 mm. Stock solutions of this and all other MTS reagents were freshly prepared, kept on ice, and used within 1 h of preparation. The transepithelial resistance was recorded at the zero time point and the 1-h time point and converted to G (in mS). The change of conductance caused by MTSET was calculated as follows,

where _G_1Dox+ and G_0Dox+ are the mean conductance values in the uninduced state (Dox+) at the 1-h time point and the zero time point, respectively, and G_1Dox− and G_0Dox− represent the induced conductance of each individual well at the 1-h time point and the zero time point, respectively. To test for differences between the mean Δ_G of each mutant and the mean Δ_G of wild-type claudin-2, a one-way analysis of variance was performed, with a Bonferroni correction for planned multiple comparisons. Residues with Δ_G levels that were statistically significantly greater than that of the wild type were defined as pore-lining residue candidates.
Generation and Characterization of Monoclonal MDCK I Tet-Off Cell Lines Expressing Claudin-2 Pore-lining Mutants
For the confirmatory phase, MDCK I Tet-Off cells were stably transfected with claudin-2 constructs carrying cysteine substitutions at positions that were determined to be pore-lining residues during the screening phase (T32C, G37C, G45C, S47C, M52C, T56C, S58C, T62C, and S68C) using methods described previously (16). Independent clones transduced with claudin-2 constructs were selected using cloning cylinders and were screened by immunoblotting as described above. Clones with high levels of protein expression and epithelial morphology were chosen.
Ussing Chamber Electrophysiological Studies
Cells were plated at a density of 105 cells/1.16 cm2 on Snapwell filters (Corning Life Sciences, Tewksbury, MA) and cultured for 7 days in the presence (Dox+) or absence (Dox−) of 50 ng/ml doxycycline. The Ussing chamber setup and liquid junction potential correction method were employed as described previously (16). The conductance and permeability attributable to the claudin-2 pore was calculated by subtracting the values of the uninduced (Dox+) state from the values of the induced (Dox−) state. The standard Ringer solution used at baseline contained 150 mm NaCl, 2 mm CaCl2, 1 mm MgCl2, 10 mm glucose, 10 mm Tris-HEPES, pH 7.4. To measure Na+ permeability, the solution of the basolateral chamber was changed to a 75 mm NaCl Ringer solution (osmolarity adjusted with mannitol). To measure alkali metal bi-ionic potential, the basolateral medium was changed to a 150 mm alkali metal chloride salt. To measure organic cation permeability, the basolateral medium was changed to a combination of 75 mm organic cation chloride salt and 75 mm NaCl. The organic cations included methylamine, ethylamine, tetramethylammonium, and tetraethylammonium. The ion permeability ratio, β = _P_Cl−/_P_Na+ was calculated from the Goldman-Hodgkin-Katz voltage equation. The absolute Na+ permeability was estimated by the method devised by Kimizuka and Koketsu (17). The alkali metal permeability was calculated from γ = _P_M/_P_Na, where γ was estimated as follows.

The organic cation permeability was calculated from the following equation.

Here, α represents the activity ratio of NaCl in the apical compartment over the basolateral compartment. The activity of NaCl is 0.752 at 150 mm and 0.797 at 75 mm, resulting in α = (150*0.752)/(75*0.797) = 1.89.
The pore sizes of claudin-2 mutants were estimated by the method described previously (8). In short, the claudin-2 pore was assumed to be a cylinder of diameter, D, across which cations of diameter, d, diffused. According to the Renkin equation,

The square root of the permeability (P) of methylamine, ethylamine, and tetraethylammonium relative to Na+ is linearly related to d. D was estimated from the x intercept of the best fit line, as determined by linear regression.
Confirmatory Assay of Pore Conductance Inhibition by a Panel of MTS Reagents
A panel of MTS reagents of different charges and sizes, including 2-aminoethyl methanethiosulfonate (MTSEA), MTSET, 3-(triethylammonium)propyl methanethiosulfonate (MTS-PTrEA), 2-((biotinoyl)amino)ethyl methanethiosulfonate (MTSEA-biotin), and 2-sulfonatoethyl methanethiosulfonate (MTSES), were used to test the pore conductance inhibition effect and the rate of inhibition on the candidates of pore-lining residue. The working concentrations of the reagents are summarized in Table 1. Cells were grown on Snapwell filters for 7 days before being mounted on Ussing chamber. The stock solution was added simultaneously to the medium of the apical and basolateral chambers of the Ussing chamber and rapidly mixed by gas lifts. The conductance was monitored at 1-s intervals for 5 min unless stated otherwise. The post-treatment conductance generally reached a new steady state before the 2-min time point. Thus, the change of conductance was calculated as the percentage change at the 2-min time point compared with the zero time point. The kinetics of the decrease of conductance over time was modeled as a one-phase exponential decay curve using Prism 6.0 (GraphPad Software, La Jolla, CA).

Assuming that the concentration of MTS remains nearly constant, the rate constant (k) derived from the curve represents a pseudo-first order rate constant. The second order rate constant, K, was determined by dividing the pseudo-first order rate constant by the concentration of the applied reagent.
TABLE 1.
Size, charge, and working concentration of the thiol-reactive reagents used in this study
Reagents are listed in order of net charge, increasing size.
| Chemical name | Abbreviation | Net charge | Molecular weight | Working concentration | Stock concentration |
|---|---|---|---|---|---|
| g/mol | mm | ||||
| 2-Aminoethyl methanethiosulfonate hydrobromide | MTSEA | + | 236 | 2.5 | 100× |
| [2-(Trimethylammonium)ethyl] methanethiosulfonate bromide | MTSET | + | 278 | 1 | 100× |
| 3-(Triethylammonium)propyl Methanethiosulfonate bromide | MTS-PTrEA | + | 334 | 1 | 100× |
| 2-((Biotinoyl)amino)ethyl methanethiosulfonate | MTSEA-biotin | Neutral | 382 | 1 | 5× |
| 2-Sulfonatoethyl methanethiosulfonate | MTSES | − | 219 | 5 | 100× |
Statistics
The data are presented as means ± S.E. Statistical significance was determined using unpaired two-tailed Student's t tests or one-way analysis of variance. A p value less than 0.05 was considered to be statistically significant. For multiple comparisons, p values were adjusted using the Bonferroni correction.
RESULTS
Characterization of Polyclonal MDCK II Tet-Off Cell Lines Expressing Each Cysteine Mutant
We generated polyclonal, inducible MDCK II Tet-Off cell lines expressing each of the 45 cysteine mutants of the claudin-2 ECL1 by retroviral transduction. Claudin-2 mutant expression and localization were determined by immunoblotting (Fig. 1) and immunofluorescence staining (Fig. 2), respectively, and summarized in Table 2. By immunoblot analysis, all cell lines demonstrated an increase in protein level when induced by omitting doxycycline, with the exception of A79C. G49C, L50C, W51C, G60C, and P74C were mostly intracellularly localized. Mutations of the conserved motif Gly49-Leu50-Trp51 resulted in claudin-2 mislocalization, which is consistent with previous reports (18, 19). The mislocalization of G60C and P74C is described for the first time. Because glycine and proline are often found at the turn of a peptide fold, Gly60 and Pro74 may be important in forming the critical turning points of the claudin-2 ECL1.
FIGURE 1.
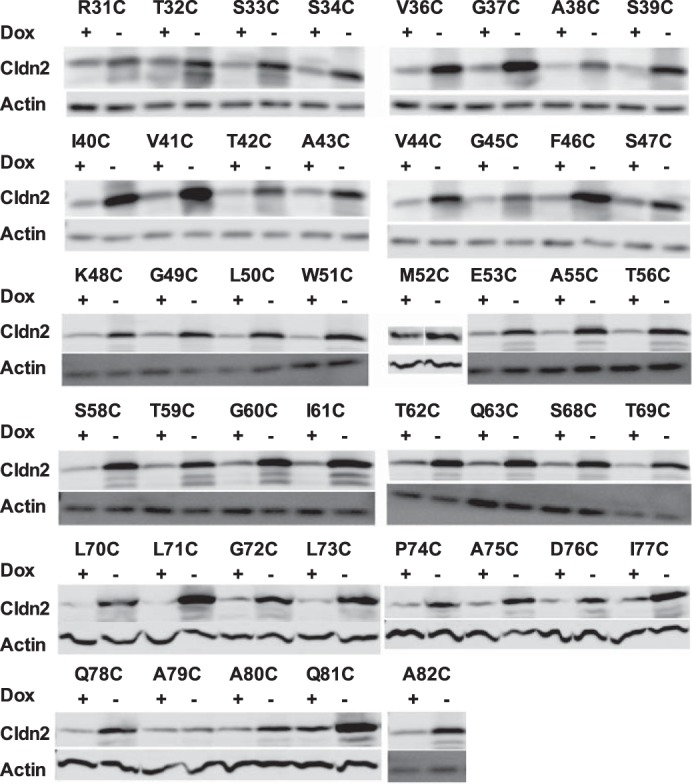
Immunoblot screening of protein expression in polyclonal MDCK II Tet-Off cells expressing 45 single cysteine mutations. Cell lysates were subjected to reducing SDS-PAGE gel and immunoblotted with anti-claudin-2 antibody and anti-β-actin antibody.
TABLE 2.
Biological and physiological characterization of 45 cysteine mutants of claudin-2 ECL1 in polyclonal MDCK II Tet-off cells
| Mutant | Protein localizationa | Protein expressionb | Inducible conductancec |
|---|---|---|---|
| mS | |||
| R31C | TJ | 2.0 | 3.64 ± 0.23 |
| T32C | TJ | 1.6 | 5.56 ± 0.03 |
| S33C | TJ | 2.0 | 3.77 ± 0.14 |
| S34C | TJ | 2.1 | 5.50 ± 0.26 |
| V36C | TJ | 4.5 | 2.21 ± 0.32 |
| G37C | TJ | 3.7 | 14.5 ± 0.18 |
| A38C | TJ | 3.5 | 4.86 ± 0.27 |
| S39C | TJ | 3.6 | 7.54 ± 0.09 |
| I40C | TJ | 5.9 | 7.67 ± 0.28 |
| V41C | TJ | 5.1 | 4.05 ± 0.20 |
| T42C | TJ | 4.2 | 3.86 ± 0.19 |
| A43C | TJ | 2.8 | 3.47 ± 0.12 |
| V44C | TJ | 4.8 | −1.67 ± 0.37 |
| G45C | TJ | 3.2 | 5.06 ± 0.17 |
| F46C | TJ | 7.0 | 5.58 ± 0.33 |
| S47C | TJ | 2.1 | 5.17 ± 0.28 |
| K48C | TJ | 2.8 | 0.18 ± 0.15 |
| G49C | Intracellular | 3.8 | 0.27 ± 0.17 |
| L50C | Intracellular | 3.1 | −0.11 ± 0.88 |
| W51C | Intracellular | 4.6 | −0.16 ± 0.08 |
| M52C | TJ | 3.2 | 6.02 ± 0.29 |
| E53C | TJ | 1.8 | 2.95 ± 0.02 |
| A55C | TJ | 3.9 | 5.69 ± 0.33 |
| T56C | TJ | 3.5 | 4.87 ± 0.16 |
| S58C | TJ | 4.6 | 6.58 ± 1.48 |
| T59C | TJ | 2.8 | 3.14 ± 0.48 |
| G60C | Intracellular | 3.9 | −0.55 ± 0.10 |
| I61C | TJ | 4.3 | 5.77 ± 0.07 |
| T62C | TJ | 2.9 | 6.49 ± 0.25 |
| Q63C | TJ | 3.6 | 1.40 ± 0.03 |
| S68C | TJ | 2.9 | 1.20 ± 0.13 |
| T69C | TJ | 5.5 | 3.26 ± 0.15 |
| L70C | TJ | 10.6 | 2.13 ± 0.28 |
| L71C | TJ | 21.2 | −0.37 ± 0.18 |
| G72C | TJ | 4.0 | 4.82 ± 0.04 |
| L73C | TJ | 7.9 | 2.83 ± 0.66 |
| P74C | Intracellular | 4.5 | −0.04 ± 0.75 |
| A75C | TJ | 7.6 | 1.27 ± 0.12 |
| D76C | TJ | 4.1 | 4.97 ± 0.43 |
| I77C | TJ | 4.2 | 4.44 ± 0.28 |
| Q78C | TJ | 5.2 | 5.85 ± 0.04 |
| A79C | TJ | 1.3 | 1.09 ± 0.75 |
| A80C | TJ | 2.6 | 1.17 ± 0.09 |
| Q81C | TJ | 6.3 | 2.89 ± 0.24 |
| A82C | TJ | 2.8 | 4.74 ± 0.16 |
The transepithelial conductance of exogenous claudin-2 mutants was measured under uninduced (Dox+) and induced (Dox−) conditions and calculated as inducible conductance attributable to exogenous claudin-2 (Fig. 3). The inducible conductance of V44C, K48C, G49C, L50C, W51C, G60C, L71C, P74C, and A79C was not greater than 0, indicating that these mutants do not form functional claudin-2 pores. For some, this could be attributed to protein mislocalization (G49C, L50C, W51C, G60C, and P74C) or low level of expression (A79C). For the mutants that were well expressed and localized at the tight junction (V44C, K48C, and L71C), the mutation presumably impaired pore function and might possibly even have had a dominant negative effect. All eight nonfunctional mutants were excluded from the screening assay of pore conductance inhibition by MTSET.
FIGURE 3.
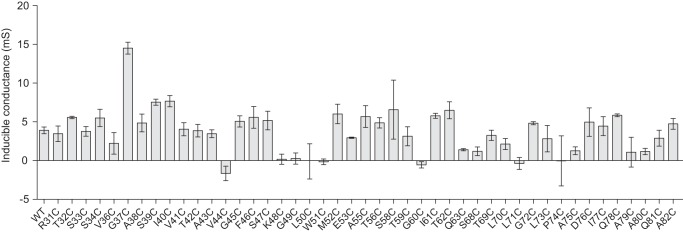
Inducible conductance of transfected WT and mutant claudin-2 constructs. Constructs containing the indicated cysteine mutations in the ECL1 were expressed in MDCK II Tet-Off cells. Cells were grown in Dox+ or Dox− medium on Transwells, and transepithelial conductance was measured on day 7. Inducible conductance was calculated as _G_Dox− minus the average _G_Dox+ for each cell line (n = 3–6).
Screening Assay of Pore Conductance Inhibition by MTSET Identifies Candidate Pore-lining Residue
To identify residues that are located at or close to the pore-lining region, we tested each cysteine mutant for inhibition of conductance by the thiol-reactive reagent, MTSET. The change of conductance after MTSET, Δ_G_, of each mutant was compared with that of wild-type claudin-2 (Fig. 4) using one-way analysis of variance with Bonferroni correction. The Δ_G_ of nine mutants, T32C, G37C, G45C, S47C, M52C, T56C, S58C, T62C, and S68C (gray columns), were statistically significantly greater in magnitude than that of wild type. These were selected as candidate pore-lining residue mutants for further investigation. Some mutants (S33C, S34C, A43C, F46C, Q63C, and T69C) had more inhibition of conductance than wild type that was not statistical significant, possibly because of the stringent statistical test. Residues that did not exhibit a change of conductance were presumed to not be located in the pore region or to be otherwise inaccessible to MTSET.
FIGURE 4.
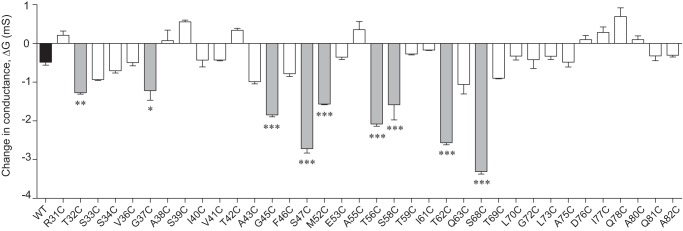
Screening assay of conductance inhibition by MTSET. The ordinate depicts the change of conductance (Δ_G_) in MDCK II Tet-Off cells expressing claudin-2 WT (shaded black) or cysteine mutants, 1 h after addition of MTSET. Candidate pore-lining residues are shaded in gray. *, p < 0.05; **, p < 0.01; ***, p < 0.001.
Characterization of Monoclonal MDCK I Tet-Off Cell Lines Expressing Cysteine Mutants of the Candidate Pore-lining Residues
To confirm the nine candidate pore-lining residues, we generated monoclonal MDCK I Tet-Off cell lines expressing the substituted cysteine mutation of each residue. In addition, we included I66C, a known pore-lining residue mutant (14), as a positive control. Inducible protein expression was verified by immunoblotting (Fig. 5A), which showed a characteristic band of claudin-2 monomer at ∼20 kDa in the absence of doxycycline. There were also multiple bands smaller than 20 kDa, which are not seen in the claudin-2 blots of native kidney (data not shown). They are therefore probably proteolysis products, which we often see in cells overexpressing exogenous proteins. Immunofluorescence staining with anti-claudin-2 and anti-ZO-1 antibodies showed that each mutant had similar tight junction localization as wild-type claudin-2 (Fig. 5B).
FIGURE 5.
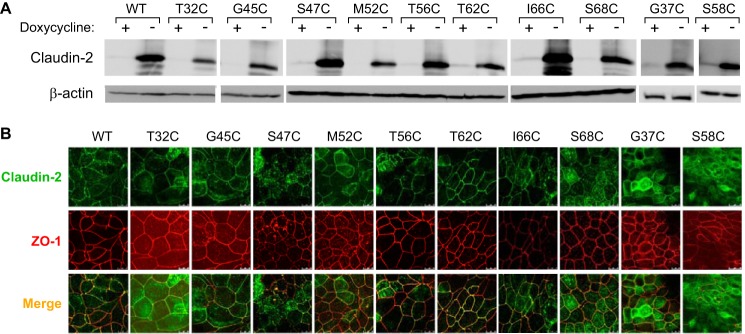
Characterization of stably transduced MDCK I Tet-Off cell lines expressing claudin-2 mutants. A, immunoblot of claudin-2 expression in clones stably transfected with wild-type claudin-2 or the indicated mutants, grown in the presence (+) or absence (−) of doxycycline. Cell lysates were subjected to reducing SDS-PAGE and immunoblotted with antibodies to claudin-2 (upper panel) or β-actin (lower panel). The image was exposed for 15 min. B, localization of claudin-2 mutants by double immunofluorescence staining and confocal microscopy examination. The cells were cultured on Transwells for 6 days and then immunostained for ZO-1 (red) and claudin-2 (green).
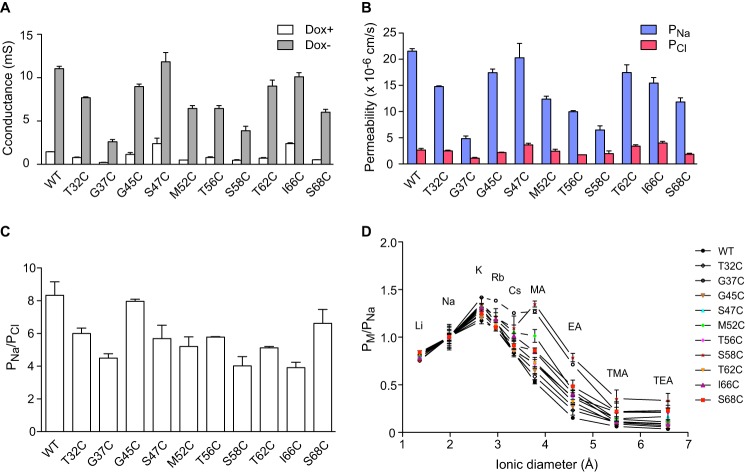
Next, the electrophysiological properties of each mutant were analyzed in Ussing chambers. The transepithelial conductance significantly increased after induction of expression of each claudin-2 protein (Fig. 6A). Like wild-type claudin-2, all the mutants were cation-selective with the _P_Na/_P_Cl ratio ranging from 4 to 8 (Fig. 6, B and C). The relative permeability sequence between alkali metal cations and organic cations was also similar between mutants and wild type (Fig. 6D) with the exception of S58C, which had higher relative permeability to methylamine compared with cesium. The pore diameters were estimated from the relative permeability to organic cations of varying sizes and ranged from 6.4 to 7.3 Å (Table 3), values not significantly different from that of wild-type claudin-2 (6.5 Å). In summary, all mutants had similar pore properties to wild type, and so, by inference, their pore structure was preserved and likely to be similar to the native structure of the wild-type claudin-2 pore.
FIGURE 6.
Characterization of the electrophysiological properties of claudin-2 pore-lining mutants in monoclonal MDCK I Tet-Off cell lines. A, transepithelial conductance in uninduced (Dox+) and induced (Dox−) cells. B, Na+ permeability and Cl− permeability determined from 2:1 NaCl dilution potentials. Dox+ measurements were subtracted from Dox− values to derive the permeability attributable to the claudin-2 pore. C, charge selectivity, expressed as _P_Na/_P_Cl. D, permeability to alkali metal ions and organic cations (_P_M) relative to their Na+ permeability (_P_Na), plotted against the ionic diameters. For each data point, n = 3–9 filters.
TABLE 3.
Summary of estimated pore size of cysteine mutants and wild-type claudin-2
| Mutation | Pore diameter | _R_2 | |
|---|---|---|---|
| Best fit value | 95% confidence interval | ||
| Å | |||
| Wild type | 6.5 | [6.1, 7.4] | 0.75 |
| T32C | 6.6 | [6.1, 7.5] | 0.90 |
| G37C | 6.7 | [6.6, 6.8] | 1.00 |
| G45C | 6.6 | [6.2, 7.3] | 0.85 |
| S47C | 6.4 | [6.1, 6.7] | 0.90 |
| M52C | 6.5 | [6.1, 6.9] | 0.96 |
| T56C | 7.3 | [6.3, 10.2] | 0.75 |
| S58C | 7.2 | [6.6, 8.0] | 0.83 |
| T62C | 6.4 | [6.2, 6.7] | 0.97 |
| I66C | 6.4 | [6.1, 6.9] | 0.94 |
| S68C | 7.0 | [6.2, 9,2] | 0.78 |
Pore-lining Candidates Reveal Distinct Patterns of Conductance Inhibition by Thiol-reactive Reagents
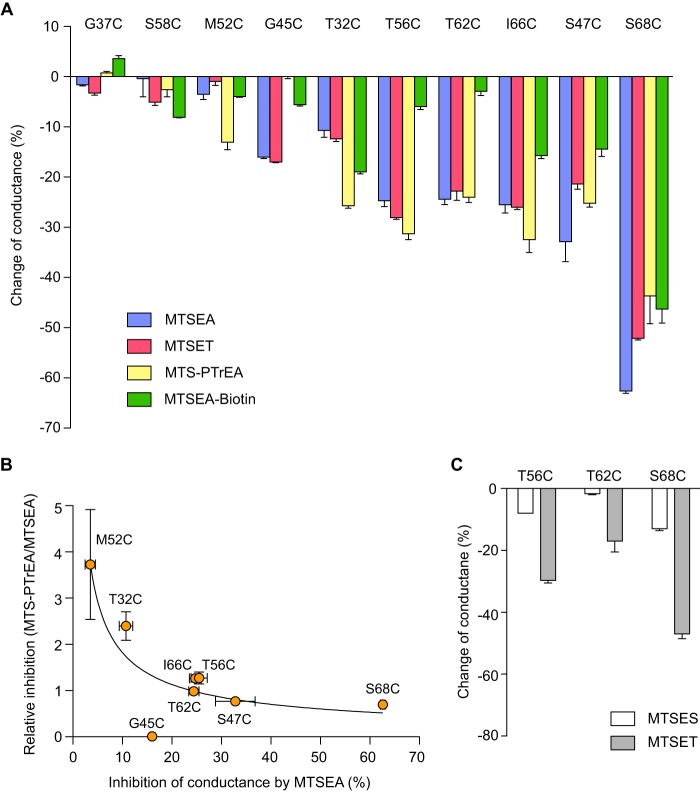
To confirm the findings from the screening phase, we tested whether the conductance of cysteine-substituted mutants of claudin-2 could be inhibited by a panel of MTS reagents in our monoclonal MDCK I Tet-Off cell lines. The I66C mutant was also included in these studies. All of the mutants exhibited the expected inhibition of conductance except for G37C and S58C (Fig. 7A). Thus, the results from the screening phase for G37C and S58C were false positives.
FIGURE 7.
Inhibition of conductance through cysteine-substituted claudin-2 mutants by thiol-reactive reagents. Monoclonal MDCK I Tet-Off cells expressing the indicated cysteine mutants were grown on Snapwell filters for 7 days before mounting on Ussing chamber and then treated with the indicated MTS reagents. A, the change in conductance was calculated as the percentage change of claudin-2 conductance 2 min after adding the indicated MTS reagent, compared with time 0. B, relationship between the magnitude of inhibition by MTS reagents and its dependence on the size of the MTS molecule. The ratio of the percentage inhibition of conductance by MTS-PTrEA relative to that by MTSEA (relative inhibition) was plotted against the percentage inhibition of conductance by MTSEA (curve arbitrarily fitted to a power function). C, effect of MTSES and MTSET on conductance.
We previously showed that MTS inhibition of claudin-2 I66C was due to partial steric block of the paracellular cation pore (14). We therefore reasoned that differences in the magnitude of inhibition of conductance of our cysteine mutants by thiol-reactive reagents of different size or charge ought to be informative about the geometrical location of each mutated residue within the pore. We hypothesized that residues in the narrowest part of the claudin pore would exhibit the greatest degree of conductance inhibition and would be equally blocked by small and large molecules. By contrast, residues in wider regions of the pore would be blocked preferentially by larger molecules and exhibit less or no inhibition with small molecules. The physicochemical properties of the thiol-reactive reagents used for these experiments are listed in Table 1.
Fig. 7 shows the results of these experiments. S68C exhibited the most conductance inhibition by both the cationic and neutral MTS reagents (Fig. 7A). MTSEA blocked more than 60% of the pore conductance. MTSET, MTS-PTrEA, and MTSEA-biotin inhibited the conductance similarly by 40–55%. Cationic MTS reagents inhibited the conductance of I66C and S47C by 20–35%, and MTSEA-biotin (neutral) inhibited their conductance by ∼15%. T56C and T62C had similar conductance inhibition by cationic MTS reagents, yet they were not inhibited by MTSEA-biotin. Conductance of T32C was inhibited by ∼10% by small MTS reagents (MTSEA and MTSET) and 20–25% by large ones (MTS PTrEA and MTSEA-biotin). In contrast to T32C, G45C was inhibited by small MTS reagents but not by the large ones. M52C could only be inhibited by MTS-PTrEA, by 13%.
To better visualize the size dependence of MTS block in the mutant pores, the relative inhibition of conductance by MTS-PTrEA and by MTSEA (a large and a small cationic MTS molecule, respectively) was expressed as a ratio and plotted against the percentage inhibition of conductance of MTSEA (Fig. 7B). A general trend could be observed in which mutants with high levels of inhibition by MTSEA (S68C and S47C) showed little size dependence and were similarly inhibited by large and small MTS reagents. By contrast, mutants with low levels of inhibition by MTSEA (M52C and T32C) were much more effectively blocked by the larger molecule, MTS-PTrEA, than by the smaller MTSEA. T56C, T62C, and I66C showed behavior that was intermediate between these extremes. G45C was an outlier because there was no inhibition by MTS-PTrEA.
The neutral molecule, MTSEA-biotin, was found to have very little effect on the conductance of T56C and T62C. One explanation is that at the positions of these residues, the pore is sufficiently wide that it is incompletely blocked by any MTS molecule, so that the charge becomes an important determinant of ion permeation. To test this, we applied the anionic thiol-reactive reagent, MTSES, and one cationic reagent MTSET, to T56C, T62C, and S68C, and compared their inhibition of conductance (Fig. 7C). MTSES inhibited the conductance of T56C by 8%, T62C by 2%, and S68C by 13%. MTSET inhibited the conductance of T56C by 30%, T62C% by 17%, and S68C by 47%. Thus, cationic reagents inhibited conductance through T56C and T62C much more effectively than either anionic or neutral ones, whereas the effect of the net charge of the reagent on S68C inhibition was much less pronounced.
Kinetics of Reaction of MTS Reagents with the Substituted Pore-lining Cysteines
MTS reagents must diffuse into the pore to react with the accessible free cysteine within the pore. Because the chemical reaction of the MTS with the free thiol group is generally very fast (12), the rate of diffusion into the pore is likely to be the rate-determining step in the overall rate of inhibition of conductance. If the free cysteine is located in a region that is wide enough to allow MTS reagents to diffuse freely, according to the Stokes-Einstein relationship, the overall rate of reaction will be inversely proportional to the radius of the molecule. If, however, the residue is located in a narrow part of the pore, and the diffusion of MTS reagents is partially sterically hindered, the rate of reaction will decrease disproportionately as the size of the MTS molecule increases. To investigate this, the kinetics of inhibition of conductance by MTSEA and MTSET were compared. The decrease of conductance over time fit well with a one-phase exponential decay model. The second order rate constants (K) for the overall rates of inhibition by MTSEA and MTSET were derived from this curve (Fig. 8A). S47C and G45C were found to have lower _K_MTSEA than the other mutants. To better visualize the size dependence of the kinetics, the rate constants for each mutant were normalized to _K_MTSEA (Fig. 8B). S68C, S47C, and T62C had the lowest ratio of _K_MTSET/_K_MTSEA (Fig. 8B), suggesting that they are in the narrowest part of the pore, consistent with the findings of the previous experiment.
FIGURE 8.
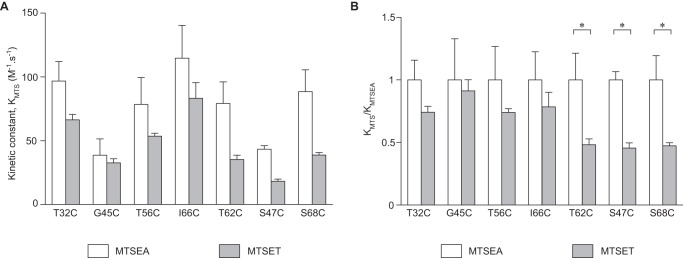
Kinetics of reaction of MTS reagents with the substituted cysteines. The decrease in conductance over time was modeled as a one-phase decay model (by Prism 6.0). A, rate constants (_K_MTS) of MTSEA and MTSET. B, the same data from A are shown normalized to _K_MTSEA.
DISCUSSION
Claudin-2 functions as a paracellular cation pore. Previous work showed that both Asp65 (8) and Tyr67 (10) operate as sites that confer cation selectivity, whereas Ile66 was shown to be located within the pore (14). However, the composition of the pore region was incompletely understood. This work aimed to map out the pore-lining region of claudin-2 by comprehensive cysteine-scanning mutagenesis and thiol group modification.
Conventionally, pore-forming claudins are studied by overexpression in monoclonal epithelial cell lines of low baseline transepithelial conductance, such as MDCK I cells, to obtain a high signal to noise ratio and experimental precision (16). However, this method is not practical for investigating 45 mutants. Instead, we profiled the role of each residue of ECL1 using polyclonal MDCK II Tet-Off cells, followed by confirmatory studies on the candidate pore-lining residue mutants in monoclonal MDCK I Tet-Off cells. The MDCK II strain was used because they have a more stable and homogenous epithelial phenotype than MDCK I cells, making them more amenable to high throughput screening. The screening assay of conductance inhibition by MTSET was used to identify nine new residues (Thr32, Gly37, Gly45, Ser47, Met52, Thr56, Ser58, Thr62, and Ser68) that are probably lining the pore. Because we used a stringent statistical test in this experiment to minimize false positives, we may have excluded other potential pore-lining residues. Mutants at these positions, such as S33C and S34C (close to Thr32), A43C (close to Gly45), F46C (close to Gly45 and Ser47), Q63C (close to Thr62), and T69C (close to Ser68), showed some inhibition by MTSET that was not statistically significant. Because each of these is a neighbor of at least one of the nine residues we selected to study further, we believed that detailed investigation of the nine selected residues should yield sufficient information to define broader subregions of ECL1 that line the pore.
The screening assay using polyclonal MDCK II cells has limitations. First, the pore properties of the mutants cannot be accurately determined because of the high baseline conductance of MDCK II cells and hence the low signal to noise ratio. Second, MDCK II cells have endogenous expression of claudin-2. Thus, claudin-2 protein in transfected cell lines might be expected to exist in heteromultimeric complexes composed of endogenous claudin-2 and heterologous claudin-2 cysteine mutant protomers in various ratios, which would make conductance inhibition results difficult to interpret. Therefore, for the confirmation and detailed characterization studies, the pore-lining residue mutants were expressed in monoclonal MDCK I Tet-Off cells, which lack endogenous claudin-2.
Mutants of the nine candidate pore-lining residues, when expressed in MDCK I cells, displayed similar cation selectivity and pore size. This indicates that these residues, although likely lining the pore, are not directly involved in the mechanism of ion permeation, nor do they play any critical structural roles, and that their substitutions do not lead to changes in higher order pore conformation. These residues, however, displayed very different accessibility and kinetics of reaction to thiol-reactive reagents, which provided indirect structural information about the pore.
To interpret our results, we used a simplified model in which the claudin-2 pore is shaped like a cylindrical channel with funnel-like vestibules. The entry to either side of the pore is wide, and the selectivity filter is located in the middle, which is narrow. Three informative parameters could be derived from the conductance inhibition assay: maximum degree of inhibition, size selectivity of degree of inhibition, and size dependence of the kinetics of reaction. We used these parameters to deduce the location of residues within the pore (Fig. 9).
FIGURE 9.
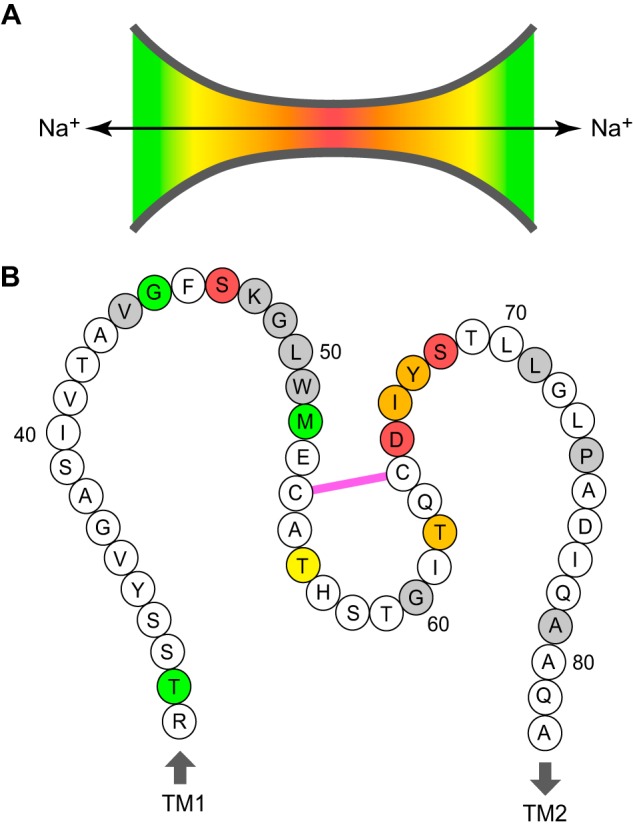
Location of predicted pore-lining residues in the claudin-2 pore. A, funnel model of the claudin pore. The heat map indicates the relative position within the pore (red at the narrowest region and green near the opening). B, cartoon of the claudin-2 ECL1 showing all 52 residues from Arg31 to Ala82, anchored by the first and second transmembrane helices (TM1 and TM2). Pore-lining residues are color-coded according to their predicted position in the model in A. Residues that when mutated to cysteine resulted in loss of expression or function are shaded gray. Cys54 and Cys64 are shown to be connected by a disulfide bond (pink).
S68C and S47C exhibited a high degree of inhibition that was largely independent of the size of the reagents and kinetics of reaction that were steeply dependent on size. These findings suggest that the residues at these two positions are located in the narrowest part of the pore.
T56C, T62C, and I66C all exhibited moderate degrees of inhibition by MTS reagents and no dependence of the degree of inhibition on reagent size, suggesting that they are located in a region of the pore of intermediate width. There were some subtle differences between these three mutants. I66C, unlike the other two mutants, was similarly inhibited by the cationic MTS reagents and the neutral reagent, MTSEA-biotin, and also by the negatively charged 4-(chloromercuri) benzenesulfonic acid (14), suggesting that it is located in a relatively narrow part of the pore. T62C exhibited relatively steep size dependence in its reaction kinetics, suggesting that it might be located in a somewhat narrower region than T56C.
T32C, G45C, and M52C all exhibited low degrees of inhibition, preferential inhibition by larger molecules (except for G45C), and size independence of reaction kinetics, suggesting that they are located in a wide part of the pore or in the vestibule. Interestingly, mutants at two sites in close proximity, G45C and S47C, had particularly slow rates of reaction with MTSEA and MTSET. We speculate that there may be a local steric hindrance effect by the neighboring residue, Phe46, which has a bulky aromatic side chain. This hindrance would also be predicted to render G45C inaccessible to MTS PTrEA, hence explaining why no inhibition was seen with this molecule.
The major limitation of these experiments is that they assume a relatively simple cylindrical pore model in which all the pore-lining residues behave independently and are biophysically equivalent other than their location in a wide or narrow portion of the pore, and they assume that MTS reagents are identical in physicochemical properties other than their size and charge. This is, of course, a simplification. Differences in the shape and conformation of the different thiol-reactive reagents and differences in the shape of the pore and chemical environment surrounding each residue may account for some of the apparent inconsistencies between the conclusions drawn from the different experiments.
Our data support the following sequence of pore-lining residues located from the narrowest to the widest part of the pore: Ser68, Ser47, Thr62/Ile66, Thr56, Thr32/Gly45, and Met52. The paracellular pore appears to primarily be lined by polar side chains, as expected for a predominantly aqueous environment. We already know that Asp65 and Tyr67 act as selectivity determinants and must therefore also be located in the pore with their side chains facing the lumen. We therefore propose the existence of a continuous sequence of residues in the ECL1 from Asp65 to Ser68 (arguably from Thr62 to Thr69) that forms a major part of the lining of the paracellular pore. In conclusion, this study provides a map of the claudin-2 pore region that will be extremely valuable in informing future structural studies and molecular modeling of claudins to further understand the molecular mechanism for paracellular ion transport.
*
This work was supported, in whole or in part, by National Institutes of Health Grants R01DK062283 and U01GM094627 (to A. Y.).
2
The abbreviations used are:
ECL
extracellular loop
MTS
methanethiosulfonate
MTSEA
2-aminoethyl methanethiosulfonate
MTSET
2-(trimethylammonium)ethyl methanethiosulfonate
MTS-PTrEA
3-(triethylammonium)propyl methanethiosulfonate
MTSEA-biotin
2-((biotinoyl)amino)ethyl methanethiosulfonate
MTSES
2-sulfonatoethyl methanethiosulfonate
MDCK
Madin-Darby canine kidney.
REFERENCES
- 1.Furuse M., Fujita K., Hiiragi T., Fujimoto K., Tsukita S. (1998) Claudin-1 and -2. Novel integral membrane proteins localizing at tight junctions with no sequence similarity to occludin. J. Cell Biol. 141, 1539–1550 [DOI] [PMC free article] [PubMed] [Google Scholar]
- 2.Morita K., Furuse M., Fujimoto K., Tsukita S. (1999) Claudin multigene family encoding four-transmembrane domain protein components of tight junction strands. Proc. Natl. Acad. Sci. U.S.A. 96, 511–516 [DOI] [PMC free article] [PubMed] [Google Scholar]
- 3.Colegio O. R., Van Itallie C. M., McCrea H. J., Rahner C., Anderson J. M. (2002) Claudins create charge-selective channels in the paracellular pathway between epithelial cells. Am. J. Physiol. Cell Physiol. 283, C142–C147 [DOI] [PubMed] [Google Scholar]
- 4.Colegio O. R., Van Itallie C., Rahner C., Anderson J. M. (2003) Claudin extracellular domains determine paracellular charge selectivity and resistance but not tight junction fibril architecture. Am. J. Physiol. Cell Physiol. 284, C1346–C1354 [DOI] [PubMed] [Google Scholar]
- 5.Piontek J., Winkler L., Wolburg H., Müller S. L., Zuleger N., Piehl C., Wiesner B., Krause G., Blasig I. E. (2008) Formation of tight junction. Determinants of homophilic interaction between classic claudins. FASEB J. 22, 146–158 [DOI] [PubMed] [Google Scholar]
- 6.Furuse M., Furuse K., Sasaki H., Tsukita S. (2001) Conversion of zonulae occludentes from tight to leaky strand type by introducing claudin-2 into Madin-Darby canine kidney I cells. J. Cell Biol. 153, 263–272 [DOI] [PMC free article] [PubMed] [Google Scholar]
- 7.Amasheh S., Meiri N., Gitter A. H., Schöneberg T., Mankertz J., Schulzke J. D., Fromm M. (2002) Claudin-2 expression induces cation-selective channels in tight junctions of epithelial cells. J. Cell Sci. 115, 4969–4976 [DOI] [PubMed] [Google Scholar]
- 8.Yu A. S., Cheng M. H., Angelow S., Günzel D., Kanzawa S. A., Schneeberger E. E., Fromm M., Coalson R. D. (2009) Molecular basis for cation selectivity in claudin-2-based paracellular pores. Identification of an electrostatic interaction site. J. Gen. Physiol. 133, 111–127 [DOI] [PMC free article] [PubMed] [Google Scholar]
- 9.Van Itallie C. M., Holmes J., Bridges A., Gookin J. L., Coccaro M. R., Proctor W., Colegio O. R., Anderson J. M. (2008) The density of small tight junction pores varies among cell types and is increased by expression of claudin-2. J. Cell Sci. 121, 298–305 [DOI] [PubMed] [Google Scholar]
- 10.Li J., Zhuo M., Pei L., Yu A. S. (2013) Conserved aromatic residue confers cation selectivity in claudin-2 and claudin-10b. J. Biol. Chem. 288, 22790–22797 [DOI] [PMC free article] [PubMed] [Google Scholar]
- 11.Akabas M. H., Stauffer D. A., Xu M., Karlin A. (1992) Acetylcholine receptor channel structure probed in cysteine-substitution mutants. Science 258, 307–310 [DOI] [PubMed] [Google Scholar]
- 12.Karlin A., Akabas M. H. (1998) Substituted-cysteine accessibility method. Methods Enzymol. 293, 123–145 [DOI] [PubMed] [Google Scholar]
- 13.Li J., Angelow S., Linge A., Zhuo M., Yu A. S. (2013) Claudin-2 pore function requires an intramolecular disulfide bond between two conserved extracellular cysteines. Am. J. Physiol. Cell Physiol. 305, C190–C196 [DOI] [PMC free article] [PubMed] [Google Scholar]
- 14.Angelow S., Yu A. S. (2009) Structure-function studies of claudin extracellular domains by cysteine-scanning mutagenesis. J. Biol. Chem. 284, 29205–29217 [DOI] [PMC free article] [PubMed] [Google Scholar]
- 15.Krogh A., Larsson B., von Heijne G., Sonnhammer E. L. (2001) Predicting transmembrane protein topology with a hidden Markov model. Application to complete genomes. J. Mol. Biol. 305, 567–580 [DOI] [PubMed] [Google Scholar]
- 16.Yu A. S. (2011) Electrophysiological characterization of claudin ion permeability using stably transfected epithelial cell lines. Methods Mol. Biol. 762, 27–41 [DOI] [PubMed] [Google Scholar]
- 17.Kimizuka H., Koketsu K. (1964) Ion transport through cell membrane. J. Theor. Biol. 6, 290–305 [DOI] [PubMed] [Google Scholar]
- 18.Cukierman L., Meertens L., Bertaux C., Kajumo F., Dragic T. (2009) Residues in a highly conserved claudin-1 motif are required for hepatitis C virus entry and mediate the formation of cell-cell contacts. J. Virol. 83, 5477–5484 [DOI] [PMC free article] [PubMed] [Google Scholar]
- 19.Van Itallie C. M., Mitic L. L., Anderson J. M. (2011) Claudin-2 forms homodimers and is a component of a high molecular weight protein complex. J. Biol. Chem. 286, 3442–3450 [DOI] [PMC free article] [PubMed] [Google Scholar]
