Spatial Distribution and Initial Changes of SSEA-1 and Other Cell Adhesion-related Molecules on Mouse Embryonic Stem Cells Before and During Differentiation (original) (raw)
Abstract
We examined the distribution of cell adhesion-related molecules (CAMs) among mouse embryonic stem (ES) cells and the spatial distribution on cell surfaces before and during differentiation. The cell-cell heterogeneity of SSEA-1, PECAM-1, and ICAM-1 among the undifferentiated cells in the ES cell colonies was evident by immunohistochemistry and immuno-SEM, supporting the flow cytometry findings. In contrast, most undifferentiated ES cells strongly expressed CD9. SSEA-1 was located preferentially on the edge of low protuberances and microvilli and formed clusters or linear arrays of 3–20 particles. PECAM-1 and ICAM-1 were randomly localized on the free cell surfaces, whereas CD9 was preferentially localized on the microvilli or protuberances, especially in the cell periphery. Both the SSEA-1+ fraction and the SSEA-1− fraction of magnetic cell sorting (MACS) formed undifferentiated colonies after plating. Flow cytometry showed that these populations reverted separately again to a culture with a mixed phenotype. Differentiation induced by retinoic acid downregulated the expression of all CAMs. Immuno-SEM showed decreases of SSEA-1 in the differentiated ES cells, although some clustering still remained. Our findings help to elucidate the significance of these molecules in ES cell maintenance and differentiation and suggest that cell surface antigens may be useful for defining the phenotype of undifferentiated and differentiated ES cells.
Keywords: embryonic stem cells, SSEA-1, cell adhesion-related molecules, immuno-SEM and -TEM, flow cytometry, retinoic acid
Embryonic stem (ES) cells are derived from the inner cell mass of blastocyst stage early embryos and have both pluripotency and capacity of self-renewal. Therefore, ES cells can serve as experimental models for the study of early embryonic development and differentiation, and potentially may serve as sources for cell therapy of various tissues and organs. Mouse ES cells can be maintained in an undifferentiated state for long periods in medium containing the leukemia inhibitory factor (LIF) (Smith et al. 1988; Williams et al. 1988) and can be induced to differentiate along various pathways, depending on culture conditions. A common feature of mouse ES cells after induction of differentiation is a change of cell colony morphology from dome-shaped to monolayered. This characteristic change in the cell-cell and cell-substrate interactions suggests that the expression of intercellular or cell/extracellular matrix adhesion molecules on these cells changes on differentiation.
Embryonic cell surface molecules have been viewed generally as lineage markers and regulators of cell-cell interactions. Cell surface carbohydrates are implicated in a number of membrane-modulated phenomena, such as cell aggregation and adhesion. They play a role in the cellular interactions of the immune system (Springer 1990) and in normal cell interactions during the embryogenesis of preimplantation mouse embryos (Eggens et al. 1989). Stage-specific embryonic antigen-1 (SSEA-1), identified as the cell surface carbohydrate antigen Lewisx (Lex; Galβ1 → 4[Fucα1 → 3]-GlcNAcβ1 → 3Gal), is expressed in preimplantation mouse embryos beginning at the 8-cell stage and also in teratocarcinoma stem cells and ES cells, but not in their differentiated derivatives (Solter and Knowles 1978; Knowles et al. 1980; Fox et al. 1981; Eggens et al. 1989; Kojima et al. 1994). SSEA-1 is regarded as an excellent cell surface marker to monitor early stages of embryogenesis and ES cell differentiation (Solter and Knowles 1978; Fox et al. 1981; Bird and Kimber 1984). Specific interaction of Lex with Lex has been proposed as a basis for cell adhesion in preimplantation embryos and in the aggregation of F9 teratocarcinoma cells (Kojima et al. 1994).
Expression patterns of cell adhesion-related molecules, such as SSEA-1, ICAM-1, PECAM-1, and CD9, occur in undifferentiated and differentiated ES cells (Tian et al. 1997; Redick and Bautch 1999; Oka et al. 2002). PECAM-1 and ICAM-1, representative cell adhesion molecules belonging to the immunoglobulin superfamily, are known to be expressed in endothelial cells and leukocytes. CD9, a tetraspanin superfamily protein, is regarded as a surface marker on mouse and rat male germline stem cells and neural stem cells, and is associated with proliferation, migration, and differentiation of these cells (Hadjiargyrou and Patterson 1995; Kaprielian et al. 1995; Kanatsu-Shinohara et al. 2004). CD9 plays a role in maintenance of undifferentiated mouse ES cells (Oka et al. 2002). Despite high levels of expression in the cells, the spatial distribution of these cell adhesion-related molecules on undifferentiated ES cells has not been elucidated.
In this study we examined the surface ultrastructure of mouse ES cells and the spatial distribution of SSEA-1, ICAM-1, PECAM-1, and CD9 on the cells. In addition, we investigated the changes in the morphology and the expression of these CAMs on initiation of ES cell differentiation. We report for the first time the spatial distribution and expression levels of the above molecules on mouse ES cells.
Materials and Methods
Murine ES Cell Lines and Cell Culture
Five karyotypically normal ES cell lines were used in the study. ES cell lines developed from 129/sv and DBA1 strain mice, passage 9 and 12, respectively, were purchased from Cell and Molecular Technologies (Phillipsburg, NJ). ES cell lines AB1 and AB2.2 at passage 12 were gifts from Dr. Allan Bradley. ES cell line ES-D3, developed by Doetschman, was obtained from American Type Culture Collection (Manassas, VA). Frozen stocks of cells were thawed and seeded onto feeder layers. They were cultured as described previously (Johkura et al. 2003). Briefly, ES cells were cultured in Dulbecco's modified Eagle's medium (DMEM; GIBCO, Grand Island, NY), supplemented with 20% FBS (lot tested), 100 μM nonessential amino acids (GIBCO), 1 mM sodium pyruvate (GIBCO), 100 μM 2-mercaptoethanol (Sigma; St Louis, MO), and 103 U/ml of leukemia inhibitory factor (LIF; Chemicon, Temecula, CA) on feeder cells of mitomycin C-inactivated mouse embryonic fibroblasts under standard culture condition (5% CO2 and humidified air, 37C), and were subcultured every 3 days to maintain an undifferentiated phenotype. The cells were used between passages 10 and 28. ES cells for flow cytometry and RT-PCR were seeded in 6-well plates and for immunocytochemistry on the coverslip at a density of 2 × 10⁴ cells/cm2 for 48 hr. All data presented in the figures are from representative experiments on ES cell lines of 129/sv origin. Similar results were obtained from the other cell lines, ES-D3, AB1, AB2.2, and DBA1.
Differentiation was induced by adding 10−6 M _trans_-retinoic acid (RA) (Draper et al. 2002) to a differentiating medium without LIF (Johkura et al. 2003) for 2 days.
As a control culture, ES cells were dissociated with 0.1% trypsin-EDTA and resuspended in the differentiating medium without LIF for 48 hr, in which ES cells aggregated to form embryoid bodies. Aggregated embryoid bodies were collected and cultured on gelatin-coated coverslips in the same medium for 24 hr. ES cells were also cultured in the differentiating medium without LIF for 48 hr as a control culture for PCR.
Alkaline Phosphatase Staining and Immunofluorescence Labeling
ES cells cultured on the gelatin-coated coverslip were washed once with PBS and fixed in 4% paraformaldehyde/0.1 M phosphate buffer, pH 7.4, for 15 min at room temperature. After washing three times, cells were incubated with nitroblue tetrazolium/bromochloroindolyl phosphate solution (Bio-Rad; Hercules, CA) for 20 min for alkaline phosphatase staining. For immunofluorescence double staining, the following primary antibodies were used: rat monoclonal antibodies (MAbs) against mouse ICAM-1 (KAT; Antigenix America, New York, NY), PECAM-1 (MEC 13.3; Pharmingen, San Diego, CA), and CD9 (KMC8; Pharmingen), and antibody against SSEA-1 (mouse monoclonal IgM; Developmental Studies Hybridoma Bank, University of Iowa, Iowa City, IA). The cells were pretreated with 1.5% normal goat serum for 30 min and incubated overnight at 4C with primary antibodies diluted 1:100 in 1.5% normal goat serum. The CAMs and SSEA-1 were detected by goat anti-rat IgG conjugated with Alexa Fluor 488 and by goat anti-mouse IgM conjugated with Alexa Fluor 568 diluted 1:1000 in 1.5% normal goat serum, respectively (Molecular Probes; Eugene, OR). Specimens were incubated with DAPI (500 ng/ ml; Molecular Probes) for nucleic acid staining. After washing, the cells were mounted with a ProLong Antifade Kit (Molecular Probes) and observed with an Olympus FLUO-VIEW confocal laser scanning microscopy (CLSM) using Ar, He/Ne lasers, or a ZEISS LSM 510 CLSM, or a Leica TCS SP2 AOBS spectral CLSM. For negative controls, normal goat serum or PBS was used instead of the primary antibody.
Double-labeling Immunoelectron Microscopy
The cells were cultured on gelatin-coated coverslips, washed once with hypothermic UW (University of Wisconsin; Madison, WI) solution (Wahlberg et al. 1986; Cui et al. 2002), and then reacted for 30 min with rat anti-mouse ICAM-1, PECAM-1, or CD9 each diluted 1:10 in hypothermic UW solution. After three washes with UW solution, the cells were immersed for 30 min in goat anti-rat IgG antibody conjugated with 20-nm gold particles (British Biocell International; Cardiff, UK) diluted 1:10 in hypothermic UW solution. After another wash, they were incubated with anti-mouse SSEA-1 antibody, 1:10 in hypothermic UW solution, for 30 min. This was followed by another wash and immersion for 30 min in goat anti-mouse IgM antibody conjugated with 10-nm gold particles (British Biocell International), 1:10 in hypothermic UW solution. After a final rinse, the cells were fixed in 2.5% glutaraldehyde/50 mM cacodylate-HCl, pH 7.2, for 4 hr. All procedures were carried out at 4C. Negative controls for immunostaining were obtained by substituting UW solution for the primary antibodies or by using an equivalent concentration of nonimmune rat IgG. Each experiment was repeated at least three times.
Preparation for Scanning Electron Microscopy
After several washes with 0.1 M cacodylate buffer solution for 1.5 hr, the specimens were postfixed in 1% OsO4 for 4 hr and then dehydrated and immersed in isoamyl acetate. They were dried with the CO2-critical point drying method, coated to 3-nm thickness with an osmium plasma coater (Nippon Laser and Electronics Laboratories; Nagoya, Japan), and observed with a JEOL JSM-6000F scanning electron microscope or a Hitachi S-5000 (FE-SEM) scanning electron microscope with a backscatter electron (BSE) detector at an accelerating voltage of 15 kV or 8kV, respectively.
Preparation for Transmission Electron Microscopy
The cells on coverslips were postfixed with 1% OsO4 for 1 hr, dehydrated, and embedded in epoxy resin by a standard method. Sections 1.5 μm thick were stained with 0.1% toluidine blue solution. Ultrathin sections were stained with uranyl acetate and lead citrate solution and observed with a JEM-1200 TEM at an accelerating voltage of 80 kV.
RT-PCR Analysis
Total RNA was extracted from undifferentiated ES cells and from differentiated ES cells at various stages of differentiation using TRIzol reagent (Invitrogen; Carlsbad, CA). DNase-treated total RNA was used to prepare the first-strand cDNA with SuperScript II (Invitrogen), following the protocol of the manufacturer. cDNA samples were subjected to PCR amplification with specific primers under linear conditions to approximate the original amount of the specific transcript. Amplification conditions consisted of denaturation at 95C for 3 min followed by 40 cycles of denaturation at 95C for 1 min, annealing at the temperature specified for each of the primer sets for 1 min, and elongation at 72C for 1 min. The PCR primers, predicted size of amplified products, and annealing temperature are shown in Table 1. cDNA samples from ES cells in the medium without LIF were also analyzed as a control of initial differentiation.
Table 1.
Genes, PCR primers, predicted product size, and annealing temperatures
| Gene | Primers | Predicted size (bp) | Annealing temperature (C) |
| CD9 | CAGTGCTTGCTATTGGACTATG; GCCACAGCAGTCCAACGCCATA | 377 | 55 |
| ICAM-1 | GTGTCGAGCTTTGGGATGGTA; CTGGGCTTGGAGACTCAGTG | 505 | 57 |
| PECAM-1 | CAAGCGGTCGTGAATGACAC; CACTGCCTTGACTGTCTTAAG | 555 | 55 |
| β1-Integrin | AATGTGTTCAGTGCAGAGCC; GTCCCGACATCATCCCAA | 224 | 55 |
| β-Actin | TTCCTTCTTGGGTATGGAAT; GAGCAATGATCTTGATCTTC | 200 | 55 |
Magnetic Cell Sorting (MACS) Separation
SSEA-1-positive and -negative cells were separated using the MACS system (Miltenyi Biotec; Bergisch Gladbach, Germany) according to the instructions of the manufacturer. Briefly, cells were resuspended in 0.5% BSA/PBS and incubated with anti-SSEA-1 antibody (10 μg/ml) for 20 min at 8C, followed by a magnetically labeled rat anti-mouse IgM (Miltenyi Biotec) for 20 min at 8C. The cells were then washed three times with 0.5% BSA/PBS. For sorting and selection of SSEA-1-positive cells, labeled cells were loaded onto a sterile LS column installed in a magnetic field. The column was rinsed with 0.5% BSA/PBS and the negative unlabeled cells passed through. Trapped cells were eluted after the removal of the column from the magnetic field and were collected by centrifugation. For sorting and selection of SSEA-1-negative cells, an LD column was used and the negative unlabeled cells were collected in a centrifugation tube. The SSEA-1+ fraction and SSEA-1− fraction were cultured separately at a density of 2 × 10⁴ cells/cm2 on feeder layers in ES culture medium with LIF.
Flow Cytometry
Cells for flow cytometry were resuspended in 0.5% BSA/PBS and incubated with saturating concentrations of primary antibodies for 30 min at 4C, washed twice, and then labeled with fluorescein isothiocyanate (FITC)-conjugated goat anti-mouse IgM (Chemicon) or PE-Cy5-conjugated goat anti-rat IgG (Cedarlane; Hornby, Canada) for 30 min at 4C. After washing three times with 0.5% BSA/PBS, stained cells were analyzed on a FACS Calibur (Becton Dickinson; Mountain View, CA). Control cells were not treated with primary antibodies. Each experiment was carried out on at least four different cultures to record variation among cultures.
Results
Characterization of Undifferentiated Mouse ES Cells
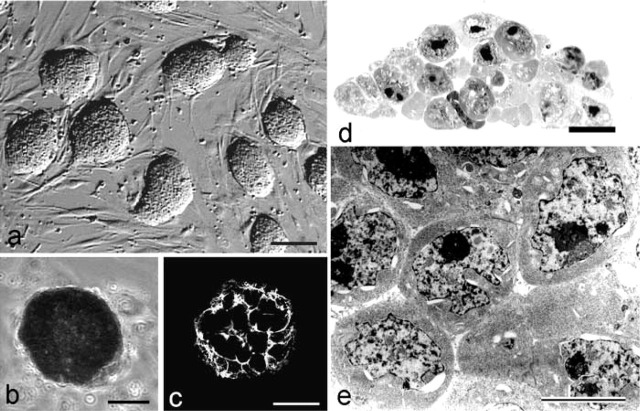
The undifferentiated state of mouse ES cells was ascertained on the basis of morphological features, alkaline phosphatase (ALP) enzyme cytochemistry, and SSEA-1 immunostaining. Hoffman modulation contrast microscopy, which reveals surface features of cells in culture, showed high, dome-shaped ES colonies (Figure 1a). Within the colonies, the undifferentiated ES cells had indistinct margins and were positive for ALP and SSEA-1 (Figures1b and 1c). The undifferentiated ES cells typically had high nucleus/cytoplasm ratios, prominent nucleoli, and were firmly and closely packed together in the colony (Figures 1d and 1e). Dividing cells were present 12 hr after plating (Figure 2a), and many also displayed filopodia or lamellipodia. On day 2 of culture, typical three-dimensional, tightly packed undifferentiated colonies were present (Figure 2b). The free surfaces were rather rough, with many protuberances several nanometers high. In some cases, long and short microvilli were present.
Figure 1.
Undifferentiated mouse ES cell colonies on culture day 2. (A) Hoffman modulation contrast image of mouse ES cell colonies. Within each colony, undifferentiated ES cells have indistinct margins. Bar = 100 μm. (B) ES colonies are positive for alkaline phosphatase activity. (C) Cells within the ES cell colony are positive for SSEA-1, a conventional marker for mouse undifferentiated ES cells. Bars = 60 μm. (D) Vertical section of an ES cell colony stained with toluidine blue. The colony displays compact morphology. Bar = 10 μm. (E) TEM image of an ES cell colony. The cells have a high nucleus/cytoplasm ratio and prominent nucleoli. The data for all figures is based on experiments with mouse ES 129/sv cells. Similar results were obtained for AB1, AB2.2, and DBA1 ES cells. Bar = 10 μm.
Figure 2.
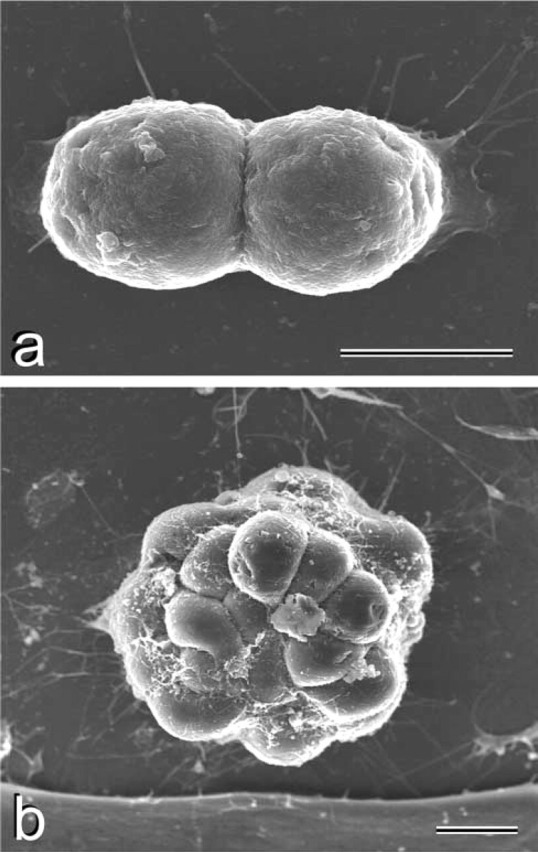
SEM images of mouse ES cell colonies. (A) Undifferentiated ES cells 12 hr after plating. Division of ES cell can be seen. (B) Undifferentiated ES colony on day 2. A well-formed three-dimensional colony has formed. The cell surfaces have microvilli and protuberances are observed. Bars = 10 μm.
Cell Adhesion-related Molecules on ES Cells
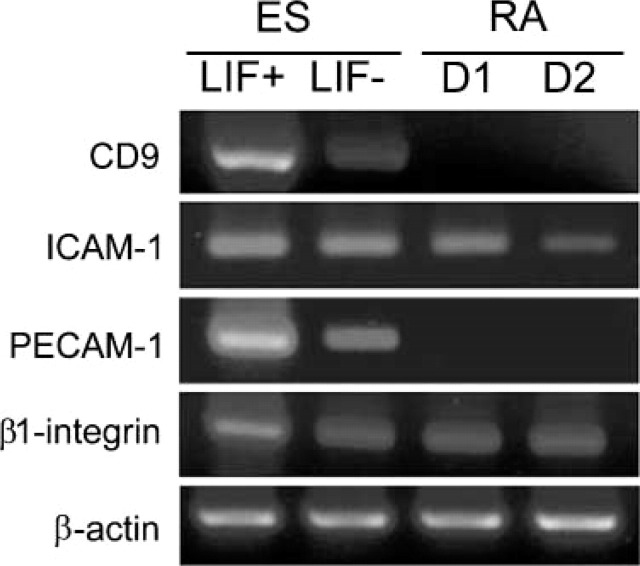
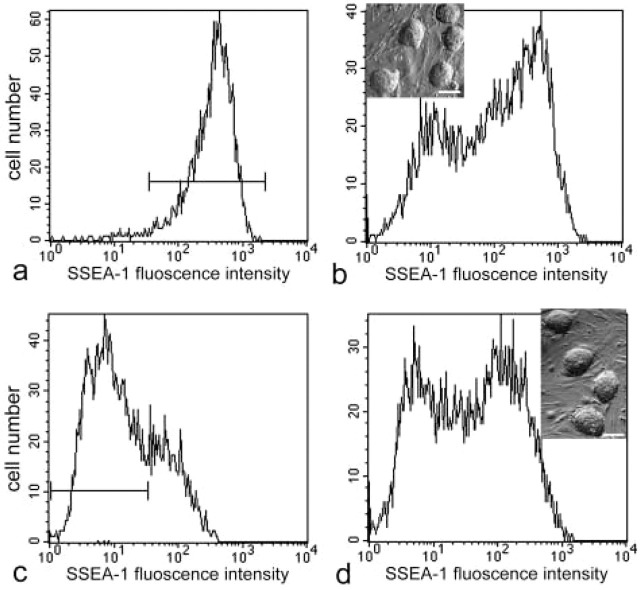
Cell adhesion-related molecules that may be involved in the maintenance of undifferentiated ES cells were assessed by flow cytometry (Figure 3). Nearly all undifferentiated ES cells, 98.5 ± 0.6% (mean ± SD), expressed high levels of CD9 antigen. The fluorescence intensity for SSEA-1, PECAM-1, and ICAM-1 varied from low to high. PECAM-1 and ICAM-1 patterns of distribution were similar to one another, i.e., 74.6 ± 1.4% and 80.7 ± 2.0% of the undifferentiated ES cells expressed the respective molecules. In contrast, only 51.5 ± 1.6% of the undifferentiated ES cells were positive for SSEA-1 (Figure 3). Nearly all SSEA-1-positive cells expressed PECAM-1, ICAM-1, and CD9. RT-PCR also confirmed the synthesis in undifferentiated ES cells of mRNA for PECAM-1, ICAM-1, and CD9 (Figure 4). To further characterize SSEA-1-positive and -negative cells, we purified them from the undifferentiated ES colonies using MACS. By flow cytometry analysis, SSEA-1-positive cells were enriched from 51% to ~98% after MACS (Figure 5a). SSEA-1 negative cells were purified from 49% to ~78.2% (Figure 5c). In contrast, the percentage of CD9-positive cells before and after sorting was the same (not shown). Three days after plating, the morphology of colonies obtained from both SSEA-1+ and SSEA-1− fractions was the same as that of standard undifferentiated culture (Figures 5b and 5d insets). An SSEA-1-negative cell population emerged again in undifferentiated ES colonies derived from the SSEA-1+ fraction (Figure 5b). In undifferentiated ES colonies derived from the SSEA-1− fraction, the percentage of SSEA-1-positive cells increased to the level of that before sorting (Figure 5d).
Figure 3.
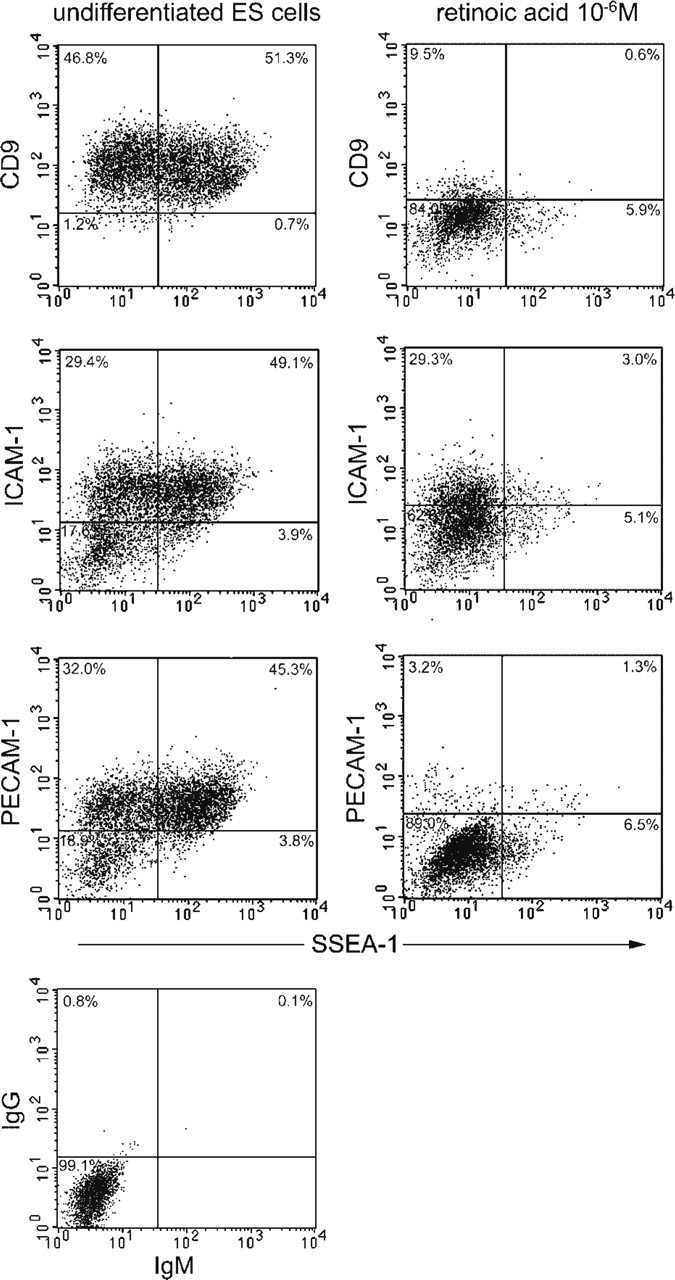
Flow cytometry analysis for the expression of cell adhesion-related molecules on mouse ES cells in absence or presence of 10−6 M retinoic acid. Undifferentiated ES cells express CD9, ICAM-1, PECAM-1, and SSEA-1. The fluorescence intensity for SSEA-1 ranges from background level to strong in every plot of undifferentiated ES cells. Approximately half of the cells are SSEA-1-negative. The dot-plot patterns of ICAM-1 and PECAM-1 are similar to one another, with double-negative cells comprising 17.6% and 18.9% of the population, respectively. In contrast, almost all of the cells (98%) are CD9-positive. After treatment with 10−6 M retinoic acid, double-negative cells for SSEA-1 and ICAM-1, PCAM-1, or CD-9 clearly increased. The quads were set up on the control's dot-plot.
Figure 4.
RT- PCR analysis for undifferentiated, partially differentiated (LIF-), and retinoic acid-treated ES cells. ES, undifferentiated ES cells; LIF+, culture in the ES medium with LIF. LIF-, control culture on day 1 in the ES medium without LIF; RA D1 and D2, differentiated ES cells on culture days 1 and 2 with retinoic acid. After withdrawal of LIF, differentiation of ES cells initiates but is slow compared with retinoic acid treatment.
Figure 5.
Reversibility of SSEA-1-positive and -negative cells. (A) The purity of freshly isolated SSEA-1 positive cells was 98.6%. (B) Three days after plating the SSEA-1+ fraction, an SSEA-1− cell population emerged again in undifferentiated ES colonies. (Inset) ES cell colonies derived from SSEA-1+ fraction were morphologically similar to those before MACS. Bar = 50 μm. (C) The purity of freshly isolated SSEA-1− cells was 78.2%. (C) Three days after plating the SSEA-1− fraction, the percentage of SSEA-1− cells was reduced, whereas the percentage of SSEA-1+ cells recovered to the same level as that before sorting. (Inset) ES cell colonies derived from the SSEA-1− fraction were morphologically similar to those before MACS.
Spatial Localization of Cell Adhesion-related Molecules on the Undifferentiated ES Cells
When viewed by CLSM, antibodies to SSEA-1, CD9, ICAM-1, and PECAM-1 were localized at the contact regions of undifferentiated ES cells and on the free surfaces (Figure 6), although the fluorescence intensity varied greatly from cell to cell. Cells stained for both CD9 and SSEA-1 showed that most were CD9-positive, but some of the same cells were SSEA-1-positive and others were SSEA-1-negative (Figures 6a and 6b), consistent with the results of flow cytometry. Double staining for ICAM-1 and SSEA-1 revealed that some cells were positive for both (Figure 6c), whereas others were positive for ICAM-1 alone or were negative for both (Figure 6d). Cell-cell junctions exhibited stronger fluorescence for PECAM-1 than did free surfaces (Figure 6e). Some cells were positive for PECAM-1 alone (Figure 6f). SSEA-1 had a dot-like appearance on the surface of ES cells (Figure 6g). In general, SSEA-1-positive cells were positive for other CAMs, although occasionally one did not express detectable levels of any of the other CAMs.
Figure 6.
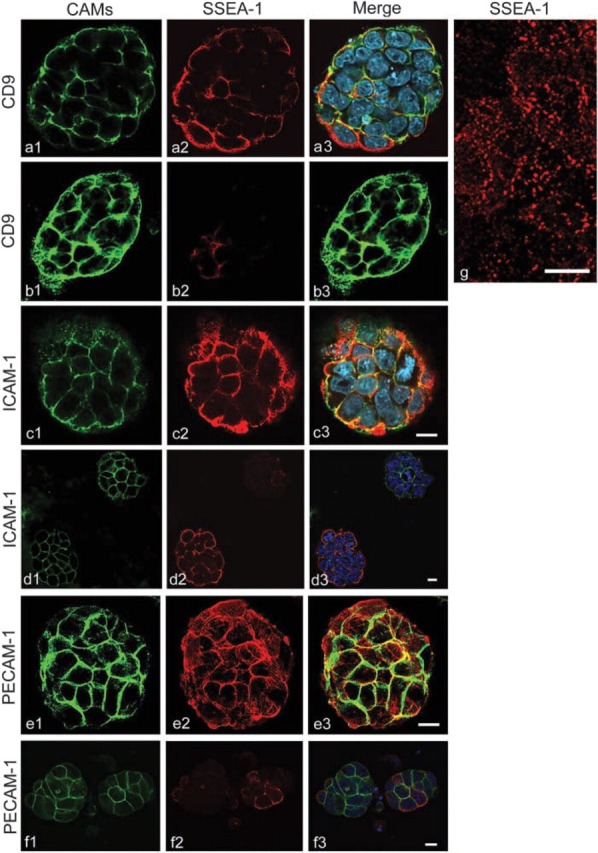
CLSM images of undifferentiated mouse ES cell colonies double stained for SSEA-1 and CD9, ICAM-1, or PECAM-1. Figures labeled 1, 2, and 3 are specific for CAM alone (green), SSEA-1 alone (red), and double-stained (red and green), respectively. Nuclei are stained with DAPI (blue). SSEA-1 is localized to cell-cell contact sites and on free surfaces (a-f2, −3, and g). Not all cells express SSEA-1 (b2,b3,d2,d3,f2,f3). CD9 (a1,a3,b1,b3) is also localized to cell-cell contact sites along with SSEA-1, but its expression there is not dependent on SSEA-1 (b1-b3). CD9 is also found on free cell surfaces apart from cell-cell contact sites. ICAM-1 (c1,c3,d1,d3) has a similar distribution as CD9. PECAM-1 is also similar except that it is less apparent on the free cell surfaces (e1,e3). Not all PECAM-1-positive cells express SSEA-1 (F). High magnification (G) shows the dot-like distribution of SSEA-1 on the surface of ES cells. Bars = 10 μm.
Immuno-SEM and -TEM showed that CD9 was preferentially localized at cell boundaries, where the gold particles were mainly restricted to the microvilli or low protuberances and often formed clusters (Figures 7a and 7b). In contrast, the gold particles for ICAM-1 and PECAM-1 were randomly distributed on the cell free surface (Figures 7c-7e). In the undifferentiated ES cells, the distribution of SSEA-1 varied greatly from cell to cell (Figure 7e). On SSEA-1-positive cells, the 10-nm gold particles were located preferentially on the edge of low protuberances and microvilli, forming clusters ranging from 3 to 20 particles or in linear arrays (Figures 7c-7e). These findings corresponded to the dot-like appearance of SSEA-1 seen by CLSM (Figure 6g). As a control, embryoid body outgrowths derived from suspension cultures were stained for SSEA-1 (Figure 8b). Some undifferentiated ES cells were positive, whereas completely differentiated epithelium-like cells were SSEA-1- negative, showing the specificity of the antibody.
Figure 7.
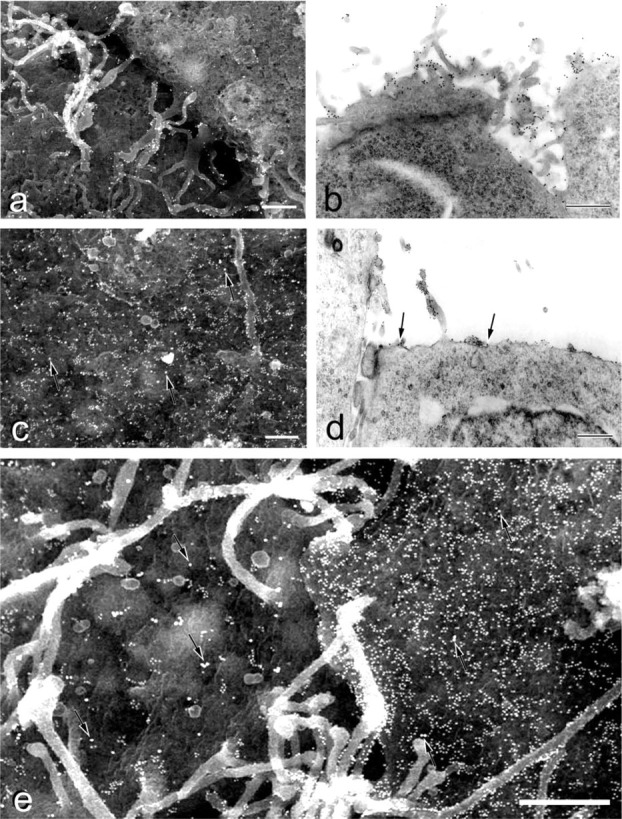
Immuno-EM images of undifferentiated mouse ES cells. (a, c, e) BSE images; (b, d) TEM images. (A) CD9 (single staining) is restricted to the microvilli and low protuberances of cell boundary. (B) In the cell boundary, preferential distribution of the gold particles for CD9 is evident. (c-e) Double staining for SSEA-1 (10-nm gold) and ICAM-1 or PECAM-1 (20-nm gold; arrows). ICAM-1 (c, d) and PECAM-1 (E) are randomly distributed on the free surfaces of undifferentiated ES cells. The small gold particles for SSEA-1 are in linear arrays along the cell protuberances and microvilli. Cell-cell heterogeneity of SSEA-1 is noticeable (E). Bars = 0.5 μm.
Figure 8.
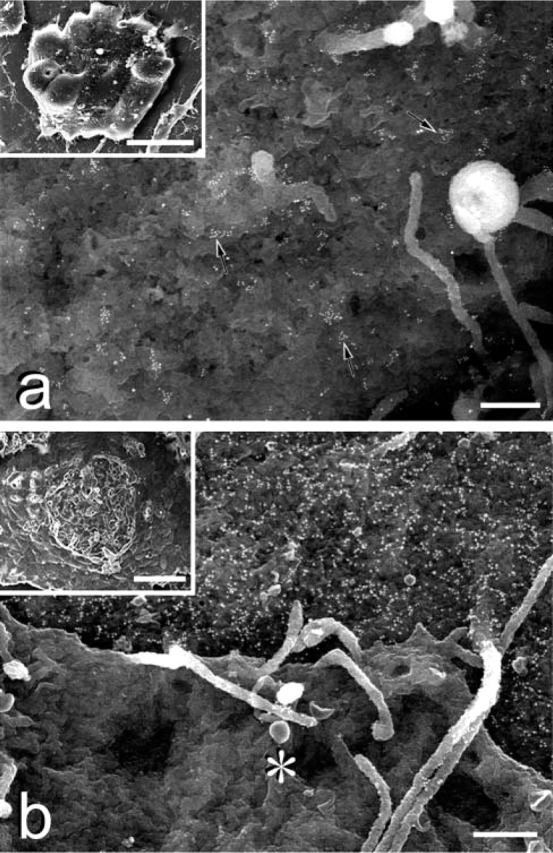
Immunoelectron microscopic images of retinoic acid-treated mouse ES cells. (A) Retinoic acid decreases SSEA-1 labeling; however, some dot-like clusters of SSEA-1 (arrows) still remain. Bar = 0.5 μm. (Inset) ES colony cultured with retinoic acid for 2 days. Morphological alteration is evident compared with the undifferentiated ES cell colonies. The colony has become flat. Bar = 20 μm. (B) Control staining with SSEA-1 on the embryoid body outgrowth. (Inset) The surface cell layer has clearly differentiated to epitheliumlike cells, under which some undifferentiated ES cells still remain. The surface epithelium-like cells at the center have been mechanically stripped off, exposing the underlying cells. Bar = 40 μm. BSE shows the underlying undifferentiated ES cell is positive for SSEA-1, identical to the cells in undifferentiated colonies. The differentiated epithelium-like cells (∗) are SSEA-1-negative. Bar = 0.5 μm.
Cell Adhesion-related Molecules During ES Cell Differentiation by Retinoic Acid
Treatment with retinoic acid caused the colonies to become flattened, and the character of the treated cells was clearly different from that of undifferentiated ES cells (Figure 8a, inset). After differentiation for 2 days, flow cytometry showed that the expression level of SSEA-1 and cell adhesion-related molecules decreased or disappeared (Figure 3). Fluorescence intensity was also generally reduced when viewed by CLSM (not shown). Immuno-SEM showed the general decrease of SSEA-1 in the differentiated ES cells, in which a few dot-like clusters of SSEA-1 still remained (Figure 8a). CD9, PECAM-1, and ICAM-1 labeling were clearly decreased. RT-PCR also confirmed the rapid decline in the expression levels of CD9, ICAM-1, and PECAM-1 mRNAs during initial cell differentiation with regard to β-actin expression (Figure 4). β1-Integrin was also highly expressed in the undifferentiated ES cells and did not significantly change throughout the time course of initial differentiation.
Discussion
In this study we have demonstrated the intercellular heterogeneity of SSEA-1, ICAM-1, and PECAM-1 distribution and ubiquitous expression of CD9 in the undifferentiated differentiated mouse ES cells. The range of SSEA-1, ICAM-1, and PECAM-1 expression varied from low to high levels. SSEA-1 was not present in all undifferentiated ES cells, even though the cell morphology showed little variation. This pattern is consistent with a previous report showing that there are both SSEA-1-positive and -negative cells in preimplantation mouse embryos (Solter and Knowles 1978; Fox et al. 1983). Undifferentiated ES cell heterogeneity was also evident for PECAM-1 and ICAM-1 distribution. The reason for this heterogeneity is not clear. A possible explanation is that cells with different differentiation fates may be randomly distributed in ES colonies as they are in mouse embryos (Solter and Knowles 1978; Fox et al. 1983). However, FACS analysis revealed that SSEA-1+ and SSEA-1− fractions reverted to a culture with a mixed phenotype, approximately the same as that before isolation. This suggests that SSEA-1 expression is reversible in undifferentiated ES cells. Therefore, it is not likely that the different fates of cells during differentiation are responsible for heterogeneity in SSEA-1 expression. Another possible explanation is that SSEA-1 antigen is expressed differently during different phases of the cell cycle, as occurs for other antigens gens (Belaaloui et al. 2003). More work is necessary to elucidate the significance of SSEA-1 heterogeneity.
SSEA-1 (Lex) is a homophilic adhesion molecule capable of interacting with itself and was localized preferentially on cell surface projections. Carbohydrate-carbohydrate interactions are important in specific recognition between cells (Eggens et al. 1989; Kojima et al. 1994), especially during embryogenesis and organogenesis (Knowles et al. 1980). Carbohydrate recognition requires a high density or “clustering” of molecules (Connolly et al. 1982; Lee et al. 1983). In ES cell compaction, cell-cell contacts are maximal, suggesting strong cell adhesion. Human primordial germ cell-derived embryonic germ cell colonies, which have morphological similarity to mouse ES cell colonies, express SSEA-1 (Shamblott et al. 1998). In contrast, the relatively flat and loosely associated primate ES cell colonies are SSEA-1-negative (Thomson et al. 1998; Suemori et al. 2001; Draper et al. 2002). In our studies, SSEA-1 was present on un-differentiated mouse ES cells and diminished as cells differentiated due to the removal of LIF or the addition of retinoic acid. These changes were associated with a transition in colony morphology to that of flat colonies. On the basis of these observations, we hypothesize that SSEA-1 is involved in the formation of multilayered and tightly compacted colonies of mouse ES cells through highly specific Lex-Lex interactions.
Immunocytochemistry and flow cytometry showed that ICAM-1 and PECAM-1 were also heterogeneously distributed on the undifferentiated ES cells. ICAM-1 was uniformly and randomly distributed on the ES cell surfaces and in the cell-cell contact sites. Despite the discernible expression of ICAM-1, ligands for this molecule, i.e., LFA-1 and Mac-1, were not present in the ES cells (Tian et al. 1997). Therefore, the function of this molecule in mouse ES cells remains unclear.
As shown by CLSM, PECAM-1 is the predominant CAM at the cell-cell boundaries of ES cells. This is consistent with previous findings showing that staining for PECAM-1 is specific to cell-cell borders in the inner cell mass of the mouse blastocyst (Robson et al. 2001). Homophilic interaction and diffusion trapping models have been proposed to account for the characteristic distribution of PECAM-1 (Sun et al. 2000). Movement of PECAM-1 in the cell membrane occurs relatively freely until the extracellular domain of the molecule encounters its ligand, PECAM-1, on an adjacent cell (Gingell and Owens 1992; Singer 1992; Sun et al. 2000). When this occurs, the complex is captured at the cell-cell interface, leading to localization at cell-cell borders. Distribution at cell boundaries suggests that PECAM-1 may play a role in ES cell aggregation via its homophilic adhesion. SEM showed random distribution of PECAM-1 on the free surface of ES cells, but its accumulation at the cell-cell borders could not be verified because they are inaccessible to observation by immuno-SEM. The random distribution of PECAM-1 observed by immuno-SEM may reflect the diffusion of molecules not involved in homophilic binding.
Because most undifferentiated ES cells are positive for CD9 and it quickly disappeared after initial differentiation, CD9 may be a more suitable marker for undifferentiated ES cells than SSEA-1. CD9 is a cell adhesion-related molecule and may play a role in cell-extracellular matrix or cell-cell interactions as a co-factor of integrin (Rubinstein et al. 1997; Berditchevski and Odintsova 1999; Takao et al. 1999). The preferential localization of CD9 on microvilli and protrusions of the cellular periphery suggest that it is associated with attachment of adjacent cells. It may also regulate cytoskeletal organization (Berditchevski and Odintsova 1999; Cook et al. 2002), thus affecting the cell-ECM or cell-cell interactions.
The association of cell surfaces containing microdomains of adhesion molecules plays an important role in the three-dimensional cell-cell interactions that affect differentiation of ES cells. The data presented here enable us to further understand the roles of these cell adhesion-related molecules in cell-cell interactions and in self-renewal of ES cells. In addition, the present study indicates that these antigens may be used as markers of cell status to test the phenotypic stability of long-term ES cell cultures. Simultaneous use of immunoreactivity for multiple surface antigens will assist in the identification of positive or negative selection of target cells derived from ES cells.
Acknowledgments
Supported in part by a Grant-in-Aid for Scientific Research from the Ministry of Education, Science, Sports and Culture of Japan (no.13558107), a Grant-in-Aid for 21st COE Program by the Ministry of Education, Culture, Sports, Science, and Technology, and a Grant from The Japan-China Medical Association.
Mouse ES cell lines AB1 and AB2.2 were a kind gift from Dr Allan Bradley (Baylor College of Medicine). We thank Dr Kiyokazu Kametani and Ms Kayo Suzuki (Research Center for Instrumental Analysis of Shinshu University) and Mr Mitsuo Ueno (Fine Materials Engineering, Faculty of Textile Science and Technology of Shinshu University) for excellent technical assistance. We thank Dr Kei-ichi Uemura (Department of Aging Biochemistry, Neuro-aging Research Division, Research Center on Aging and Adaptation of Shinshu University School of Medicine) for advice concerning flow cytometry analysis. We also thank the Microscope Division of Carl Zeiss (Tokyo, Japan) for their support with respect to the CLSM experiment.
Literature Cited
- Belaaloui G, Imbert AM, Bardin F, Tonnelle C, Dubreuil P, Lopez M, Chabannon C. (2003) Functional characterization of human CD34+ cells that express low or high levels of the membrane antigen CD111 (nectin 1). Leukemia 17:1137–1145 [DOI] [PubMed] [Google Scholar]
- Berditchevski F, Odintsova E. (1999) Characterization of integrin-tetraspanin adhesion complexes: role of tetraspanins in integrin signaling. J Cell Biol 146:477–492 [DOI] [PMC free article] [PubMed] [Google Scholar]
- Bird JM, Kimber SJ. (1984) Oligosaccharides containing fucose linked alpha (1–3) and alpha(1–4) to N-acetylglucosamine cause decompaction of mouse morulae. Dev Biol 104:449–460 [DOI] [PubMed] [Google Scholar]
- Connolly DT, Townsend RR, Kawaguchi K, Bell WR, Lee YC. (1982) Binding and endocytosis of cluster glycosides by rabbit hepatocytes. Evidence for a short-circuit pathway that does not lead to degradation. J Biol Chem 257:939–945 [PubMed] [Google Scholar]
- Cook GA, Longhurst CM, Grgurevich S, Cholera S, Crossno JT, Jr, Jennings LK. (2002) Identification of CD9 extracellular domains important in regulation of CHO cell adhesion to fibronectin and fibronectin pericellular matrix assembly. Blood 100:4502–4511 [DOI] [PubMed] [Google Scholar]
- Cui L, Johkura K, Liang Y, Teng R, Ogiwara N, Okouchi Y, Asanuma K, et al. (2002) Defense function of omental milky spots through cell adhesion molecules and leukocyte proliferation. Cell Tissue Res 310:321–330 [DOI] [PubMed] [Google Scholar]
- Draper JS, Pigott C, Thomson JA, Andrews PW. (2002) Surface antigens of human embryonic stem cells: changes upon differentiation in culture. J Anat 200:249–258 [DOI] [PMC free article] [PubMed] [Google Scholar]
- Eggens I, Fenderson B, Toyokuni T, Dean B, Stroud M, Hakomori S. (1989) Specific interaction between Lex and Lex determinants. A possible basis for cell recognition in preimplantation embryos and in embryonal carcinoma cells. J Biol Chem 264:9476–9484 [PubMed] [Google Scholar]
- Fox N, Damjanov I, Knowles BB, Solter D. (1983) Immunohistochemical localization of the mouse stage-specific embryonic antigen 1 in human tissues and tumors. Cancer Res 43:669–678 [PubMed] [Google Scholar]
- Fox N, Damjanov I, Martinez-Hernandez A, Knowles BB, Solter D. (1981) Immunohistochemical localization of the early embryonic antigen (SSEA-1) in postimplantation mouse embryos and fetal and adult tissues. Dev Biol 83:391–398 [DOI] [PubMed] [Google Scholar]
- Gingell D, Owens N. (1992) How do cells sense and respond to adhesive contacts? Diffusion-trapping of laterally mobile membrane proteins at maturing adhesions may initiate signals leading to local cytoskeletal assembly response and lamella formation. J Cell Sci 101:255–266 [DOI] [PubMed] [Google Scholar]
- Hadjiargyrou M, Patterson PH. (1995) An anti-CD9 monoclonal antibody promotes adhesion and induces proliferation of Schwann cells in vitro. J Neurosci 15:574–583 [DOI] [PMC free article] [PubMed] [Google Scholar]
- Johkura K, Cui L, Suzuki A, Teng R, Kamiyoshi A, Okamura S, Kubota S, Zhao X, et al. (2003) Survival and function of mouse embryonic stem cell-derived cardiomyocytes in ectopic transplants. Cardiovasc Res 58:435–443 [DOI] [PubMed] [Google Scholar]
- Kanatsu-Shinohara M, Toyokuni S, Shinohara T. (2004) CD9 is a surface marker on mouse and rat male germline stem cells. Biol Reprod 70:70–75 [DOI] [PubMed] [Google Scholar]
- Kaprielian Z, Cho KO, Hadjiargyrou M, Patterson PH. (1995) CD9, a major platelet cell surface glycoprotein, is a ROCA antigen and is expressed in the nervous system. J Neurosci 15:562–573 [DOI] [PMC free article] [PubMed] [Google Scholar]
- Knowles BB, Pan S, Solter D, Linnenbach A, Croce C, Huebner K. (1980) Expression of H-2, laminin and SV40 T and TASA on differentiation of transformed murine teratocarcinoma cells. Nature 288:615–618 [DOI] [PubMed] [Google Scholar]
- Kojima N, Fenderson BA, Stroud MR, Goldberg RI, Habermann R, Toyokuni T, Hakomori S. (1994) Further studies on cell adhesion based on Le(x)-Le(x) interaction, with new approaches: embryo-glycan aggregation of F9 teratocarcinoma cells, and adhesion of various tumour cells based on Le(x) expression. Glycoconj J 11:238–248 [DOI] [PubMed] [Google Scholar]
- Lee YC, Townsend RR, Hardy MR, Lonngren J, Arnarp J, Haraldsson M, Lonn H. (1983) Binding of synthetic oligosaccharides to the hepatic Gal/GalNAc lectin. Dependence on fine structural features. J Biol Chem 258:199–202 [PubMed] [Google Scholar]
- Oka M, Tagoku K, Russell TL, Nakano Y, Hamazaki T, Meyer EM, Yokota T, et al. (2002) CD9 is associated with leukemia inhibitory factor-mediated maintenance of embryonic stem cells. Mol Biol Cell 13:1274–1281 [DOI] [PMC free article] [PubMed] [Google Scholar]
- Redick SD, Bautch VL. (1999) Developmental platelet endothelial cell adhesion molecule expression suggests multiple roles for a vascular adhesion molecule. Am J Pathol 154:1137–1147 [DOI] [PMC free article] [PubMed] [Google Scholar]
- Rubinstein E, Poindessous-Jazat V, Le Naour F, Billard M, Boucheix C. (1997) CD9, but not other tetraspans, associates with the beta1 integrin precursor. Eur J Immunol 27:1919–1927 [DOI] [PubMed] [Google Scholar]
- Robson P, Stein P, Zhou B, Schultz RM, Baldwin HS. (2001) Inner cell mass-specific expression of a cell adhesion molecule (PE-CAM-1/CD31) in the mouse blastocyst. Dev Biol 234:317–329 [DOI] [PubMed] [Google Scholar]
- Shamblott MJ, Axelman J, Wang S, Bugg EM, Littlefield JW, Donovan PJ, Blumenthal PD, et al. (1998) Derivation of pluripotent stem cells from cultured human primordial germ cells [Erratum appears in Proc Natl Acad Sci USA 1999;96:1162]. Proc Natl Acad Sci USA 95:13726–13731 [DOI] [PMC free article] [PubMed] [Google Scholar]
- Singer SJ. (1992) Intercellular communication and cell-cell adhesion. Science 255:1671–1677 [DOI] [PubMed] [Google Scholar]
- Smith AG, Heath JK, Donaldson DD, Wong GG, Moreau J, Stahl M, Rogers D. (1988) Inhibition of pluripotential embryonic stem cell differentiation by purified polypeptides. Nature 336:688–690 [DOI] [PubMed] [Google Scholar]
- Solter D, Knowles BB. (1978) Monclonal antibody defining a stage-specific mouse embryonic antigen (SSEA-1). Proc Natl Acad Sci USA 75:5565–5569 [DOI] [PMC free article] [PubMed] [Google Scholar]
- Springer TA. (1990) Adhesion receptors of the immune system. Nature 346:425–434 [DOI] [PubMed] [Google Scholar]
- Suemori H, Tada T, Torii R, Hosoi Y, Kobayashi K, Imahie H, Kondo Y, et al. (2001) Establishment of embryonic stem cell lines from cynomolgus monkey blastocysts produced by IVF or ICSI. Dev Dyn 222:273–279 [DOI] [PubMed] [Google Scholar]
- Sun J, Paddock C, Shubert J, Zhang HB, Amin K, Newman PJ, Albelda SM. (2000) Contributions of the extracellular and cytoplasmic domains of platelet-endothelial cell adhesion molecule-1 (PECAM-1/CD31) in regulating cell-cell localization. J Cell Sci 113:1459–1469 [DOI] [PubMed] [Google Scholar]
- Takao Y, Fujiwara H, Yamada S, Hirano T, Maeda M, Fujii S, Ueda M. (1999) CD9 is expressed on the cell surface of human granulosa cells and associated with integrin alpha6beta1. Mol Hum Reprod 5:303–310 [DOI] [PubMed] [Google Scholar]
- Tian L, Catt JW, O'Neill C, King NJ. (1997) Expression of immunoglobulin superfamily cell adhesion molecules on murine embryonic stem cells. Biol Reprod 57:561–568 [DOI] [PubMed] [Google Scholar]
- Thomson JA, Itskovitz-Eldor J, Shapiro SS, Waknitz MA, Swiergiel JJ, Marshall VS, Jones JM. (1998) Embryonic stem cell lines derived from human blastocysts. Science 282:1145–1147 [DOI] [PubMed] [Google Scholar]
- Wahlberg JA, Southard JH, Belzer FO. (1986) Development of a cold storage solution for pancreas preservation. Cryobiology 23:477–482 [DOI] [PubMed] [Google Scholar]
- Williams RL, Hilton DJ, Pease S, Willson TA, Stewart CL, Gearing DP, Wagner EF, et al. (1988) Myeloid leukaemia inhibitory factor maintains the developmental potential of embryonic stem cells. Nature 336:684–687 [DOI] [PubMed] [Google Scholar]
