JAK1 Activates STAT3 Activity in Non-Small-Cell Lung Cancer cells and IL-6 Neutralizing Antibodies can Suppress JAK1-STAT3 Signaling (original) (raw)
. Author manuscript; available in PMC: 2014 Jul 7.
Abstract
Members of the signal transducer and activator of transcription (STAT) family of transcription factors are potential targets for the treatment and prevention of cancers including non-small-cell lung cancer. STAT proteins can be phosphorylated and activated by diverse upstream kinases including cytokine receptors and tyrosine kinases. We examined STAT protein activation in lung cancer cell lines including those with activating mutations in the EGFR and examined upstream kinases responsible for STAT3 phosphorylation and activation using small molecules, antibodies, and RNA interference. We found more pronounced STAT3 activation in cells with activating EGFR mutations yet inhibition of EGFR activity had no effect on STAT3 activation. Inhibition of JAK1 with small molecules or RNA interference resulted in loss of STAT3 tyrosine phosphorylation and inhibition of cell growth. An interleukin-6 neutralizing antibody, siltuximab (CNTO 328) could inhibit STAT3 tyrosine phosphorylation in a cell-dependent manner. Siltuximab could completely inhibit STAT3 tyrosine phosphorylation in H1650 cells and this resulted in inhibition of lung cancer cell growth in vivo. Combined EGFR inhibition with erlotinib and siltuximab resulted in dual inhibition of both tyrosine and serine STAT3 phosphorylation, more pronounced inhibition of STAT3 transcriptional activity, and translated into combined effects on lung cancer growth in a mouse model. Our results suggest that JAK1 is responsible for STAT3 activation in lung cancer cells, and that indirect attacks on JAK1-STAT3 using an IL-6 neutralizing antibody with or without EGFR inhibition can inhibit lung cancer growth in lung cancer subsets.
Introduction
Lung cancer continues to be the leading form of cancer death in both men and women in the United States with an estimated 166,280 deaths attributed to lung cancer in 2008 (1). Given the inherent insensitivity to cytotoxic agents, identifying molecules that drive lung cancer growth, survival, and metastasis is critical as is the development of novel therapeutics. Members of the signal transducer and activator of transcription (STAT) family of transcription factors are potential targets in lung cancer and other cancers (2). These proteins are activated by upstream tyrosine kinase signaling and control genes that regulate cancer hallmarks. Indirect or direct inhibition of STAT3 has been shown to affect tumor formation through inhibition of cell growth, induction of apoptosis, and/or inhibition of tumor angiogenesis. A number of recent studies have found activated STAT3 in lung cancer cell lines and tissues thus suggesting a functional role for this target in subsets of lung cancer (3-5).
One approach to targeting STAT3 is through direct approaches including decoy oligonucleotides, antisense or siRNA molecules, or small molecule inhibitors (6). A second approach would be to target the upstream kinases responsible for STAT3 activation. Identification of the kinase or kinases responsible for STAT3 in lung cancer has been unclear. In a previous study, we have shown that blocking the Src pathway with PD180970, a small molecule Src inhibitor, could decrease STAT3 activity and induce cell cycle arrest and apoptosis (7). However, our recent experience with dasatinib, another Src inhibitor, found no affect on tyrosine phosphorylated STAT3 (8). Other studies have similarly found no effects of dasatinib or other Src inhibitors on tyrosine phosphorylated STAT3 in lung cancer cells suggesting that the upstream regulation of STAT3 is more complex than originally appreciated (3, 9, 10). PD180970 has been reported to inhibit tyrosine phosphorylation of Janus kinase 1 (JAK1) and this offtarget effect of the compound could contribute to its effects on STAT3 (11). In addition to Src or JAK molecules, the epidermal growth factor receptor (EGFR) is also a candidate tyrosine kinase responsible for STAT3 activation. EGFR can directly phosphorylate STAT3 and activation of STAT3 has also been reported in lung cancer cell lines harboring activated EGFR mutations (3, 4, 9, 12, 13). Interestingly, inhibition of EGFR in these models has no demonstrable effects on STAT3 tyrosine phosphorylation. These results suggest that other tyrosine kinases could cooperate with mutant EGFR or act in an EGFR-independent manner to control STAT3 activity. In support of this idea, Gao et al. reported that IL-6 and JAK signaling regulates STAT3 activity in lung cancer cells with activating EGFR mutations through an autocrine mechanism (3). Our previous study found IL-6 to be a strong activator of STAT3 in lung cancer cells and along with its expression in lung cancer tumors suggests that this pathway could be responsible for constitutive STAT3 levels in tumor cells harboring activated EGFR (7, 14, 15).
In this study, we aimed to further investigate mechanisms of STAT3 activation in lung cancer cell lines. We examined cells with and without activating EGFR mutations and used small molecule inhibitors as well as RNA interference (RNAi) to examine signaling molecules responsible for STAT3 activation. We also examined effects of IL-6 pathway inhibition using either a IL-6 neutralizing antibody (Siltuximab, CNTO328) or RNAi in animal tumor models either alone or in conjunction with EGFR kinase inhibition.
Materials and Methods
Cell lines, cell culture, and inhibitors
Sources of cell lines are as previously described (16). All cells in the manuscript were obtained from ATCC with the following exceptions: H157, H1648, H2122, HCC2279 cells were obtained from Dr. John Minna (UTSW), HCC827 was obtained from Dr. Jon Kurie (MD Anderson), H322 and HCC4006 were obtained from Dr. Paul Bunn (U Colorado) and PC9 was obtained from Dr. Matt Lazarra (University of Pennsylvania, PA). All cell lines have been maintained in a central core at Moffitt since 2008. All cell lines have been authenticated by STR analysis (ACTG Inc Wheeling ) as of September 2010 and all cells are routinely tested and negative for mycoplasma (PlasmoTest, InvivoGen). K562 were obtained from ATCC and provided by Dr. Gary Reuther (Moffitt Cancer Center, Tampa, FL). Cells were cultured in RPMI 1640 (Invitrogen) with 10% BCS (Invitrogen) and 100 μg/mL streptomycin (Invitrogen). The pyridone 6 (JAK inhibitor I or P6), JAK2 inhibitor I (JAK2 I), and AG490, Cucurbitacins A, B, and I were obtained from EMD Chemicals (Gibbstown, NJ). Erlotinib was provided by OSI Pharma-ceuticals (Melville). Siltuximab (CNTO328) was produced by Centocor Inc (Malvern, PA). BE-8 was obtained from R&D system. Dasatinib was provided by Bristol-Myers Squibb (New Brunswick). All inhibitors were dissolved in DMSO and kept at −20 °C. Retroviral infection of HA-tagged EGFR isoforms was done as previously described (17).
Immunoprecipitation and western blot analysis
Cells were washed with ice cold PBS with 1 mmol/L sodium orthovanadate and lysed with RIPA buffer (SDS 0.1%, 50 mmol/L Tris-cl pH 7.4, 150 mmol/L NaCl, 1% NP40, 0.25% Na-deoxycholate, 1 mmol/L of Na3VO4, 1 mmol/L of PMSF, 1 mmol/L of DTT and protease inhibitor cocktail tablets). 1 mg of the sample protein extracts were diluted with IP buffer to 1 mL. (150 mmol/L NaCl, 50 mmol/L HEPES (pH 7.4), 0.1% Triton X-100, 0.5 mm DTT, 1 mmol/L sodium orthovanadate, 1 mm PMSF and 1X protease tablet buffer). 25 μL of protein beads A (Roche, Indianapolis) were added to the sample and rocked 30 minutes in 4 °C to preclear nonspecific interactions. JAK1 and JAK2 antibodies (Cell Signaling Technologies) (1 μg) were added to supernatants and incubated in 4 °C for 2 hours. After 2 hours, 25 μL of protein A beads were added to antibody mixture and continually rocked for additional 2 hours in 4 °C. Beads were briefly washed 3 times with IP buffer and eluted with 2 × Laemmli buffer via boiling. Eluted protein was applied to the 8% SDS-PAGE for immunoblots. The antiphosphotyrosine antibody, 4G10 (Millipore) was used to detect tyrosine phosphorylation of JAK1 and JAK2.
Immunblotting and DNA binding assays
Protein samples were directly collected from cells lysed with 1X SDS sample buffer (62.5 mmol/L Tris-HCl, pH 6.8, 2% w/v SDS, 10% glycerol, 50 mmol/L DTT, 0.01% w/v bromophenol blue) with protease inhibitor cocktail tablets (Roche). Normalized protein content (50 μg) was subjected to SDS-PAGE for western blot. STAT3 (C20), STAT5 (C17), JAK1 primary antibodies were obtained from Santa Cruz Biotechnology (Santa Cruz. PY-STAT3 (Tyr705), PS-STAT3 (Ser727), PY-STAT5 (Tyr694), JAK1, JAK2, TYK2, and PARP, primary antibodies were obtained from Cell Signaling Technologies (Cambridge). STAT DNA-binding assays [Electrophoretic Mobility Shift Assay (EMSA)] were done as described previously (7). Nuclear extracts (5–8 μg) were incubated with 32P-labeled hSIE oligonucleotide probe (5_-AGCTTCATTTCCCGTAAATCCCTA) or MGFe oligonucleotide probe (5_-AGATTTCTAGGAATTCAA), which can bind to STAT3, STAT1, and STAT5 proteins. Proteins were shifted by approximately 1–5 μg of STAT3 (C20), STAT5 (C17), or STAT1 (E23) antibody (Santa Cruz Biotechnology).
Cell viability, cell cycle, and apoptosis assays
Cell viability assays were done as previously described (8). For the cell counting experiments, 2 105cells were split × 5% BCS and into 6-cm dishes with RPMI 1640 with treated with drugs after 24 hours. For siRNA cell counting, transfected cells were split again in fresh medium after 24-hour transfection. For colony assays, 500 to 1000 transfected cells were split into 10-cm culture dishes with RPMI 1640 with 5% BCS. Culture medium was changed each week. The cell colony was stained with crystal violet mixture (2 g crystal violet, 50 mL of 95% ethanol, and 50 mL H2O) and counted by Alphalmager 3400 (Alpha Innotech). The colony numbers were normalized with the control siRNA group and expressed as means and SD. For cycle analysis, cells (1 × 10⁶) were grown in 6 dishes with RPMI 1640 with 5% BCS. After treatment with the inhibitors, cells were collected and fixed by 70% ethanol at 4 °C overnight and stained with propidium iodide (Roche) for 3 hours. DNA histograms were detected by flow cytometry, and percentages of G1, S, and G2 were quantified by Cell Quest Software. The caspase-3 antibody kit was obtained from BD Pharmingen (Franklin Lakes). After 24 or 48 hours of treatment with the inhibitors, 1 × 10⁶cells were collected and fixed with the solution buffer from kit and stained with the PE-conjugated monoclonal caspase-3 antibody. Percentage of apoptotic cells was detected by monoclonal antibody via flow cytometry.
Transfection experiments for siRNA and luciferase assays
The Lipofectamine RNAiMAX Transfection Reagent for siRNA transfection was obtained from Invitrogen (Carlsbad). SiRNAs were synthesized from Thermo Scientific (Dharmacon, Lafayette, CO). 2 × 10⁵of cells in and RNAi-suspension were transfected with siRNA and MAX complex in a 1:1 ratio and split to 12 dishes. Culture medium was changed 16 hours after transfection. For luciferase assays, 5 × 10⁵of H292 cells were grown in 6 × dishes and cotransfected with 400 ng of 7-mer luciferase promoter plasmids (containing 7 STAT DNA binding sites) and 50 ng of PGL3 (expressing renilla) with the Superfect (QIAGEN) in accordance to manufacturer’s instruction. Inhibitors were added to cells 24 hours after transfection. Cell lysates were collected, and luciferase analysis was conducted with the use of the Dual-Luciferase Reporter (DLR) Assay kit (Promega). The assay was done with the Turner BioSystems Veritas Microplate Luminometer, with results presented as means of SD and percent change normalized by control. 7-mer luciferase was provided by Dr. James Turkson (University of Central Florida), and pRL-CMV was obtained from Promega (Madison)(18).
Mouse tumor models
CD-1 female nude mice were obtained from Charles River (Wilmington). 5 × 10⁶of H292 and H1650 of 5 106 mixed with 100 μL of Matrigel (BD, Franklin Lakes) were injected subcutaneously (S.C.) and observed for approximately 10 to 14 days with tumor volume measurement. The treatment was initiated when tumor size was an average volume (50 mm3for H1650 and 200mm3for H292). Siltuximab diluted with PBS was given as 10 mg/kg twice a week by intraperitoneal (I.P.) injection. Erlotinib was diluted with 0.5% of hydroxypropylmethylcellulose (Sigma) and given as daily 50 mg/kg by oral gavage; control animals were equally received 0.5% (w/v) hydroxypropylmethylcellulose (Sigma) and I. P. injection with 100 μL of PBS as placebo. Tumor volume was calculated as tumor length (L) X width (W)2/2 and represented in mm3. The tumor volume and body weight were measured 2 or 3 times per week.
Luminex Bio-Plex assay
Cellular proteins were evaluated with Coomassie Protein Assay Reagent (Thermo scientific). All samples were run with triplicate following manufacturer’s instructions. Assays were done on a Luminex 100 (Luminex Corporation, 12212 Technology Blvd) and result was obtained by Masterplex QT (MiraBio Inc, Alameda). The raw data were normalized by protein concentration. The Bio-Plex Phospho-STAT3 (Tyr705) Assay (171-V22552) kit was obtained from Bio-Rad Laboratories (Hercules).
Statistical methods
For studies comparing siltuximab to control, the tumor measurements (in mm3) of the 12 mice were measured at 13 different time points. Log transformation with a base 10 was used to make tumor measurements approximately normal. For combination studies (erlotinib and siltuximab), tumor measurements (in mm3) for 24 mice treated with 4 different treatments (control, siltuximab, erlotinib, and combination of siltuximab & erlotinib) were measured at 8 different time points. Anderson-Darling statistics and normal curves were examined to see whether log-transformed tumor measurements at different days for different treatments were normally distributed. Descriptive statistics (# of observations, mean, median, standard deviation, minimum, and maximum) were calculated for tumor size at different days by different treatment groups. ANOVA test was used to see whether there was significant difference on tumor sizes measured at each time points. Tukey multiple comparisons were used to see whether tumor sizes measured after using (siltuximab plus erlotinib) as treatment were significantly different than those measured in nontreated (control group) or using siltuximab or erlotinib as treatment. All statistical analyses were done using SAS (version 9.1; SAS Institute).
Results
Expression and activation of STAT3 and STAT5 in NSCLC cell lines
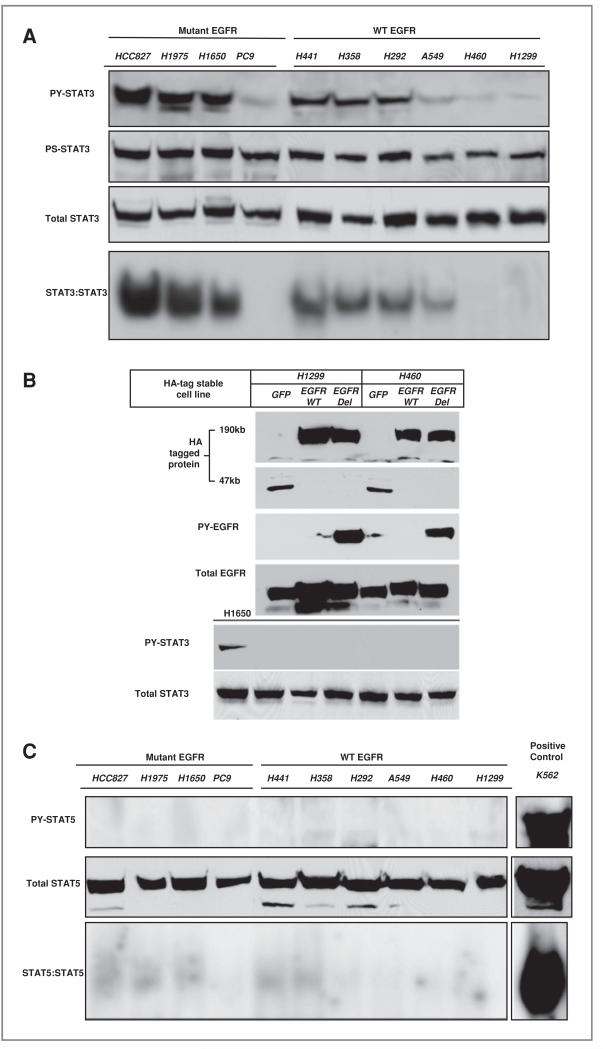
We selected 4 mutant EGFR NSCLC cell lines and 6 wild-type EGFR cell lines to examine activation of STAT proteins and examine dependence on upstream tyrosine kinases. The protein and nuclear extracts were collected for protein immunoblot and electrophoretic mobility shift assay (EMSA) analyses after cells reached approximately 80%–90% confluence. DNA binding activities were detected by EMSA with the 32P-labeled c-fos sis-inducible element (hSIE) probe (7). As shown in Figure 2A, the cell lines showed levels of tyrosine phosphorylated STAT3 (PY-STAT3) (Tyr705) that correlated with STAT3 DNA binding activities. Higher levels of activated STAT3 were found in cells harboring activating EGFR mutations with the exception being the PC9 cell. In cells not harboring activated EGFR mutations, STAT3 activity was present in the H441, H358, H292, and to a lesser extent the A549 cell. Serine phosphorylated STAT3 (Ser727) have shown fairly uniform expression across the cell lines. These results suggest that activating EGFR mutations may not directly regulate STAT3 tyrosine phosphorylation, since PC9 cells had undetectable STAT3 DNA binding activity. To examine this is some more detail, H460 and H1299 cells (that have low baseline STAT3 activity) were engineered to stably express mutant (del E746-A750) or wild-type EGFR and examined for STAT3 activity. Neither wild-type nor mutant EGFR could increase the levels of tyrosine phosphorylation of STAT3 in these cells (Fig. 2B). Thus, individual cell context and cellular factors likely contributes to the ability of mutant EGFR to activate STAT3.
Figure 2.
Preferential STAT3 activation in lung cancer cells A, STAT3 activity was assessed in indicated cell lines using anti-PY STAT3 antibody, anti-PS STAT3 antibody, total STAT3 antibody and STAT3 DNA binding activity (EMSA with the hSIE probe). Cell lines harboring activating EGFR mutations are indicated. B, protein lysates from H1299 and H460 expressing HA-tagged versions of GFP, wild-type (WT) or deletion (E746-A750) mutant EGFR were probed with indicated antibodies. C, STAT5 activity was assessed in indicated cell lines using anti-PY STAT5 antibody, total STAT5 antibody and STAT5 DNA binding activity by EMSA with the MGFe probe. Cell lines harboring activating EGFR mutations are indicated. The leukemia K562 cell line with constitutive activation of STAT5 is shown on far right.
We also examined patterns of STAT5 activation using antibodies that recognize Y694 on STAT5 as well as total STAT5 and conducted STAT5 DNA binding analysis using EMSA with mammary the gland factor element (MGFe) probe. As positive control, we ran extracts of K562 leukemia cells that have high levels of activated STAT5 and depend on STAT5 for survival (19). Surprisingly, we found little evidence for tyrosine phosphorylated STAT5 and similarly very low levels of STAT5 DNA binding activity (Fig. 2C). Conversely, K562 cells showed a strong activation of STAT5 by both immunoblot and EMSA analyses. These results suggest a preferential activation of STAT3 in these lung cancer cells.
JAK1 activates STAT3 in lung cancer cell lines
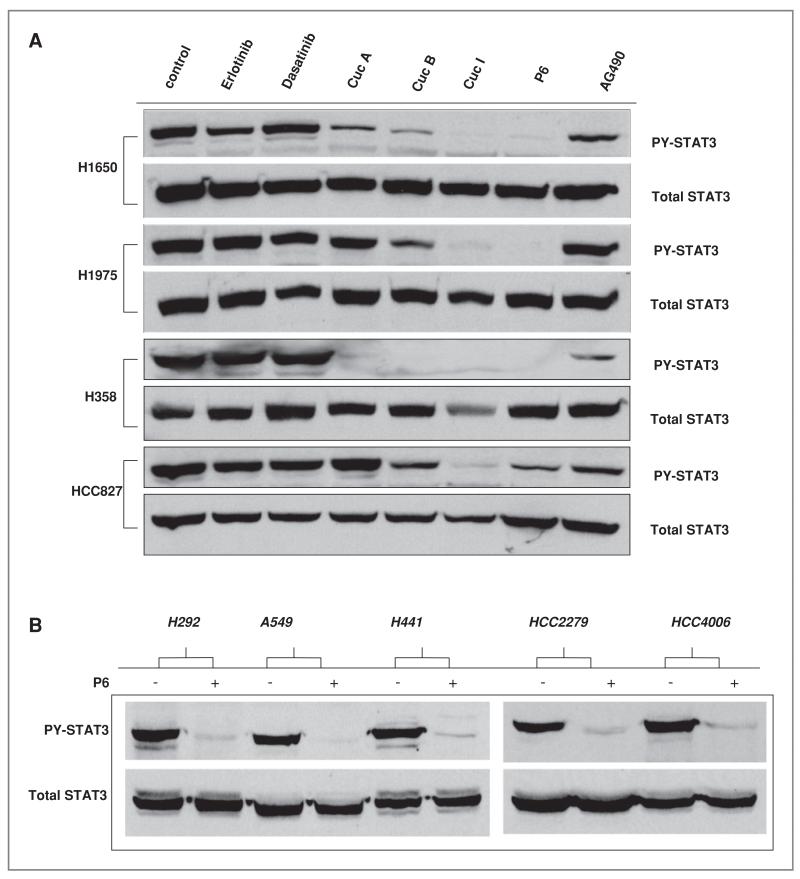
To define upstream kinases that are responsible for activation of STAT3 in lung cancer cells, we used a combination of small molecule inhibitors and RNA interference. These results are shown in Figure 3. Lung cancer cell lines were treated with different inhibitors against upstream tyrosine kinases including erlotinib (EGFR inhibitor), dasatinib (Src inhibitor), and multiple JAK inhibitors (cucurbitacin (Cuc) analogs, pyridone 6 (P6), and AG490 (20). As shown in Figure 3A, no changes in PY-STAT3 were observed in cells treated with erlotinib or dasatinib suggesting that STAT3 activation is regulated independently of the Src and EGFR signaling pathways. Treatment with cucurbitacin analogs or P6 strongly suppressed PY-STAT3 activation levels without affecting total STAT3 levels (Fig. 3A). AG490, an inhibitor with preferential activity against JAK2 kinase, had little effects on PY-STAT3. To confirm the generalized ability of P6 to suppress PY-STAT3 in NSCLC cells, we conducted experiments in other cell lines to test this inhibitor. As shown in Figure 3B, P6 strongly inhibited PY-STAT3 in these 5 cell lines.
Figure 3.
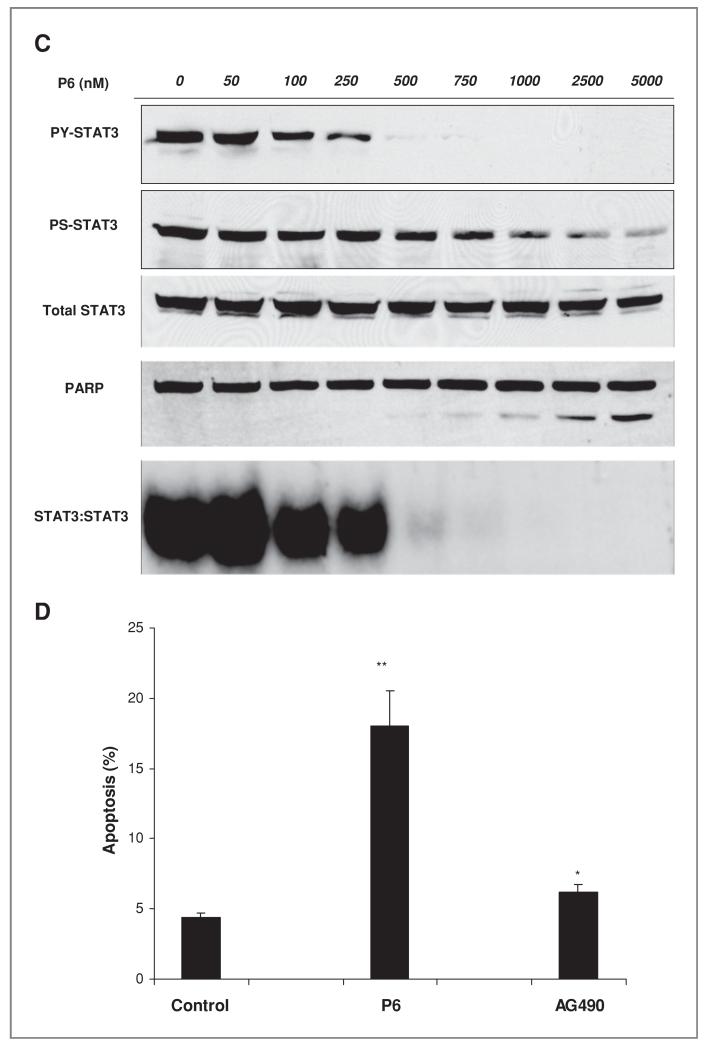
Effects of JAK inhibitors affect on STAT3 activity and cellular viability A, indicated cell lines were treated with inhibitors for 24 hours after which STAT3 activity was detected by PY-STAT3 immunoblots along with total STAT3 to assess loading. Concentrations were: 1 μmol/L of erlotinib, 1 μmol/L of Dasatinib, 10 μmol/L cucurbitacins A, B, and I, 5 umol/L of P6 and 50 umol/L of AG490. B, indicated cells were exposed to 2.5 umol/L of P6 for 3 hours followed by immunoblot of PY-STAT3 and total STAT3. C, H1975 cell were exposed to indicated concentrations of P6 for 24 hours followed by assessment of STAT3 activity with PY-STAT3, PS-STAT3, and STAT3 DNA binding ability. PARP cleavage was assessed as assay for apoptosis. D,H1975wereexposedto5umol/L ofP6and50umol/LofAG490for24 hours after which the cells were collected for caspase-3 assay for apoptosis. Y-axis indicates percent of cells scoring positive for caspase-3. The _P_-value indicate drug-treated group comparison with controls (*, _P_-value < 0.05, **, _P_-value < 0.01,***, _P_-value < 0.005).
We examined the effect of JAK/STAT3 pathway inhibition in more detail using P6 to block phosphorylation of JAK family. H1975, a gefitinib-resistant EGFR mutant (L858R and T790M) cell line, was exposed to increasing concentrations of P6 for 24hours, after which whole cell lysates and nuclear extracts were collected for immunoblot analysis and EMSA analysis, respectively (21). As shown in Figure 3C, PY-STAT3 is inhibited starting at a dose of 500 nmol/L without inhibition of total STAT3 protein levels. STAT3 DNA binding activity (via EMSA) and immunoblot results showed similar results of PY-STAT3 again confirming that STAT3 DNA binding activity is dependent on PY-STAT3 activation. By increasing the concentration of P6, the immunoblot data showed that PS-STAT3 inhibition was modestly decreased but not completely inhibited even at a high dose of 5 μmol/L. We also noticed the increased appearance of cleaved PARP, which correlates with decreased PY-STAT3. These results suggest that increased apoptosis is induced by decreased STAT3 activation. As shown in Figure 3D, P6-treated cells showed a significantly increased amount of apoptosis compared with the control group. The JAK2 kinase inhibitor AG490 showed a lower degree of apoptosis compared with that shown in control consistent with the minimal changes in STAT3 activation observed.
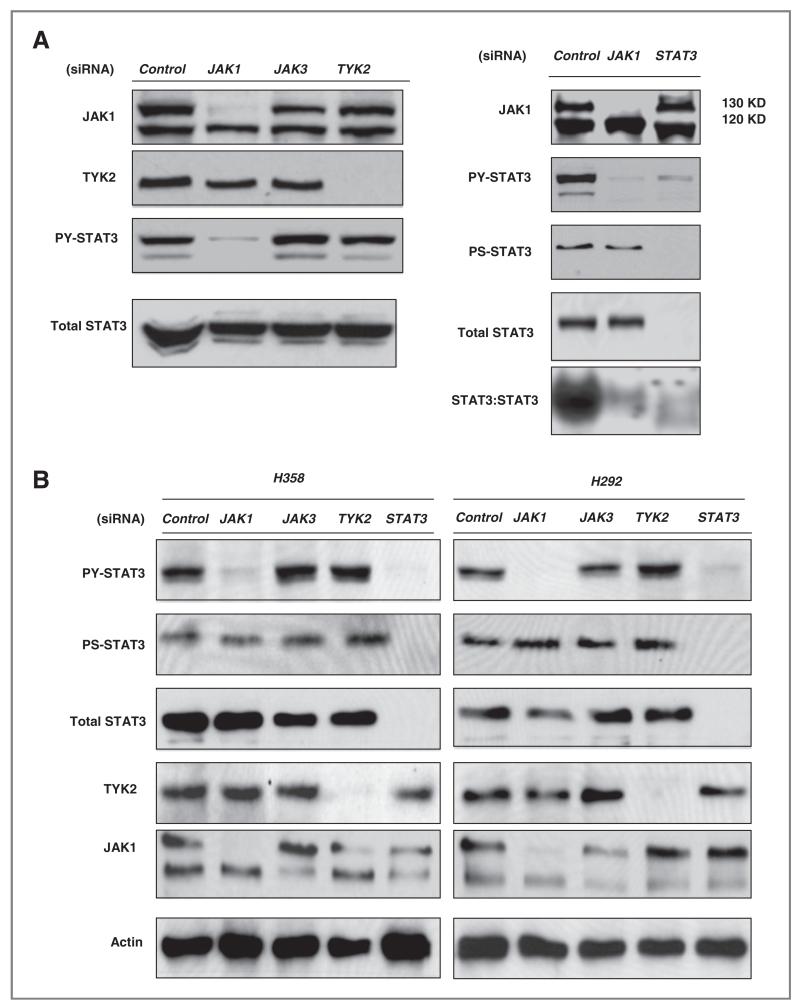
As small molecule kinase inhibitors can have offtarget effects, we examined the effect of short interfering RNA (siRNA) molecule against JAK family members. H1975 cells were transfected with pools of control, JAK1, JAK3, and TYK2 siRNA for 72 hours. The initial experiments did not exam JAK2 given the negative results in Figure 3 as well as other reports also suggesting a minimal/absent role of JAK2 (9). As shown in Figure 4A transfected siRNA efficiently reduced protein levels of JAK1 and TYK2. JAK3 protein was undetectable in our lung cancer cells but JAK3 siRNA was used nonetheless as an additional control. Only cells transfected with siRNA against JAK1 showed significant suppression of PY-STAT3 without changes in total STAT3 proteins. Cells transfected with siRNA against JAK3 and TYK2 had no effect on PY-STAT3 compared with control siRNA. JAK1 siRNA had no effect on serine phosphorylated STAT3 or total STAT3 protein, and strongly inhibited STAT3 DNA binding (Fig. 4A). These data strongly suggest that JAK1 kinase can direct regulate STAT3 activity by inhibition of PY-STAT3 without interruption of phosphorylated serine STAT3. We observed similar findings in 2 other lung cancer cells H292 and H358 cells (Fig. 4B). Only JAK1 siRNA-inhibited PY-STAT3 whereas no siRNA against JAK members interrupted serine phosphorylated STAT3 levels in either of the 2 cell lines. Transfected TYK2 and JAK3 siRNA had no effect on STAT3 activation. We validated our negative JAK2 TKI data by transfecting JAK2 siRNA into H1975, H292, and H358 cells (Fig. 4C). Consistent with our inhibitor results, we found minimal affect on PY-STAT3 levels, again arguing against JAK2 as the driver of STAT3 tyrosine phosphorylation in lung cancer cells. Combining the results of the small molecule JAK inhibitors and RNAi results, we conclude that JAK1 is responsible for tyrosine phosphorylation and activation of STAT3 DNA binding activity.
Figure 4.
Effects of siRNA against individual JAK members on STAT3 activity and cellular viability. A, Left Panel: H1975 cells were transfected with 20 nmol/L of control, JAK1, JAK3, and TYK2 siRNA for 72 hours. Cell proteins were collected for immunoblot analysis. Right Panel: After 72-hour transfection of H1975 cells with 20 nmol/L siRNA of JAK1 and STAT3, total cellular protein and nuclear extracts were collected for immunoblots and EMSA (hSIE probe), respectively. B, H358 and H292 cells were transfected with JAK1, JAK3, TYK2, and STAT3 siRNA (20 nmol/L) for 72 hours. Proteins were examined for levels of pY STAT3, pS STAT3, total STAT3, TYK2, and JAK1. C, H1975, H358 and H292 cells were transfected with JAK2 siRNA (20 nmol/L) for 72 hours. Proteins were examined for levels of pY STAT3 and total STAT3. D, indicated cell lines were exposed to 2.5 μmol/L of P6 for 96-hour after which cell viability was assessed. Bar graph shows mean of the fold change compared with control (untreated cells). Results show differences in cell viability when exposed to P6. Mutant EGFR cells with activating EGFR mutation, WT = wild-type EGFR. STAT3 activity in WT cells show above. E, indicated cells were transfected with 50 nmol/L of control and JAK1 siRNA followed by assessment of cell number (5 days) and colony formation (2–3 weeks). Bar graph shows percentage of cell number normalized with control. The _P_-value indicate comparison with controls (*, _P_-value < 0.05, **, _P_-value < 0.01, ***, _P_-value < 0.005).
To determine the effects of JAK1 inhibition on cell growth, small molecule inhibitor or RNAi molecules targeting JAK1 were examined. Viability of cells exposed to P6 was next examined in 11 cell lines including H1975, HCC827, PC9, and H4006 (mutant EGFR cells lines) and H441, H292, H157, H358, H322, A549, and H1299 (wild-type EGFR cell lines). We selected a dose of 2.5 μmol/L based on EMSA results that showed completed inhibition of STAT3 DNA binding activity at that concentration (Fig. 3C). Among the cells with activating EGFR mutations, only H1975 cells had decreased viability with P6 (Fig. 4D). This suggests that STAT3 may not be a main driver of growth or survival in these particular cells in cell culture. In the cells with wild-type EGFR, cells with more abundant STAT3 activation (H441, H358, and H292) had decreased viability with P6.
As P6 could have effects on other kinases, we used JAK siRNA to examine effects on cell growth. Six cell lines (HCC827, H292, H1975, PC9, A549, and H358) were transfected with JAK1 siRNA and examined for effects using colony assay and cell count assays (Fig. 4E). H292 cells showed the strongest effect of JAK1 knockdown in both assays followed by H1975 and A549 cells. Minimal effects were seen in HCC827 cells and no effects were seen in PC9 cells devoid of activated STAT3. These data suggest that inhibition of JAK1 using siRNA can affect cellular growth although different tumor cell lines show differences in response.
Effects of IL-6 neutralization antibodies on STAT3 phosphorylation
Our above results support the model whereby JAK1 regulates tyrosine phosphorylation and DNA binding activity of STAT3. We next considered which receptor tyrosine kinase or cytokine receptor could be upstream of JAK1-STAT3 signaling. Although high levels of activated STAT3 occur in cells with activating mutation of EGFR, we did not believe that STAT3 activity is driven directly by EGFR kinase activity. First, PC9 cells that have activating EGFR mutation did not exhibit STAT3 activity (Fig. 2A). Second, inhibition of EGFR with erlotinib had no effect on STAT3 activity (Fig. 3A). Third, forced expression of activated EGFR in H1299 and H460 cells had no effect on activated STAT3 (Fig. 2B) (22). These data suggest that the activated STAT3 pathway may be independent of the EGFR signaling pathway and determined by signaling events upstream of JAK1. Given these results, our previous results with STAT3 activation by IL-6, the known cooperation with JAK1 and IL-6 receptors, and recent studies suggesting IL-6 driven STAT3 in lung cancer, we further investigated IL-6 as an upstream regulator of JAK1 and STAT3 in lung cancer cells (3, 7, 23, 24).
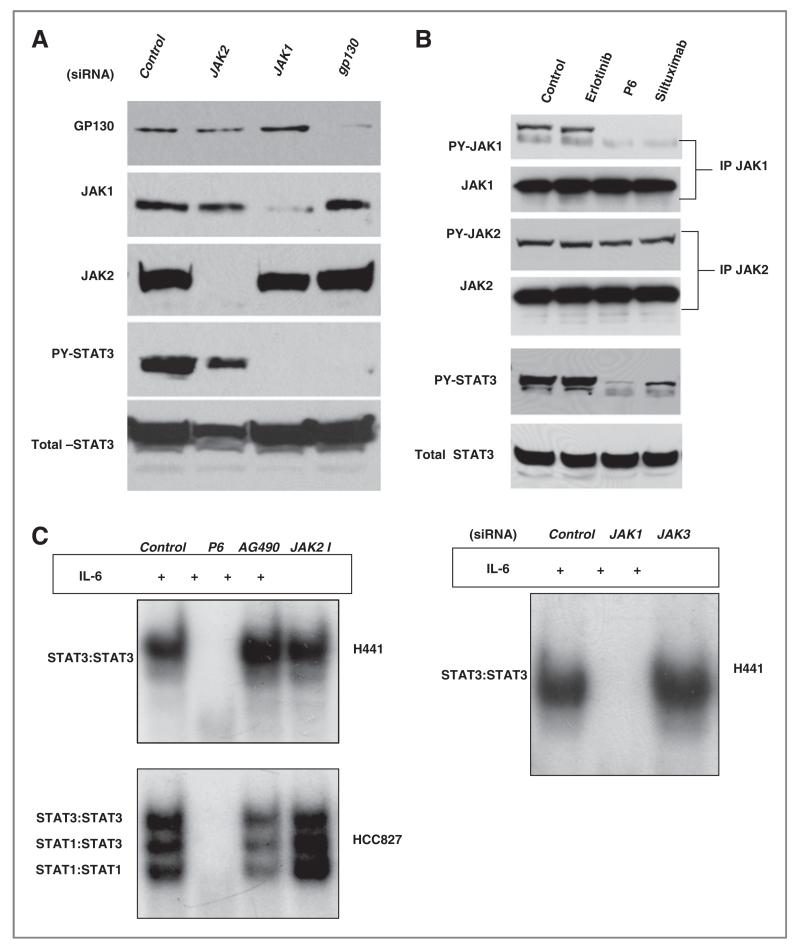
We used siRNA against gp130 (the common IL-6 receptor GP130), JAK1, and JAK2 and examined effects on STAT3 activation (Fig. 5A). Knockdown of both gp130 and JAK1 led to inhibition of PY-STAT3 whereas JAK2 had minimal effects. Next, we examined the tyrosine phosphorylation status of JAK1 and JAK2 following treatment with erlotinib, P6, and siltuximab, an IL-6 neutralizing antibody (25). As shown in Figure 5B, basal JAK1 and STAT3 tyrosine phosphorylation were blocked by both siltuximab and P6 whereas no changes were observed with erlotinib. None of the compounds had any effect on JAK2 tyrosine phosphorylation. We also treated H441 and HCC827 with 1 μmol/L of P6 (or other JAK inhibitors) for 3 hours then stimulated the cells with 10 ng/mL of IL-6. As shown in Figure 5C, IL-6-induced STAT3 activation in both cells was blocked by P6 but not by JAK2 inhibitors. JAK1 siRNA completely blocked STAT3 activation by IL-6. Collectively, these results strongly suggest that JAK1 is the critical JAK kinase contributing to activation of STAT3 and IL-6 signaling uses JAK1 to activate STAT3 in lung cancer cells.
Figure 5.
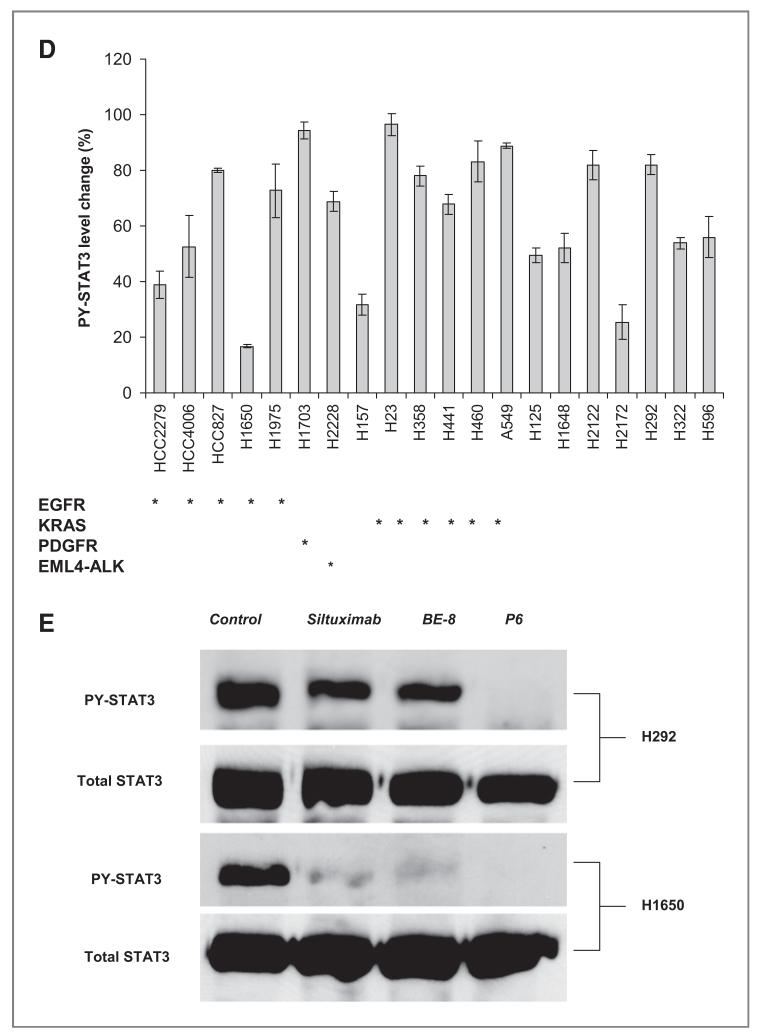
Effects of neutralizing IL-6 antibodies on STAT3 activation A, H1650 cells were transfected with 20 nmol/L of control, JAK2, JAK1, or gp130 siRNA for 72 hours. Total proteins were collected and immunoblots for GP130, JAK1, JAK2, and PY-STAT3 were done. B, H1650 cells were treated with 1 umol/L erlotinib or 2.5 umol/L of P6 for 3 hours or 20ug/mL siltuximab for 16 hours. JAK1 or JAK2 was immunoprecipitated and examined for both total and tyrosine phosphorylation of both JAK1 and JAK2 proteins. Cellular lysates were also examined for both PY-STAT3 and total STAT3. C, H441 were exposed to P6 (2.5 umol/L), JAK2 (50 umol/L) inhibitor or AG490 (50 umol/L) for 3 hours, stimulated with IL-6 (10 ng/mL) for 20 minutes, and STAT activity assessed by EMSA with hSIE probe. Also, H441 cells were transfected with 20 nmol/L siRNA against control, JAK1, and JAK3 for 72 hours, stimulated with IL-6 (10 ng/mL) for 20 minutes, and STAT3 activity assessed by EMSA with hSIE probe. D, indicated cell lines were exposed to 20 ug/mL of siltuximab for 16 hours or control (PBS). Tyrosine phosphorylated STAT3 was measured by Luminex. Bar graphs show PY-STAT3 levels normalized by control (PBS) for each cell line. EGFR activating EGFR mutation; PDGFR PDGFR amplification; EML4-ALK = fusion of ELM4 and ALK. KRAS K-RAS mutation; E, H292 and H1650 cells were exposed to 20 ug/mL of siltuximab or BE-8 (anti-IL6 antibody) for 16 hours or 2.5 umol/L of P6 for 3 hours after which Y705 and total STAT3 were assessed with western blotting.
To examine if STAT3 activity in lung cancer cells was solely dependent on upstream IL-6 signaling, we measured the effects of siltuximab on tyrosine phosphorylation of STAT3 in a larger set of lung cancer cell lines using Luminex assays of Y705 STAT3. As shown in Figure 5D, minimal changes in STAT3 were observed in more than half of the cells by blocking IL-6. We also noticed that EGFR mutant cell lines have shown minimal changes in PY-STAT3 by blocking of IL-6. The one exception was the H1650 cell that was previously shown to be dependent on IL-6 signaling (3). We confirmed results of this screen using western blots in select cells (H292 and H1650). As shown in the Figure 5F, PY-STAT3 was nearly completely suppressed in H1650 whereas H292 have shown more modest effects. Moreover, H358, H292, and H441 showed incomplete effects on STAT3 activation following depletion of gp130 with siRNA (data not shown). These results suggest that in most lung cancer cells, STAT3 may be activated by multiple and parallel factors upstream of JAK1.
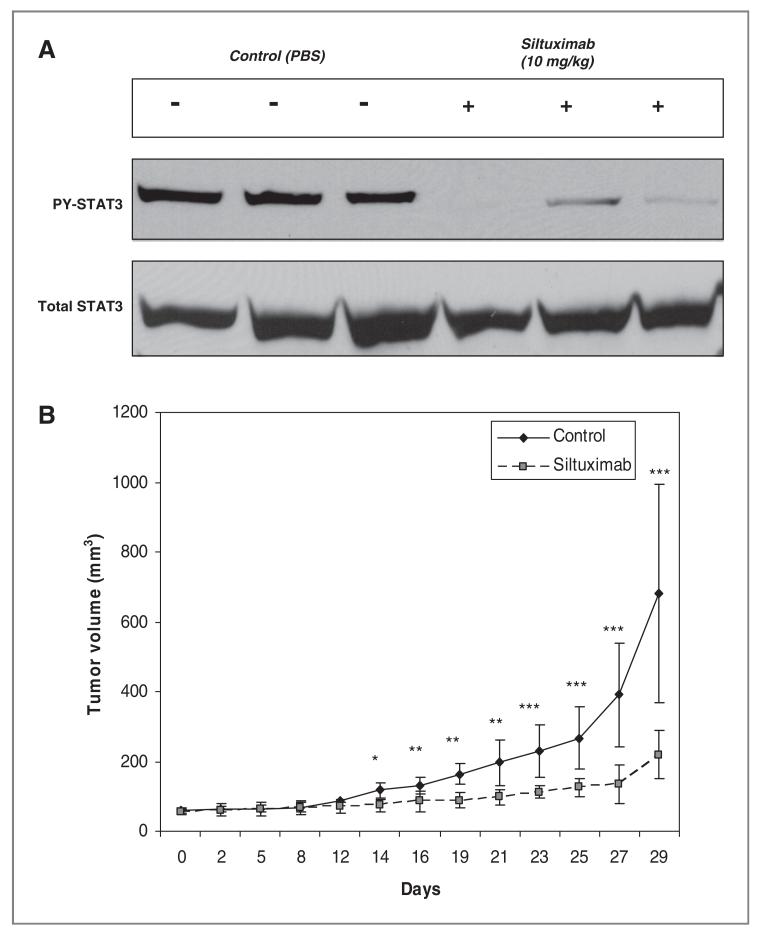
As H1650 showed strong effects of IL-6 blockade with siltuximab, we next examined the in vivo effects of siltuximab in murine tumor models. H1650 xenografts were established and treated with either siltuximab or PBS as control. As shown in Figure 6, siltuximab strongly suppressed PY-STAT3 activation in vivo and inhibited tumor growth. These data strongly suggested that, blockage of the IL-6 can inhibit STAT3 activated and repress tumor growth in vivo in select tumor cells.
Figure 6.
Neutralizing IL-6 antibodies inhibit STAT3 activation and tumor growth in vivo A, three pairs of CD-1 nu/nu mice with H1650 xenografts were administered 10 mg/kg of Siltuximab 3 times for 10 days after which mice were euthanatized and tumor proteins collected to evaluate PY-STAT3 and total STAT3 changes. The control group was treated identically but given vehicle injections only (PBS). B, mice bearing established H1650 xenografts were exposed to 10mg/kg of Siltuximab every 2 to 3 days and tumor growth measured. The control group was treated identically but given vehicle injections only (PBS). The _P_-value indicate comparison with controls (*, _P_-value < 0.05, **, _P_-value < 0.01, ***, _P_-value < 0.005).
Combined inhibition of EGFR and IL-6 signaling represses tumor growth
Our studies suggest that only a fraction of lung cancer cells have strict dependence of STAT3 activation on upstream IL-6 and gp130 signaling. Thus, for effective STAT3 inhibition, one approach would be to identify the other proteins that signal through JAK1 to activate STAT3. A second approach is to attack serine phosphorylation of STAT3 in combination with IL-6 neutralization, which by itself has partial effects on tyrosine phosphorylation and activation. Serine phosphorylation of STAT3 is also known to be affected by MEK signaling and provides a boost in transcriptional activity of STAT3 (26-28). We hypothesized that inhibiting both tyrosine and serine phosphorylation of STAT3 using 2 parallel upstream inhibitors could result in more pronounced STAT3 functional inhibition and inhibition of cell growth.
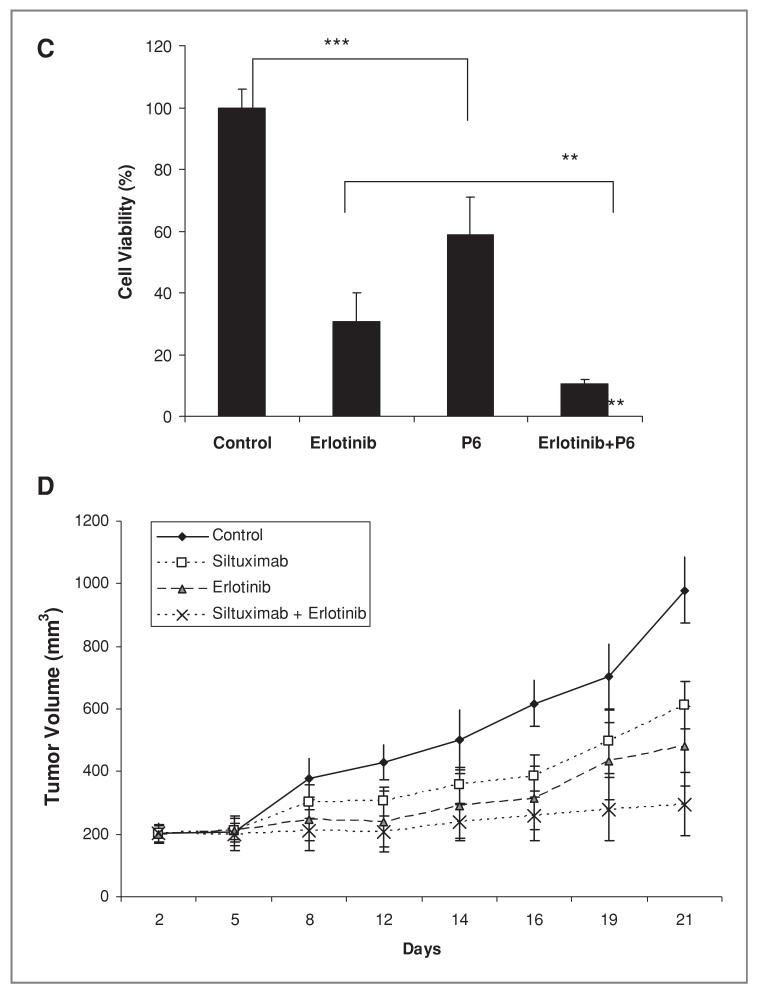
We chose to study erlotinib as a potential inhibitor of serine phosphorylation on STAT3 based on its use in lung cancer, the ability of EGFR to signaling to MEK pathways, and observations in our lab suggesting that erlotinib can inhibit phosphorylated ERK, a MEK substrate, in some lung cancer cells (data not shown). We examined effects of erlotinib and siltuximab on tyrosine and serine phosphorylation of STAT3, STAT3 in H292 cells transcriptional activity, and cell growth. (Fig. 7). P6 inhibited PY-STAT3 but not PS-STAT3 whereas the EGFR inhibitor erlotinib inhibited only PS-STAT3. However, the 2 drugs combined resulted in inhibition of both PY-STAT3 and PS-STAT3 (Fig. 7A). Each inhibitor partly inhibited STAT3 transcriptional activity, whereas combining the 2 inhibitors increased the effect on suppressing STAT3 transcriptional activity (Fig. 7B). Consistent with the effects on STAT3 phosphorylation and transcriptional activity, erlotinib or P6 alone partially inhibited cell proliferation whereas combining the 2 pathway inhibitors significantly reduced cell proliferation (Fig. 7C).
Figure 7.
Effects of EGFR inhibition and IL-6 /JAK1/STAT3 blockade on STAT3 activity and tumor growth A, H292 cells were treated with 500 nmol/L P6 and 1 umol/L of Erlotinib for 3 hours after which protein was collected for immunoblot analyses with antibodies against PY-STAT3, PS-STAT3, and total STAT3. B, H292 cells were transfected with STAT reporter construct (Luciferase 7-MER) and pRL-CMV (expressing renilla) for 24 hours and after treated with 100 nmol/L erlotinib and 500 nmol/L P6 for 24 and 48 hours. The cell lysates were collected and assayed for luciferase and renilla activity. Bar graph shows normalized luciferase activity as mean and SD of percentage to the control. The _P_-value indicate controls comparison with erlotinib and P6, and combination comparison with P6 (*, _P_-value < 0.05, **, _P_-value < 0.01, ***, _P_-value < 0.005). C, H292 cells were treated with 100nmol/L of erlotinib, 0.5 umol/L of P6 or the combination (erlotinib plus P6) in triplicate and cell number was assessed after 5 days. Bar graphs show mean and SD (of triplicate experiments) represented as a percentage normalized with control. The _P_-value indicate P6 comparison with controls and erlotinib comparison with combination group (*, _P_-value < 0.05, **, _P_-value < 0.01, ***, _P_-value < 0.005). D, mice bearing established H292 xenografts were exposed to 10mg/kg of siltuximab every 2 to 3 days, erlotinib 50 mg/kg daily, or the combination. Tumor growth was assessed every 2 to 3 days. The control group was treated identically but given vehicle injections only (PBS).
We next examined the effects of siltuximab and erlotinib on tumor growth in vivo. We selected H292 cells, as these cells have partial effects in vitro on STAT3 using siltuximab and also have been reported to be sensitive in vivo to erlotinib (29). Mice with established tumors were exposed to vehicle control, siltuximab, erlotinib, or the combination of siltuximab and erlotinib. As show in Figure 7D, the combination group has shown statistically significant difference between erlotinib and combination group. Treatment with combined siltuximab and erlotinib had statistically significant effect on tumor size reduction in comparison to control group (P < 0.0001), siltuximab-treated group (P < 0.0001), and erlotinib treated group (P < 0.006). These data support a combination strategy that inhibits PY-STAT3 via blocking of IL-6 and inhibits PS-STAT3 with EGFR inhibitor.
Discussion
We believe our results help to clarify the role of upstream tyrosine kinase pathways that regulate STAT3 activity in lung cancer cells and suggest targeting approaches for turning off STAT3 activity in lung cancer. Multiple studies from independent groups find evidence for STAT3 activation in nearly 50% of lung cancers (3-5). Thus, inhibition of STAT3 in this group of lung cancer patients could have important therapeutic effects by inhibiting known STAT3 -related pathways including cell proliferation, survival, and angiogenesis.
Despite the finding that activating EGFR mutations are associated with higher levels of activated STAT3, our results and those of others suggests this is not largely a direct effect of increased kinase activity and direct phosphorylation of Y705 on STAT3. Our results presented here in cells with EGFR mutation show that inhibition of EGFR with EGFR TKI has no effect on tyrosine phosphorylated STAT3. Similar results have been presented by other groups using either mass spectrometry methods or methods similar to our own (9, 30). We were surprised that PC9 cells that harbor activated EGFR have essentially absent STAT3 activity measured either by immunoblot or DNA binding assay. Similarly, H1299 or H460 cells expressing an activating mutant of EGFR did not show increase in activation of STAT3. Our results also suggest that while activating mutations of EGFR may enhance IL-6 production and autocrine stimulation of STAT3 activity, additional cellular factors are important in modulating this pathway and the response of cells to IL6.
Our results suggest that STAT3 activity in lung cancer cells is regulated by IL-6 in conjunction with JAK1 activity. Lung cancer cells that have constitutive STAT3 activity can be stimulated with IL-6 to enhance STAT3 levels and conversely antibodies against IL-6 can inhibit STAT3 activation in cells with or without activating EGFR mutations. Use of siRNA reagents finds consistent inhibition of STAT3 activation with siRNA directly only against JAK1 instead of the other JAK family members. These results are consistent with other studies showing that JAK kinase overexpression (absent of mutation) can lead to cell transformation (31). Our studies do not rule out important effects of other JAK members in regulating other pathways independent of STAT3. In addition to finding no effect of EGFR TKI on activated STAT3, we also found no changes with the Src TKI dasatinib in multiple lung cancer cells. In cells with activated STAT3, blockage of STAT3 activation with either small molecule JAK inhibitors or siRNA against JAK1 could inhibit cell proliferation and in some cases induce apoptosis. Despite high levels of STAT3 activity in mutant EGFR lung cancer cells, the effect of STAT3 inhibition was minimal in these cells and suggests that other pathways, such as PI3K/Akt, could be stronger determinants of cell survival in these cells. Consistent with the known effects of IL-6 on JAK1 signaling, we also found inhibition of cell proliferation with an antibody against IL-6 (23, 24). Through combined inhibition of both EGFR signaling and IL-6 /JAK1/STAT3 signaling pathways, reducing of both serine and tyrosine phosphorylated STAT3, further reductions in STAT3 transcriptional activity and on cellular proliferation. Our results are also important in light of a recent paper showing the ability of IL6 to foster resistance to EGFR inhibitors (32).
These collective results suggest a strategy to inhibit STAT3 activity in lung cancer cells through either IL-6 inhibition or use of small molecule inhibitors against JAK1. Antibodies directed against IL-6 are currently available for use in humans, and preliminary experience shows safety of the approach (33). Autocrine production of IL-6 may also influence other oncogenic pathways besides STAT3 (34). Our results suggest that small subsets of tumors may have tumor growth dependent on IL-6 signaling, and combining IL-6 antibodies with other signaling pathway inhibitors may be important. Recent studies have found STAT3 inhibition using a JAK1 and JAK2 inhibitor (35). This could be ideal to inhibit STAT3 activity based on our results using small molecules and siRNA showing consistent inhibition of STAT3 tyrosine phosphorylation and DNA binding activity. However, unpublished data from our lab suggest that JAK1 loss may also blunt the effects of IFN-γ on STAT1 activity. This could have important negative consequences by preventing the known tumor suppressor activity of this pathway and also by resulting in immune suppression (36). It will be important to further examine JAK1 inhibitors in follow up studies in animal tumor models and in clinical trials for patients with lung cancer. It will also be important to identify other molecules that activate STAT3 using JAK1.
In conclusion, our results suggest that JAK1 rather than EGFR or Src signaling is responsible for STAT3 activation in lung cancer cells. In subsets of lung cancer tumors that have constitutive STAT3 activity, our results would suggest that either direct JAK1 inhibition or indirect inhibition by eliminating IL-6 signaling could be useful therapeutic strategies to eliminate STAT3 activity in tumor cells. Loss of STAT3 activity in lung cancer cells resulted in reduced cell proliferation and apoptosis and combined EGFR and STAT3 loss additional antitumor effects. Further studies of STAT3 pathway inhibition are warranted with neutralizing IL-6 antibodies in animal tumor models and potentially early phase clinical trials for patients with lung cancer whose tumors have constitutive STAT3 activation. Given that nearly 50% of lung cancer tumors have evidence of STAT3 activation, the number of patients who could benefit from such an approach is quite large and warrants further studies.
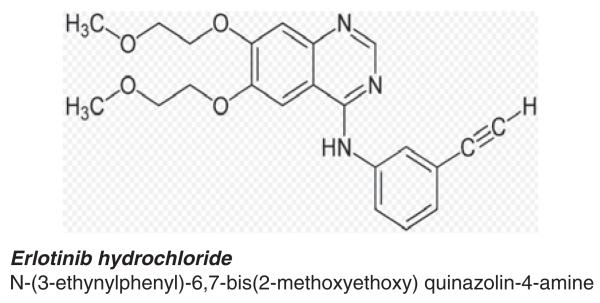
Figure 1.
Erlotinib hydrochloride N-(3-ethynylphenyl)-6,7-bis(2-methoxyethoxy) quinazolin-4-amine
Acknowledgments
We thank Patricia Johnston for administrative assistance. We also thank Rasa Hamilton for editorial assistance. The work was funded by NCI 1R01 CA121182–01A1 and supported in part by the Small Animal Imaging Core and the Flow Cytometry Core at the H. Lee Moffitt Cancer Center & Research Institute (Tampa, FL) and by Centocor Ortho Biotech Oncology Research & Development, Radnor, PA 19087
Grant Support
This work was funded by NIH/NCI Grant #1R01 CA121182–01A1 and supported in part by Centocor Ortho Biotech Oncology Research & Development, Radnor, PA. J.A.N. is an employee of Centocor otherwise no potential conflict of interest is noted by any of the authors.
Footnotes
Disclosure of Potential Conflicts of Interest
E. Haura received a commercial research grant from Centocor to support some of this work.
References
- 1.Jemal A, Siegel R, Ward E, et al. Cancer statistics, 2008. CA Cancer J Clin. 2008;58:71–96. doi: 10.3322/CA.2007.0010. [DOI] [PubMed] [Google Scholar]
- 2.Yu H, Jove R. The STATs of cancer-new molecular targets come of age. Nat Rev Cancer. 2004;4:97–105. doi: 10.1038/nrc1275. [DOI] [PubMed] [Google Scholar]
- 3.Gao SP, Mark KG, Leslie K, Pao W, Motoi N, Gerald WL, et al. Mutations in the EGFR kinase domain mediate STAT3 activation via IL-6 production in human lung adenocarcinomas. J Clin Invest. 2007;117:3846–56. doi: 10.1172/JCI31871. [DOI] [PMC free article] [PubMed] [Google Scholar]
- 4.Haura EB, Zheng Z, Song L, Cantor A, Bepler G. Activated epidermal growth factor receptor-Stat-3 signaling promotes tumor survival In vivo in non-small cell lung cancer. Clin Cancer Res. 2005;11:8288–94. doi: 10.1158/1078-0432.CCR-05-0827. [DOI] [PubMed] [Google Scholar]
- 5.Cortas T, Eisenberg R, Fu P, Kern J, Patrick L, Dowlati A. Activation state EGFR and STAT-3 as prognostic markers in resected non-small cell lung cancer. Lung Cancer. 2007;55:349–55. doi: 10.1016/j.lungcan.2006.11.003. [DOI] [PubMed] [Google Scholar]
- 6.Haura EB, Turkson J, Jove R. Mechanisms of disease: insights into the emerging role of signal transducers and activators of transcription in cancer. Nat Clin Pract Oncol. 2005;2:315–24. doi: 10.1038/ncponc0195. [DOI] [PubMed] [Google Scholar]
- 7.Song L, Turkson J, Karras JG, Jove R, Haura EB. Activation of Stat3 by receptor tyrosine kinases and cytokines regulates survival in human non-small cell carcinoma cells. Oncogene. 2003;22:4150–65. doi: 10.1038/sj.onc.1206479. [DOI] [PubMed] [Google Scholar]
- 8.Song L, Morris M, Bagui T, Lee FY, Jove R, Haura EB. Dasatinib (BMS-354825) selectively induces apoptosis in lung cancer cells dependent on epidermal growth factor receptor signaling for survival. Cancer Res. 2006;66:5542–8. doi: 10.1158/0008-5472.CAN-05-4620. [DOI] [PubMed] [Google Scholar]
- 9.Alvarez JV, Greulich H, Sellers WR, Meyerson M, Frank DA. Signal transducer and activator of transcription 3 is required for the oncogenic effects of non-small-cell lung cancer-associated mutations of the epidermal growth factor receptor. Cancer Res. 2006;66:3162–8. doi: 10.1158/0008-5472.CAN-05-3757. [DOI] [PubMed] [Google Scholar]
- 10.Johnson FM, Saigal B, Tran H, Donato NJ. Abrogation of signal transducer and activator of transcription 3 reactivation after Src kinase inhibition results in synergistic antitumor effects. Clin Cancer Res. 2007;13:4233–44. doi: 10.1158/1078-0432.CCR-06-2981. [DOI] [PubMed] [Google Scholar]
- 11.Nam S, Buettner R, Turkson J, Kim D, Cheng JQ, Muehlbeyer S, et al. Indirubin derivatives inhibit Stat3 signaling and induce apoptosis in human cancer cells. Proc Natl Acad Sci U S A. 2005;102:5998–6003. doi: 10.1073/pnas.0409467102. [DOI] [PMC free article] [PubMed] [Google Scholar]
- 12.Park OK, Schaefer TS, Nathans D. In vitro activation of Stat3 by epidermal growth factor receptor kinase. Proc Natl Acad Sci U S A. 1996;93:13704–8. doi: 10.1073/pnas.93.24.13704. [DOI] [PMC free article] [PubMed] [Google Scholar]
- 13.Greulich H, Chen TH, Feng W, et al. Oncogenic Transformation by Inhibitor-Sensitive and -Resistant EGFR Mutants. PLoS Med. 2005;2:e313. doi: 10.1371/journal.pmed.0020313. [DOI] [PMC free article] [PubMed] [Google Scholar]
- 14.Haura EB, Livingston S, Coppola D. Autocrine interleukin-6/interleukin-6 receptor stimulation in non-small-cell lung cancer. Clin Lung Cancer. 2006;7:273–5. doi: 10.3816/CLC.2006.n.006. [DOI] [PubMed] [Google Scholar]
- 15.Yeh HH, Lai WW, Chen HH, Liu HS, Su WC. Autocrine IL-6-induced Stat3 activation contributes to the pathogenesis of lung adenocarcinoma and malignant pleural effusion. Oncogene. 2006;25:4300–9. doi: 10.1038/sj.onc.1209464. [DOI] [PubMed] [Google Scholar]
- 16.Li J, Rix U, Fang B, Bai Y, Edwards A, Colinge J, et al. A chemical and phosphoproteomic characterization of dasatinib action in lung cancer. Nat Chem Biol. 6:291–9. doi: 10.1038/nchembio.332. [DOI] [PMC free article] [PubMed] [Google Scholar]
- 17.Haura EB, Muller A, Breitwieser FP, Li J, Grebien F, Colinge J, et al. Using iTRAQ combined with tandem affinity purification to enhance low-abundance proteins associated with somatically mutated EGFR core complexes in lung cancer. J Proteome Res. doi: 10.1021/pr100863f. [DOI] [PMC free article] [PubMed] [Google Scholar]
- 18.Turkson J, Bowman T, Garcia R, Caldenhoven E, De Groot RP, Jove R. Stat3 activation by Src induces specific gene regulation and is required for cell transformation. Mol Cell Biol. 1998;18:2545–52. doi: 10.1128/mcb.18.5.2545. [DOI] [PMC free article] [PubMed] [Google Scholar]
- 19.Dorsey JF, Jove R, Kraker AJ, Wu J. The pyrido[2,3-d]pyrimidine derivative PD180970 inhibits p210Bcr-Abl tyrosine kinase and induces apoptosis of K562 leukemic cells. Cancer Res. 2000;60:3127–31. [PubMed] [Google Scholar]
- 20.Sun J, Blaskovich MA, Jove R, Livingston SK, Coppola D, Sebti SM. Cucurbitacin Q: a selective STAT3 activation inhibitor with potent antitumor activity. Oncogene. 2005 doi: 10.1038/sj.onc.1208470. [DOI] [PubMed] [Google Scholar]
- 21.Pao W, Miller VA, Politi KA, et al. Acquired resistance of lung adenocarcinomas to gefitinib or erlotinib is associated with a second mutation in the EGFR kinase domain. PLoS Med. 2005;2:1–11. doi: 10.1371/journal.pmed.0020073. [DOI] [PMC free article] [PubMed] [Google Scholar]
- 22.Fujimoto N, Wislez M, Zhang J, Iwanaga K, Dackor J, Hanna AE, et al. High expression of ErbB family members and their ligands in lung adenocarcinomas that are sensitive to inhibition of epidermal growth factor receptor. Cancer Res. 2005;65 doi: 10.1158/0008-5472.CAN-05-1977. [DOI] [PubMed] [Google Scholar]
- 23.Heinrich PC, Behrmann I, Muller-Newen G, Schaper F, Graeve L. Interleukin-6-type cytokine signalling through the gp130/Jak/STAT pathway. Biochem J. 1998;334(Pt 2):297–314. doi: 10.1042/bj3340297. [DOI] [PMC free article] [PubMed] [Google Scholar]
- 24.Murray PJ. The JAK-STAT signaling pathway: input and output integration. J Immunol. 2007;178:2623–9. doi: 10.4049/jimmunol.178.5.2623. [DOI] [PubMed] [Google Scholar]
- 25.Wallner L, Dai J, Escara-Wilke J, Zhang J, Yao Z, Lu Y, et al. Inhibition of interleukin-6 with CNTO328, an anti-interleukin-6 monoclonal antibody, inhibits conversion of androgen-dependent prostate cancer to an androgen-independent phenotype in orchiectomized mice. Cancer Res. 2006;66:3087–95. doi: 10.1158/0008-5472.CAN-05-3447. [DOI] [PubMed] [Google Scholar]
- 26.Turkson J, Bowman T, Adnane J, Zhang Y, Djeu JY, Sekharam M, et al. Requirement for Ras/Rac1-mediated p38 and c-Jun N-terminal kinase signaling in Stat3 transcriptional activity induced by the Src oncoprotein. Mol Cell Biol. 1999;19:7519–28. doi: 10.1128/mcb.19.11.7519. [DOI] [PMC free article] [PubMed] [Google Scholar]
- 27.Wen Z, Darnell JE., Jr. Mapping of Stat3 serine phosphorylation to a single residue (727) and evidence that serine phosphorylation has no influence on DNA binding of Stat1 and Stat3. Nucleic Acids Res. 1997;25 doi: 10.1093/nar/25.11.2062. [DOI] [PMC free article] [PubMed] [Google Scholar]
- 28.Wen Z, Zhong Z, Darnell JE., Jr. Maximal activation of transcription by Stat1 and Stat3 requires both tyrosine and serine phosphorylation. Cell. 1995;82 doi: 10.1016/0092-8674(95)90311-9. [DOI] [PubMed] [Google Scholar]
- 29.Thomson S, Buck E, Petti F, Griffin G, Brown E, Ramnarine N, et al. Epithelial to mesenchymal transition is a determinant of sensitivity of non-small-cell lung carcinoma cell lines and xenografts to epidermal growth factor receptor inhibition. Cancer Res. 2005;65:9455–62. doi: 10.1158/0008-5472.CAN-05-1058. [DOI] [PubMed] [Google Scholar]
- 30.Guo A, Villen J, Kornhauser J, Lee KA, Stokes MP, Rikova K, et al. Signaling networks assembled by oncogenic EGFR and c-Met. Proc Natl Acad Sci U S A. 2008;105:692–7. doi: 10.1073/pnas.0707270105. [DOI] [PMC free article] [PubMed] [Google Scholar]
- 31.Knoops L, Hornakova T, Royer Y, Constantinescu SN, Renauld JC. JAK kinases overexpression promotes in vitro cell transformation. Oncogene. 2008;27:1511–9. doi: 10.1038/sj.onc.1210800. [DOI] [PubMed] [Google Scholar]
- 32.Yao Z, Fenoglio S, Gao DC, Camiolo M, Stiles B, Lindsted T, et al. TGF-beta IL-6 axis mediates selective and adaptive mechanisms of resistance to molecular targeted therapy in lung cancer. Proc Natl Acad Sci U S A. 107:15535–40. doi: 10.1073/pnas.1009472107. [DOI] [PMC free article] [PubMed] [Google Scholar]
- 33.Trikha M, Corringham R, Klein B, Rossi JF. Targeted anti-interleukin-6 monoclonal antibody therapy for cancer: a review of the rationale and clinical evidence. Clin Cancer Res. 2003;9:4653–65. [PMC free article] [PubMed] [Google Scholar]
- 34.Grivennikov S, Karin M. Autocrine IL-6 signaling: a key event in tumorigenesis? Cancer Cell. 2008;13:7–9. doi: 10.1016/j.ccr.2007.12.020. [DOI] [PubMed] [Google Scholar]
- 35.Hedvat M, Huszar D, Herrmann A, Gozgit JM, Schroeder A, Sheehy A, et al. The JAK2 inhibitor AZD1480 potently blocks Stat3 signaling and oncogenesis in solid tumors. Cancer Cell. 2009;16:487–97. doi: 10.1016/j.ccr.2009.10.015. [DOI] [PMC free article] [PubMed] [Google Scholar]
- 36.Kaplan DH, Shankaran V, Dighe AS, Stockert E, Aguet M, Old LJ, et al. Demonstration of an interferon gamma-dependent tumor surveillance system in immunocompetent mice. Proc Natl Acad Sci U S A. 1998;95:7556–61. doi: 10.1073/pnas.95.13.7556. [DOI] [PMC free article] [PubMed] [Google Scholar]
