Red and processed meat consumption and the risk of lung cancer: a dose-response meta-analysis of 33 published studies (original) (raw)
. 2014 Jun 15;7(6):1542–1553.
Abstract
This meta-analysis was to summarize the published studies about the association between red/processed meat consumption and the risk of lung cancer. 5 databases were systematically reviewed, and random-effect model was used to pool the study results and to assess dose-response relationships. Results shown that six cohort studies and twenty eight case-control studies were included in this meat-analysis. The pooled Risk Radios (RR) for total red meat and processed meat were 1.44 (95% CI, 1.29-1.61) and 1.23 (95% CI, 1.10-1.37), respectively. Dose-response analysis revealed that for every increment of 120 grams red meat per day the risk of lung cancer increases 35% and for every increment of 50 grams red meat per day the risk of lung cancer increases 20%. The present dose-response meta-analysis suggested that both red and processed meat consumption showed a positive effect on lung cancer risk.
Keywords: Lung cancer, red meat, processed meat, meta-analysis
Introduction
Lung cancer is a leading cause of death in China and the other countries [1]. Up to now, smoking is considered as the only undisputed primary risk factor for lung cancer. It can attribute approximately 85% incidence of lung cancer [2]. However, smoking cannot explain the high incidence of lung cancer in females. Studies on lung cancer in women suggested that other factors including the dietary factors should be noticed, which could act as independent risk factors or as modifiers on lung cancer [3,4]. Since the mortality of this disease remains high and most patients live less than one year after diagnosis, identification of additional risk factors will be very helpful for prevention and early detection of lung cancer.
In the past two decades, numerous experimental and epidemiological studies have shown that red and/or processed meat consumption might be related to the incidence of lung cancer [5-9]. Most the published literatures found a positive relationship between meat consumption and lung cancer. For example, Linseisen [5] found that red meat was directly related to men who had never or ever smokers. In the study by Balder [7], processed meat was found to increase about 15% risk of lung cancer. However, some authors hold controversial opinions, Tasevska [10] found neither red meat nor processed meat consumption had an association with lung cancer, and the same conclusion were supported by Lim [11]. In addition, World Cancer Research Funder (WCRF) in 2007 reported that the existing evidence was not enough to conclude an association between red and/or processed meat intake and the risk of lung cancer [2]. Even for recent publications, controversies still exist.
A primary meta-analysis has been available on meat consumption and lung cancer risk [12]. It included 11 cohort studies and 23 case-controls. The pooled results found that it was red meat rather than processed meat that played a positive effect on lung cancer. However, the dose-response relationship essential for proving causality is still unknown. Considering several literatures about meat intake and lung cancer risk have published recently, we conducted the present systematic and quantitative dose-response meta-analysis to explore the relationship between red and processed meat consumption and the risk of lung cancer. Besides, we aim to expand upon the scientific evidence for red and processed meat consumption in different geographic and histologic subtypes of lung cancer.
Methods
Literature search and selection
A systematic literature search was performed from their inception until June 31, 2013. The database included PubMed, Embase, Web of science, the National Knowledge Infrastructure and Wanfang Database. The key words were as follows: 1) lung cancer or lung tumor or lung neoplasm or lung carcinoma; 2) dietary or food or red meat or beef or pork or lamb or processed meat or preserved meat or bacon or sausage or salted meat. In order to obtain all relevant studies, we scrutinized the reference lists of the published articles to identify additional relevant studies. The included criteria were: 1) the type of included studies were designed in cohort or case-control; 2) the exposure factors were red meat and/or processed meat; 3) the outcomes were the incidence or mortality of lung cancer; and 4) Relative Risk (RR) or Odds Ratios (OR) with 95% confidence interval (CI) were provided.
Data extraction
The information was extracted by two investigators independently. The extracted information included: the first author’s name, publication year, average or range of population ages, study design (cohort or case-control), country, sample size, the followed-up years (only for cohort studies), histologic subtypes, RR or OR with 95% CI for comparisons between the highest and lowest categories of meat intakes as well as the confounders taken into account.
Statistical analysis
The synthetic RR and 95% CI were calculated via fixed or random-effect model for the comparison between the highest versus the lowest category for red and/or processed meat. The model selection was depended on the outcome of heterogeneity text between studies. If moderate or lower heterogeneity (I2 < 50%) was found, we chose the fixed effect model (FEM) as the pooling method, otherwise the random effect model (REM), which considers both within-study and between-study variations, was adopted (I2 > 50%). The heterogeneity was detected by I2 test used by Higgins and Thompson [13]. Subgroup analysis was performed to investigate the influences by study design and other factors. The subgroups included: study design (cohort or case-control), source of controls for case-control studies (population-based or hospital-based), and countries where the study was performed.
When possible, a linear dose-response analysis of red meat and processed meat was conducted. The generalized least-squares trend estimation (GLST) proposed by Greenland and Orsini [14,15] was used to pool the correlated RR estimates on the basis of categories of consumption. This method required the number of cases, the number of control subjects or person-years, and the adjusted OR or RR with 95% CI at least three exposure levels. As the included studies used different consumption units, such as grams or servings, we converted the intake dose stated “times” or “servings” into grams (g). We used 120 g as the average serving size for red meat and 50 g for processed meat. The median or mean level for each category was used to assign each corresponding RR estimate. If the mean or median intake categories were reported in articles, we use them directly. If the value was unavailable, the midpoints were used as the relative risk of the corresponding category. For studies with unrestricted lowest and highest category, we employed zero consumption as the low boundary and the amplitude of the nearest category was used for the highest category. The methods for rescaling have been used in previous dose-response meta-analysis [16-18]. All the analyses were conducted using Stata 12 software (Stata Corp LP, College Station, TX, USA).
Results
Literature search
Based on a systematic review of the databases, a total of 466 articles were obtained. After screening the titles and abstracts, 421 irrelevant articles were excluded, leaving 45 studies for full papers. After reading the full papers in detail, 14 were excluded. Besides, we reviewed previous meta-analysis and 2 additional studies were identified [19,20]. Finally a total of 33 studies were included in this present dose-response meta-analysis [1,4,5,8,10,11,15,19-44]. The Flow chart of studies selection was shown in Figure 1.
Figure 1.
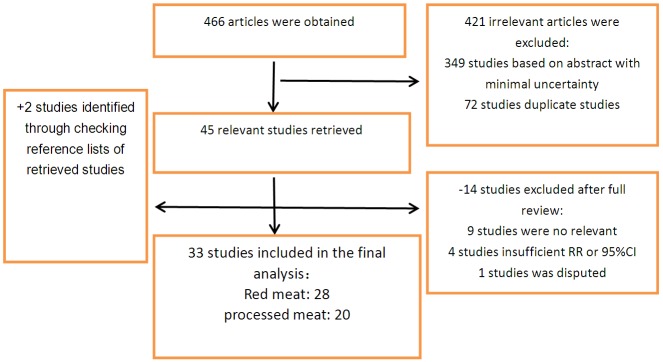
Flow chart for literature research.
Characteristics of studies
Characteristics of the 33 observed studies were shown in Table 1. 27 studies were designed in case-control [1,4,8,11,15,20,21,24-42,44] and 6 in cohort [5,10,19,22,23,43,45]. 7 studies were conducted in Uruguaya [21,25-29,46], 8 in Europe [5,15,19,30,31,36,37,44], 5 in Asia [11,32,38,39,41], 9 in the United States [1,8,10,22,23,33,40,42,43], 3 in Canada [4,34,35] and 1 in Australia [20]. The study population in 19 [5,10,19,21-23,25-27,29-35,38,41,43] studies included both men and women, 4 studies included only man [20,24,28,40] and 9 included only women [1,4,8,11,15,36,37,39,44]. 5 studies didn’t give the estimated risk adjusted for smoking [4,10,15,19,43] and 3 without age adjust [19,20,41]. In 3 studies [27-29], the history of lung disease and family history were also adjusted.
Table 1.
Summary of included studies
| Age (year) | Source of control | Intake comparison | Red meat | Processed meat | ||
|---|---|---|---|---|---|---|
| 20-70 | population-based | highest vs lowest | Red meat: 1.4 (0.7-2.8) | Sausage: 0.7 (0.2-2.5) Bacon: 1.5 (0.9-2.5) | age, province, education, social class and total energy intake | |
| 40-84 | population-based | > 9.8 vs < 3.5 (T/W) | Red meat: 3.3 (1.7-7.6) | age, education, pack-years, smoking history, fruits/fruit juices intake, nutrient-density calories, previous lung disease, alcohol consumption, and BMI (for red meat); Age, nutrient density calories (for white meat) | ||
| 23-89 | hospital-based | 250-600 vs < 150 (g/day) (Red) 250-525 vs < 150 (g/day) (Beef) 40-259 vs 0-10 (g/day) (Processed) | Red meat: 2.17 (1.52-3.10) Beef: 1.67 (1.17-2.39) | Processed meat: 1.70 (1.28-2.25) | age, sex, residence, education, income, interviewer, smoking status, cigarettes per day, duration of smoking, age at starting, years since quitting, alcohol, dairy foods, grains, fatty foods, mate drinking, BMI and energy intake | yes |
| NM | NHIS study | > 2.0 vs < 0.5 (Beef) > 1.0 vs < 0.02 (Pork) > 1.1 vs 0 (Bacon/Sausage) | Red meats: 1.6 (1.0-2.6) | Processed meats: 0.8 (0.5-1.4) | age, gender, smoking duration (years), and packs per day smoked | Meat/poultry/®sh |
| 50-71 | (NIH)-AARP study | highest quintile vs lowest | Red meat: 1.20 (1.10-1.31) | Processed meat: 1.16 (1.06-1.26) | age, sex, education, marital status, family history of cancer, race, BMI, smoking, energy, alcohol, and fruit and vegetable intake | |
| 30-89 | hospital-based | high vs low | Red meat: 1.92 (1.27-2.90) | Processed meat: 0.83 (0.55-1.26) | age, residence, urban/rural status, education, body mass index, tobacco smoking, and total energy intake. | |
| 62.5/62.7 | hospital-based | 4th vs 1st quartile | Red meat: 1.25 (0.78-1.99) Beef: 1.11 (0.77-1.61) Lamb: 1.24 (0.81-1.89) Fried meat: 1.54 (1.01-2.35) | Processed meat: 1.19 (0.75-1.89) Sausage: 1.05 (0.69-1.59) Salted meat: 1.19 (0.68-2.09) | age, residence, education, family history of lung cancer, BMI, alpha-carotene, smoking, total energy intake | White meat Poultry: Fish |
| 30-89 | hospital-based | > 9.1 vs < 5 (S/W) (Red) > 4.6 vs < 1.1 (S/W) (Processed ) | Red meat: 2.33 (1.63-3.32) | Processed meat: 1.79 (1.22-2.65) | age, residence, education, family history of lung cancer, BMI, smoking total energy intake, total vegetables and fruits, reduced glutathione, and nonmeat fatty foods intakes | white meat |
| 30-89 | hospital-based | > 1.8 vs < 0 (S/W)(Salted red meat) > 3.8 vs < 1 (S/W) (Fried red meat) | Salted meat: 2.90 (1.99-4.25) | age, residence, hospital, education, family history of lung cancer, BMI, smoking, alcohol drinking, mate amount, total fruits, total energy intake, non-meat fatty foods, and each meat type preparation | yes | |
| 62.1/59.4 | hospital-based | > 28.3 vs 11.4 (g/day) | processed meat: 2.54 (1.12-5.79) | age, residence, body mass index, smoking status, smoking, alcohol drinking, total energy, total vegetables and fruits, total white meat, and red meat intake | ||
| 30-79 | hospital-based | 4th vs 1th | Red meat: 1.55 (0.88-2.74) | 0.85 (0.47-1.56) | age, residence, education, family history of lung cancer, BMI, pack-years, total energy intake | yes |
| ≥ 35 | hospital-based | > 2 vs < 1 (T/W) | Pork: 0.36 (0.18-0.69) Beef: 1.89 (0.94-3.82) | sex, age, smoking habit and having worked in risk occupations for lung cancer | ||
| 35-90 | hospital-based | > 4 vs < 1 (T/W) | Red meat: 1.00 ( 0.55-1.83) | sex, age, smoking habit, interaction sex, smoking, and residence | White meat Fish | |
| 56.2/46.5 | hospital-based | Ever vs never | Red meat: 6.1 (4.3-8.5) | smoking, alcohol, coffee and milk consumption, chilli consumption, exposure to pesticides | chicken, fish | |
| 50 ≥ 65 | COSMOS screening study | Q4 vs Q1 | Red meat: 1.73 (1.15-2.61) | baseline risk probability and total energy, fruits and vegetables | ||
| 20-70 | population-based | > 5.42 vs < 0.94 | Processed meat: 1.4 (1.1-1.7) | age, province, education, body mass index sex, alcohol drinking, smoking, total vegetable and fruit intake, and total energy intake | ||
| 62/60 | hospital-based | Daily vs Never or monthly | Sausages: 0.99 (0.61-1.62) | age and region | ||
| 25-89 | hospital-based | Daily vs Never or monthly | Red meat: 1.40 (0.94-2.08) | age, residence, education, and pack-years of smoking | ||
| 25-89 | hospital-based | at least once/week vs never | Red meat: 1.53 (0.94-2.48) | age, residence, education, and pack-years of smoking | Poultry, Fish | |
| 35-79 | population-based | Red meat: 1.8 (1.5-2.2) | Processed meat: 1.7 (1.4-2.1) | age, gender, area of residence, education, BMI, alcohol, smoking intensity in pack-year per day | ||
| 63.5/66 | hospital-based | 3rd tertile vs 1st tertile 2nd tertile vs 1st tertile (Bacon) | Pork: 1.15 (0.80-1.64) | Processed meat: 0.83 (0.55-1.25) Bacon: 1.51 (1.06-2.16) Sausages: 1.00 (0.69, 1.43) | for age, history of cancer in first-degree relative, country of origin, dwelling type, yr of education, usual body mass index, and fruit and vegetable intake (only for meat variables) | Yes |
| 44-75 | hospital-based | > 7 (T/W) vs < 3 (T/W) | Red meat: 0.71 (0.43-1.18) | education, age, cooking oil fume, use of fume extractor, and ETS. | Yes | |
| 25-70 | EPIC study | ≥ 80 vs <9 (g/day) | Red meat: 1.19 (0.94-1.50) | 0.92 (0.73-1.17) | sex, center, age, smoking, body weight and height, energy intake, intake of alcohol, fruits and vegetables, physical activity, education | |
| 63/61 | population-based | Tertile 3 vs Tertile 1 | Red meat: 0.9 (0.5-1.9) | age, ethnicity, and smoking | Fish, Poultry | |
| 67.3/66.5 | hospital-based | high vs low | Beef: 0.86 (0.37-2.00) Lamb: 0.74 (0.28-1.93) | smoking | Poultry | |
| 53 | population-based | Frequently vs Rarely | Preserved meats: 0.5 (0.35-0.71) | age, sex, literacy, lung cancer in first-degree relatives, hours spent at home per day, non-malignant lung disease history, coal mine work history, ever smoking, passive smoking, coal type at birth, food. | ||
| 30-84 | population-based | 90th percentile vs 10th | Red meat: 1.8 (1.2-2.7) | age, fat intake, calories, smoking, BMI, fruit and vegetable intake as continuous variables, education, other meat variables | White meat | |
| 35-84 | population-based | > 11.9 vs < 4.2 (T/W) | Red meat: 1.89 (1.2-3.0) | adjusted for age, total kcal, education, pack-years of smoking, body mass index (kg/m2), fruit and vegetable intake | Yes | |
| 50-71 | NIH-AARP Diet | 5th vs 1th | Red meat: M 1.22 (1.09-1.38) W: 1.13 (0.97-1.32) | Processed meat: M 1.23 (1.10-1.37) W: 1.00 (0.87-1.15) | age, energy intake | |
| 55-74 | PLCO Cancer Screening Trial | 5th vs 1th | Red meat: M 1.11 (0.79-1.56) W: 1.30 (0.87-1.95) | Processed meat M: 1.52 (1.13-2.03) W: 0.98 (0.68-1.41) | for age and energy intake | |
| 25-89 | hospital-based | Daily vs Never or monthly | Red meat: 1.21 ( 0.68 -2.15)(Adenocarcinoma) Red meat: 1.81 (1.04-3.18) (other type) | |||
| 30-84 | population-based | Q4 vs Q1 | Beef: 0.9 (0.5-1.4) Pork: 1.4 (0.9-2.2) | Bacon: 2.9 (1.8-4.6) Sausage: 3.4 (2.0-6.0) | age, ethnicity, smoking status, pack-years of cigarette use, and beta-carotene intake | |
| 20-76 | population-based | Q4 vs Q1 | Red meat: 1.3 (1.1-1.5) | Processed meat: 1.4 (1.1-1.7) | age, province, education, body mass index, sex, alcohol use, smoking, total of vegetable and fruit intake, total energy intake |
Red meat (highest vs lowest category) (Figure 2)
Figure 2.

Forest plot for red meat. M: Man; W: Woman; A: Adenocarcinoma; S: Squamous carcinoma.
28 studies [1,4,5,10,11,19-24,26,27,29-34,36-40,42-44] were used to examine the relationship between red meat consumption and the risk of lung cancer. The pooled outcome indicated that red meat played a positive effect on lung cancer incidence with a pooled RR was 1.44 (95% CI, 1.29-1.61). However, a significant heterogeneity was found in case-control studies with I2 was 77% (p = 0.000). Subgroup analysis based on countries revealed that the highest red meat consumption showed a stronger effect in Asia than all the other countries (P for heterogeneity = 0.000). Positive relationships of comparable strengths were found in all subgroups including gender, source of control population and countries (Table 2).
Table 2.
Subgroup analysis of red meat and processed meat
| Meat type | Pooled effect (RR, 95% CI) | P for heterogeneity | No. of studies |
|---|---|---|---|
| total red meat | 1.44 (1.29, 1.61) | p = 0.000 | 28 |
| By meat type | |||
| Red meat | 1.55 (1.35, 1.77) | p = 0.000 | 24 |
| Beef | 1.39 (1.14, 1.69) | p = 0.433 | 6 |
| Lamb | 1.25 (0.97, 1.61) | p = 0.489 | 4 |
| Pork | 1.10 (0.70, 1.73) | p = 0.001 | 5 |
| By study type | |||
| Cohort studies | 1.21 (1.14, 1.28) | p = 0.712 | 6 |
| Population-based CC | 1.70 (1.36, 2.11) | p = 0.001 | 9 |
| Hospital-based CC | 1.37 (1.10, 1.72) | p = 0.000 | 15 |
| By areas | |||
| The US | 1.30 (1.17, 1.44) | p = 0.057 | 8 |
| Europe | 1.30 (1.05, 1.61) | p = 0.002 | 9 |
| Asia | 2.16 (0.76, 6.19) | p = 0.000 | 4 |
| Uruguay | 1.58 (1.34, 1.86) | p = 0.089 | 4 |
| Canada | 1.30 (1.12, 1.52) | p = 0.838 | 2 |
| By genders | |||
| Both | 1.54 (1.30, 1.83) | p = 0.000 | 14 |
| Men | 1.21 (0.94, 1.55) | p = 0.000 | 6 |
| Women | 1.39 (1.17, 1.65) | p = 0.018 | 12 |
| Total processed meat | 1.23 (1.10, 1.37) | p = 0.000 | 23 |
| By meat type | |||
| processed meat | 1.17 (1.06, 1.30) | p = 0.000 | 15 |
| Bacon | 1.67 (1.09, 2.56) | p = 0.016 | 4 |
| Preserved meat | 0.50 (0.35, 0.71) | p = .? | 1 |
| Salted meat | 1.61 (0.87, 2.99) | p = 0.001 | 3 |
| Sausage | 1.33 (0.91, 1.94) | p = 0.008 | 5 |
| By study type | |||
| Cohort studies | 1.09 (0.99, 1.19) | p = 0.095 | 5 |
| Population-based CC | 1.46 (1.08, 1.97) | p = 0.000 | 8 |
| Hospital-based CC | 1.23 (1.01, 1.49) | p = 0.000 | 8 |
| By areas | |||
| The United States | 1.29 (1.09, 1.53) | p = 0.000 | 6 |
| Europe | 1.13 (0.78, 1.63) | p = 0.006 | 3 |
| Asia | 0.89 (0.56, 1.42) | p = 0.000 | 2 |
| Uruguay | 1.27 (1.00, 1.60) | p = 0.000 | 7 |
| Canada | 1.46 (1.24, 1.71) | p = 0.601 | 3 |
| By genders | |||
| Both | 1.11 (0.96, 1.28) | p = 0.000 | 12 |
| Men | 1.95 (1.34, 2.84) | p = 0.000 | 5 |
| Women | 1.09 (0.94, 1.28) | p = 0.172 | 6 |
| By cancer type | |||
| Adenocarcinoma | 1.19 (0.92, 1.54) | p = 0.002 | 6 |
| Large cell carcinoma | 1.31 (0.95, 1.80) | p = 0.400 | 3 |
| Small cell | 1.31 (0.97, 1.77) | p = 0.131 | 5 |
| Squamous carcinoma | 1.31 (0.97, 1.78) | p = 0.020 | 6 |
Beef, lamb and pork
6 studies explored the association between beef and lung cancer risk. The estimated RR was 1.39 (95% CI, 1.14, 1.69) and no significant heterogeneity was detected (P for heterogeneity = 0.433). 4 studies assessed the association between intake of lamb and risk of lung cancer. The pooled results showed a weak positive effect of lamb (RR: 1.25, 95% CI, 0.97-1.61) and no evidence of heterogeneity was found (P for heterogeneity = 0.489). No association was found between pork consumption and lung cancer from five related studies (RR: 1.10, 95% CI, 0.70-1.73) and a significant heterogeneity was detected (P for heterogeneity = 0.001). The results were shown in Table 2.
Dose-response meta-analysis
Only red meat was given dose-response analysis. A total of 11 studies were included [5,21,22,24,25,31,36,38,39,42,44]. The reasons were as follows: 1) no case and/or controls reported [27,29,33,34,40,43]; and 2) only 1 level or 2 levels of exposure [5,8,20,32,37,41]. The results were shown in Table 2. The estimated RR associated with consumption of 120 g per day was 1.35 (95% CI, 1.25-1.46), and significant heterogeneity between studies was detected.
Processed meat (the highest vs lowest category) (Figure 3)
Figure 3.
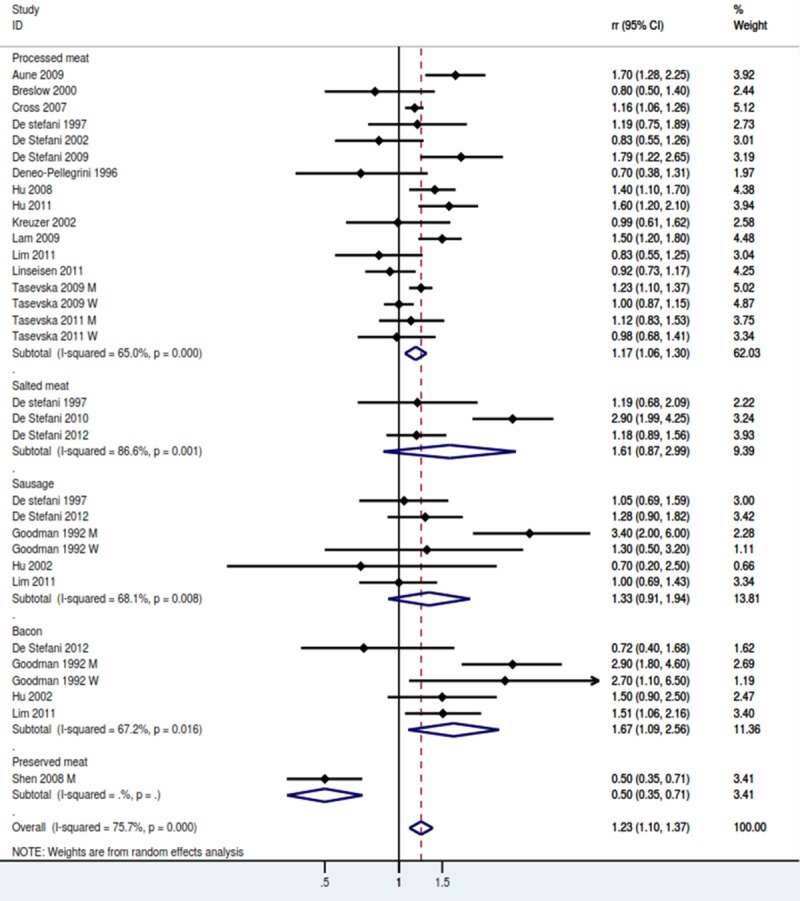
Forest plot for processed meat.
A total of 23 studies were included in the highest versus lowest analysis of processed meat intake and lung cancer. The pooled result showed that risk of lung cancer was 1.23 (95% CI, 1.10-1.37) with evidence of significant heterogeneity (P for heterogeneity = 0.000). Table 2 showed the subgroup analysis of processed meat. The synthetic RR was significantly elevated in both Population-based case-control subgroup (RR: 1.46, 95% CI, 1.08-1.97) and Hospital-based case-control studies (RR: 1.23, 95% CI, 1.01-1.49). The RR was significant for studies conducted in the US (RR: 1.29, 95% CI, 1.09-1.53) and Canada (RR: 1.46, 95% CI, 1.24-1.71), but non-significant for studies in Europe (RR: 1.13, 95% CI, 0.78-1.63) and Asia (RR: 0.89, 95% CI, 0.56-1.42) (Table 2).
Bacon, salted meat, sausage
4 studies explored the association between beef and the risk of lung cancer. The pooled RR was 1.67 (95% CI, 1.09-2.56), and a significant heterogeneity was detected (P for heterogeneity = 0.016). No association were found between salted meat and sausage. The result were showed in Table 2.
Dose-response meta-analysis
Eleven studies were included in the dose-response meat analysis for total red meat. Whereas, studies were excluded, the reasons was only no case and/or controls reported, one study was with less than 3 levels. The estimate RR associated with consumption of 50 g per day was 1.20 (95% CI, 1.11-1.29) and significant heterogeneity between studies was detected.
Discussion
The quantitative studies on the risk of lung cancer and meat consumption suggested that excessive intake of red and processed meat are associated with an increase of incidence of lung cancer. Our findings were partially different with the previous meta-analysis by Yang [12], which concluded that processed meat had no effect on lung cancer. It included a total of 20 studies on red meat and 17 studies on processed meat. We added 2 additional studies [19,20], all of them find processed meat showed an positive effect on the risk of lung cancer. Dose-response analysis showed that consumption of red meat for 120 g per day might increase the risk of lung cancer by 35%, and consumption of processed meat for 50 g per day might increase the risk of lung cancer by 20%.
Mechanisms for a potential association between meat, especially red and processed meat, and lung cancer has been discussed in many publications. First, preservation, cooking and/or processed methods could introduce mutagens and carcinogens such as N-Nitroso compounds (NOCs), heterocyclic amines (HCAs) and polycyclic aromatic hydrocarbons (PHAs) [47,48]. NOCs are potent carcinogens which can induce tumors in human and animal studies [49]. Besides, HCAs and PAHs have also been proved as carcinogens in animal experiments [50,51]. Another mechanism is that the haeme iron, which is higher in red meat than white meat, is carcinogenic in animals and humans by forming free radicals and saturated fat in red meat may have association with lung cancer [12].
To our knowledge, this is the first comprehensive dose-response meta-analysis of red and processed meat and lung cancer risk based on high versus low categories. The majority of the studies included and the sample size contained were the largest up to now. Most of the included studies have evaluated the multiple confounders including age, BMI, smoking, total energy intake and so on. We also conducted subgroup analysis by counties and source of control subjects in case-control. Because the dietary habits may be varied considerably among countries and the source of control subjects played an important role in recall bias, subgroup analysis for the above two aspects would be helpful to identify the source of heterogeneity.
Despite of the advantages we have made, the limitations should be noted. First, the heterogeneity in our study was obvious both in major comparison and in the subgroup analysis. Meta-analysis was to combine the outcomes from different studies, which the areas, the methods, the populations were different and thus easily cause heterogeneity. In the present meta-analyses, heterogeneity was found more frequently in case-control studies than cohort studies. When the outcomes were pooled, more countries were included. It is reported that observational studies are prone to cause recall and selection bias. Although the effect-size was similar in case-control and cohort studies, the follow-up periods were usually long in cohort study. It was usually more than 8 years for cohort study while in case-control studies the time interval from the first dietary assessment to the disease was usually 1-5 years. However, we considered that recall bias is unlikely to contribute to the positive association between red/processed meat and lung cancer risk because more than 80% included studies were case-control designed and recall bias mainly from cohort studies might be weakened. Moreover, more than half studies were hospital-based and selection bias is concerned in these studies. For participates with pre-diagnostic early symptoms, changes in dietary habits would cause difference from those likely to be more healthy. Our findings were in accordance with most studies carried out in the United States and Europe. In western countries, dietary were mainly on meat and less vegetables which was virtually a protected factor for lung cancer and most of the results in western countries were positive. However, for the other geographical areas of the world, the evidence was not enough to obtain meaningful estimates.
Additional methodological issues were the dietary measurement and their validation. Because more than 90% measurement questionnaire was the Food Frequency Questionnaire (FFQ), we could not conduct the subgroup analysis by type of the measurement tools for insufficient information. Compared to the quantitative effect-size, the results from subjective scale were less precise. It is estimated that the typical degrees of random measurement error caused by subjective scale could cause at least 2-fold underestimation of the pooled results. The effect may be strengthened if the assessment was not conducted in the exposure period. Besides, no data from dietary questionnaire validation studies was available. We decided not to apply formal corrections for the measurement error, otherwise an increased pooled estimation would be performed.
The positive association between red meat and processed meat and the risk of lung cancer was potentially affected by the uncontrolled factors. Although some known or suspected risk factors including smoking, age and BMI have been adjusted in most studies, other unknown factors may contribute to the positive association. For example, the relative risks in multiple meat types such as total meat, red meat, processed meat were usually evaluated than the studies with red meat or processed only. Nevertheless, the pool results were in agreement with the summary relative risk per gram of intake estimated from the dose-response relationship.
Although the dose-response approach has more advantages than traditional methodology, the consumption levels should be recalculated. For example, we need to consider the open-ended borderline level and/or the median level of consumption for category when the information was missing in individual studies. The estimation of “dose” value would cause methodological bias. Besides, the consumption levels of some studies were expressed in servings and we rescaled these servings category into grams.
Conclusions
In summary, findings of this dose-response meta-analysis support the hypothesis that consumption of red and processed meat may be associated with the risk of lung cancer, but we do not suggest that red meat should be completely avoided because of the balance of diet. A low intake of red and processed meat should be recommended.
Disclosure of conflict of interest
None.
References
- 1.Chen W, Zheng R, Zhang S, Zou X, Zhao P, He J. Lung cancer incidence and mortality in China, 2009. Thoracic Cancer. 2013;4:102–8. doi: 10.1111/1759-7714.12025. [DOI] [PubMed] [Google Scholar]
- 2.Wiseman M. The second World Cancer Research Fund/American Institute for Cancer Research expert report. Food, nutrition, physical activity, and the prevention of cancer: a global perspective. Proc Nutr Soc. 2008;3:253–6. doi: 10.1017/S002966510800712X. [DOI] [PubMed] [Google Scholar]
- 3.Brownson RC, Alavanja MC, Caporaso N, Simoes EJ, Chang JC. Epidemiology and prevention of lung cancer in nonsmokers. Epidemiol Rev. 1998;2:218–36. doi: 10.1093/oxfordjournals.epirev.a017982. [DOI] [PubMed] [Google Scholar]
- 4.Hu J, Mao Y, Dryer D, White K. Risk factors for lung cancer among Canadian women who have never smoked. Cancer Detect Prev. 2002;2:129–38. doi: 10.1016/s0361-090x(02)00038-7. [DOI] [PubMed] [Google Scholar]
- 5.Linseisen J, Rohrmann S, Bueno-de-Mesquita B, Büchner FL, Boshuizen HC, Agudo A, Gram IT, Dahm CC, Overvad K, Egeberg R, Tjønneland A, Boeing H, Steffen A, Kaaks R, Lukanova A, Berrino F, Palli D, Panico S, Tumino R, Ardanaz E, Dorronsoro M, Huerta JM, Rodríguez L, Sánchez MJ, Rasmuson T, Hallmans G, Manjer J, Wirfält E, Engeset D, Skeie G, Katsoulis M, Oikonomou E, Trichopoulou A, Peeters PH, Khaw KT, Wareham N, Allen N, Key T, Brennan P, Romieu I, Slimani N, Vergnaud AC, Xun WW, Vineis P, Riboli E. Consumption of meat and fish and risk of lung cancer: results from the European Prospective Investigation into Cancer and Nutrition. Cancer Causes Control. 2011;6:909–18. doi: 10.1007/s10552-011-9764-1. [DOI] [PubMed] [Google Scholar]
- 6.Ozasa K, Watanabe Y, Ito Y, Suzuki K, Tamakoshi A, Seki N, Nishino Y, Kondo T, Wakai K, Ando M, Ohno Y. Dietary habits and risk of lung cancer death in a large-scale cohort study (JACC Study) in Japan by sex and smoking habit. Jpn J Cancer Res. 2001;12:1259–69. doi: 10.1111/j.1349-7006.2001.tb02148.x. [DOI] [PMC free article] [PubMed] [Google Scholar]
- 7.Balder HF, Goldbohm RA, van den Brandt PA. Dietary patterns associated with male lung cancer risk in the Netherlands Cohort Study. Cancer Epidemiol Biomarkers Prev. 2005;2:483–90. doi: 10.1158/1055-9965.EPI-04-0353. [DOI] [PubMed] [Google Scholar]
- 8.Sinha R, Kulldorff M, Curtin J, Brown CC, Alavanja MCR, Swanson CA. Fried, well-done red meat and risk of lung cancer in women (United States) Cancer Causes Control. 1998;6:621–30. doi: 10.1023/a:1008805525525. [DOI] [PubMed] [Google Scholar]
- 9.Mohr DL, Blot WJ, Tousey PM, Van Doren ML, Wolfe KW. Southern cooking and lung cancer. Nutr Cancer. 1999;1:34–43. doi: 10.1207/S1532791434-43. [DOI] [PubMed] [Google Scholar]
- 10.Tasevska N, Cross AJ, Dodd KW, Ziegler RG, Caporaso NE, Sinha R. No effect of meat, meat cooking preferences, meat mutagens or heme iron on lung cancer risk in the prostate, lung, colorectal and ovarian cancer screening trial. Int J Cancer. 2011;2:402–11. doi: 10.1002/ijc.25327. [DOI] [PMC free article] [PubMed] [Google Scholar]
- 11.Lim WY, Chuah KL, Eng P, Leong SS, Lim E, Lim TK, Ng A, Poh WT, Tee A, Teh M, Salim A, Seow A. Meat consumption and risk of lung cancer among never-smoking women. Nutr Cancer. 2011;6:850–59. doi: 10.1080/01635581.2011.589961. [DOI] [PubMed] [Google Scholar]
- 12.Yang WS, Wong MY, Vogtmann E, Tang RQ, Xie L, Yang YS, Wu QJ, Zhang W, Xiang YB. Meat consumption and risk of lung cancer: evidence from observational studies. Ann Oncol. 2012;12:3163–70. doi: 10.1093/annonc/mds207. [DOI] [PMC free article] [PubMed] [Google Scholar]
- 13.Higgins JP, Thompson SG. Quantifying heterogeneity in a meta-analysis. Stat Med. 2002;11:1539–58. doi: 10.1002/sim.1186. [DOI] [PubMed] [Google Scholar]
- 14.Greenland S, Longnecker MP. Methods for trend estimation from summarized dose-response data, with applications to meta-analysis. Am J Epidemiol. 1992;11:1301–9. doi: 10.1093/oxfordjournals.aje.a116237. [DOI] [PubMed] [Google Scholar]
- 15.Kreuzer M, Heinrich J, Kreienbrock L, Rosario AS, Gerken M, Wichmann HE. Risk factors for lung cancer among nonsmoking women. Int J Cancer. 2002;6:706–13. doi: 10.1002/ijc.10549. [DOI] [PubMed] [Google Scholar]
- 16.Norat T, Lukanova A, Ferrari P, Riboli E. Meat consumption and colorectal cancer risk: dose-response meta-analysis of epidemiological studies. Int J Cancer. 2002;2:241–56. doi: 10.1002/ijc.10126. [DOI] [PubMed] [Google Scholar]
- 17.Salehi M, Moradi-Lakeh M, Salehi MH, Nojomi M, Kolahdooz F. Meat, fish, and esophageal cancer risk: a systematic review and dose-response meta-analysis. Nutr Rev. 2013;5:257–67. doi: 10.1111/nure.12028. [DOI] [PubMed] [Google Scholar]
- 18.Wallin A, Orsini N, Wolk A. Red and processed meat consumption and risk of ovarian cancer: a dose-response meta-analysis of prospective studies. Br J Cancer. 2011;7:1196–201. doi: 10.1038/bjc.2011.49. [DOI] [PMC free article] [PubMed] [Google Scholar]
- 19.Gnagnarella P, Maisonneuve P, Bellomi M, Rampinelli C, Bertolotti R, Spaggiari L, Palli D, Veronesi G. Red meat, Mediterranean diet and lung cancer risk among heavy smokers in the COSMOS screening study. Ann Oncol. 2013;24:2606–11. doi: 10.1093/annonc/mdt302. [DOI] [PubMed] [Google Scholar]
- 20.Pierce RJ, Kune GA, Kune S, Watson LF, Field B, Merenstein D, Hayes A, Irving LB. Dietary and alcohol intake, smoking pattern, occupational risk, and family history in lung cancer patients: results of a case-control study in males. Nutr Cancer. 1989;3:237–48. doi: 10.1080/01635588909514023. [DOI] [PubMed] [Google Scholar]
- 21.Aune D, De Stefani E, Ronco A, Boffetta P, Deneo- Pellegrini H, Acosta G, Mendilaharsu M. Meat consumption and cancer risk: a case-control study in Uruguay. Asian Pac J Cancer Prev. 2009;3:429–36. [PubMed] [Google Scholar]
- 22.Breslow RA, Graubard BI, Sinha R, Subar AF. Diet and lung cancer mortality: A 1987 National Health Interview Survey cohort study. Cancer Causes Control. 2000;5:419–31. doi: 10.1023/a:1008996208313. [DOI] [PubMed] [Google Scholar]
- 23.Cross AJ, Leitzmann MF, Gail MH, Hollenbeck AR, Schatzkin A, Sinha R. A prospective study of red and processed meat intake in relation to cancer risk. PLoS Med. 2007;4:e325. doi: 10.1371/journal.pmed.0040325. [DOI] [PMC free article] [PubMed] [Google Scholar]
- 24.De Stefani E, Boffetta P, Deneo-Pellegrini H, Ronco AL, Aune D, Acosta G, Brennan P, Mendilaharsu M, Ferro G. Meat intake, meat mutagens and risk of lung cancer in Uruguayan men. Cancer Causes Control. 2009;9:1635–43. doi: 10.1007/s10552-009-9411-2. [DOI] [PubMed] [Google Scholar]
- 25.De Stefani E, Boffetta P, Ronco AL, Deneo-Pellegrini H, Correa P, Acosta G, Mendilaharsu M, Luaces ME, Silva C. Processed meat consumption and risk of cancer: a multisite case-control study in Uruguay. Br J Cancer. 2012;9:1584–8. doi: 10.1038/bjc.2012.433. [DOI] [PMC free article] [PubMed] [Google Scholar]
- 26.De Stefani E, Brennan P, Boffetta P, Mendilaharsu M, Deneo-Pellegrini H, Ronco A, Olivera L, Kasdorf H. Diet and adenocarcinoma of the lung: a case-control study in Uruguay. Lung Cancer. 2002;1:43–51. doi: 10.1016/s0169-5002(01)00281-1. [DOI] [PubMed] [Google Scholar]
- 27.De Stefani E, Fontham ET, Chen V, Correa P, Deneo-Pellegrini H, Ronco A, Mendilaharsu M. Fatty foods and the risk of lung cancer: a case-control study from Uruguay. Int J Cancer. 1997;5:760–6. doi: 10.1002/(sici)1097-0215(19970529)71:5<760::aid-ijc12>3.0.co;2-c. [DOI] [PubMed] [Google Scholar]
- 28.De Stefani E, Ronco AL, Boffetta P, Deneo-Pellegrini H, Acosta G, Mendilaharsu M. Meat consumption, meat cooking and risk of lung cancer among Uruguayan men. Asian Pac J Cancer Prev. 2010;6:1713–17. [PubMed] [Google Scholar]
- 29.Deneo-Pellegrini H, De Stefani E, Ronco A, Mendilaharsu M, Carzoglio JC. Meat consumption and risk of lung cancer; a case-control study from Uruguay. Lung Cancer. 1996;14:195–205. doi: 10.1016/0169-5002(95)00546-3. [DOI] [PubMed] [Google Scholar]
- 30.Dosil-Diaz O, Ruano-Ravina A, Gestal-Otero JJ, Barros-Dios JM. Meat and fish consumption and risk of lung cancer: A case-control study in Galicia, Spain. Cancer Lett. 2007;1:115–22. doi: 10.1016/j.canlet.2006.12.008. [DOI] [PubMed] [Google Scholar]
- 31.Fortes C, Forastiere F, Farchi S, Mallone S, Trequattrinni T, Anatra F, Schmid G, Perucci CA. The protective effect of the Mediterranean diet on lung cancer. Nutr Cancer. 2003;1:30–37. doi: 10.1207/S15327914NC4601_04. [DOI] [PubMed] [Google Scholar]
- 32.Ganesh B, Sushama S, Monika S, Suvarna P. A case-control study of risk factors for lung cancer in Mumbai, India. Asian Pac J Cancer Prev. 2011;2:357–62. [PubMed] [Google Scholar]
- 33.Goodman MT, Hankin JH, Wilkens LR, Kolonel LN. High-fat foods and the risk of lung cancer. Epidemiology. 1992;4:288–99. doi: 10.1097/00001648-199207000-00004. [DOI] [PubMed] [Google Scholar]
- 34.Hu J, La Vecchia C, DesMeules M, Negri E, Mery L Canadian Cancer Registries Epidemiology Research Group. Meat and fish consumption and cancer in Canada. Nutr Cancer. 2008;3:313–24. doi: 10.1080/01635580701759724. [DOI] [PubMed] [Google Scholar]
- 35.Hu J, La Vecchia C, Morrison H, Negri E, Mery L. Salt, processed meat and the risk of cancer. Eur J Cancer Prev. 2011;2:132–39. doi: 10.1097/CEJ.0b013e3283429e32. [DOI] [PubMed] [Google Scholar]
- 36.Kubik A, Zatloukal P, Tomasek L, Pauk N, Petruzelka L, Plesko I. Lung cancer risk among nonsmoking women in relation to diet and physical activity. Neoplasma. 2004;2:136–43. [PubMed] [Google Scholar]
- 37.Kubik AK, Zatloukal P, Tomasek L, Petruzelka L. Lung cancer risk among Czech women: A case-control study. Prev Med. 2002;4:436–44. doi: 10.1006/pmed.2001.1002. [DOI] [PubMed] [Google Scholar]
- 38.Lam TK, Cross AJ, Consonni D, Randi G, Bagnardi V, Bertazzi PA, Caporaso NE, Sinha R, Subar AF, Landi MT. Intakes of red meat, processed meat, and meat mutagens increase lung cancer risk. Cancer Res. 2009;3:932–9. doi: 10.1158/0008-5472.CAN-08-3162. [DOI] [PMC free article] [PubMed] [Google Scholar]
- 39.Lin Y, Cai L. Environmental and dietary factors and lung cancer risk among chinese women: A case-control study in Southeast China. Nutr Cancer. 2012;4:508–14. doi: 10.1080/01635581.2012.668743. [DOI] [PubMed] [Google Scholar]
- 40.Marchand JL, Luce D, Goldberg P, Bugel I, Salomon C, Goldberg M. Dietary factors and the risk of lung cancer in New Caledonia (South Pacific) Nutr Cancer. 2002;1:18–24. doi: 10.1207/S15327914NC421_3. [DOI] [PubMed] [Google Scholar]
- 41.Shen M, Chapman RS, He X, Liu LZ, Lai H, Chen W, Lan Q. Dietary factors, food contamination and lung cancer risk in Xuanwei, China. Lung Cancer. 2008;3:275–82. doi: 10.1016/j.lungcan.2007.12.024. [DOI] [PubMed] [Google Scholar]
- 42.Swanson CA, Brown CC, Sinha R, Kulldorff M, Brownson RC, Alavanja MCR. Dietary fats and lung cancer risk among women: The Missouri women’s health study (United states) Cancer Causes Control. 1997;6:883–92. doi: 10.1023/a:1018468429744. [DOI] [PubMed] [Google Scholar]
- 43.Tasevska N, Sinha R, Kipnis V, Subar AF, Leitzmann MF, Hollenbeck AR, Caporaso NE, Schatzkin A, Cross AJ. A prospective study of meat, cooking methods, meat mutagens, heme iron, and lung cancer risks. Am J Clin Nutr. 2009;6:1884–94. doi: 10.3945/ajcn.2008.27272. [DOI] [PMC free article] [PubMed] [Google Scholar]
- 44.Zatloukal P, Kubik A, Pauk N, Tomasek L, Petruzelka L. Adenocarcinoma of the lung among women: risk associated with smoking, prior lung disease, diet and menstrual and pregnancy history. Lung Cancer. 2003;3:283–93. doi: 10.1016/s0169-5002(03)00234-4. [DOI] [PubMed] [Google Scholar]
- 45.Khan MM, Goto R, Kobayashi K, Suzumura S, Nagata Y, Sonoda T, Sakauchi F, Washio M, Mori M. Dietary habits and cancer mortality among middle aged and older Japanese living in hokkaido, Japan by cancer site and sex. Asian Pac J Cancer Prev. 2004;1:58–65. [PubMed] [Google Scholar]
- 46.De Stefani E, Aune D, Boffetta P, Deneo-Pellegrini H, Ronco AL, Acosta G, Brennan P, Ferro G, Mendilaharsu M. Salted meat consumption and the risk of cancer: a multisite case-control study in Uruguay. Asian Pac J Cancer Prev. 2009;5:853–7. [PubMed] [Google Scholar]
- 47.Lijinsky W. N-Nitroso compounds in the diet. Mutat Res. 1999;443:129–38. doi: 10.1016/s1383-5742(99)00015-0. [DOI] [PubMed] [Google Scholar]
- 48.Skog KI, Johansson MA, Jagerstad MI. Carcinogenic heterocyclic amines in model systems and cooked foods: a review on formation, occurrence and intake. Food Chem Toxicol. 1998;36:879–96. doi: 10.1016/s0278-6915(98)00061-1. [DOI] [PubMed] [Google Scholar]
- 49.Tricker AR, Preussmann R. Carcinogenic N-nitrosamines in the diet: occurrence, formation, mechanisms and carcinogenic potential. Mutat Res. 1991;259:277–89. doi: 10.1016/0165-1218(91)90123-4. [DOI] [PubMed] [Google Scholar]
- 50.Bingham SA. High-meat diets and cancer risk. Proc Nutr Soc. 1999;2:243–8. doi: 10.1017/s0029665199000336. [DOI] [PubMed] [Google Scholar]
- 51.Sugimura T. Nutrition and dietary carcinogens. Carcinogenesis. 2000;3:387–95. doi: 10.1093/carcin/21.3.387. [DOI] [PubMed] [Google Scholar]