Highly multiplexed subcellular RNA sequencing in situ (original) (raw)
. Author manuscript; available in PMC: 2014 Sep 21.
Published in final edited form as: Science. 2014 Feb 27;343(6177):1360–1363. doi: 10.1126/science.1250212
Abstract
Understanding the spatial organization of gene expression with single nucleotide resolution requires localizing the sequences of expressed RNA transcripts within a cell_in situ_. Here we describe fluorescent in situ RNA sequencing (FISSEQ), in which stably cross-linked cDNA amplicons are sequenced within a biological sample. Using 30-base reads from 8,742 genes in situ, we examined RNA expression and localization in human primary fibroblasts using a simulated wound healing assay. FISSEQ is compatible with tissue sections and whole mount embryos, and reduces the limitations of optical resolution and noisy signals on single molecule detection. Our platform enables massively parallel detection of genetic elements, including gene transcripts and molecular barcodes, and can be used to investigate cellular phenotype, gene regulation, and environment in situ.
The spatial organization of gene expression can be observed within a single cell, tissue, and organism, but the existing RNA localization methods are limited to a handful of genes per specimen, making it costly and laborious to localize RNA transcriptome-wide (1–3). We originally proposed fluorescent in situ sequencing (FISSEQ) in 2003, developing methods to sequence DNA amplicons on a solid substrate for genome and transcriptome sequencing (4–7); however, sequencing the cellular RNA in situ for gene expression profiling requires a spatially structured sequencing library and an imaging method capable of resolving the amplicons.
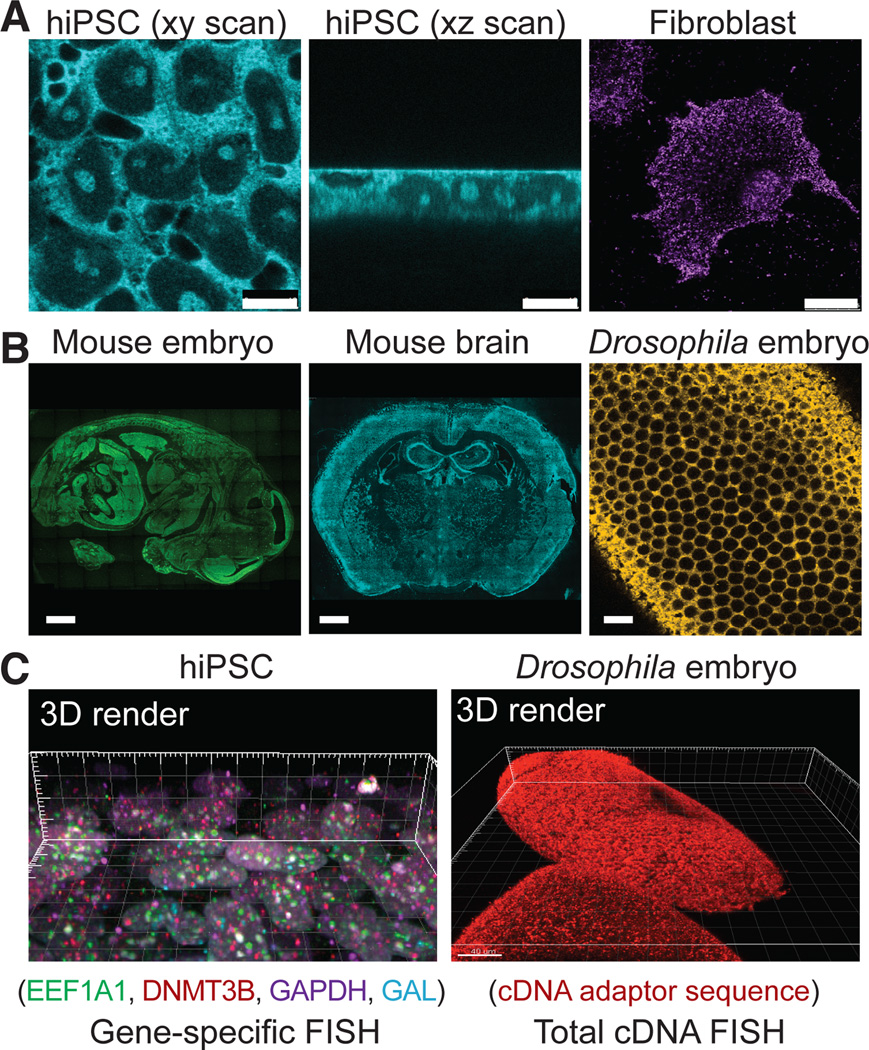
We report here the next generation of FISSEQ. To generate cDNA amplicons within the cell (fig. S1), RNA was reverse transcribed (RT) in fixed cells with tagged random hexamers (fig. S2A). We incorporated aminoallyl dUTP during RT (fig. S2B) and re-fixed the cells using BS(PEG)9, an amine-reactive linker with a 4 nm spacer. The cDNA fragments were then circularized before rolling circle amplification (RCA) (fig. S2C), and BS(PEG)9 was used to cross-link the RCA amplicons containing aminoallyl dUTP (fig. S2D, E). We found that random hexamer-primed RT was inefficient (fig. S3A), but cDNA circularization was complete within hours (fig. S3B–D). The result was single-stranded DNA nanoballs 200–400 nm in diameter (fig. S4A), consisting of numerous tandem repeats of the cDNA sequence. BS(PEG)9 reduced non-specific probe binding (fig. S4B), and amplicons were highly fluorescent after probe hybridization (fig. S4C). As a result, the amplicons could be re-hybridized many times, with minimal changes in their signal-to-noise ratio or position (fig. S4D, E). Using SOLiD sequencing by ligation (fig. S5), the signal overlap over 27 consecutive sequencing reactions was ~600 nm in diameter (figs. S4F). In iPS cells, the amplicons counter-stained subcellular structures, such as the plasma membrane, the nuclear membrane, the nucleolus, and the chromatin (Figs. 1A, S6, Movies S1–S3). We were able to generate RNA sequencing libraries in different cell types, tissue sections, and whole mount embryos for 3D visualization that spanned multiple resolution scales (Fig. 1B, C).
Fig. 1.
Construction of 3D RNA-seq libraries in situ. After RT using random hexamers with an adapter sequence in fixed cells, the cDNA is amplified and cross-linked in situ. (A) A fluorescent probe is hybridized to the adapter sequence and imaged using confocal microscopy in human iPS cells (bar: 10 um) and fibroblasts (bar: 25 um). (B) FISSEQ can localize the total RNA transcriptome in mouse embryo and adult brain sections (bar: 1 mm), and whole-mount_Drosophila_ embryos (bar: 5 um), although we have not sequenced these samples. (C) 3D rendering of gene-specific or adapter-specific probes hybridized to cDNA amplicons.
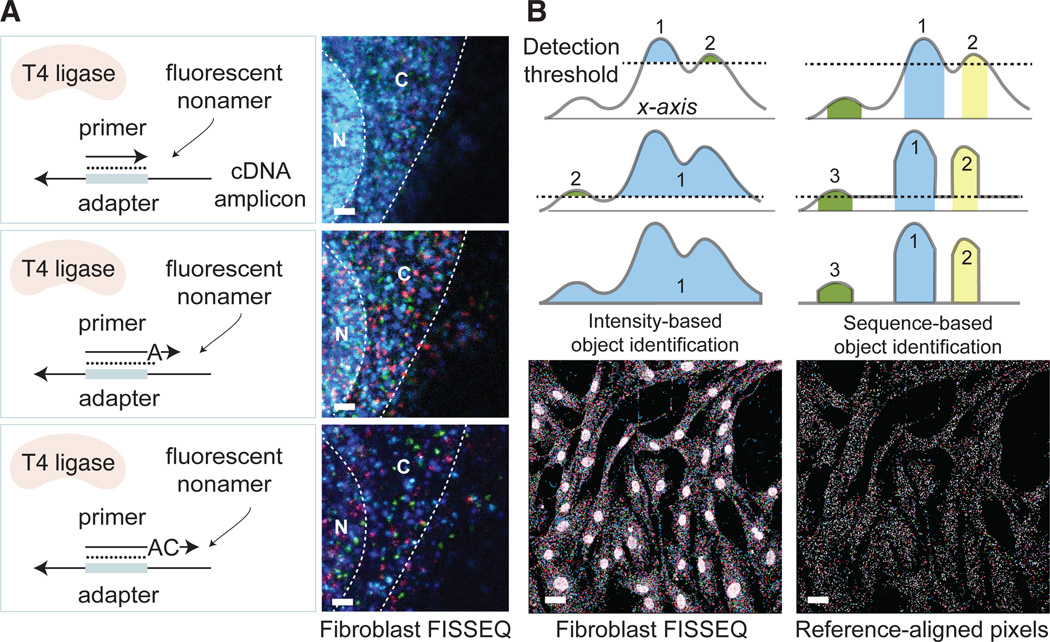
High numerical aperture and magnification are essential for imaging RNA molecules in single cells (8–10), but many gene expression patterns are most efficiently detected in a low magnification and wide-field mode, where it typically becomes difficult to distinguish single molecules due to the optical diffraction limit and low sensitivity (11). To obtain a spot density that is high enough to yield statistically significant RNA localization, and yet sufficiently low for discerning individual molecules, we developed partition sequencing, in which pre-extended sequencing primers are used to reduce the number of molecular sequencing reactions through random mismatches at the ligation site (Fig. 2A). Progressively longer sequencing primers results in exponential reduction of the observed density, and the sequencing primer can be changed during imaging to detect amplicon pools of different density.
Fig. 2.
Overcoming resolution limitations and enhancing the signal-to-noise ratio. (A) Ligation of fluorescent oligonucleotides occurs when the sequencing primer ends are perfectly complementary to the template. Extending sequencing primers by one or more bases, one can randomly sample amplicons at 1/4th, 1/16th, and 1/256th of the original density in fibroblasts (bar: 5 um). (B) Rather than using an arbitrary intensity threshold, color sequences at each pixel are used to identify objects. For sequences of L bases, the error rate is approximately n/4_L_ per pixel, where n is the size of the reference. By removing unaligned pixels, the nuclear background noise is reduced in fibroblasts (bar: 20 um).
Fluorescence microscopy can be accompanied by tissue-specific artifacts and autofluorescence, impeding accurate identification of objects. If objects are nucleic acids, however, discrete sequences rather than the analog signal intensity can be used to analyze the image. For FISSEQ, putative nucleic acid sequences are determined for all pixels. The sequencing reads are then compared to reference sequences, assigning a null value to unaligned pixels. With a suitably long read length (L), a large number of unique sequences (n) can be used to identify transcripts or any other objects with a false positive rate of approximately n/4_L_ per pixel. Since the intensity threshold is not used, even faint objects are registered based on their sequence, while background noise, autofluorescence, and debris are eliminated (Fig. 2B).
We applied these concepts to sequence the transcription start site of inducible mCherry mRNA in situ, analogous to 5’ RACE-PCR (12). After reverse transcription and molecular amplification of the 5’ end followed by fluorescent probe hybridization (fig. S7A), we quantified the concentration- and time-dependent mCherry gene expression in situ (fig. S7B). Using sequencing-by-ligation, we then determined the identity of 15 contiguous bases from each amplicon in situ, corresponding to the transcription start site (fig. S7C). When the sequencing reads were mapped to the vector sequence, 7,472 (98.7%) amplicons aligned to the positive strand of mCherry, and 3,967 (52.4%) amplicons mapped within two bases of the predicted transcription start site (fig. S7D).
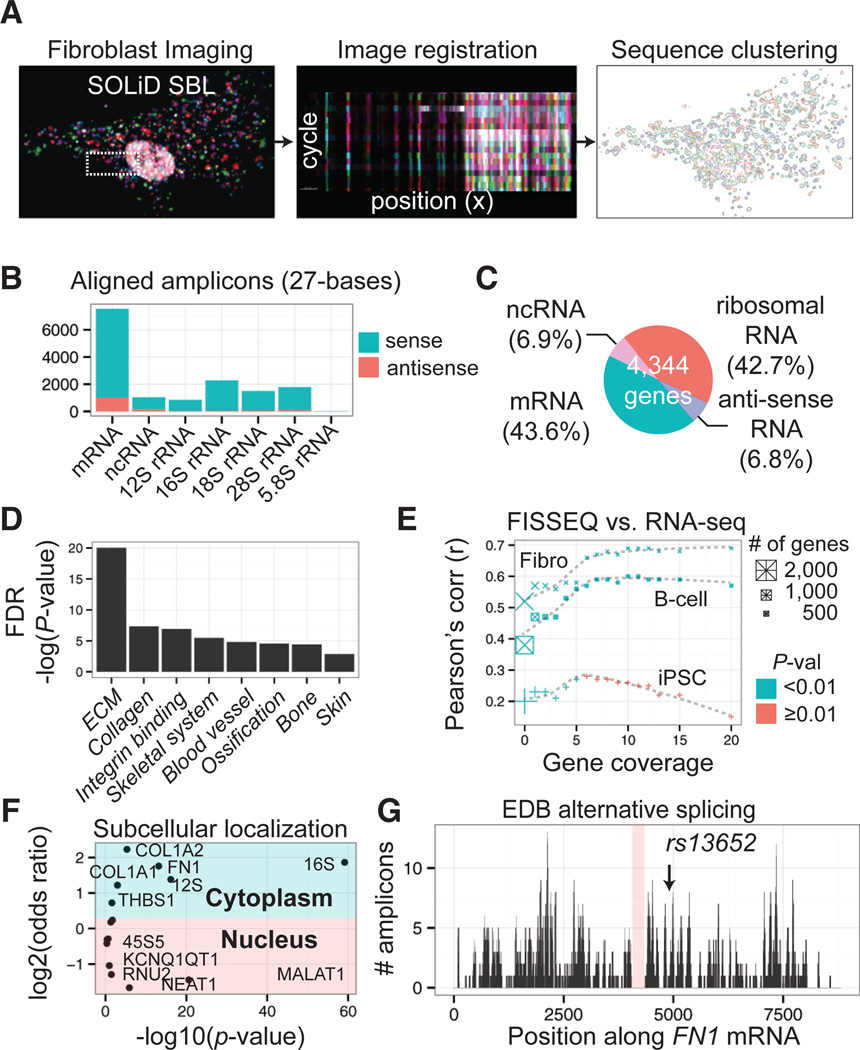
We then sequenced the transcriptome in human primary fibroblasts in situ (Fig. 3A) and generated sequencing reads of 27 bases with a median per-base error rate of 0.64% (fig. S8). Using an automated analysis pipeline (fig. S9), we identified 14,960 amplicons with size >5 pixels, representing 4,171 genes, of which 12,495 (90.6%) amplicons mapped to the correct annotated strand (Figs. 3B, S10; Table S1). We found that mRNA (43.6%) was relatively abundant even though random hexamers were used for RT (Fig. 3C). Ninety genes with the highest expression counts included fibroblast markers (13), such as fibronectin (FN1), collagens (COL1A1, COL1A2, COL3A1), matrix metallopeptidases and inhibitors (MMP14, MMP2, TIMP1), osteonectin (SPARC), stanniocalcin (STC1), and the bone morphogenesis-associated TGF-induced protein (TGFBI), representing extracellular matrix, bone development, and skin development (Benjamini-Hochberg FDR <10−19, 10−5, and 10−3, respectively; Fig. 3D) (14). We made Illumina sequencing libraries to compare FISSEQ to RNA-seq. Pearson’s r_between RNA-seq and FISSEQ ranged from 0.52 to 0.69 (p<10−16), excluding one outlier (FN1). For 853 genes with more than one observation, Pearson’s r was 0.57 (p <10−16), 0.47 (p<10−16), and 0.23 (p<10−3) between FISSEQ and RNA-seq from fibroblasts, lymphocytes, and iPS cells, respectively (Fig. 3E). When FISSEQ was compared to gene expression arrays, Pearson’s r was as high as 0.73 (p <10−16) among moderately expressed genes, while genes with low or high expression levels correlated poorly (r<0.4) (fig. S11). Highly abundant genes in RNA-seq and gene expression arrays were involved in translation and splicing (figs. S11, S12), whereas such genes were underrepresented in FISSEQ. We examined 12,427 (83.1%) and 2,533 (16.9%) amplicons in the cytoplasm and nuclei, respectively, and found that nuclear RNA was 2.1 (95%CI [1.9, 2.3]) times more likely to be non-coding (p< 10−16), and antisense mRNA was 1.8 (95%CI [1.7, 2.0]) times more likely to be nuclear (p <10−16). We confirmed nuclear enrichment of MALAT1 and NEAT1 by comparing their relative distribution against all RNAs (Fig. 3F) or mitochondrial 16S rRNA (Table S2), whereas mRNA such as COL1A1, COL1A2, and_THBS1 localized to the cytoplasm (Table S3). We also examined splicing junctions of FN1, given its high read coverage (481 reads over 8.9-kb). FN1 has three variable domains referred to as EDA, EDB, and IIICS, which are alternatively spliced (15). We did not observe development-associated EDB, but observed adult tissue-associated EDA and IIICS (Figs. 3G).
Fig. 3.
Whole transcriptome in situ RNA-seq in primary fibroblasts. (A) From deconvolved confocal images, 27-base reads are aligned to the reference, and alignments are spatially clustered into objects. (B) 90.6% of the amplicons align to the annotated (+) strand. (C) mRNA and non-coding RNA comprise 43.6% and 6.9% of the amplicons. (D) GO term clustering for top 90 ranked genes. (E) 2,710 genes from fibroblast FISSEQ compared to RNA-seq for fibroblast, B-cell, and iPS cells. Pearson’s correlation is plotted as a function of the gene expression level. (F) Subcellular localization enrichment compared to the whole transcriptome distribution. (G) 481 amplicons map to the FN1 mRNA, showing an alternatively spliced transcript variant and a SNP.
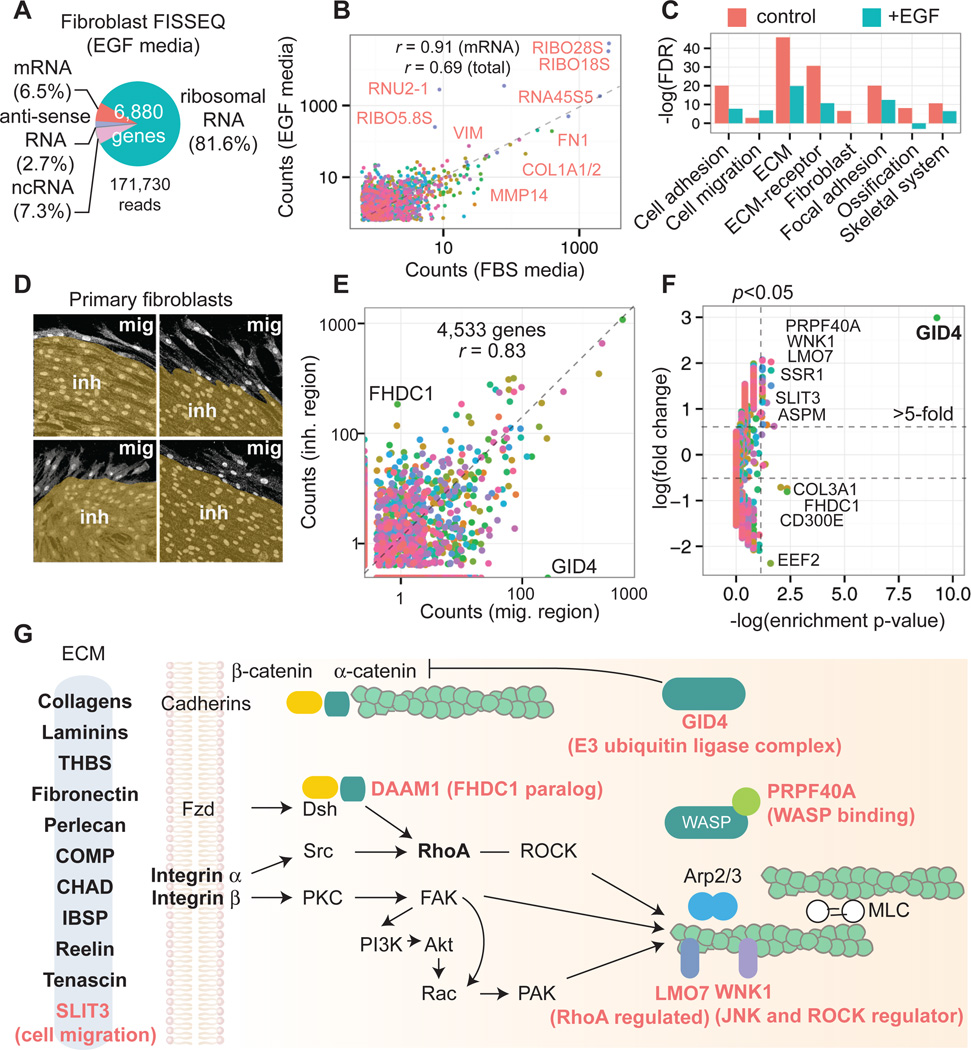
We also sequenced primary fibroblasts in situ after simulating a response to injury, obtaining 156,762 reads (>5 pixels), representing 8,102 annotated genes (Figs. 4A; S13A–D). Pearson’s r was 0.99 and 0.91 between different wound sites and growth conditions, respectively (Fig. 4B; fig. S13E–F). In EGF media 81.6% of the amplicons were ribosomal RNA compared to 51.4% in FBS media. When the 100 highest ranked genes were clustered, cells in FBS media were enriched for fibroblast-associated GO terms, whereas rapidly dividing cells in EGF media were less fibroblast-like (Fig. 4C) with alternative splicing of FN1 (fig. S14). In regions containing migrating cells versus contact inhibited cells, 12 genes showed differences in relative gene expression (Fisher’s exact test_p_<0.05 and >5-fold change) (Fig. 4D–F, Table S4), eight of which were associated with the ECM-receptor-cytoskeleton interaction, including GID4, FHDC1, PRPF40A, LMO7, and WNK1 (Fig. 4G, Table S4).
Fig. 4.
Functional analysis of fibroblasts during simulated wound healing. (A) In EGF media, ribosomal RNA comprises 81.6% of the amplicons. (B) 109,646 reads from EGF media compared to 14,960 reads from FBS media (different colors denote genes). (C) Top 100 ranked genes from FBS vs. EGF FISSEQ clustered for functional annotation. (D) An _in vitro_wound healing assay allows cells to migrate into the wound gap. The image is segmented based on the cell morphology. (E) 4,533 genes from migrating and contact inhibited cells are compared. (F) Twelve genes are differentially expressed (Fisher’s exact test _p_-value<0.05 and >5-fold; 180 genes). (G) Top 100 genes in fibroblasts are enriched for terms associated with ECM-receptor interaction and focal adhesion kinase complex (bold letters). During cell migration, genes involved in ECM-receptor-cytoskeleton signaling and remodeling are differentially expressed (red letters).
In summary, we present a platform for transcriptome-wide RNA sequencing in situ and demonstrate imaging and analytic approaches across multiple specimen types and spatial scales. FISSEQ correlates well with RNA-seq, except for genes involved in RNA and protein processing, possibly because some cellular structures or classes of RNA are less accessible to FISSEQ. It is notable that FISSEQ generates far fewer reads compared to RNA-seq, but predominantly detects genes characterizing cell type and function. If this finding can be generalized, FISSEQ may be used to identify cell types based on gene expression profiles_in situ_. Using partition sequencing to control the signal density, it may even be possible to combine transcriptome profiling and in situ mutation detection in a high-throughput manner (16–18). Using RNA barcodes from expression vectors, one can label up to 4_N_ (_N_=barcode length) cells uniquely, much more than is possible using a combination of fluorescent proteins (19). Similar to next-generation sequencing, we expect advances in read length, sequencing depth and coverage, and library preparation (i.e. fragmentation, rRNA depletion, targeted sequencing). Such advances may lead to improved stratification of diseased tissues in clinical medicine. While more work remains, our present demonstration is an important first step toward a new era in biology and medicine.
Supplementary Material
Supplementary Material
Acknowledgments
Funded by NIH CEGS grant P50 HG005550. J.H.L. and coworkers funded by NHBLI grant RC2HL102815, Allen Institute for Brain Science, and NIMH grant MH098977. E.R.D. funded by NIH grant GM080177 and NSF GRF grant DGE1144152. A.H.M. funded by the Hertz Foundation. A patent application has been submitted.
Footnotes
References and Notes
- 1.Diez-Roux G, et al. A high-resolution anatomical atlas of the transcriptome in the mouse embryo. PLoS Biol. 2011;9:e1000582. doi: 10.1371/journal.pbio.1000582. [DOI] [PMC free article] [PubMed] [Google Scholar]
- 2.Zeng H, et al. Large-scale cellular-resolution gene profiling in human neocortex reveals species-specific molecular signatures. Cell. 2012 Apr 13;149:483. doi: 10.1016/j.cell.2012.02.052. [DOI] [PMC free article] [PubMed] [Google Scholar]
- 3.Lecuyer E, et al. Global analysis of mRNA localization reveals a prominent role in organizing cellular architecture and function. Cell. 2007 Oct 5;131:174. doi: 10.1016/j.cell.2007.08.003. [DOI] [PubMed] [Google Scholar]
- 4.Shendure J, et al. Accurate multiplex polony sequencing of an evolved bacterial genome. Science. 2005 Sep 9;309:1728. doi: 10.1126/science.1117389. [DOI] [PubMed] [Google Scholar]
- 5.Kim JB, et al. Polony multiplex analysis of gene expression (PMAGE) in mouse hypertrophic cardiomyopathy. Science. 2007 Jun 8;316:1481. doi: 10.1126/science.1137325. [DOI] [PubMed] [Google Scholar]
- 6.Mitra RD, et al. Digital genotyping and haplotyping with polymerase colonies. Proc Natl Acad Sci U S A. 2003 May 13;100:5926. doi: 10.1073/pnas.0936399100. [DOI] [PMC free article] [PubMed] [Google Scholar]
- 7.Drmanac R, et al. Human genome sequencing using unchained base reads on self-assembling DNA nanoarrays. Science. 2010 Jan 1;327:78. doi: 10.1126/science.1181498. [DOI] [PubMed] [Google Scholar]
- 8.Femino AM, Fay FS, Fogarty K, Singer RH. Visualization of single RNA transcripts in situ. Science. 1998 Apr 24;280:585. doi: 10.1126/science.280.5363.585. [DOI] [PubMed] [Google Scholar]
- 9.Levsky JM, Shenoy SM, Pezo RC, Singer RH. Single-cell gene-expression profiling. Science. 2002;297:836. doi: 10.1126/science.1072241. [DOI] [PubMed] [Google Scholar]
- 10.Raj A, van den Bogaard P, Rifkin SA, van Oudenaarden A, Tyagi S. Imaging individual mRNA molecules using multiple singly labeled probes. Nat Methods. 2008 Oct;5:877. doi: 10.1038/nmeth.1253. [DOI] [PMC free article] [PubMed] [Google Scholar]
- 11.Itzkovitz S, van Oudenaarden A. Validating transcripts with probes and imaging technology. Nat Methods. 2011 Apr;8:S12. doi: 10.1038/nmeth.1573. [DOI] [PMC free article] [PubMed] [Google Scholar]
- 12.Frohman MA, Dush MK, Martin GR. Rapid production of full-length cDNAs from rare transcripts: amplification using a single gene-specific oligonucleotide primer. Proc Natl Acad Sci U S A. 1988 Dec;85:8998. doi: 10.1073/pnas.85.23.8998. [DOI] [PMC free article] [PubMed] [Google Scholar]
- 13.McAnulty RJ. Fibroblasts and myofibroblasts: their source, function and role in disease. The international journal of biochemistry & cell biology. 2007;39:666. doi: 10.1016/j.biocel.2006.11.005. [DOI] [PubMed] [Google Scholar]
- 14.Huang da W, Sherman BT, Lempicki RA. Systematic and integrative analysis of large gene lists using DAVID bioinformatics resources. Nat Protoc. 2009;4:44. doi: 10.1038/nprot.2008.211. [DOI] [PubMed] [Google Scholar]
- 15.Kornblihtt AR, et al. The fibronectin gene as a model for splicing and transcription studies. FASEB journal : official publication of the Federation of American Societies for Experimental Biology. 1996 Feb;10:248. doi: 10.1096/fasebj.10.2.8641558. [DOI] [PubMed] [Google Scholar]
- 16.Ke R, et al. In situ sequencing for RNA analysis in preserved tissue and cells. Nat Methods. 2013 Jul 14; doi: 10.1038/nmeth.2563. [DOI] [PubMed] [Google Scholar]
- 17.Zhang K, et al. Digital RNA allelotyping reveals tissue-specific and allele-specific gene expression in human. Nature methods. 2009 Aug;6:613. doi: 10.1038/nmeth.1357. [DOI] [PMC free article] [PubMed] [Google Scholar]
- 18.Lee JH, et al. A robust approach to identifying tissue-specific gene expression regulatory variants using personalized human induced pluripotent stem cells. PLoS Genet. 2009 Nov;5:e1000718. doi: 10.1371/journal.pgen.1000718. [DOI] [PMC free article] [PubMed] [Google Scholar]
- 19.Livet J, et al. Transgenic strategies for combinatorial expression of fluorescent proteins in the nervous system. Nature. 2007 Nov 1;450:56. doi: 10.1038/nature06293. [DOI] [PubMed] [Google Scholar]
Associated Data
This section collects any data citations, data availability statements, or supplementary materials included in this article.
Supplementary Materials
Supplementary Material


