Site-specific human histone H3 methylation stability: fast K4me3 turnover (original) (raw)
. Author manuscript; available in PMC: 2015 Oct 1.
Published in final edited form as: Proteomics. 2014 Jul 9;14(19):2190–2199. doi: 10.1002/pmic.201400060
Abstract
We employ stable isotope labelling and quantitative mass spectrometry to track histone methylation stability. We show that H3 trimethyl K9 and K27 are slow to be established on new histones and slow to disappear from old histones, with half-lives of multiple cell divisions. By contrast the transcription-associated marks K4me3 and K36me3 turn over far more rapidly, with half-lives of 6.8 h and 57 h, respectively. Inhibition of demethylases increases K9 and K36 methylation, with K9 showing the largest and most robust increase. We interpret different turnover rates in light of genome-wide localization data and transcription-dependent nucleosome rearrangements proximal to the transcription start site.
Keywords: chromatin, methylation turnover, demethylation, heterochromatin, transcription, SILAC
1 Introduction
Histone methylation is associated with gene transcription and gene silencing. A differentiated cell must usually maintain a consistent transcription profile upon division. The stability and reinstallation of histone methylation through and after cell division is therefore of great interest [1]. Histone H3 is the most highly methylated histone, with the majority of the eight lysines and six arginine residues in the N-terminal tail targeted by various methyltransferases [2]. Different methyl forms (mono- di- and trimethyl) at specific lysines are associated with different nuclear processes and are localized to distinct regions of the genome [3–7].
Alteration of histone modifications can, directly or indirectly, affect DNA-histone interactions and recruit effector proteins, and thereby regulate critical cellular events including transcription and cell division [8, 9]. The analysis of histone modification dynamics indicates that acetylation and phosphorylation turn over rapidly, and contribute to the regulation of both transcription and mitosis [10–12]. Histone methylation turnover aggregated across all methylated residues and genomic loci, by contrast, is extremely stable, with turnover occurring on the same time-frame as turnover of the histone protein [13]. Enzymatic demethylation was shown to occur in 2004, with the identification of LSD1 [14]. LSD1 demethylates H3K4me2 and –me1, utilizing an amine oxidase mechanism that is incompatible with demethylation of trimethyl lysine. Subsequently dioxygenase demethylases were identified, capable of demethylating all lysine methyl forms [15]. This family of Fe(II)-dependent demethylases contains the Jumonji-C domain. Demethylases have now been identified for all methyl forms of four histone H3 sites: K4, K9, K27, and K36 [16]. Turnover of specific histone H3 methyl forms could occur either in situ on chromatin by enzymatic demethylation or by selective nucleosome replacement and subsequent degradation or demethylation of the evicted histone. H3.3 acts as a replacement histone: it is inserted into chromatin undergoing transcription-related histone turnover [17–19]. Drosophila nucleosome turnover has been measured across the genome, by metabolic labelling of newly synthesized histones [20]. Transcriptionally active genes show higher levels of nucleosome turnover, with particularly elevated levels of turnover at the transcription start sites (TSS): at these sites in Drosophila the mean nucleosome lifetime was calculated to be just 1 hour. Genome-wide analysis of replication-independent budding yeast nucleosome turnover found rapid turnover at active promoters and chromatin boundary elements (<30 min mean lifetime) [21].
Histone H3K4me3 is localized to the TSS of the majority of human genes, both expressed and repressed [7, 22]. In yeast the Set1 methyltransferase is responsible for all H3K4 methylation and is associated with RNA polII [23, 24]. In human cells there are at least 10 putative K4 methyltransferases, including ASH1 and the homologous family of Set1A, B and four MLL methyltransferases [25, 26]. H3K4me3 is demethylated by the JARID1 (KDM5) family of Jumonji demethylases [16, 27]. Demethylation has been shown to play a role in H3K4me3 removal upon repression of budding yeast genes [28] and at various Drosophila genomic loci through ChIP analysis, in combination with demethylase knock-down [29].
We and others have previously measured global histone methylation turnover [30–35]. Our strategy of labelling both the histone (heavy arginine) and the methyl groups (heavy methionine) with stable-isotopes allows us to follow the methylation turnover of old H3 in isolation from newly introduced methylation on new histones. This is in contrast to strategies that label either just the histone or just the methyl groups. Also in contrast to the papers cited above, we employ targeted mass spectrometry to quantify low abundance K4 methyl peptides and co-eluting isobaric forms with K27 and K36 methylation (e.g., H3K27me1-K36me2 and H3K27me2-K36me1 have the same intact mass). In contrast to the previously known fact that histone methylation turnover aggregated across all sites and forms is low [13], we identify significant variations in turnover at the level of methylation states and sites.
2 Materials and Methods
2.1 Cell culture, SILAC and sample preparation
For SILAC experiments HeLa cells were cultured for 5 days at 37 °C in customized double omission DMEM media (AthenaES) supplemented with [13C6]Arg and [13C1,D3]Met (Cambridge Isotope Laboratories, Inc.) and 10% dialyzed FBS (Sigma) before release into light DMEM media with 10% dialyzed FBS. Cells were harvested at 0, 4, 8, 24 and 48 h after release and flash frozen in liquid nitrogen and stored at −80 °C before sample preparation. For non-SILAC experiments HeLa cells were cultured in DMEM media and treated with 0.5 mM mimosine, 0.15 mM Desferoxamine, 0.15 mM CoCl2 or 0.25 mM FeSO4·7H2O for 24 h prior to harvesting. Histones were recovered from isolated nuclei using 0.4 N sulfuric acid extraction and were chemically derivatized using propionic anhydride and digested with trypsin, as previously described [36]. Briefly, about 5 μg of total histones were dissolved in 10 μl of 50 mM (NH4HCO3, mixed with 20 μl of reaction mixture (3:1 of methanol : propionic anhydride), ammonia was added to ensure pH >7, usually 5 μl, and the sample was incubated at 50 °C for 20 min. After two rounds of derivatization, histones were digested with 0.5 μg of trypsin at 37 °C for 16 hr. After an additional two rounds of derivatization, the digested peptide was diluted in 0.1% TFA.
2.2 RP-HPLC fractionation of histone H3.1
Histones were separated using a Jupiter C18 analytical column (Phenomenex), 15 cm × 4.6 mm, 5 μm diam., 300 Å pores, using a gradient of 30%–57% B in 90 min (Buffer A: 5% ACN, 0.1% TFA; Buffer B: 90% ACN, 0.094% TFA) at a flow rate of 0.8 ml/min.
2.3 Nano-LCMS
Peptide samples were analyzed by nano-LC-QqQ MS (Dionex nanoLC and a ThermoFisher Scientific TSQ Quantum). Peptides were loaded onto a C18 trapping column (2 cm × 150 μm; Jupiter C18 5μm) for five minutes at a flow-rate of 5 μl/min in 0.1% TFA loading buffer. Peptides were separated by a gradient from 2 to 35% acetonitrile over 26 minutes, in the presence of 0.1% FA. The analytical column (10 cm × 75 μm) consisted of the same C18 material as the trapping column; both were packed in-house.
The QQQ settings were as follows: collision gas pressure of 1.5 mTorr; Q1 peak width of 0.7 (FWHM); cycle time of 3.5 s; skimmer offset of 10 V; electrospray voltage of 2.6 kV. Nanospray was from a New Objective emitter with 10 μm tip (FS360-20-10-N-20-C12), attached to a custom-built stage.
2.4 SRM creation
SRMs were developed and data analyzed using Skyline software (v0.7; MacCoss Lab, University of Washington)[37, 38]. Briefly, method development consisted of surveying a wide range of predicted b and y ions for each peptide; where isobaric forms of the peptide existed (e.g. K27 and K36 methylation forms of the H3 27–40aa peptide), a minimum of three transitions per peptide were selected that distinguished between the different forms. The most intense of these fragment ions (from 3 to 5 ions per peptide) were selected for collision energy optimization. Synthetic methylated histone peptides (Anaspec) were employed in SRM development. Peptides covered all K4 methylation states, all K9 methylation states, K9 and K14 acetylation, all K27 methylation states, and all K36 methylations states; with the exception of the doubly acetylated K9K14 peptide, each peptide was only modified at a single position. The synthetic peptides spanned from H3 (1–21) and from H3 (21–44). They were propionylated and trypsin digested prior to use. The complete list of optimized SRM transitions is shown in Supp. Table 1 (Excel sheet). For the K27K36 peptide there are a few cases of channel contaminations caused by overlapping mass of precursor and fragment ions due to SILAC labelling (Supp. Table 2): these were corrected using specific ions (y1, y3 or y4 ions). Each SRM transition was monitored once every 5 s, with a minimum dwell time of 20 ms. This results in a minimum of six points across a 30 s peak for reliable quantification.
2.5 Data analysis
Data analysis was carried out in Skyline, with Savitzky-Golay smoothing of peaks. Automatic peak assignment and retention times were checked manually. Differently labelled SILAC species co-eluted; peak windows were manually tightened for each group as a whole instead of each SILAC intermediate to avoid bias. Total area was employed for downstream analysis in Excel. Where data is presented for a single modification, such as K27me1, the data is summed from all peptides containing the modification (i.e. K27me1K36me0, 1, 2, 3). The methylation decay rate were calculated from curve fitting with exponential model using the follow equation: y=a∗exp(-bt). Half-life was further calculated by equation: T1/2=ln2/b. Estimation of methylation and demethylation rate constants was solved by ordinary differential equations (ODE), using the kinetic scheme shown in Supp. Figure 6 and ODE45 solver (version 7.10; Matlab) as previously described [39]. Briefly, relative levels of 10 SILAC labelled species (normalized to total signal of old histone) were taken as surrogates for concentration and mass action kinetics were used to model the interconversion between labelled species using the 10 equations listed in Supp. Figure 6.
2.6 Simulation of methylation levels using rate constants
The Simbiology software package in Matlab (version 7.10) was employed as previously described [39]. Initial methylation levels were taken from unlabelled cells and the simulation was carried out using 1) the determined rate constants 2) demethylation rate constants set to zero. The rate constant for the synthesis of new histone and the dilution of old histone is estimated using control H3 peptide YQKSTELLIR.
3 Results and discussion
3.1 Slow establishment of H3 K9me3, K27me3, K36me3
We have previously devised a dual SILAC labelling scheme to study the turnover of previously existing methylation in asynchronously dividing mammalian. Due to the difficulties in discerning many isobaric species arising from highly similar histone peptide and dual SILAC labelling, our study was limited to H3K79 methylation when using extracted ion chromatogram as the method to quantitate data-dependent acquisition data from LC-FTMS [30]. With our recently developed selected reaction monitoring (SRM) targeted mass spectrometry assay implemented on a QqQ instrument, we are now able to distinguish this complex mixture of modified histone peptides [12, 39]. In this study, we investigate methylation kinetics from fractionated H3.1 (Figure 1B) for all five major methylation sites. As shown in Figure 1A, we cultured HeLa cells in media containing heavy arginine and methionine for 5 days, before switching to light media and harvesting time-points over the next 2 days (Figure 1A). Heavy methionine was efficiently utilised both in protein synthesis and as a substrate for methylation, as previously demonstrated (via S-adenosyl methionine; Supp Figure 1) [30, 32, 39]. At the point of switch-over (0 h), over 85% of the heavy-labelled histones (‘old’) will be from the previous cell cycle, with the remainder from the current cell cycle (Supp. Text). Comparing overall methylation levels on old and new histones at 24 h after the label switch, we see the old histones are over-methylated relative to the new histones: new histones are predominantly unmodified or monomethylated, compared to old histones which carry the majority of the dimethyl and trimethyl signal (Figure 1C). This is consistent with earlier work showing that new methylation occurs on old histones, with progressive additional methylation of lower methyl forms on old histones, in addition to de novo methylation on unmodified new and old histones [30, 34]. Over-methylation of old histones is observed for all detected trimethyl forms (K9, K27 and K36) with the exception of K4 trimethyl (Figure 1C inset). To understand the different methylation patterns established in old vs. new histones, we decided to compare the methylation turnover in these sites. We focus our turnover study on old histones where new methylation can be distinguished from old methylation for the measurement of a full cycle of turnover that includes both the removal of pre-existing methyl group and the subsequent addition of a new one (Figure 1A). By contrast, methylation found in new histones is only labelled by new methyl groups and therefore no true turnover can be determined.
Figure 1. Metabolic labelling shows old histones are overmethylated and new histones are undermethylated.
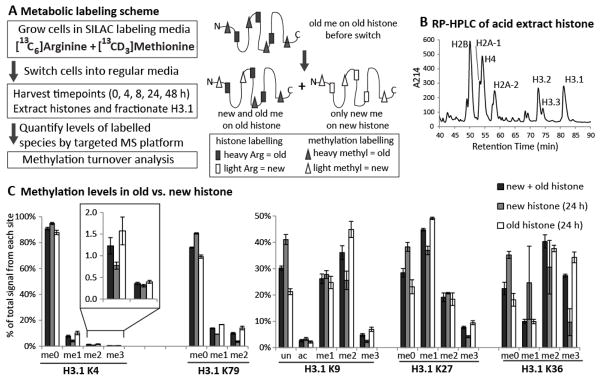
A) Metabolic labelling scheme B) Fractionation of histone H3.1 by RP-HPLC C) The relative methylation levels on old and new histone H3.1 of five major methylation sites measured by selected reaction monitoring quantitative mass spectrometry. Multiple channels were aggregated to compare the difference of methylation levels in new vs. old histone. Data from two biological replicates with 3 technical replicates of each are reported, with SEMs shown as error bars.
3.2 H3K4me3 turnover is fast
We observe significant variations in the rate of old fully-labelled trimethyl decay. Figure 2A,B show raw data for decay of K4 and K9 me3:3 (three methyl groups: three heavy/old; red trace) on old histones (labelled by heavy arginine), plotted alongside increase of the corresponding me3:0 (three methyl groups: three light/new; blue trace) on new histones. K4me3:3 decay is much more rapid than K9me3:3 decay, with more than 50% of the K4me3:3 signal gone by the 8 h time-point (a decrease from 0.46% at 0 h to 0.19% at 8 h, see the last panel in Supp. Figure 2A). To compare the decay rate of old trimethylation across all four H3 methylation sites with vastly different stoichiometries (Figure 1), the relative levels of each fully-labelled trimethyl species as a proportion of total peptide signal (corrects for any differences in total sample loading) are further normalized against values at 0 h. As shown in Figure 2C, K4me3:3 decay is much faster than me3:3 decay of K9, K27, and K36 of H3 (H3K79me3 was below the limit of detection). In addition, me3:3 decay values of K9, K27, and K36 are similar to the unmodified control peptide, Y54QKSTELLIR63 from histone H3. These decays are most simply explained by bulk dilution of old histones during on-going DNA replication. To remove the dilution effect of new histones in our data analysis, we perform all our analysis in the rest of the paper within the population of old histone as labelled by heavy arginine. As shown in Supp. Figure 2, signals of every labelled species found in old histones are normalized against the total signal from old histone. The trimethyl decay values with the dilution effect of new histone synthesis removed are re-plotted in Supp. Figure 3: this clearly demonstrates that K4me3:3 has the highest decay rate, followed by K36me3:3 whereas K9me3:3 and K27me3:3 are fairly stable over 50 h. The same rapid decay of K4me3:3 is also observed for bulk H3 in a multiple myeloma cell line (Supp. Figure 4), consistent with fast H3K4me3 turnover being general in human cells. K4me3 is present at the TSS of genes, with higher levels present at actively transcribed genes [40]. Our results are consistent either with high levels of K4me3 demethylation or with selective replacement of K4me3 nucleosomes (and subsequent degradation of the evicted K4me3 histone). Globally significant levels of K4me3 demethylation have been observed in Drosophila, where knockdown of KDM5/LID results in a 1.7-fold global increase in K4me3 levels [29]. Widespread K4me3 demethylation has also been shown to occur in yeast, in response to altered growth conditions (Radman-Livaja et al., 2010). On the other hand, nucleosome turnover has been shown to be highest at TSS of transcriptionally active genes in Drosophila and S. cerevisiae [20, 21]. A third possibility is that old K4me3 histones are additionally symmetrically methylated at R2, resulting in altered enzymatic cleavage and diversion of signal into a larger peptide (TK4QTAR to AR2TK4QTAR). We do not consider this explanation likely to account for the effect we observe: global levels R2me2s are as yet uncharacterised [41, 42] and we are unable to detect the predicted ARme2TKme3QTAR peptide from HeLa samples, suggesting it is present at levels significantly below K4me3.
Figure 2. Mass spectrometric raw data showing (A) decrease in old trimethyl K4 and (B) K9 on old histones and increase in new trimethyl K4 and K9 on new histones. (C) Decay of old histone fully-old trimethyl species (3:3).
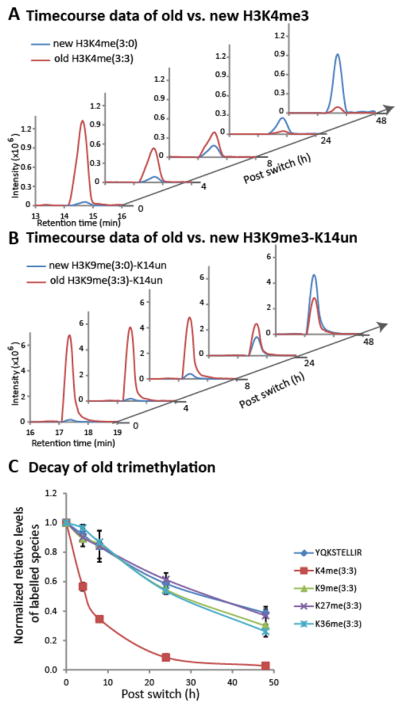
Relative levels of each labelled species as a percentage of the total peptide signal are further normalized to values at time 0 h. YQKSTELLIR is an unmodified control peptide, showing dilution of old histones due to on-going DNA replication and cell division. 3:3 indicates 3 methyl:3 old. Data (from histone H3.1) from two biological replicates with 3 technical replicates of each are reported, with SEMs shown as error bars.
To place the H3K4me3 turnover in context, we note that H3K4 is mainly unmodified (~90%; Figure 1C). K4 methylation is concentrated in K4me1 (7%). K4me3 accounts for approximately 0.5% of the total K4 signal. Supp. Figure 2 shows raw data for the differently labelled K4me3 across the time-course. Comparing turnover of K4me1, me2 and me3, we see that old, fully-labelled K4me1 (K4me1:1) is extremely stable; K4me2:2 shows turnover more similar to K4me3:3, although less rapid (Supp. Figure 2A, red lines). In this figure each old peptide signal is presented as a proportion of the total old peptide signal, removing the effect of dilution by new histones. In all cases new methylation continues to occur: for K4me3 and me2, the new methylation largely replaces the lost old methylation (Supp. Figure 2A, blue lines); for K4me1, the old K4me1 is static therefore the total level of monomethylation on old histones increases over the time-course. For K4me3 the me3:2 species increases most rapidly (Supp. Figure 2A, green line), suggesting that the fully labelled me2:2 dimethyl species is the preferred substrate for new trimethyl formation on old histones. By contrast, new K4me2 formation on old histones appears to use both K4me1:1 and unmodified K4 (Supp. Figure 2A, K4me2:0, K4me2:1 lines). This is consistent with ChIP-seq data showing distinct localization of K4me1 at enhancer elements, in addition to some K4me1 at TSS [43]. These substrate preferences are seen for K9, K27 and K36 too: new dimethyl is from me1 and me0; new me3 is mainly from me2 (Supp. Figure 2B,C,D).
3.3 The H3K9 site shows highest overall level of turnover, despite K9me3 stability
Interpretation of methylation turnover for me1 and me2 forms is complicated by additional new methylation, forming me2 and me3, resulting in mixed heavy and light species (Figure 3). Combining me1, me2 and me3 forms for each site avoids the complication of additional methylation when considering turnover: analyzing exclusively old histones, the initial levels of old methylation are compared to the levels of old methylation throughout the time-course; a decrease indicates turnover by demethylation or selective degradation (Supp. Figure 5). This approach allows calculation of site-specific overall methylation turnover: the K9 site shows the most rapid overall turnover of methylation with a half-live of 47 h, (Table 1A, bottom row). This half-life indicates that within one and a half cell cycles (cell cycle length of 34 h as estimated by the half-life of histone peptide YQKSTELLIR in the same experiment shown in Table 1C), half of the K9 methylation on old histones has been lost (independent of dilution effects, which have been normalized out). Half-lives for all fully-labelled methyl forms on old histones are also shown in Table 1A. It is interesting to compare the K4 and K9 sites: as discussed above, K4me3 decay is rapid, while K4me1 decay is slow; the situation for K9 is reversed, with rapid K9me1 turnover and highly stable K9me3. K9me1 is associated with transcriptionally active genes [40]. K9me2 methylation also shows rapid turnover, distinct from K9me3 stability. This difference in K9me2 and me3 stability may correspond to distinct genomic localizations and roles [44].
Figure 3. Methylation turnover in five major methylation sites of histone H3.1 and old H3.1 peptide turnover.
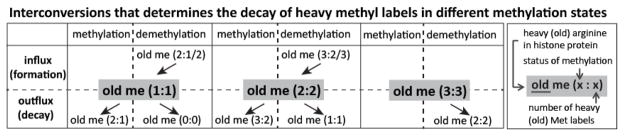
(A) Multiple influxes and outfluxes determine the decay rate of mono- and di-methyl species with all heavy labels, whereas a single demethylation reaction determines that of the trimethyl species.
Table 1.
Half-lives and effective rate constants
| A. Half-lives of three methylation states with all heavy (old) methyl labels | |||||
|---|---|---|---|---|---|
| T1/2 (h) | H3.1 K4 | H3.1 K9 | H3.1 K27 | H3.1 K36 | H3.1 K79 |
| me1:1 | 418 (± 6.8) | 23 (± 3.1) | 52 (± 16) | 44 (± 11) | 110 (± 33) |
| me2:2 | 24 (± 2.1) | 28.5 (± 0.04) | 57 (± 20) | 61 (± 7.4) | 176 (± 106) |
| me3:3 | 6.8 (± 0.6) | 221 (± 105) | 158 (± 23) | 57 (± 3.2) | N.D. |
| overall methyl | 117 (± 13) | 47.4 (± 0.6) | 89 (± 37) | 115 (± 21) | 555 (± 420) |
| B. Effective rate constants determined for each sites | ||||||
|---|---|---|---|---|---|---|
| k(×10 −2 h−1) | methylation | demethylation | ||||
| me0 → me1 | me1 → me2 | me2 → me3 | me1→ me0 | me2 → me1 | me3 → me2 | |
| H3.1 K4 | 0.11 (± 0.03) | 0.41 (± 0.04) | 1.9 (± 0.02) | 0.18 (± 0.04) | 3.6 (± 0.7) | 8 (± 1.4) |
| H3.1 K9 | 5.97 (± 0.06) | 4.5 (± 0.7) | 0.19 (± 0.02) | 4.8 (± 0.3) | 2.23 (± 0.09) | 0.3 (± 0.3) |
| H3.1 K27 | 3.58 (± 0.02) | 0.41 (± 0.08) | 0.54 (± 0.08) | 1.4 (± 0.5) | 1.1 (± 0.4) | 0.4 (± 0.2) |
| H3.1 K36 | 3 (± 1.2) | 5 (± 1.4) | 1.08 (± 0.03) | 4 (± 2) | 1.1 (± 0.2) | 1 (± 0.1) |
| H3.1 K79 | 0.32 (± 0.08) | 1.1 (± 0.1) | N.D. | 0.079 (± 0.004) | 0.5 (± 0.2) | N.D. |
| C. Half-life of histone H3.1 | |
|---|---|
| T1/2 (h) | |
| YQKSTELLIR | 33.6 (± 0.5) |
Our observation that K9 methylation shows the highest overall turnover in cycling cells complements the observations of Xu et al. who compared K9 and K79 turnover in arrested cells and found K9 turnover was significantly more rapid than K79 [34]. Our measured turnover levels are broadly consistent with previous studies, however these earlier studies are not directly comparable, as they focused on rates of new methylation (primarily of new histones) and employed different labelling strategies and cell synchronization treatments [31, 32, 34, 45]. To examine the me1 and me2 turnover in each individual site, we estimated effective rate constants using the M4K (Mass Spectrometry-based Measurement and Modelling of Histone Methylation Kinetics) approach (Supp. Figure 6)[39]. The rate constants of K4me3, K9me1 and K9me2 demethylation are high (8, 5 and 2 h−1, respectively), while the demethylation rate constants of K4me1 and K9me3 are low (0.18 and 0.3 h−1, respectively; Table 1B). It is also worth noting that the methylation rate constant of K9me1 is the second highest among all five sites, which also contributes to the fast decay of K9me1:1. As shown in Figure 3, both methylation and demethylation can lead to the disappearance of me1:1.
3.4 Demethylase inhibitors
The ideal approach to further examine differences in demethylation rates between sites is to use a general demethylase inhibitor. Since ferrous iron is the key cofactor for Jumonji family demethylases, iron chelators are expected to inhibit these demethylases. Indeed, treating cells with mimosine (Figure 4) and deferoxamine (Supp. Figure 7), both iron chelators, increases levels of methylation at K9me2, K9me3 and K36me3; as expected, addition of iron reverses these effects (Supp. Figure 7). Mimosine and deferoxamine also: 1)inhibit the iron-dependent ribonucleotide reductase enzyme; 2)arrest cells prior to the start of S-phase; and 3)activate HIF-1 [46–48]. CoCl2 also activates HIF-1 however we do not see an effect on methylation levels, suggesting that HIF-1 activation is not responsible for the changes we see with mimosine and deferoxamine. The lack of effect is contrary to an earlier report using CoCl2 on a different cell line [49]. A double thymidine treatment arrests cell at the start of S-phase by blocking the ribonucleotide reductase enzyme (Supp. Figure 8), however the effect on methylation levels at K9 and K36 due to this thymidine arrest is small (Figure 4). K4me2 and K4me3 increase after both thymidine arrest and mimosine treatment, suggesting the effect seen is not specific to demethylase inhibition.
Figure 4. Effect of iron chelator on methylation levels.

HeLa H3.1 methylation levels of: asynchronous population; double-thymidine G/S1 phase arrest; 0.5 mM mimosine treated for 24; 48 h; and 72 h. Thymidine arrest is used to control for arrest at S phase. Data from 3 technical replicates of each are reported with standard deviation shown as error bars.
Analyzing the K27 and K36 methylation changes, we see the largest increases in K27me1 and K36me3; with only minor or undetectable increase for the other methyl forms. This can be interpreted in light of previous data showing the bi-directional antagonism of higher methylation forms of K36 and K27 [39, 50, 51]: there is relatively little scope for additional K27 methylation to K27me2 or K27me3 to occur (Supp. Figure 9). After treatment with iron chelators, K9me2 and K9me3 methylation increase significantly, in agreement with the previously reported increase in K9me2 [48]. Interpretation of these changes is complicated by the dual effect of these iron chelators on demethylases and cell cycle progression [46–48]. However if we assume the effects we observe are due to Fe-dependent demethylase inhibition, we can model the expected change in methylation levels after 24 h with demethylation rates set to zero (Supp. Figure 10). The prediction matches the experimental data closely for all K9 methyl forms, and reasonably well for K27 and K36. K9me2 is predicted to show the greatest increase in methylation, agreeing with our experimental data.
4 Concluding remarks
We present a site- and form-specific analysis of methylation stability and find significant differences in turnover both across different histone H3 sites and across different methyl forms within sites. H3K9me3 and H3K27me3 are both extremely stable marks (t1/2 ≫ cell cycle length), by contrast H3K36me3 shows intermediate stability and H3K4me3 turns over rapidly (t1/2 ≪ cell cycle length). We interpret these differences in terms of genomic localization to regions of heterochromatin (K9me3, K27me3) or regions of transcription (K4me3, K36me3). To account for the highly unstable K4me3 that we observe, we consider two models (Figure 5B): 1) K4me3 demethylases are highly active in comparison to other trimethyl demethylases; 2) K4me3 occurrence at TSS leaves it especially vulnerable to transcription-dependent nucleosome eviction and degradation. Nucleosomes pose a barrier to the transcribing RNA polymerase. In vitro data suggests polymerase passage can result in retrograde movement of nucleosomes [52, 53]. A genomic analysis of budding yeast nucleosome positioning, using an epitope-tag switch system to track old nucleosomes, found higher levels of old nucleosomes at 5′ ends of long genes, consistent with retrograde movement of these nucleosomes (and eventual loss at the TSS) [54]. We suggest that the combination of retrograde movement of nucleosomes towards the TSS and the requirement to keep the TSS free of nucleosomes results in a high loss of nucleosomes close to the TSS. These nucleosomes are enriched in K4me3, resulting in the observed rapid K4me3 turnover. To explain the difference between K4me3 and K36me3 stability, our model assumes that nucleosomes proximal to the TSS are particularly destabilized; this assumption is compatible with both Drosophila and budding yeast data [20, 21]. The Drosophila and yeast datasets differ with respect to the stability of gene-body nucleosomes: those of yeast appear to be stable, while those of Drosophila appear to be almost as unstable as the TSS. The stability of K36me3 compared to K4me3 suggests that nucleosomes associated with human gene bodies may also be relatively stable. We also see wide variations in methylation stability for me1 and me2 forms: K4me1 is remarkably stable, while K9me1 is unstable. Therefore the me1 forms and me3 forms show inverse stability at the K4 and K9 sites.
Figure 5.

Model showing: (A) distribution of K4 methylation and K36me3 or nucleosome exchange rate across a gene; (B) two possible scenarios creating rapid K4me3 turnover and intermediate K36me3 turnover. CDS = coding DNA sequence. Filled circles indicate old methylation, open circles indicate new methylation. Number of circles represents the number of methyl groups.
Supplementary Material
Figure/table captions
Figures
Tables
Acknowledgments
This work was supported by Northwestern University, The Chicago Biomedical Consortium with support from the Searle Funds at The Chicago Community Trust, a gift from the Zell Family to the Robert H. Lurie Comprehensive Cancer Center, NIH R01 GM 067193-09 (to NLK), and the Northwestern University Physical Sciences Oncology Center (U54 CA 143869).
Abbreviations
M4K
Mass Spectrometry-based Measurement and Modelling of histone Methylation Kinetics
me1
monomethyl
me2
dimethyl
me3
trimethyl
TSS
transcription start site
Footnotes
Author contributions
SMMS, YZ designed experiments, carried out experimental work, data analysis and wrote the paper. JDT assisted with QQQ transition development. PMT assisted with data analysis. NLK conceived the project and wrote the paper. All authors approved the manuscript.
The authors declare that they have no conflict of interest.
References
- 1.Moazed D. Mechanisms for the Inheritance of Chromatin States. Cell. 2011;146:510–518. doi: 10.1016/j.cell.2011.07.013. [DOI] [PMC free article] [PubMed] [Google Scholar]
- 2.Kouzarides T. Chromatin Modifications and Their Function. Cell. 2007;128:693–705. doi: 10.1016/j.cell.2007.02.005. [DOI] [PubMed] [Google Scholar]
- 3.Filion GJ, van Bemmel JG, Braunschweig U, Talhout W, et al. Systematic Protein Location Mapping Reveals Five Principal Chromatin Types in Drosophila Cells. Cell. 2010;143:212–224. doi: 10.1016/j.cell.2010.09.009. [DOI] [PMC free article] [PubMed] [Google Scholar]
- 4.Ernst J, Kellis M. Discovery and characterization of chromatin states for systematic annotation of the human genome. Nat Biotech. 2010;28:817–825. doi: 10.1038/nbt.1662. [DOI] [PMC free article] [PubMed] [Google Scholar]
- 5.Ernst J, Kheradpour P, Mikkelsen TS, Shoresh N, et al. Mapping and analysis of chromatin state dynamics in nine human cell types. Nature. 2011;473:43–49. doi: 10.1038/nature09906. [DOI] [PMC free article] [PubMed] [Google Scholar]
- 6.Kharchenko PV, Alekseyenko AA, Schwartz YB, Minoda A, et al. Comprehensive analysis of the chromatin landscape in Drosophila melanogaster. Nature. 2011;471:480–485. doi: 10.1038/nature09725. [DOI] [PMC free article] [PubMed] [Google Scholar]
- 7.Barski A, Cuddapah S, Cui K, Roh TY, et al. High-resolution profiling of histone methylations in the human genome. Cell. 2007;129:823–37. doi: 10.1016/j.cell.2007.05.009. [DOI] [PubMed] [Google Scholar]
- 8.Allfrey VG, Faulkner R, Mirsky AE. Acetylation and methylation of histones and their possible role in the regulation of RNA synthesis. Proceedings of the National Academy of Sciences. 1964;51:786–794. doi: 10.1073/pnas.51.5.786. [DOI] [PMC free article] [PubMed] [Google Scholar]
- 9.Bradbury EM. Histones, Chromatin Structure, and Control of Cell Division. In: Moscona AA, Alberto M, editors. Current Topics in Developmental Biology. Academic Press; 1975. pp. 1–13. [DOI] [PubMed] [Google Scholar]
- 10.Shahbazian MD, Grunstein M. Functions of Site-Specific Histone Acetylation and Deacetylation. Anne Rev Biochem. 2007;76:75–100. doi: 10.1146/annurev.biochem.76.052705.162114. [DOI] [PubMed] [Google Scholar]
- 11.Banerjee T, Chakravarti D. A peek into the complex realm of histone phosphorylation. Mol Cell Biol. 2011 doi: 10.1128/MCB.05631-11. MCB.05631–11. [DOI] [PMC free article] [PubMed] [Google Scholar]
- 12.Zheng Y, Thomas PM, Kelleher NL. Measurement of acetylation turnover at distinct lysines in human histones identifies long-lived acetylation sites. Nat Commun. 2013;4 doi: 10.1038/ncomms3203. [DOI] [PMC free article] [PubMed] [Google Scholar]
- 13.Byvoet P, Shepherd GR, Hardin JM, Noland BJ. The distribution and turnover of labeled methyl groups in histone fractions of cultured mammalian cells. Archives of Biochemistry and Biophysics. 1972;148:558–567. doi: 10.1016/0003-9861(72)90174-9. [DOI] [PubMed] [Google Scholar]
- 14.Shi Y, Lan F, Matson C, Mulligan P, et al. Histone Demethylation Mediated by the Nuclear Amine Oxidase Homolog LSD1. Cell. 2004;119:941–953. doi: 10.1016/j.cell.2004.12.012. [DOI] [PubMed] [Google Scholar]
- 15.Tsukada Y-i, Fang J, Erdjument-Bromage H, Warren ME, et al. Histone demethylation by a family of JmjC domain-containing proteins. Nature. 2006;439:811–816. doi: 10.1038/nature04433. [DOI] [PubMed] [Google Scholar]
- 16.Mosammaparast N, Shi Y. Reversal of Histone Methylation: Biochemical and Molecular Mechanisms of Histone Demethylases. Anne Rev Biochem. 2010;79:155–179. doi: 10.1146/annurev.biochem.78.070907.103946. [DOI] [PubMed] [Google Scholar]
- 17.Schwartz BE, Ahmad K. Transcriptional activation triggers deposition and removal of the histone variant H3.3. Genes & Dev. 2005;19:804–814. doi: 10.1101/gad.1259805. [DOI] [PMC free article] [PubMed] [Google Scholar]
- 18.Mito Y, Henikoff JG, Henikoff S. Genome-scale profiling of histone H3.3 replacement patterns. Nat Genet. 2005;37:1090–1097. doi: 10.1038/ng1637. [DOI] [PubMed] [Google Scholar]
- 19.Ahmad K, Henikoff S. The Histone Variant H3.3 Marks Active Chromatin by Replication-Independent Nucleosome Assembly. Molecular Cell. 2002;9:1191–1200. doi: 10.1016/s1097-2765(02)00542-7. [DOI] [PubMed] [Google Scholar]
- 20.Deal RB, Henikoff JG, Henikoff S. Genome-Wide Kinetics of Nucleosome Turnover Determined by Metabolic Labeling of Histones. Science. 2010;328:1161–1164. doi: 10.1126/science.1186777. [DOI] [PMC free article] [PubMed] [Google Scholar]
- 21.Dion MF, Kaplan T, Kim M, Buratowski S, et al. Dynamics of Replication-Independent Histone Turnover in Budding Yeast. Science. 2007;315:1405–1408. doi: 10.1126/science.1134053. [DOI] [PubMed] [Google Scholar]
- 22.Guenther MG, Levine SS, Boyer LA, Jaenisch R, et al. A Chromatin Landmark and Transcription Initiation at Most Promoters in Human Cells. Cell. 2007;130:77–88. doi: 10.1016/j.cell.2007.05.042. [DOI] [PMC free article] [PubMed] [Google Scholar]
- 23.Briggs SD, Bryk M, Strahl BD, Cheung WL, et al. Histone H3 lysine 4 methylation is mediated by Set1 and required for cell growth and rDNA silencing in Saccharomyces cerevisiae. Genes & Development. 2001;15:3286–3295. doi: 10.1101/gad.940201. [DOI] [PMC free article] [PubMed] [Google Scholar]
- 24.Krogan NJ, Dover J, Wood A, Schneider J, et al. The Paf1 Complex Is Required for Histone H3 Methylation by COMPASS and Dot1p: Linking Transcriptional Elongation to Histone Methylation. Molecular Cell. 2003;11:721–729. doi: 10.1016/s1097-2765(03)00091-1. [DOI] [PubMed] [Google Scholar]
- 25.Eissenberg JC, Shilatifard A. Histone H3 lysine 4 (H3K4) methylation in development and differentiation. Developmental Biology. 2010;339:240–249. doi: 10.1016/j.ydbio.2009.08.017. [DOI] [PMC free article] [PubMed] [Google Scholar]
- 26.Ruthenburg AJ, Allis CD, Wysocka J. Methylation of Lysine 4 on Histone H3: Intricacy of Writing and Reading a Single Epigenetic Mark. Molecular Cell. 2007;25:15–30. doi: 10.1016/j.molcel.2006.12.014. [DOI] [PubMed] [Google Scholar]
- 27.Seward DJ, Cubberley G, Kim S, Schonewald M, et al. Demethylation of trimethylated histone H3 Lys4 in vivo by JARID1 JmjC proteins. Nature structural & molecular biology. 2007;14:240–2. doi: 10.1038/nsmb1200. [DOI] [PubMed] [Google Scholar]
- 28.Radman-Livaja M, Liu CL, Friedman N, Schreiber SL, et al. Replication and Active Demethylation Represent Partially Overlapping Mechanisms for Erasure of H3K4me3 in Budding Yeast. PLoS Genet. 2010;6:e1000837. doi: 10.1371/journal.pgen.1000837. [DOI] [PMC free article] [PubMed] [Google Scholar]
- 29.Lloret-Llinares M, Pérez-Lluch S, Rossell D, Morán T, et al. dKDM5/LID regulates H3K4me3 dynamics at the transcription-start site (TSS) of actively transcribed developmental genes. Nucleic Acids Research. 2012;40:9493–9505. doi: 10.1093/nar/gks773. [DOI] [PMC free article] [PubMed] [Google Scholar]
- 30.Sweet SMM, Li M, Thomas PM, Durbin KR, et al. Kinetics of Re-establishing H3K79 Methylation Marks in Global Human Chromatin. Journal of Biological Chemistry. 2010;285:32778–32786. doi: 10.1074/jbc.M110.145094. [DOI] [PMC free article] [PubMed] [Google Scholar]
- 31.Zee B, Levin R, DiMaggio P, Garcia B. Global turnover of histone post-translational modifications and variants in human cells. Epigenetics & Chromatin. 2010;3:22. doi: 10.1186/1756-8935-3-22. [DOI] [PMC free article] [PubMed] [Google Scholar]
- 32.Zee BM, Levin RS, Xu B, LeRoy G, et al. In vivo residue-specific histone methylation dynamics. Journal of Biological Chemistry. 2010;285:3341–3350. doi: 10.1074/jbc.M109.063784. [DOI] [PMC free article] [PubMed] [Google Scholar]
- 33.Scharf AND, Barth TK, Imhof A. Establishment of Histone Modifications after Chromatin Assembly. Nucl Acids Res. 2009;37:5032–5040. doi: 10.1093/nar/gkp518. [DOI] [PMC free article] [PubMed] [Google Scholar]
- 34.Xu M, Wang W, Chen S, Zhu B. A model for mitotic inheritance of histone lysine methylation. EMBO Rep. 2012;13:60–67. doi: 10.1038/embor.2011.206. [DOI] [PMC free article] [PubMed] [Google Scholar]
- 35.Zee BM, LMPL, Britton MP, Wolle D, Haberman DM, et al. Origins and formation of histone methylation across the human cell cycle. Molecular and Cellular Biology. 2012;32:2503–14. doi: 10.1128/MCB.06673-11. [DOI] [PMC free article] [PubMed] [Google Scholar]
- 36.Garcia BA, Mollah S, Ueberheide BM, Busby SA, et al. Chemical derivatization of histones for facilitated analysis by mass spectrometry. Nat Protoc. 2007;2:933–8. doi: 10.1038/nprot.2007.106. [DOI] [PMC free article] [PubMed] [Google Scholar]
- 37.MacLean B, Tomazela DM, Abbatiello SE, Zhang S, et al. Effect of Collision Energy Optimization on the Measurement of Peptides by Selected Reaction Monitoring (SRM) Mass Spectrometry. Analytical Chemistry. 2010;82:10116–10124. doi: 10.1021/ac102179j. [DOI] [PMC free article] [PubMed] [Google Scholar]
- 38.MacLean B, Tomazela DM, Shulman N, Chambers M, et al. Skyline: an open source document editor for creating and analyzing targeted proteomics experiments. Bioinformatics. 2010;26:966–968. doi: 10.1093/bioinformatics/btq054. [DOI] [PMC free article] [PubMed] [Google Scholar]
- 39.Zheng Y, Sweet SMM, Popovic R, Martinez-Garcia E, et al. Total kinetic analysis reveals how combinatorial methylation patterns are established on lysines 27 and 36 of histone H3. Proceedings of the National Academy of Sciences. 2012;109:13549–13554. doi: 10.1073/pnas.1205707109. [DOI] [PMC free article] [PubMed] [Google Scholar]
- 40.Barski A, Cuddapah S, Cui K, Roh TY, et al. High-Resolution Profiling of Histone Methylations in the Human Genome. Cell. 2007;129:823–837. doi: 10.1016/j.cell.2007.05.009. [DOI] [PubMed] [Google Scholar]
- 41.Migliori V, Müller J, Phalke S, Low D, et al. Symmetric dimethylation of H3R2 is a newly identified histone mark that supports euchromatin maintenance. Nat Struct Mol Biol. 2012;19:136–144. doi: 10.1038/nsmb.2209. [DOI] [PubMed] [Google Scholar]
- 42.Yuan C-C, Matthews Adam GW, Jin Y, Chen Chang F, et al. Histone H3R2 Symmetric Dimethylation and Histone H3K4 Trimethylation Are Tightly Correlated in Eukaryotic Genomes. Cell Reports. 2012;1:83–90. doi: 10.1016/j.celrep.2011.12.008. [DOI] [PMC free article] [PubMed] [Google Scholar]
- 43.Heintzman ND, Hon GC, Hawkins RD, Kheradpour P, et al. Histone modifications at human enhancers reflect global cell-type-specific gene expression. Nature. 2009;459:108–112. doi: 10.1038/nature07829. [DOI] [PMC free article] [PubMed] [Google Scholar]
- 44.Peters AHFM, Kubicek S, Mechtler K, O’Sullivan RJ, et al. Partitioning and Plasticity of Repressive Histone Methylation States in Mammalian Chromatin. Molecular Cell. 2003;12:1577–1589. doi: 10.1016/s1097-2765(03)00477-5. [DOI] [PubMed] [Google Scholar]
- 45.Zee BM, Britton LMP, Wolle D, Haberman DM, et al. Origins and Formation of Histone Methylation across the Human Cell Cycle. Molecular and Cellular Biology. 2012;32:2503–2514. doi: 10.1128/MCB.06673-11. [DOI] [PMC free article] [PubMed] [Google Scholar]
- 46.Park S, Im J, Park S, Kim S, et al. Mimosine arrests the cell cycle prior to the onset of DNA replication by preventing the binding of human Ctf4/And-1 to chromatin via Hif-1α activation in HeLa cells. Cell Cycle. 2012;11:761–6. doi: 10.4161/cc.11.4.19209. [DOI] [PubMed] [Google Scholar]
- 47.Krude T. Mimosine arrests proliferating human cells before onset of DNA replication in a dose-dependent manner. Exp Cell Res. 1999;247:148–159. doi: 10.1006/excr.1998.4342. [DOI] [PubMed] [Google Scholar]
- 48.Chen H, Yan Y, Davidson TL, Shinkai Y, et al. Hypoxic Stress Induces Dimethylated Histone H3 Lysine 9 through Histone Methyltransferase G9a in Mammalian Cells. Cancer Research. 2006;66:9009–9016. doi: 10.1158/0008-5472.CAN-06-0101. [DOI] [PubMed] [Google Scholar]
- 49.Li Q, Ke Q, Costa M. Alterations of histone modifications by cobalt compounds. Carcinogenesis. 2009;30:1243–1251. doi: 10.1093/carcin/bgp088. [DOI] [PMC free article] [PubMed] [Google Scholar]
- 50.Schmitges Frank W, Prusty Archana B, Faty M, Stützer A, et al. Histone Methylation by PRC2 Is Inhibited by Active Chromatin Marks. Molecular Cell. 2011;42:330–341. doi: 10.1016/j.molcel.2011.03.025. [DOI] [PubMed] [Google Scholar]
- 51.Yuan W, Xu M, Huang C, Liu N, et al. H3K36 methylation antagonizes PRC2 mediated H3K27 methylation. J Biol Chem. 2011 doi: 10.1074/jbc.M110.194027. [DOI] [PMC free article] [PubMed] [Google Scholar]
- 52.Hodges C, Bintu L, Lubkowska L, Kashlev M, et al. Nucleosomal Fluctuations Govern the Transcription Dynamics of RNA Polymerase II. Science. 2009;325:626–628. doi: 10.1126/science.1172926. [DOI] [PMC free article] [PubMed] [Google Scholar]
- 53.Studitsky VM, Kassavetis GA, Geiduschek EP, Felsenfeld G. Mechanism of Transcription Through the Nucleosome by Eukaryotic RNA Polymerase. Science. 1997;278:1960–1963. doi: 10.1126/science.278.5345.1960. [DOI] [PubMed] [Google Scholar]
- 54.Radman-Livaja M, Verzijlbergen KF, Weiner A, van Welsem T, et al. Patterns and Mechanisms of Ancestral Histone Protein Inheritance in Budding Yeast. PLoS Biol. 2011;9:e1001075. doi: 10.1371/journal.pbio.1001075. [DOI] [PMC free article] [PubMed] [Google Scholar]
Associated Data
This section collects any data citations, data availability statements, or supplementary materials included in this article.
Supplementary Materials
Figure/table captions
Figures
Tables