Host Genetic Variants in the Interleukin-6 Promoter Predict Poor Outcome in Patients with Estrogen Receptor-Positive, Node-Positive Breast Cancer (original) (raw)
. Author manuscript; available in PMC: 2015 Jan 23.
Abstract
Interleukin-6 (IL-6) modulates immune response, estrogen production and growth pathways in breast cancer. We evaluated the effect of several common, functional IL-6 promoter variants in node-positive breast cancer patients enrolled on a multicenter, cooperative group, adjuvant chemotherapy trial to determine whether these variants were associated with clinical outcome overall and by estrogen-receptor tumor phenotype.
Genomic DNA and clinical data were collected from a clinical trial of adjuvant anthracycline-based chemotherapy followed by randomization to high-dose cyclophosphamide/thiotepa or observation (INT-0121). Genotyping for -174G>C (rs1800795), -597G>A (rs1800797) and -572G>C (rs1800796) was performed by site-specific PCR and PyroSequencing, while the -373AnTn repeat was directly sequenced. Log-rank tests and Cox modeling were used to compare outcomes by genotype/haplotype and other factors.
346 patients (64% of trial) had corresponding genotype/clinical data available and did not differ from overall trial participants. After adjustment, patients with ER positive tumors and genotypes 597GG or 174GG had significantly worse disease-free survival (DFS) (HR 1.6, p=0.02 and HR 1.71, p=0.007, respectively), while the 373 8A12T repeat appeared to be protective (HR 0.62, p=0.02). The presence of at least one copy of the haplotype [-597G;-572G;-373[10A/11T];-174G]) was associated with worse DFS (HR 1.46, p=0.04). Kaplan-Meier plots show that all patients in this group relapsed by 24 months from diagnosis. This poor risk haplotype was quite common overall (estimated frequency 0.20) and twice as frequent among Blacks (estimated frequency 0.41).
Keywords: Breast Cancer, Polymorphism, Cytokines, Interleukin-6
INTRODUCTION
Despite recent advances in early detection methods and treatment, breast cancer remains a common and significant health problem in the United States (1). Women diagnosed with tumor involving both the breast and 10 or more involved axillary lymph nodes have a high-risk for distant recurrence and half of all women will succumb to metastatic disease (2). Estrogen receptor positivity is typically considered a favorable prognostic marker (3). However, a substantial proportion of patients with ER-positive tumors relapse despite endocrine therapy (4).
Tumor-based genetic profiling techniques are currently under development to identify poor-prognosis, ER-positive subsets of patients. However, it is increasingly recognized that host markers, reflecting a variety of host-related processes including drug metabolism and tumor microenvironment, may also play an important role in modulating cancer behavior and response to therapy. Interleukin-6 (IL-6) is an inflammatory cytokine that has been implicated in the immune response to cancer (5) but also plays an important role in tumor progression and estrogen modulation (6). IL-6 provides direct signals for tumor cells, through specific cell membrane receptors triggering important intracellular signal pathways (7), leading to increased cell migration (8) and loss of apoptosis (9, 10). Additionally, IL-6 acts as a regulator of estrogen synthesis and aromatase activity in the peripheral tissues of normal and malignant breast tissue (11, 6). Functional polymorphisms in the promoter region of IL-6 control transcription and expression (12), providing genetic surrogates for host cytokine production that likely result in inter-individual variation in tumor exposure to this cytokine.
We previously reported an association between the IL-6-174GG genotype and decreased disease-free and overall survival among women with ER-positive, node-positive breast cancer (13). We subsequently sought to further evaluate the full complement of functional variants in the IL-6 promoter (-572G>C (rs1800796), -597G>A (rs1800797), -174G>C (rs1800795) and the AT repeat at position -373 (-838AnTn) in a large cohort of node-positive patients enrolled on a multicenter, cooperative group trial of adjuvant chemotherapy for breast cancer to determine whether other SNPs, combinations of SNPs or haplotype are associated with breast cancer outcome, particularly among women with ER-positive disease.
METHODS
We performed a retrospective cohort study utilizing genomic DNA derived from hematologic circulating or bone-marrow-derived stem cells and clinical data from breast cancer patients enrolled on Intergroup Trial 0121 (E2190/SWOG9061/CALGB 9496), a multicenter trial of high dose vs. standard dose adjuvant chemotherapy. Patients were included in the current study if they were enrolled in INT-0121 and had archival peripheral blood or bone marrow stem cells available for genomic DNA extraction and subsequent genotyping. Results of INT-0121 trial have been published previously (14). Briefly, 540 patients with ≥10 positive lymph nodes received conventional adjuvant therapy with four cycles of cyclophosphamide (C; 100 mg/m2, orally, days 1–14), doxorubicin (A; 30 mg/m2, intravenously, days 1, 8), and fluorouracil (F; 500 mg/m2, intravenously, days 1,8) followed by randomization to either observation or receipt of high-dose chemotherapy (HDC: cyclophosphamide (6 gm/m2) and thiotepa (800 mg/m2) over a four-day period) followed by stem cell rescue. Adjuvant tamoxifen was recommended for patients with estrogen receptor (ER) positive tumors.
The protocol specified stem cell collection at the completion of standard CAF. Specimens not utilized for autologous reinfusion were stored at −80 C at the ECOG Pathology Core Facility (Chicago, IL). The original INT-0121 consent form included language specifying that residual biological specimens would be used for future breast cancer research. Approval for the current study was obtained from the University of Pennsylvania Institutional Review Board and the ECOG Executive Committee.
The ECOG Pathology Core Facility at Northwestern University extracted DNA from hematologic stem cells with the EZ1 system (Qiagen, Inc). Genotyping was performed at the University of Pennsylvania. DNA samples were identified only by their assigned pathology identification number and clinical information was assigned a case identification number. Laboratory personnel did not have access to clinical outcome data. Genotypes for the -174G>C, -597G>A(15), and -572G>C SNPs were determined by PyroSequencing (Biotage, Charlottesville, VA, USA) (16). The -597G>A and -572G>C assays were multiplexed; genotyping for -174G>C was a simplex assay. Genotyping for the -373AnTn tract was performed as described by Kelberman et al. (17) with modifications to PCR conditions.
The ECOG Statistical Center (Boston, MA) performed additional follow-up and de-linked patient identifiers from the clinical data used in this analysis. Polymorphisms were analyzed for Hardy Weinberg Equilibrium (HWE) by Pearson chi-square and Haldane’s exact test. We formally tested for linkage dysequliibrium by assessing for each pair of SNPs or haplotypes, X and Y, with alleles {a, A} for X and {b, B} for Y (for example, if X = IL-6-174, then {a, A} = {C, G}), a standard measure of linkage disequilibrium |D’| = |P(X=a,Y=b)-P(X=a)P(Y=b)|/M, where M = min{P(X=a)P(Y=B),P(X=A)P(Y=b)} if P(X=a,Y=b)>P(X=a)P(Y=b), and M = min{P(X=a)P(Y=b),P(X=A)P(Y=B)} if P(X=a,Y=b)<P(X=a)P(Y=b). Since IL-6-373 has 4 levels, 4 different values of |D’| were computed by treating each of the 4 levels in turn as the value b (and combining the others in B). Fisher’s exact test was utilized to determine if polymorphisms were in linkage equilibrium with one another and to adjust for baseline demographics and disease characteristics.
The primary endpoint was DFS, defined as time from randomization to earliest recurrence, new breast cancer, or death. The secondary endpoint was overall survival, defined as time from randomization to death (14). All survival times were censored at time of last contact or on August 1, 2005 if subjects were alive and disease-free at that time. Log rank test p-values were used to determine associations between polymorphisms and DFS and OS. All associations of significance are based on two-sided tests. Cox proportional hazard regression models were also used for DFS and OS analysis. In the multivariable Cox models, we adjusted for metabolic genotypes, CYP3A4*1B and GSTM1, due to our previous finding that these cyclophosphamide-metabolizing genotypes were associated with outcome in this dataset (18).
Analyses were performed to model the associations between IL-6 promoter haplotype and outcome using the HAPSTAT program (Version 3.0; linsoft@bios.unc.edu). We utilized the methods of Lin and Zeng (19, 20, 21) which employs the Cox proportional hazards model (22) to generate maximum likelihood estimators and their variances in an unbiased, normally distributed and statistically efficient manner. It uses a weighted mixture based on the haplotype frequencies. We first inferred individual haplotypes for each subject, considering only those with frequencies greater than 1% in the modeling process. The frequency of each haplotype by race was estimated to determine if significant racial differences were present. To understand whether potential haplotype effects differed by race, an approach using the combined dataset, but assuming HWE only within each ethnic group was performed, as HAPSTAT does not support estimating haplotype distributions separately within subsets of the data. Due to the low level of phase ambiguity, we expect that there is no bias involved. Finally, we analyzed just the white race subset alone, since the other racial groups are too small to allow separate estimation of effects on DFS. P-values and estimated effects from these models were calculated and the tests and estimates for the effect of each haplotype are reported separately (that is, without adjustment for the effects of the other haplotypes).
RESULTS
A total of 433 DNA samples from E2190 archival bone marrow or peripheral blood stem cell specimens were obtained from the ECOG Pathology Coordinating Office. Of these, 52 samples did not have matches to ECOG clinical case numbers, and 31 were duplicate samples. For 4 of these 31 pairs of samples, at least one of the IL-6 genotypes was discordant so were excluded from analysis. The discordant polymorphisms varied between these four cases, suggesting that this was not a failure of one of the genotype assays. The remaining 27 subjects with duplicate samples had concordant results and were included in this analysis. Thus, a total of 346/540 subjects (64%) enrolled on E2190 were included in this analysis.
The clinical and tumor characteristics of the current study subjects were compared to the overall study cohort (Table 1). Patients in the current study were more likely to be on the BMT arm of the study (57% vs. 50%, p<0.001), and had slightly shorter 10-year DFS (39 vs. 43 months, p=0.02) but did not otherwise differ significantly from those not genotyped with respect to race, age, menopausal status, estrogen receptor status, involved lymph node number or tumor size. This cohort was primarily Caucasian (90%), 30% were under age 40, and more than two-thirds were premenopausal at the time of diagnosis.
Table 1.
Characteristics of Study Population: Genotyped Group vs. Overall Study Cohort
| Characteristic | Genotyped CohortN=346 | Full INT-0121 CohortN=540 | p-value |
|---|---|---|---|
| Median (IQR)2 | Median (IQR)2 | ||
| Age | 45 (39–50) | 44 (38–50) | 0.351 |
| Axillary LN Pos | 14 (11–19) | 14 (11–18) | 0.131 |
| Tumor Size, cm | 3.5 (2.1–5.0) | 3.5 (2.1–5.0) | 0.90 |
| Median Follow-up, years | 9.8 (8.3–11.2) | 9.7 (8.1–11.4) | 0.571 |
| Percent (%) | Percent (%) | ||
| Postmenopausal | 31 | 29 | 0.221 |
| Race – Caucasian | 90 | 89 | 0.581 |
| ER + | 59 | 60 | 0.701 |
| PR + | 56 | 59 | 0.121 |
| Lumpectomy | 17 | 19 | 0.101 |
| High-Dose Chemo Treatment Arm | 57 | 50 | <0.0011 |
| 10-year DFS (%) | 39 | 43 | 0.023 |
| 10-year OS (%) | 45 | 48 | 0.093 |
Frequencies for the IL-6 promoter genotype and haplotypes were calculated, both overall and by race (Table 2) Genotype failure rates were 5% for 174G>C and 373AT repeat, and 1% for 572G>C and 597G>A. The genotypic distributions and minor allele frequencies in our study were similar to those seen in published studies of other breast cancer populations (23, 24). Genotype frequencies are consistent with Hardy-Weinberg equilibrium within racial groups. There is strong evidence that the three SNPs are not in linkage equilibrium (p<0.0001 for each pair, Fisher’s exact test). Supplemental Table 1 shows estimated values of |D’| based the joint distribution of the SNPs for whites. For the haplotype distributions for blacks and other races, |D’| = 1 for all pairs. Comparison of the distributions of the three SNPs with the IL-6-373 variable repeat demonstrates that these similarly are not in linkage equilibrium. However, the 8A12T sequence appears to be strongly associated with the presence of the C allele for IL-6-173 and the A allele for IL-6-597. The presence of the 10A10T sequence appears to be associated with the presence of the C allele for IL-6-572. Associations between each variant and clinical characteristic demonstrated that all 4 variants were significantly associated with race (p<0.001 for each, Fisher’s exact test). Only IL-6-597 genotype was associated with ER status (ER positivity rates 48% for AA, 57% for AG and 66% for GG, respectively, p=0.04). Both IL-6-597 and IL-6-373 genotypes were significantly associated with number of positive lymph nodes (p=0.03 for each).
Table 2.
IL-6 Promoter Genotype and Haplotype Frequencies
| Locus | Genotype | All(n=346) | White(n=314) | Black(n=25) | Other(n=21) |
|---|---|---|---|---|---|
| −597 (7 failed) | AAAGGG | 61 (18)145 (43)133 (39) | 59 (19)140 (46)108 (35) | 0 (0)2 (11)16 (89) | 2 (14)3 (21)9 (64) |
| −572 (5 failed) | CCCGGG | 5 (1)36 (11)300 (88) | 1 (<1)30 (10)276 (90) | 0 (0)4 (21)15 (79) | 4 (27)2 (13)9 (60) |
| −373 (18 failed) | Any 8A12TNo 8A12T | 199 (61)129 (39) | 192 (64)106 (36) | 2 (12)14 (88) | 5 (38)8 (62) |
| −174 (18 failed) | CCCGGG | 57 (17)146 (45)125 (38) | 55 (19)140 (47)102 (34) | 0 (0)3 (17)15 (83) | 2 (14)3 (23)8 (62) |
| Estimated Haplotype Frequencies1(597-572-373[An/Tn]-174) | All (n=344) | White (n=310) | Black (n=19) | Other (n=15) | |
| G-C-[10/10]-G | 0.07 | 0.05 | 0.11 | 0.33 | |
| A-G-[8/12]-C | 0.38 | 0.40 | 0.05 | 0.26 | |
| G-G-[10/10]-G | 0.11 | 0.10 | 0.20 | 0.18 | |
| G-G-[9/11]-G | 0.22 | 0.22 | 0.23 | 0.14 | |
| G-G-[10/11]-G | 0.20 | 0.20 | 0.41 | 0.09 |
Thirteen distinct naturally-occurring haplotypes were generated by HAPSTAT; five haplotypes occurred in greater than 1% of the study population (n=331), as shown in Table 2. Haplotypes are described in order [-597;-572;-373;-174] moving from 5′ to 3′ along the promoter sequence. The different genotypes show strong linkage (tests for linkage disequilibrium were highly significant for each pair). There is little difference by ER status, but a substantial difference by race; therefore, we controlled for race in subsequent modeling of the effect of these haplotypes on DFS.
The 10-year DFS and OS for each genotype overall and by tumor ER status are shown in Table 3. In the group overall, only IL-6-174 genotype was associated with DFS, though of borderline significance (GG vs. CC/CG 32.3 months vs. 43.7 months, p=0.06) and not significantly associated with overall survival. However, among patients with ER positive tumors, IL-6-174, IL-6-597, and IL-6-373 SNPs were each significantly associated with DFS. Since these polymorphisms are very highly associated with each other, each has a roughly equivalent effect. This association carried over to overall survival only for IL-6-174, with GG genotype associated with worse survival than CC/CG (55.2 months vs. 31.8 months) though this was of only borderline significance (p=0.06). There were no significant associations between genotype and either DFS or OS among patients with ER-negative tumors.
Table 3.
Unadjusted Ten-year DFS and OS by Host Genotype and Tumor Estrogen Receptor Status
| 10-Year Disease-Free Survival (SE) | |||||||
|---|---|---|---|---|---|---|---|
| Locus | Genotype | Overall | p | ER-pos | p | ER-neg | p |
| IL-597 | AA, AGGG | (n=339)42.4 (3.5)34.9 (4.2) | 0.27 | 48.9 (5.0)30.1 (5.0) | 0.007 | 34.5 (5.0)44.2 (7.4) | 0.27 |
| IL-6-572 | CC, CGGG | (n=341)45.8 (7.9)38.3 (2.9) | 0.72 | 53.1 (9.5)38.3 (3.8) | 0.37 | 30.8 (12.8)38.1 (4.3) | 0.37 |
| IL-6-373 | Any 8A12TNo 8A12T | (n=326)42.1 (3.6)34.4 (4.2) | 0.21 | 48.3 (5.1)30.0 (5.1) | 0.01 | 34.2 (5.0)42.4 (7.2) | 0.45 |
| IL-6-174 | CC, CGGG | (n=326)43.7 (3.6)32.3 (4.2) | 0.06 | 49.3 (4.9)28.5 (5.2) | 0.003 | 35.9 (5.2)38.9 (7.2) | 0.76 |
| 10-Year Overall Survival (SE) | |||||||
| Locus | Genotype | Overall | p | ER-pos | p | ER-neg | p |
| IL-597 | AA, AGGG | (n=339)48.8 (3.6)39.9 (4.7) | 0.96 | (n=200)54.9 (4.9)33.4(5.8) | 0.09 | (n=139)41.4 (5.2)51.5 (7.7) | 0.17 |
| IL-6-572 | CC, CGGG | (n=341)47.8 (8.6)44.5 (3.0) | 0.66 | (n=201)54.8 (11.1)43.6 (4.1) | 0.17 | (n=140)30.8 (12.8)45.6 (4.6) | 0.09 |
| IL-6-373 | Any 8A12TNo 8A12T | (n=326)48.7 (3.6)38.7 (4.7) | 0.65 | (n=191)54.3 (5.0)33.8 (5.9) | 0.10 | (n=137)41.3 (5.2)46.8 (7.6) | 0.38 |
| IL-6-174 | CC, CGGG | (n=326)49.7 (3.6)37.1 (4.7) | 0.49 | (n=194)55.2 (4.8)31.8 (6.0) | 0.06 | (n=134)42.1 (5.3)45.8 (7.6) | 0.41 |
Because patients in the parent study were randomized between standard, anthracycline-based chemotherapy alone or with the addition of high-dose cyclophosphamide and thiotepa, effects within treatment groups were also examined. The only case in which there was a substantial difference between the two treatment arms was for IL-6-572 in the ER-negative subset; however the small sample size in this sub-analysis precluded formal association testing. Because there did not appear to be a significant effect by treatment arm, arms were combined for the remainder of the analyses.
Results of multivariable Cox proportional hazard modeling for individual SNPs are shown in Table 4. Of the baseline characteristics examined (Table 1), only age and race were significantly associated with outcome and were thus included in the adjusted analysis. Although there was a significant association of genotype with number of nodes, neither # nodes nor tumor size are significantly associated with DFS or OS in this cohort. Further adjustment for number of nodes and tumor size had little effect on the odds ratios for either DFS or OS (data not shown). Furthermore, we adjusted for drug-metabolizing enzyme SNPs in CYP3A4*1B and GSTM1 as prespecified in the analysis. To assess for proportionality of hazards, we applied the Grambsch-Therneau test to the fully-adjusted DFS model and found that estrogen receptor showed significant evidence of non-proportionality (p=0.003). Thus, a stratified multivariable Cox model was computed; the overall model was stratified on ER and separate models were fit to estimate the effects within the ER+ and ER- subsets. Disease-free survival is significantly worse for patients with ER-positive tumors who have either the -597 GG genotype or -174 GG genotype, as well as those with the -373[8A12T] variant compared to the reference groups The -174 GG genotype was borderline significantly associated with worse overall survival as was the -373[8A12T] variant. Among patients with ER-negative tumors, none of the individual genotypes were significantly associated with DFS or OS. Tests of interaction between ER status and genotype in the models stratified on ER that included the main effect of genotype plus the interaction term, showed significant interactions for each individual variant and ER status (ER x -597: Wald p= 0.01 for DFS and p=0.04 for OS; ER x -572: p=0.21 for DFS and p=0.03 for OS; ER x -373: p=0.03 for DFS and p=0.09 for OS; ER x -174: p=0.04 for DFS and p=0.07 for OS).
Table 4.
Adjusted1 Disease-Free Survival and Overall Survival by Host Genotype and Tumor Estrogen Receptor Status
| Genotype | Disease-Free Survival | Overall Survival | ||
|---|---|---|---|---|
| HR (95% CI) | p-value | HR (95% CI) | p-value | |
| Overall | ||||
| −597 GG/(AG or AA) | 1.12 (0.84, 1.51) | 0.43 | 0.99 (0.73, 1.36) | 0.97 |
| −572 GG/(GC or CC) | 1.19 (0.75, 1.87) | 0.46 | 1.15 (0.71, 1.86) | 0.57 |
| −373 8A12T/(no 8A12T) | 0.85 (0.64, 1.15) | 0.29 | 0.95 (0.69, 1.31) | 0.76 |
| −174 GG/(CG or CC) | 1.26 (0.94, 1.70) | 0.12 | 1.09 (0.80, 1.50) | 0.57 |
| Estrogen Receptor Positive | ||||
| −597 GG/(AG or AA) | 1.60 (1.09, 2.35) | 0.02 | 1.39 (0.93, 2.10) | 0.11 |
| −572 GG/(GC or CC) | 1.63 (0.90, 2.94) | 0.11 | 1.83 (0.95, 3.50) | 0.07 |
| −373 8A12T/(no 8A12T) | 0.62 (0.42, 0.92) | 0.02 | 0.69 (0.46, 1.06) | 0.09 |
| −174 GG/(CG or CC) | 1.71 (1.16, 2.52) | 0.007 | 1.48 (0.98, 2.24) | 0.06 |
| Estrogen Receptor Negative | ||||
| −597 GG/(AG or AA) | 0.68 (0.41, 1.14) | 0.15 | 0.62 (0.35, 1.09) | 0.10 |
| −572 GG/(GC or CC) | 0.78 (0.38, 1.60) | 0.49 | 0.54 (0.26, 1.11) | 0.10 |
| −373 8A12T/(no 8A12T) | 1.26 (0.77, 2.06) | 0.35 | 1.34 (0.79, 2.27) | 0.28 |
| −174 GG/(CG or CC) | 0.86 (0.52, 1.43) | 0.57 | 0.75 (0.44, 1.29) | 0.30 |
We also examined the effects of genotype on outcome in the ER-positive subset when other genotypes were included as covariates in the model. First, the IL-6 -174, -597, and -373 genotypes are so strongly linked that it is not possible to separate their effects. That is, -174 GG vs. other and -597 GG vs. other disagree for only 6 ER+ cases with data on both, -174 GG vs. other and -373 no 8A12T vs. any 8A12T disagree for only 6 ER+ cases with both evaluated, and 597 GG vs. other and -373 no 8A12T vs. any 8A12T disagree for only 2 ER+ cases with both evaluated. In joint models, the information about the relative effects comes from these discordant cases, and there are too few of these cases for the estimates to be meaningful. Also, the high colinearity between the indicator variables for these factors means that variances of the estimates are large, and in the joint models for pairs of these variables, neither is individually significant, although joint effect of both is highly significant.
Joint models fit for the effects of any of these 3 SNPs and -572 found that both are significant. For example, in the model with -174 and -572, the estimated hazard ratio (95% CI) for -174 is 2.04 (1.37, 3.05), p=0.0005, and for -572 is 2.38 (1.23, 4.60), p=0.01. This is essentially what drives the definition of the ‘good risk’ group, in that it is very similar to the group with at least one C allele for -174 (or nearly equivalently, at least one A allele for -597) or at least 1 C allele for -572. The -373 genotype is needed to differentiate the small poor risk group, but it seems appropriate to conclude that only one of -174 and -597 are needed.
Associations between haplotype (for those haplotypes with frequency >1%) and DFS were examined in the population with ER-positive tumors (Table 5). First, the effect of each haplotype on DFS was examined separately, assuming an additive effect. Race (white vs. black vs. other) was included in the models since there were differences in the distribution of the haplotypes for different racial groups, although it has little effect. Relative to other haplotypes, the A-G-[8/12]-C appears to be significantly protective (HR 0.69, 95% CI 0.52, 0.91), while G-G-[10/11]-G is associated with significantly worse DFS (HR 1.46, 95% CI 1.02, 2.09). The results assuming HWE and HW disequilibrium are nearly identical (the p-values for the test of HWE in the general model are > 0.50 for all models). The results for the analyses of the white race subset are also similar for the significant effects.
Table 5.
Associations between Haplotype and DFS in ER-positive Group (n=203)1
| Haplotype2 | HWE | HW Disequilibrium | HWE Caucasian Only | |||
|---|---|---|---|---|---|---|
| HR3(95% CI) | p | HR3(95% CI) | p | HR3(95% CI) | p | |
| G-C-[10/10]-G | 0.68(0.42, 1.08) | 0.10 | 0.68(0.42, 1.08) | 0.10 | 0.92(0.52, 1.63) | 0.79 |
| A-G-[8/12]-C | 0.69 (0.52, 0.91) | 0.009 | 0.69(0.52,0.91) | 0.009 | 0.64(0.48, 0.87) | 0.004 |
| G-G-[10/10]-G | 1.24(0.81,1.91) | 0.32 | 1.24(0.81,1.91) | 0.32 | 1.36(0.85, 2.19) | 0.20 |
| G-G-[9/11]-G | 1.31(0.94,1.84) | 0.11 | 1.31(0.93,1.84) | 0.12 | 1.22(0.86, 1.73) | 0.27 |
| G-G-[10/11]-G | 1.46 (1.02, 2.09) | 0.04 | 1.46(1.02, 2.10) | 0.04 | 1.49 (1.03, 2.16) | 0.03 |
For the combined race group, assuming HWE, the additive model with all 4 haplotypes had a significant overall likelihood ratio test (p=0.006 on 4df). For whites only, the additive model with all 4 haplotypes also had a significant overall likelihood ratio test (p=0.02 on 4df). The joint codominant model was also examined for the combined race group (the codominant model with all 4 haplotypes could not be fit for the white race subset). Comparing the model with codominant effects for the 4 haplotypes (plus race) to the model with only race, there is an overall significant haplotype effect (p<0.0001, likelihood ratio test on 8 degrees of freedom). Dropping haplotypes from this model in a backwards elimination scheme, the first haplotype eliminated is G-G-[10A10T]-G, which had p=0.58 in the joint model. The least significant haplotype of the 3 remaining is G-C-[10A10T]-G, for which the 2 df LRT has p=0.07. However, the effect is very consistent with additivity, and the 1 df test based on an additive model is significant. This model suggests combining the genotypes into 3 groups, based on the following rationale. First, both A-G-[8/12]-C and G-C-[10/10]-G are associated with better DFS relative to the reference set. We therefore created a single ‘good risk’ group consisting of subjects estimated to have at least one copy of one of these two haplotypes. The set of genotypes associated with at least one copy of these haplotypes (designated “Group A”) includes (AA,GG,8A12T/8A12T,CC), (AG,GG,8A12T/9A11T,CC), (AG,CG,8A12T/9A11T,CG), (AG,GG,8A12T/10A11T,CG), (AG,GG,8A12T/10A10T,CG), (AG,GG,8A12T/9A11T,CG), (GG,CC,10A10T/10A10T,GG), (GG,CG,10A10T/10A11T,GG), (GG, CG,10A10T/10A10T,GG), and (GG,CG,10A10T/9A11T,GG). Another group, considered “poor risk” (designated “Group C”) consists of the 6 cases with two copies the G-G-10/11-G haplotype, and have the worst DFS of the group, with early recurrences from 0.5 to 3.5 years from study entry. A third group (designated “Group B”) consists of the subjects whose genotypes are not in the other two groups, which for the set of 199 cases analyzed above consists of genotypes of the from (GG, GG, *, GG) and (GG, CG, *,GG), where * can be any combination of 10A10T, 10A11T and 9A11T (except the combination from the Group C genotype).
Kaplan-Meier estimates of DFS for these 3 groups are shown in Figure 1. The plot demonstrates a dose-response effect of haplotype group. Patients in Group A with the “good risk” haplotype have the best outcomes, those in Group C with the “poor risk “ haplotype have the worst outcomes and those in Group B have intermediate outcomes. The pair-wise comparisons (noted below the figure) for all groups are significant, suggesting that IL-6 promoter haplotype identifies distinct prognostic groups within the ER-positive subset. Notably, these prognostic groups are significantly associated with race, with a disproportionately greater percentage of blacks making up the poor risk group compared to the other two groups (33% Group C vs. 12.5% Group B vs. 3% Group A, pexact=0.03).
Figure 1.
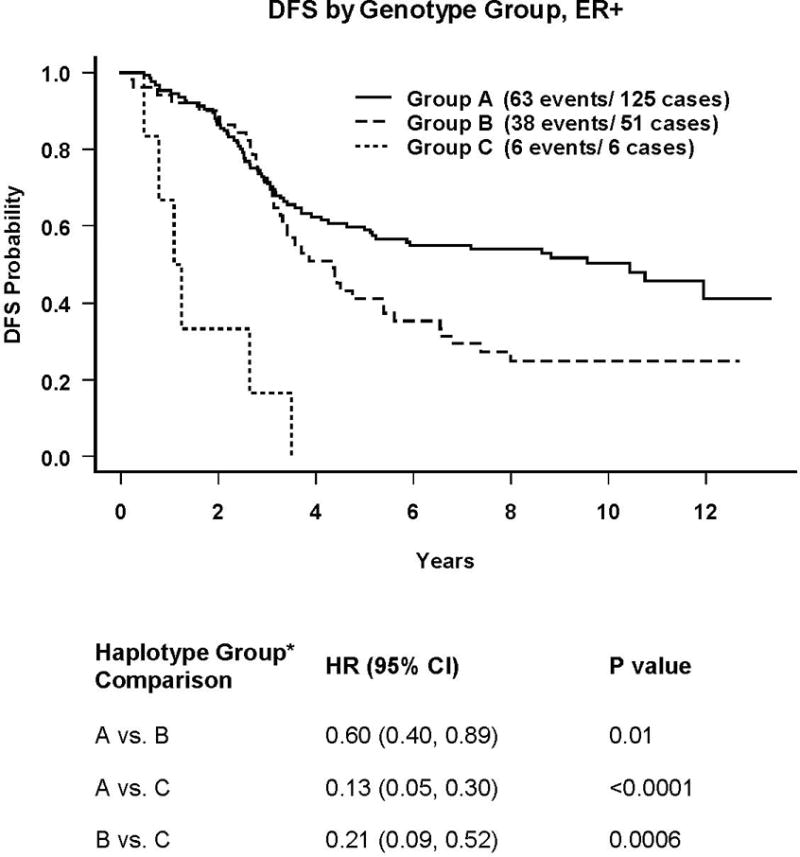
Group A: Subjects with at least one copy of either (G-C-[10A/10T]-G) or (A-G-[8A/12T]-C)
Group B: Subjects whose genotypes are not in the other two groups, which for the set of 199 cases analyzed above consists of genotypes of the from (GG, GG, *, GG,) and (GG, GG, *, CG), where * can be any combination of (10A10T), (10A11T) and (9A11T) (except the combination from the Group C genotype)
Group C: Patients with two copies of (G-G-[10A/11T]-G)
DISCUSSION
We have shown that several different IL-6 promoter genotypes and a specific haplotype have significantly worse outcomes than their counterparts. This study confirms and extends our earlier work (13) in a much larger and multicenter clinical cohort. Disease-free survival was significantly worse for those with the -597GG or -174GG genotypes, or the GG[10A/11T]G haplotype. For the latter, Kaplan-Meier plots show that all patients in this group relapsed by 24 months from diagnosis. This poor risk haplotype, GG[10A/11T]G, was quite common overall (estimated frequency 0.20) and twice as frequent among Blacks (estimated frequency 0.41).
These data shed new light on previous studies in which serum levels of IL-6 have been shown to be elevated in cancer patients relative to non-cancer controls (25, 26, 27). In a more recent study comparing IL-6 levels in normal, early breast cancer and metastatic breast cancer patients, Benoy et al. (28) found that serum IL-6 concentration was significantly higher in patients with breast cancer compared to healthy controls (p < 0.0001); median IL-6 serum levels were nearly 10 times higher in patients with metastatic breast cancer as compared to those with loco regional disease (6.0 pg/mL versus 0.7 pg/mL, respectively). Additional studies in metastatic breast cancer patients have shown high IL-6 serum levels to be associated with aggressive disease and poor clinical outcome. Zhang et al. demonstrated that serum IL-6 levels are higher in patients with more numerous metastatic sites and poorer survival (29). Several other investigators have found associations between high serum IL-6 levels and poor response to breast cancer therapy (30), including resistance to both chemotherapy (31) and hormonal therapy (32).
However, because there is tremendous intra-individual variation in IL-6 spot levels, even in non-pathological circumstances, and other factors, including medications, age, and nutritional status may impact IL-6 level, we sought to determine if genotype would be a more stable and robust marker for outcome. Data to date clearly support the functional significance of the -174G>C polymorphism in controlling gene transcription and subsequent serum levels of IL-6 and several studies have linked IL-6-174G>C genotype to serum levels, both in normal subjects, and in those suffering either chronic disease or acute illness (33, 34, 35). Moreover, work by Terry et al. (12) suggests that there are multiple functional SNPs in the promoter region and that these polymorphisms have additive effects on gene expression. Transfection studies in HeLa cells and the ECV304 cell line demonstrated that more than one of the polymorphisms was functional, the polymorphisms do not act independently, and one polymorphism influences the functional effect at the other polymorphism’s site. Haplotypes in the ECV304 cell line exhibited functional differences and transcription was increased in the -597G, -572G, -373 9A11T, -174G haplotype and decreased transcription in the -597A, -572G, -373 8A12T, -174G. Our study findings are consistent with these preclinical and clinical observations, demonstrating that high-production SNPs are associated with worse outcomes in breast cancer patients at high risk of relapse and that haplotype is a robust predictor of outcome.
Our finding that these effects are limited to those patients with ER-positive tumors provides further support for the hypothesis that IL-6 exerts its effect on breast cancer cells at least in part through hormonal pathways. Cytokines, such as IL-6 and TNF-α, have an important role in regulating estrogen synthesis in peripheral tissues, including normal and malignant breast tissues (36). In vitro, the activities of aromatase, estradiol, 17-beta-hydroxysteroid dehydrogenase and estrone sulfatase are all increased by IL-6 and TNF-α. We hypothesize that patients with ER-positive tumors and poor-risk haplotypes are likely to fail despite hormonal therapy because strong constitutive stimulation of aromatase, overwhelming the blockade by aromatase inhibitors in post-menopausal women or the blockade of ER receptors in those receiving tamoxifen, through competitive inhibition. We were unable to formally test this hypothesis in the current trial, as tamoxifen use was not documented in the trial participants, despite being dictated by the protocol. However, additional studies are ongoing to address this issue, and clarify whether IL-6 SNPs are prognostic or simply predictive of resistance to endocrine therapy. Finally, our observation that the “poor-risk” haplotype was significantly more prevalent in black patients bears further study in a larger black population. While the numbers in the current study are small, these findings, if confirmed, may shed light on an additional mechanism by which black patients with breast cancer suffer disproportionately poor outcomes compared to their white counterparts (37).
Several limitations must be considered in interpreting the current study. While tamoxifen was “recommended” for all subjects with ER-positive tumors in the parent clinical trial, no data were collected on patients in this trial with regard to prescription for tamoxifen or adherence among those prescribed the medication. However, it would be expected from results of other trials and population-based studies that this is likely to be less than 100% (38, 39), though the magnitude of this reduction is impossible to estimate in this study cohort of individuals at extremely high risk of recurrence. Based upon our hypothesis that increased IL-6 transcription increases aromatase activity, one could postulate that this effect might be enhanced by the absence of tamoxifen. However, this is likely to reflect the “real world” as tamoxifen non-adherence continues to be an issue. Whether IL-6 contributes to the experience of adverse drug effects, such as hot flashes, further contributing to non-adherence, is unknown.
The grouping of haplotypes by outcome is clearly exploratory, and statistical differences in these groups should be viewed as such. However, understanding differences in outcome by haplotype is critically important in identifying subpopulations for whom current therapy is insufficient and thus provides important information in selecting appropriate patients for testing of new agents directed at IL-6 related pathways.
Nonetheless, this is the largest study to date to provide strong evidence of a role for host IL-6 genotype in modulating outcomes in ER-positive breast cancer. Further studies are necessary to determine whether these differences are due to immune, hormonal or cell signalling effects in ER-positive breast cancer cells, potentially leading to the development of IL-6-targeted approaches to therapy and the ability to identify patients in whom these treatments are likely to be necessary and effective.
Supplementary Material
E2190 table 1 supplement
Acknowledgments
We are indebted to Sara McNally and Lauren Sherman for their support of this research effort.
References
- 1.Edwards BK, Brown ML, Wingo PA, et al. Annual report to the nation on the status of cancer, 1975–2002, featuring population-based trends in cancer treatment. J Natl Cancer Inst. 2005;97:1407–27. doi: 10.1093/jnci/dji289. [DOI] [PubMed] [Google Scholar]
- 2.Schmoor C, Sauerbrei W, Bastert G, Bojar H, Schumacher M. Long-term prognosis of breast cancer patients with 10 or more positive lymph nodes treated with CMF. Eur J Cancer. 2001;37:1123–31. doi: 10.1016/s0959-8049(01)00090-9. [DOI] [PubMed] [Google Scholar]
- 3.Sorlie T, Perou CM, Tibshirani R, et al. Gene expression patterns of breast carcinomas distinguish tumor subclasses with clinical implications. Proc Natl Acad Sci U S A. 2001;98:10869–74. doi: 10.1073/pnas.191367098. [DOI] [PMC free article] [PubMed] [Google Scholar]
- 4.Herynk MH, Fuqua SA. Estrogen receptors in resistance to hormone therapy. Adv Exp Med Biol. 2007;608:130–43. doi: 10.1007/978-0-387-74039-3_10. [DOI] [PubMed] [Google Scholar]
- 5.Kurzrock R. Cytokine deregulation in cancer. Biomedicine & Pharmacotherapy. 2001;55:543–7. doi: 10.1016/s0753-3322(01)00140-8. [DOI] [PubMed] [Google Scholar]
- 6.Singh A, Purohit A, Duncan LJ, Mokbel K, Ghilchik MW, Reed MJ. Control of aromatase activity in breast tumours: the role of the immune system. Journal of Steroid Biochemistry & Molecular Biology. 1997;61:185–92. [PubMed] [Google Scholar]
- 7.Heim MH. The Jak-STAT pathway: cytokine signalling from the receptor to the nucleus. J Recept Signal Transduct Res. 1999;19:75–120. doi: 10.3109/10799899909036638. [DOI] [PubMed] [Google Scholar]
- 8.Badache A, Hynes NE. Interleukin 6 inhibits proliferation and, in cooperation with an epidermal growth factor receptor autocrine loop, increases migration of T47D breast cancer cells. Cancer Research. 2001;61:383–91. [PubMed] [Google Scholar]
- 9.Lin MT, Juan CY, Chang KJ, Chen WJ, Kuo ML. IL-6 inhibits apoptosis and retains oxidative DNA lesions in human gastric cancer AGS cells through up-regulation of anti-apoptotic gene mcl-1. Carcinogenesis. 2001;22:1947–53. doi: 10.1093/carcin/22.12.1947. [DOI] [PubMed] [Google Scholar]
- 10.Wei LH, Kuo ML, Chen CA, et al. The anti-apoptotic role of interleukin-6 in human cervical cancer is mediated by up-regulation of Mcl-1 through a PI 3-K/Akt pathway. Oncogene. 2001;20:5799–809. doi: 10.1038/sj.onc.1204733. [DOI] [PubMed] [Google Scholar]
- 11.Purohit A, Wang DY, Ghilchik MW, Reed MJ. Regulation of aromatase and sulphatase in breast tumour cells. J Endocrinol. 1996;150(Suppl):S65–71. [PubMed] [Google Scholar]
- 12.Terry CF, Loukaci V, Green FR. Cooperative influence of genetic polymorphisms on interleukin 6 transcriptional regulation. Journal of Biological Chemistry. 2000;275:18138–44. doi: 10.1074/jbc.M000379200. [DOI] [PubMed] [Google Scholar]
- 13.DeMichele A, Martin AM, Mick R, et al. Interleukin-6 -174G–>C polymorphism is associated with improved outcome in high-risk breast cancer. Cancer Res. 2003;63:8051–6. [PubMed] [Google Scholar]
- 14.Tallman MS, Gray R, Robert NJ, et al. Conventional adjuvant chemotherapy with or without high-dose chemotherapy and autologous stem-cell transplantation in high-risk breast cancer. N Engl J Med. 2003;349:17–26. doi: 10.1056/NEJMoa030684. [DOI] [PubMed] [Google Scholar]
- 15.Osiri M, McNicholl J, Moreland LW, Bridges SL., Jr A novel single nucleotide polymorphism and five probable haplotypes in the 5′ flanking region of the IL-6 gene in African-Americans. Genes & Immunity. 1999;1:166–7. doi: 10.1038/sj.gene.6363652. [DOI] [PubMed] [Google Scholar]
- 16.Alderborn A, Kristofferson A, Hammerling U. Determination of single-nucleotide polymorphisms by real-time pyrophosphate DNA sequencing. Genome Res. 2000;10:1249–58. doi: 10.1101/gr.10.8.1249. [DOI] [PMC free article] [PubMed] [Google Scholar]
- 17.Kelberman D, Fife M, Rockman MV, Brull DJ, Woo P, Humphries SE. Analysis of common IL-6 promoter SNP variants and the AnTn tract in humans and primates and effects on plasma IL-6 levels following coronary artery bypass graft surgery. Biochim Biophys Acta. 2004;1688:160–7. doi: 10.1016/j.bbadis.2003.11.010. [DOI] [PubMed] [Google Scholar]
- 18.Gor PP, Gray RJ, Gimotty P, et al. Drug Metabolizing Enzyme Polymorphisms and Survival Outcomes in Node Positive Breast Cancer Patients Receiving Adjuvant Chemotherapy on Eastern Cooperative Oncology Group Protocol 2190/Intergroup 0121. Submitted 2008. [Google Scholar]
- 19.Lin DY, Zeng D, Millikan R. Maximum likelihood estimation of haplotype effects and haplotype-environment interactions in association studies. Genet Epidemiol. 2005;29:299–312. doi: 10.1002/gepi.20098. [DOI] [PubMed] [Google Scholar]
- 20.Lin DY. Haplotype-based association analysis in cohort studies of unrelated individuals. Genet Epidemiol. 2004;26:255–64. doi: 10.1002/gepi.10317. [DOI] [PubMed] [Google Scholar]
- 21.Zeng D, Lin DY, Avery CL, North KE, Bray MS. Efficient semiparametric estimation of haplotype-disease associations in case-cohort and nested case-control studies. Biostatistics. 2006;7:486–502. doi: 10.1093/biostatistics/kxj021. [DOI] [PubMed] [Google Scholar]
- 22.Cox DR. Regression models and life tables. Journal of the Royal Statistical Society. 1972;34:187–220. [Google Scholar]
- 23.Slattery ML, Curtin K, Baumgartner R, et al. IL6, aspirin, nonsteroidal anti-inflammatory drugs, and breast cancer risk in women living in the southwestern United States. Cancer Epidemiol Biomarkers Prev. 2007;16:747–55. doi: 10.1158/1055-9965.EPI-06-0667. [DOI] [PubMed] [Google Scholar]
- 24.Hefler LA, Grimm C, Lantzsch T, et al. Interleukin-1 and interleukin-6 gene polymorphisms and the risk of breast cancer in caucasian women. Clin Cancer Res. 2005;11:5718–21. doi: 10.1158/1078-0432.CCR-05-0001. [DOI] [PubMed] [Google Scholar]
- 25.Alexandrakis MG, Passam FH, Perisinakis K, et al. Serum proinflammatory cytokines and its relationship to clinical parameters in lung cancer patients with reactive thrombocytosis. Respiratory Medicine. 2002;96:553–8. doi: 10.1053/rmed.2002.1328. [DOI] [PubMed] [Google Scholar]
- 26.Musselman DL, Miller AH, Porter MR, et al. Higher than normal plasma interleukin-6 concentrations in cancer patients with depression: preliminary findings. Am J Psychiatry. 2001;158:1252–7. doi: 10.1176/appi.ajp.158.8.1252. [DOI] [PubMed] [Google Scholar]
- 27.Asgeirsson KS, Olafsdottir K, Jonasson JG, Ogmundsdottir HM. The effects of IL-6 on cell adhesion and e-cadherin expression in breast cancer. Cytokine. 1998;10:720–8. doi: 10.1006/cyto.1998.0349. [DOI] [PubMed] [Google Scholar]
- 28.Benoy I, Salgado R, Colpaert C, Weytjens R, Vermeulen PB, Dirix LY. Serum interleukin 6, plasma VEGF, serum VEGF, and VEGF platelet load in breast cancer patients. Clinical Breast Cancer. 2002;2:311–5. doi: 10.3816/cbc.2002.n.008. [DOI] [PubMed] [Google Scholar]
- 29.Zhang GJ, Adachi I. Serum interleukin-6 levels correlate to tumor progression and prognosis in metastatic breast carcinoma. Anticancer Research. 1999;19:1427–32. [PubMed] [Google Scholar]
- 30.Yokoe T, Iino Y, Morishita Y. Trends of IL-6 and IL-8 levels in patients with recurrent breast cancer: preliminary report. Breast Cancer. 2000;7:187–90. doi: 10.1007/BF02967458. [DOI] [PubMed] [Google Scholar]
- 31.Nishimura R, Nagao K, Miyayama H, et al. An analysis of serum interleukin-6 levels to predict benefits of medroxyprogesterone acetate in advanced or recurrent breast cancer. Oncology. 2000;59:166–73. doi: 10.1159/000012155. [DOI] [PubMed] [Google Scholar]
- 32.Conze D, Weiss L, Regen PS, et al. Autocrine production of interleukin 6 causes multidrug resistance in breast cancer cells. Cancer Research. 2001;61:8851–8. [PubMed] [Google Scholar]
- 33.Fishman D, Faulds G, Jeffery R, et al. The effect of novel polymorphisms in the interleukin-6 (IL-6) gene on IL-6 transcription and plasma IL-6 levels, and an association with systemic-onset juvenile chronic arthritis. Journal of Clinical Investigation. 1998;102:1369–76. doi: 10.1172/JCI2629. [DOI] [PMC free article] [PubMed] [Google Scholar]
- 34.Hulkkonen J, Pertovaara M, Antonen J, Pasternack A, Hurme M. Elevated interleukin-6 plasma levels are regulated by the promoter region polymorphism of the IL6 gene in primary Sjogren’s syndrome and correlate with the clinical manifestations of the disease. Rheumatology. 2001;40:656–61. doi: 10.1093/rheumatology/40.6.656. [DOI] [PubMed] [Google Scholar]
- 35.Bonafe M, Olivieri F, Cavallone L, et al. A gender–dependent genetic predisposition to produce high levels of IL-6 is detrimental for longevity. Eur J Immunol. 2001;31:2357–61. doi: 10.1002/1521-4141(200108)31:8<2357::aid-immu2357>3.0.co;2-x. [DOI] [PubMed] [Google Scholar]
- 36.Purohit A, Ghilchik MW, Duncan L, et al. Aromatase activity and interleukin-6 production by normal and malignant breast tissues. J Clin Endocrinol Metab. 1995;80:3052–8. doi: 10.1210/jcem.80.10.7559896. [DOI] [PubMed] [Google Scholar]
- 37.Smith K, Wray L, Klein-Cabral M, et al. Ethnic disparities in adjuvant chemotherapy for breast cancer are not caused by excess toxicity in black patients. Clin Breast Cancer. 2005;6:260–6. doi: 10.3816/CBC.2005.n.029. discussion 7–9. [DOI] [PubMed] [Google Scholar]
- 38.Fallowfield L, Atkins L, Catt S, et al. Patients’ preference for administration of endocrine treatments by injection or tablets: results from a study of women with breast cancer. Ann Oncol. 2006;17:205–10. doi: 10.1093/annonc/mdj044. [DOI] [PubMed] [Google Scholar]
- 39.Partridge AH, Wang PS, Winer EP, Avorn J. Nonadherence to adjuvant tamoxifen therapy in women with primary breast cancer. J Clin Oncol. 2003;21:602–6. doi: 10.1200/JCO.2003.07.071. [DOI] [PubMed] [Google Scholar]
Associated Data
This section collects any data citations, data availability statements, or supplementary materials included in this article.
Supplementary Materials
E2190 table 1 supplement