Single Intracoronary Injection of Encapsulated Antagomir‐92a Promotes Angiogenesis and Prevents Adverse Infarct Remodeling (original) (raw)
Abstract
Background
Small and large preclinical animal models have shown that antagomir‐92a‐based therapy reduces early postischemic loss of function, but its effect on postinfarction remodeling is not known. In addition, the reported remote miR‐92a inhibition in noncardiac organs prevents the translation of nonvectorized miR‐targeted therapy to the clinical setting. We investigated whether a single intracoronary administration of antagomir‐92a encapsulated in microspheres could prevent deleterious remodeling of myocardium 1 month after acute myocardial infarction AUTHOR: Should “acute” be added before “myocardial infarction” (since abbreviation is AMI)? Also check at first mention in main text (AMI) without adverse effects.
Methods and Results
In a percutaneous pig model of reperfused AMI, a single intracoronary administration of antagomir‐92a encapsulated in specific microspheres (9 μm poly‐d,‐lactide‐co‐glycolide [PLGA]) inhibited miR‐92a in a local, selective, and sustained manner (n=3 pigs euthanized 1, 3, and 10 days after treatment; 8×, 2×, and 5×‐fold inhibition at 1, 3, and 10 days). Downregulation of miR‐92a resulted in significant vessel growth (n=27 adult minipigs randomly allocated to blind receive encapsulated antagomir‐92a, encapsulated placebo, or saline [n=8, 9, 9]; _P_=0.001), reduced regional wall‐motion dysfunction (_P_=0.03), and prevented adverse remodeling in the infarct area 1 month after injury (_P_=0.03). Intracoronary injection of microspheres had no significant adverse effect in downstream myocardium in healthy pigs (n=2), and fluorescein isothiocyanate albumin‐PLGA microspheres were not found in myocardium outside the left anterior descending coronary artery territory (n=4) or in other organs (n=2).
Conclusions
Early single intracoronary administration of encapsulated antagomir‐92a in an adult pig model of reperfused AMI prevents left ventricular remodeling with no local or distant adverse effects, emerging as a promising therapeutic approach to translate to patients who suffer a large AMI.
Keywords: Angiogenesis, antagomir, heart failure, microRNA, myocardial infarction, remodeling
Introduction
Implementation of prompt reperfusion does not prevent the occurrence of adverse ventricular remodeling in a large number of patients with acute myocardial infarction (AMI), especially in those with extensive anterior wall infarct.1 Reducing the infarct extension and fibrous replacement by promoting therapeutic sprouting and proliferation of vessels within the infarct scar would appear to be a sensible target to ameliorate myocardial remodeling.2 The postnatal type of neoangiogenesis is an integral component of the remodeling process, but the rate of capillary formation is too slow to salvage cardiomyocytes.2 Clinical studies with isolated proangiogenic factors, such as vascular endothelial growth factor gene therapy, have shown a lack of improvement of perfusion of ischemic myocardium in patients with advanced coronary disease.3 Granulocyte colony‐stimulating factor and granulocyte colony‐stimulating factor–stimulated cells have also been proposed to repopulate and increase vascular‐bed angiogenesis after AMI, but the improvements of left ventricular ejection fraction and end‐systolic volumes have not been significantly better than control at 2 years.4–7
MicroRNAs (miR) have emerged as crucial regulators of vasculogenesis,8–10 and studies targeting these small 22‐nucleotide RNAs are providing more encouraging results in ischemic heart disease.11–12 Inhibition of miR‐92a, an anti‐angiogenic miR by repeated intravenous injections of antagomir‐92a induces angiogenesis and improves recovery of ventricular function in a mouse model of AMI.13 In addition, cardioprotection against ischemia/reperfusion has been observed in a pig model of AMI regionally treated with antagomir‐92a.14 However, remote miR‐92a inhibition in noncardiac organs has been reported for both systemic and regional delivery.14 Therefore, the translation of miR‐targeted modulation therapy to the clinical setting is limited by the potential for unwanted effects in distant regions due to the cellular ubiquity of miR‐92a.15–17
Our goal was to test the efficacy and safety of a new therapy to prevent postinfarction myocardial remodeling based on the intracoronary injection of antagomir‐92a encapsulated in specifically designed, bioabsorbable, and biocompatible microspheres (ME). We found that a single intracoronary administration of those ME at the time of reperfusion inhibits miR‐92a locally for at least 10 days after AMI, inducing vessel growth and preventing the development of adverse remodeling. These results identify local and sustained release of antagomir‐92a encapsulated in ME as a promising, new approach to treat patients with AMI at risk of developing adverse remodeling.
Methods
Minipigs
Adult 12‐month‐old male minipigs (mean body weight 26±5 kg) were purchased from Ellegaard Göttingen Minipigs® A/S, Denmark.
Preparation of ME
ME loaded with antagomir‐92a were prepared by an emulsion/solvent evaporation method using a 50:50 poly‐d,‐lactide‐co‐glycolide (PLGA) copolymer (intrinsic viscosity 0.2 dL/g). A solution of antagomir‐92a was emulsified in a PLGA organic solution. The obtained emulsion was in turn incorporated in a dispersing aqueous phase and homogenized to obtain the desired particle size. Finally, after the solvent evaporation, the obtained ME were freeze‐dried. Placebo ME and ME with fluorescein isothiocyanate albumin were prepared following the same methodology. Size and composition of PLGA were selected to hold out the degradation process for a period of 21 to 30 days. In addition, the released antagomir‐92a was a locked nucleic acid specifically designed by Exiqon to extend its stability in blood to this period.
Animal Experiments
All experiments were carried out in strict accordance with the protocols approved by the Animal Care Committee, Institut de Recerca (N. Registro: 19/10 CEEA‐Departament de Medi Ambient i Habitatge: B9900062) and the Guide for the Care and Use of Laboratory Animals published by Directive 2010/63/EU of the European Parliament and of the Council of September 22, 2010 on the protection of animals used for scientific purposes.
Induction of Reperfused AMI
After IM sedation by 4 mg/kg tiletamina‐zolazepam (Zoletil®)+2 mg/kg xilazine (Xilagesic® 20%) and anesthesia by intravenous propofol (Propofol‐lipuro® 1% 10 mg/mL) and fentanyl (Fentanest® 0.15 mg/3 mL) (1.5 to 2.5 mg/kg bolus+infusion: 11 mg/kg per hour and 5 μg/kg bolus+infusion: 3 to 6 μg/kg per hour, respectively), minipigs were intubated and monitored. Vital parameters and electrocardiographic curves were recorded using Collect 5S software (GE Healthcare, Belford, UK). The femoral artery and vein were cannulated by placing a 7F and 12F sheath, respectively. Heparin (300 IU/kg) and lysine acetylsalicylate (450 mg) were administered intravenously. Coronary angiography was performed using iomeron contrast (Iopamiro® 370). The left main coronary artery was selectively cannulated with an anterior mammary internal guiding 5F catheter. A BMW Universal 0.014″ wire was placed in the distal left anterior descending coronary artery (LAD) and a coaxial balloon (2.5/12 mm) was advanced and positioned in the middle section, just after the first diagonal branch. The balloon was inflated until occlusion of the vessel was confirmed by simultaneous antegrade contrast injection. AMI was confirmed by evidence of ST‐segment elevation, an increase in cardiac enzyme levels, and regional wall‐motion dysfunction observed by intravascular echocardiography (IVE). The durations of ischemia of 49 and 60 minutes were defined in a previous study specifically designed to establish the relationship between duration of transient coronary occlusion and infarct size in the pig model,18 and have been used by our group in many subsequent studies. In the present study, we used ischemic periods of 49 minutes expected to result in infarct size of 50% of the area at risk, or 60 minutes, expected to result in nearly transmural infarcts and more severe remodeling, but also in higher mortality. Twenty‐seven minipigs were allocated to the postinfarction remodeling study. Animals were randomly allocated to the 3 treatment groups according to a randomization list generated by the Department of Statistics of Vall d′Hebron Research Institute. All investigators were blind to the randomization codes. One animal could not complete the coronary occlusion protocol. Nine animals were allocated to the different treatments in the 49‐minute protocol (saline n=3, placebo ME n=3, antagomir‐92a ME n=3): 1 in the saline group died during the surgical procedure. The remaining 17 animals were randomly allocated to saline n=6, placebo ME n=6, and antagomir‐92a ME n=5 in the 60‐minute protocol. Three of these animals died during the surgical procedure (1 saline, 2 placebo ME) and 2 additional animals died during the subsequent 30 days (1 saline, 1 antagomir‐92a ME). There were, thus, 20 valid experiments: 8 from the 49‐minute protocol (saline n=2, placebo ME n=3, antagomir‐92a n=3), and 12 from the 60‐minute protocol (saline n=4, placebo ME n=4, antagomir‐92a ME n=4).
To determine the arrhythmogenic potential of encapsulated antagomir‐92a, all arrhythmic events during the procedures were recorded and analyzed by Collect 5S software (GE Healthcare, Belford, UK).
Examination of ME Biodistribution
To examine the biodistribution of ME in vivo, we induced an AMI by percutaneous balloon occlusion of the middle LAD coronary artery for a period of 49 minutes (n=4). Five minutes after reperfusion, 30 mg of fluorescein isothiocyanate albumin–PLGA ME dissolved in 2 injections of 5 mL of 0.15 mol/L PBS containing 0.01% Tween 80 (final ME concentration: 3 mg/mL) were administered by the intracoronary route through the lumen of the deflated coaxial balloon placed in the same position. Ten minutes later, pigs were euthanized and 5 replicate samples from the anterior myocardium and from the posterior control zone were obtained.
To rule out systemic biodistribution, we examined the presence of ME in different organs (n=2). Ischemic and control myocardial tissue and 5 replicate samples from lung, spleen, and liver were obtained after induction of AMI and intracoronary administration of ME, according to the methodology described above. All samples were stored at −80°C until visualization by optical microscopy.
Treatment Administration
Two silver‐covered injections of 5 and 8.7 mL with 3 mg/mL of ME containing antagomir‐92a (3 mg: 0.1 mg/kg body weight), ME containing placebo, or saline were intracoronarily administered through the coaxial lumen of the deflated balloon, 5 minutes after reperfusion. ME were resuspended in 0.15 mol/L PBS with 0.01% Tween80 immediately before administration. Each injection was followed by 5 mL of saline.
Intravascular Echocardiographic Assessment
IVE was performed for functional analysis using a Vivid Q ultrasound imaging device (GE Healthcare, Belford, UK). An AcuNav™ 10 F ultrasound catheter (Siemens, Malvern) was advanced through the venous 12 F sheath and positioned in the apex of the right ventricle. Two‐dimensional images showing the apex of the left ventricle (LV), the septum, and the mitral valve were obtained and visualized throughout the procedure. Loops at baseline, during AMI induction, immediately at the end of ischemia, and during reperfusion were recorded. One month later, the same methodology was applied and the presence of septoapical dyskinesia was evaluated. Loops of each animal were recorded on a digital versatile disc and analyzed by an echocardiographer blind to the allocated treatment. All echocardiographic measurements were averaged over 5 consecutive cardiac cycles.
Implantable Loop Recorder Insertion
After treatment administration and with the animals under general anesthesia, an implantable loop recorder (Reveal DX and Reveal XT in 8 and 2 pigs, respectively; Medtronic Inc, Minneapolis, MN) was inserted subcutaneously in the left parasternal area. The devices were just after the implantation to ascertain a correct signal detection and 1 month after treatment to check for cardiac arrhythmias.
Housing
Animals were housed during the 1 month following AMI with a temperature of 20 to 22°C and relative humidity of 40% to 70%. The light–dark cycle was 12 hours. Animals were fed diet SMP (Minipigs expanded)—Code 801586 (DIETEX France, Argenteuil). The first day after AMI, oxygen and a fentanyl patch were provided. Acetylsalicylic acid (100 mg) was administered daily. Minipigs were visited daily to measure weight, heart rate, oxygen saturation, and temperature and to examine the femoral and Reveal® area wound. No local bleeding was observed. Local infection of the implantable loop recorder in 1 animal was resolved with antibiotics and surgical drainage.
Catheterization and Thoracotomy: Microcirculatory Resistances Calculation
One month after AMI, animals were anesthetized, intubated, and monitored as described above. Femoral artery and vein were again punctured and 7 and 12 F sheaths were placed, respectively. Heparin (300 IU/kg) was administered intravenously. After IVE assessment, coronary angiography was repeated as described. LAD characteristics and flow were determined.19 A pressure wire (Primewire, Volcano Therapeutics Inc, Zaventem, Belgium) was advanced to the apical segment of the LAD and the distal pressure (Pd, mm Hg) was measured. Thereafter, thoracotomy and pericardiectomy were performed and the LAD was dissected to insert a flow sensor in the middle segment of LAD (Flowmeter T206, Transonic Systems Inc, NY). Coronary flow (Qc, mL/min) was measured. Baseline microcirculatory resistance (baseline MR) was calculated (Pd/Qc). Thereafter, an intravenous infusion of adenosine (140 μg/kg per minute) through the femoral vein 12F sheath was started and maintained for 10 minutes to induce hyperemia (hyp). At 10 minutes, true microcirculatory resistance was also calculated measuring the same parameters during maximal hyperemia (Pdhyp/Qchyp).20
Sacrifice and Necropsy Study
Minipigs were euthanized 33±4 days after AMI with a thiopental (Tiobarbital®) overdose. Just before sacrifice, 2 samples each of lung, liver, kidney, and spleen were obtained and frozen in liquid nitrogen and stored at −80°C. The hearts were then removed and fixed in 10% formalin under pressure by filling the ventricular cavities with gauzes to maintain LV diastolic geometry. A necropsy study was performed in all animals, looking for pathological changes in any of the major organs and focusing attention on vascular neoformations.
Cardiac Magnetic Resonance Imaging
Formalin‐fixed hearts were analyzed by cardiac magnetic resonance imaging at 1.5 Tesla (GE Healthcare, Belford, UK) using a T2W pulse sequence. Remodeling parameters (maximum and minimum infarcted wall thickness [Tmax and Tmin infarcted wall, respectively]; noninfarcted wall thickness was measured just beside the insertion of posterior papillary muscle [Tnormal posterior wall]; percentage of minimum and maximum thinning were calculated as [100−(Tmax/Tnormal posterior×100)] and [100−(Tmin/Tnormal posterior×100)], respectively; maximum diameter between remodeled and contralateral normal wall, passing through the cavity center [LV DR]; maximum diameter between normal ventricular walls, perpendicular to LV DR and passing nearest the center of the ventricular cavity [LV DN]; sphericity index [LV DR/DN]) were measured by 2 observers blinded to the treatment allocation. Measurements were performed in all affected slices and the means±SEM. were calculated for each animal.
Histological Analysis of Vascular Density and Collagen Deposition
Hearts were cut into 6, 10‐mm‐thick short‐axis transverse ventricular slices, from apex to base. LV, right ventricle, and total heart areas and perimeters, LV cavity diameters, scar length, maximum (Tmax scar) and minimum (Tmin scar) scar thickness, and uninfarcted wall thickness were measured in each photographed infarcted short‐axis slice by using Image‐Pro plus software (Media Cybernetics, USA), then added and divided by the number of infarcted slices. Myocardial infarct expansion index was calculated as described previously21 (LV cavity area/total heart area)×(uninfarcted septum thickness/infarcted LV free wall thickness). Afterward, slices were embedded in paraffin and 4‐μm‐thick sections were stained with hematoxylin–eosin, elastic fibers, and Masson‐trichrome. Masson‐trichrome staining was used for vascular density analysis. Staining of elastic fibers identified that newly generated vessels were arterioles. Arterioles were counted in the whole infarct area using the box‐counting method. Total size of necrotic area was calculated by adding single areas of all affected histological sections scanned with Epson perfection v100 photos Scanner (Epson Ltd, Herts, UK) and quantified using Image‐Pro plus software. Collagen fiber content and its structure in the scar were qualitatively assessed with picrosirius red staining and polarized light microscopy. Immunohistochemistry was used for analysis of collagen IV content (COL4A2 Antibody [C‐17], Santa Cruz Biotechnology, Inc) in the scar, also identifying basement membrane surrounding blood vessels.
Analysis of microRNA Expression
In 3 pigs, 47 mg of ME (3 mg/mL) containing antagomir‐92a (0.1 mg/kg body weight) dissolved in 2 injections of 7.8 mL of 0.15 mol/L PBS containing 0.01% Tween 80 were delivered to the LAD. Animals were euthanized at 1, 3, and 10 days after treatment and expression of miR‐92a and other endogenous microRNA that served as controls (miR‐123, ‐203, and ‐126) was quantified in 2 replicate infarcted and control samples by total RNA isolation and real‐time quantitative reverse transcription polymerase chain reaction using specific primers. Total RNA was isolated and reverse‐transcribed into cDNA using Exiqon kits according to the manufacturer′s protocol. For analysis of microRNA expression in heart samples, we carried out a SYBR® Green–based real‐time quantitative reverse transcription polymerase chain reaction (Applied Biosystems) with specific primer sets for amplification (miR‐92a, miR‐123, miR‐203, and miR‐126 [Exiqon]). The small RNA molecule U6 small nuclear RNA was amplified as a control.
Statistical Analysis
All statistical analyses were performed with SPSS 15.0. Data are expressed as the mean±SEM. Multiple group comparison was performed by 1‐way ANOVA followed by the Bonferroni procedure for comparison of means. The χ2 test was used to compare percentages. Pearson′s correlation was used to analyze the degree of linear relationship between vascular density and microcirculatory resistances. Values of P<0.05 were considered statistically significant.
Results
Antagomir‐92a Can Be Encapsulated in ME
We first defined the appropriate composition and morphological and granulometric characteristics of the delivery system. Spherical microparticles of biodegradable and biocompatible PLGA polymer were obtained by an emulsion and solvent evaporation method. The inherent viscosity of the polymer ranged from 0.16 to 0.24 dL/g (Figure 1). Taking into account the diameter of the cardiac microvascular network, a 10‐μm particle size was considered appropriate to ensure delivery of the ME to the capillaries of the infarcted area while minimizing the risk of arteriolar obstruction.22 An adequate particle size distribution with a mean size of 9.04 μm, 82.13% of them between 5 μm and 25 μm and no particles larger than 25 μm, was obtained by the microencapsulation method described above (Figure 2). Loads of 7% to 10% of antagomir‐92a were determined by spectrophotometry, with encapsulation efficiency of 74% and preservation of drug integrity.
Figure 1.
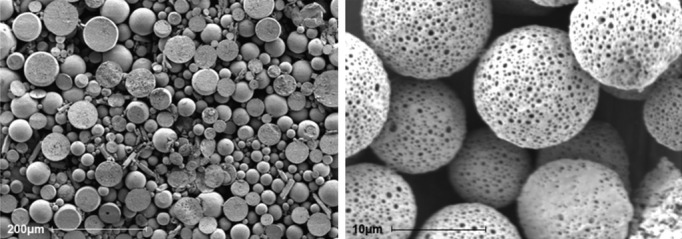
Microspheres. The photographs show microspheres in vitro by scanning electron microscopy. Scale bar: 200 and 10 μm, respectively. The microspheres show a porous surface.
Figure 2.
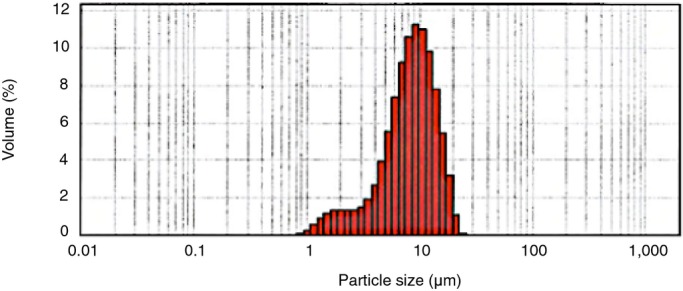
Microspheres size distribution. An adequate particle size distribution with a mean size of 9.04 μm without particles higher than 25 μm was obtained by an emulsion and solvent evaporation method. Volume represents the percentage of microspheres with each size.
ME Can Be Selectively Delivered in Reperfused Myocardium
Analysis of heart samples with optical fluorescence microscopy (blue light with wavelength of 495 nm) demonstrated that fluorescently labeled ME were retained in the capillaries of the damaged area (Figure 3).
Figure 3.
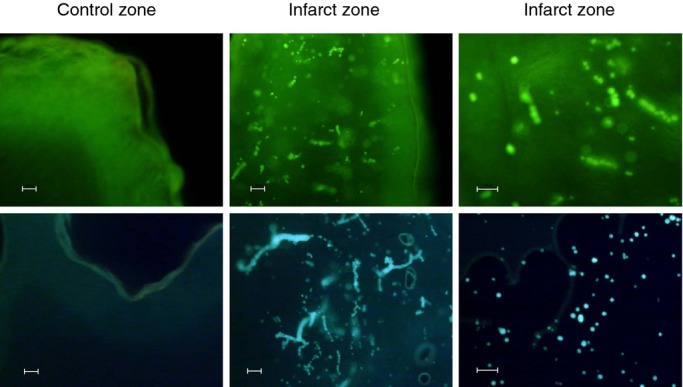
Detection of fluorescein isothiocyanate albumin‐PLGA microspheres in myocardial samples from pigs exposed to 49 minutes of ischemia and treated at 5 minutes of reperfusion with 2 intracoronary injections containing 30 mg of labeled microspheres. Representative images of control and ischemic ventricular myocardium sections visualized by fluorescence optical microscopy (blue light with wavelength of 495 nm). Microspheres were present in the ischemic zone but not in the control zone. Scale bar: 50 μm. n=4. PLGA indicates poly‐d,‐lactide‐co‐glycolide.
ME Can Be Safely Delivered in Reperfused Myocardium With No Local or Distant Adverse Effects
Fluorescence was detected exclusively in the anterior myocardial wall (Figure 4), establishing that ME were retained in the heart and few if any entered into circulation.
Figure 4.
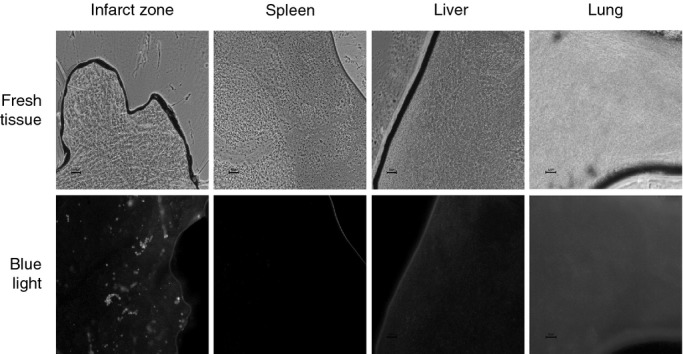
Detection of fluorescein isothiocyanate albumin‐PLGA microspheres in heart and in extracardiac tissues. Five replicate heart, lung, liver, and spleen samples were obtained with a 2‐mm punch and frozen at −80°C. Afterward, 5 μm of each tissue was placed on a slide and visualized with optical microscopy with fluorescence (blue light with wavelength of 495 nm). The image shows fluorescence exclusively detected in capillaries of infarcted myocardial wall. Scale bar: 50 μm. n=2. PLGA indicates poly‐d,‐lactide‐co‐glycolide.
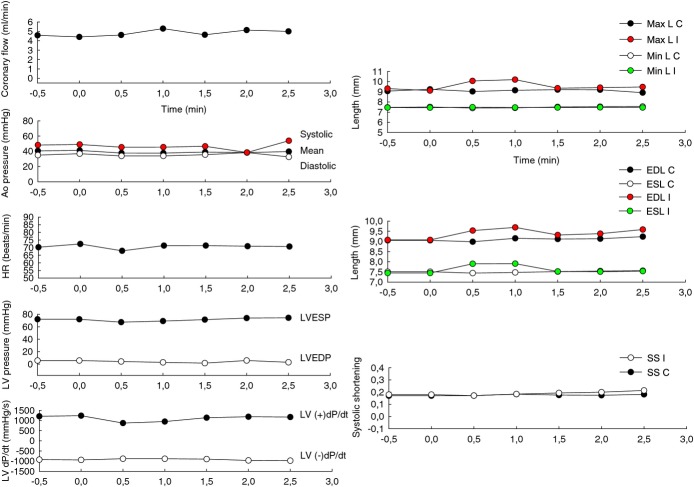
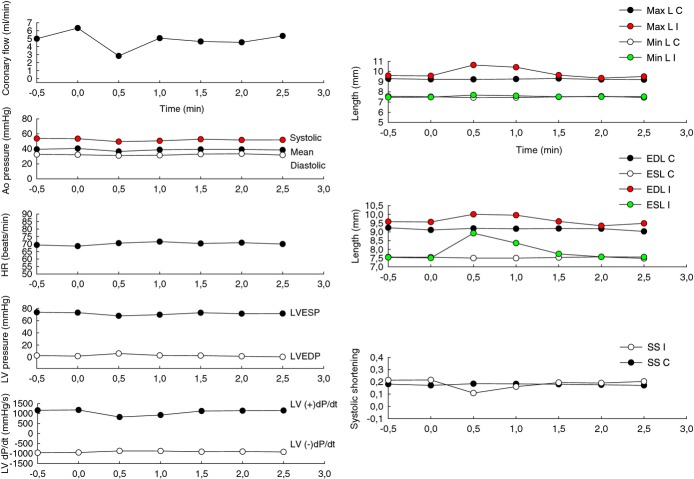
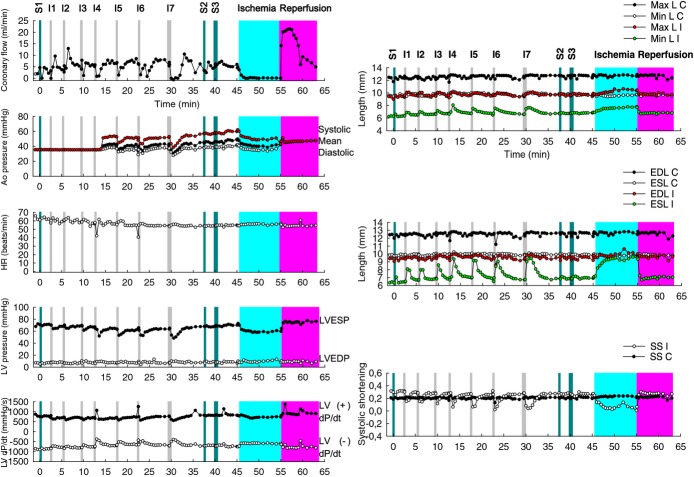
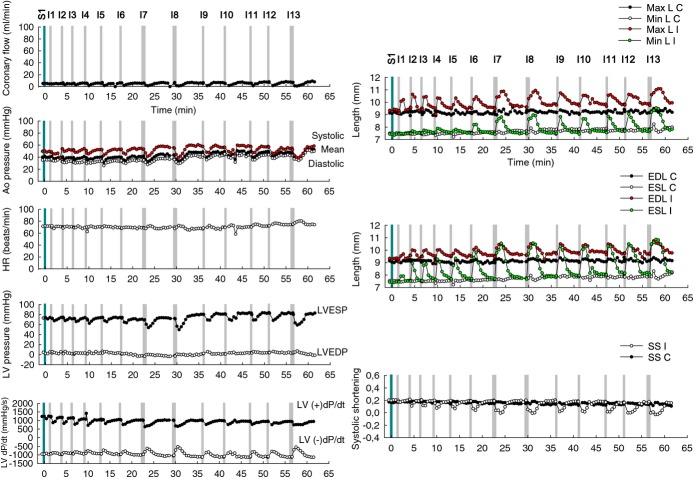
To investigate the potential myocardial toxicity and the safety range of therapeutic dosage, the 2 injections of 30 mg fluorescently labeled ME (Figures 5 and 6) and 2 progressively higher doses **(**Figures 7 and 8) in successive injections (120 and 240 mg fluorescently labeled ME, n=2) were administered in the LAD of healthy pigs. Two pairs of piezoelectric crystals were implanted in anterior and posterior myocardium, respectively.23 Injections caused minor and rapidly reversible depressions of segment shortening in the LAD territory as measured with the piezoelectric crystals. Segment shortening and LAD flow remained stable after the last injection. Triphenyltetrazolium staining and histological analysis failed to show areas of myocardial necrosis. Furthermore, injections caused no arrhythmias.
Figure 5.
First intracoronary injection of microspheres: effects in coronary flow, hemodynamic parameters, and contractility. To examine damage to the cardiac muscle, a technique based on the use of piezoelectric microcrystals, highly sensitive in detection of ischemia, was employed. Two paired piezoelectric crystals were implanted in the anterior ischemic wall and control posterior zone and the flow sensor was placed in the middle segment of left anterior descending coronary artery (LAD). Crystals were implanted by making a small 1‐mm myocardial cut after thoracotomy and pericardiectomy. The distance between each pair was approximately 1.5 cm. The mechanical signal of each pair of crystals is transformed into an electrical signal, captured by an oscillometer, and transmitted to a computer continuously. The length between each pair of crystals was analyzed during and after the 2 intracoronary injections of the microspheres, directly into the LAD through the coaxial balloon. When cardiac muscle is affected by ischemia, the contraction is lost and the injured tissue movement becomes dyskinetic. In addition, surrounding healthy tissue increases the contraction, leading globally to separation of the ischemic pair of microcrystals, which move further away from each other compared to the control pair. Throughout the cardiac cycle, the maximum (Max L) and minimum length (Min L), the end‐diastole (EDL), and the end‐systole length (ESL) between the ischemic pair (I) and control pair (C) of crystals during the first injection of microspheres were represented. In addition, the relation between EDL and ESL expressed by the parameter systolic shortening (SS)=(EDL−ESL)/EDL of the ischemic pair (SS I) and control pair (SS C) were analyzed. When the anterior left ventricular contraction is completely dissipated, EDL=ESL and SS=0. The normal values range between 0.2±0.1.23 Coronary flow in LAD and hemodynamic parameters such as aortic pressure (Ao pressure), heart rate (HR), left ventricle pressure (LV pressure), and its derivative left ventricular dP/dT (LV dP/dT) obtained with a 1.4 F micromanometer tipped conductance catheter (Millar Instruments Inc, Houston, TX) were simultaneously monitored and recorded with a multiple recording system (Chart 5 program for Windows). The graphics show minimal and transitory separation of ischemic pair of crystals lasting a few seconds with any prolonged or irreversible ischemic effect after the first intracoronary injection of 15 mg of fluorescein isothiocyanate albumin–PLGA microspheres. n=2. LVESP indicates left ventricle end‐systolic pressure; LVEDP, left ventricle end‐diastolic pressure; PLGA poly‐d,‐lactide‐co‐glycolide.
Figure 6.
Second intracoronary injection of 15 mg of microspheres: effects in coronary flow, hemodynamics, and contractility. The same parameters described in Figure 5 were obtained during the second injection of 15 mg of fluorescein isothiocyanate albumin–PLGA microspheres. The graphics show minimal and transient changes in contractility returning to baseline evaluated with piezoelectric crystals and discarding ischemic injury by the microspheres. Isolated premature ventricular complexes were induced during the injections and those explain the momentary reduction in heart rate (HR) with simultaneous oscillations in left ventricular pressures. Afterward, the animal was euthanized and the presence of those microspheres in myocardial tissue was confirmed by optical fluorescence microscopy. n=2. Ao pressure indicates aortic pressure; C, control pair of crystals; EDL, end‐diastole length; ESL, end‐systole length; I, ischemic pair of crystals; LV pressure, left ventricle pressure and its derivative LV dP/dT, left ventricular dP/dT; LVEDP, left ventricular end‐diastolic pressure; LVESP, left ventricular end‐systolic pressure; Max L, maximum length; Min L, minimum length; SS, systolic shortening=(EDL−ESL)/EDL; PLGA, poly‐d,‐lactide‐co‐glycolide.
Figure 7.
Evaluation of potential myocardial toxicity. An experiment was conducted to analyze whether the microspheres caused damage to the cardiac muscle or the coronary flow rate. Intracoronary injections (I) of 10 mL saline (S1)+6 I×15 mg microspheres+1 I×30 mg microspheres+10 mL S2+20 mL S3+10 min ischemia+13 min reperfusion. The separation between the ischemic pair of crystals becomes increasingly larger and longer but returns to the baseline after a few minutes. No irreversible ischemic damage was observed with a total dose of 120 mg of microspheres administered into the LAD through a coaxial balloon placed in the middle segment. n=1. Ao pressure indicates aortic pressure; C, control pair of crystals; EDL, end‐diastole length; ESL, end‐systole length; HR, heart rate; I, ischemic pair of crystals; LAD, left anterior descending coronary artery; LV pressure, left ventricle pressure and its derivative LV dP/dT, left ventricular dP/dT; LVEDP, left ventricular end‐diastolic pressure; LVESP, left ventricular end‐systolic pressure; Max L, maximum length; Min L, minimum length; SS, systolic shortening.
Figure 8.
Evaluation of therapeutic safety range of dose. An experiment was conducted to investigate the therapeutic safety range of dose. Intracoronary injections (I) of 10 mL saline+6 I×15 mg microspheres+2 I×30 mg microspheres+4 I×15 mg microspheres+1 I×30 mg microspheres (total dose: 240 mg of microspheres). A maximum dose at which the toxic effects could be irreversible was not observed. n=1. Ao pressure indicates aortic pressure; C, control pair of crystals; EDL, end‐diastole length; ESL, end‐systole length; HR, heart rate; I, ischemic pair of crystals; LV pressure, left ventricle pressure and its derivative LV dP/dT, left ventricular dP/dT; LVEDP, left ventricular end‐diastolic pressure; LVESP, left ventricular end‐systolic pressure; Max L, maximum length; Min L, minimum length; SS, systolic shortening.
Encapsulated Antagomir‐92a Downregulates miR‐92a in a Sustained Manner After Intracoronary Administration
In infarcted tissue, miR‐92a expression 1 and 3 days after treatment was downregulated 8‐ and 2‐fold, respectively, in comparison with control tissue. Inhibition occurred as early as day 1 and was still present at day 10, with expression levels being 5 times lower than in the control area. No significant changes were detected in the other miRs at all time points investigated (Figure 9). These results demonstrate a sustained inhibition of miR‐92a with a single intracoronary administration.
Figure 9.
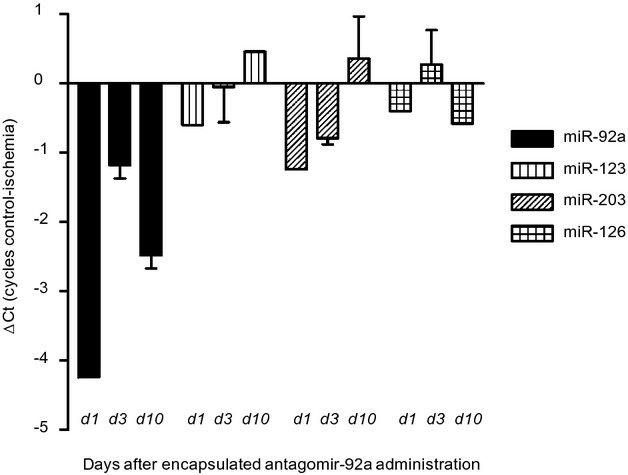
Quantitative analysis of expression of microRNA(miR)‐92a and other endogenous miRs as controls (miR‐123, miR‐203, and miR‐126) in ischemic myocardial tissue compared to nonischemic control myocardium of 2 replicate samples obtained at 1, 3, and 10 days after induction of ischemia (49 minutes) and intracoronary injection of encapsulated antagomir‐92a. Myocardial tissue was snap‐frozen and stored at −80°C for RNA analysis. Expression of miRs is represented as difference in cycles of amplification (ΔCt) in control versus ischemic zone assessed by real‐time RT‐PCR reaction. d indicates day. Data are mean±SEM. n=3. RT‐PCR indicates reverse transcription polymerase chain reaction.
Downregulation of miR‐92a Induces Cardiac Neoangiogenesis and Reduces Microcirculatory Resistance in the Infarcted Area
In the next series of experiments, we investigated whether inhibition of miR‐92a by intracoronary injection of encapsulated antagomir‐92a leads to enhancement of angiogenesis in the infarcted area. In this phase, 27 adult minipigs were allocated to receive saline, placebo ME, or antagomir‐92a‐containing ME (0.1 mg/kg body weight) by intracoronary administration at 5 minutes reperfusion after AMI (Figure 10). Four weeks later, functional studies were performed and hearts were obtained. Baseline characteristics (Table 1) and baseline LV contractility were similar in all groups (Table 2), and no differences were observed in left ventricular ejection fraction (Table 2) or in troponin I levels measured at the last minute of balloon occlusion (Table 3). At reperfusion, LAD flow grade by the Thrombolysis in Myocardial Infarction Study Group (TIMI) criteria (Table 4) and LV contractility (Table 2) were also homogeneous. No differences were observed in growth and vital parameters between groups at follow‐up (Table 5). Four weeks after treatment, the baseline MR and the true microcirculatory resistance (TMR) were consistently lower in treated animals than in controls (7.47±1.33 versus 19.62±2.98, _P_=0.005 and 5.0±1.15 versus 14.49±2.4, _P_=0.006, respectively) (Figure 11). Histopathological analysis demonstrated significantly higher vascular density in the necrotic area in those animals receiving encapsulated antagomir‐92a compared with controls (161.57±58.71 versus 68.49±23.56 in placebo group versus 73.91±24.97 in saline group, _P_=0.001) (Figure 12A, 12B, 12C, and 12D) and it significantly correlated with both baseline MR and TMR (_r_=−0.59, _P_=0.03 and _r_=−0.56, _P_=0.047, respectively) (Figure 12E and 12F). Microvascularity increased within both the infarct zone and the peri‐infarct rim. Taken together, these data indicate that encapsulated antagomir‐92a induces angiogenesis that is detectable 1 month after AMI.
Figure 10.
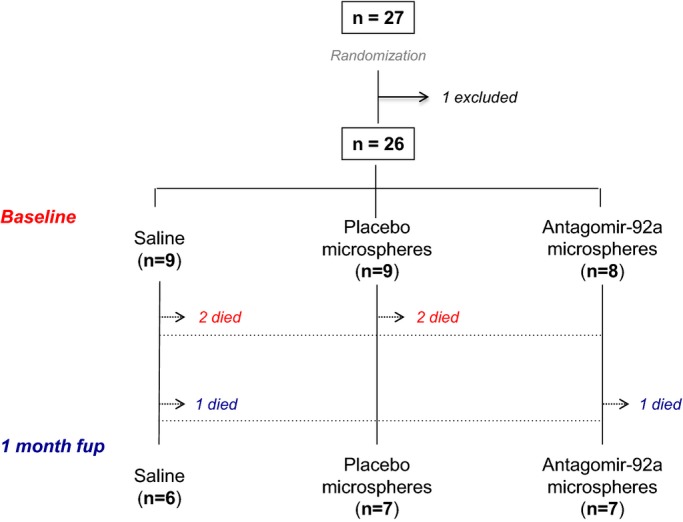
Study flow. Minipigs (n=27) were allocated to the postinfarction remodeling study. One animal was excluded from analysis because the flow occlusion with the 2.5‐mm balloon in LAD was not sustained during AMI induction, potentially interfering with the results. Out of 6 pigs that died, 4 died during or soon (<6 hours) after the surgical AMI procedure (red) and 2 pigs during the subsequent 30 days (blue). A total of 20 minipigs completed the follow‐up. AMI indicates acute myocardial infarction; fup, follow‐up; LAD, left anterior descending coronary artery.
Table 1.
Baseline Characteristics of Minipigs
| Saline (n=9) | Placebo ME (n=9) | Antagomir‐92a ME (n=8) | P Value | |
|---|---|---|---|---|
| Age, months | 12.6±1 | 12.2±0.7 | 12.4±0.8 | 0.96 |
| Male, % | 100 | 100 | 100 | — |
| Weight, kg | 24.5±1.7 | 27.3±1.8 | 26.8±1.3 | 0.42 |
| Heart rate, beats/min | 82±8 | 73±7 | 86±9 | 0.49 |
| Blood pressure, mm Hg | ||||
| Systolic | 123±6 | 118±6 | 117±8 | 0.79 |
| Diastolic | 75±5 | 65±3 | 73±6 | 0.27 |
| O2 Sat, % | 97.6±0.8 | 98.2±0.6 | 97.2±1 | 0.67 |
| CO2, mm Hg | 38.7±1.6 | 36.2±1.1 | 35.2±1.5 | 0.25 |
| Temperature, °C | 36.3±0.4 | 36.5±0.3 | 36.7±0.4 | 0.74 |
| Hematocrit, % | 30.5±1.5 | 28.7±1.7 | 28.4±1.6 | 0.61 |
| Creatinine, mg/dL | 0.78±0.03 | 0.77±0.05 | 0.79±0.03 | 0.93 |
| LAD size*, n (%) | 0.46 | |||
| Small | 2 (22.2) | 0 (0) | 1 (12.5) | |
| Medium | 3 (33.3) | 2 (22.2) | 1 (12.5) | |
| Large | 1 (11.1) | 5 (55.6) | 3 (37.5) | |
| Very large | 3 (33.3) | 2 (22.2) | 3 (37.5) |
Table 2.
Contractility of Left Ventricle
| Saline (n=9) | Placebo ME (n=9) | Antagomir‐92a ME (n=8) | P Value | |
|---|---|---|---|---|
| LVEF MOD A4C, % baseline | 72.6±9.2 | 71.9±8.5 | 68.1±5.9 | 0.52 |
| CO MOD A4C, L/min baseline | 2.3±0.2 | 1.9±0.3 | 1.6±0.3 | 0.22 |
| LVEF MOD A4C, % after AMI | 47.9±4 | 52.3±4.8 | 51.7±3.4 | 0.72 |
| CO MOD A4C, L/min after AMI | 1.8±0.2 | 1.8±0.4 | 1.7±0.2 | 0.92 |
| LVEF MOD A4C, % reperfusion | 56.4±3.4 | 53.4±4.5 | 59.1±3.5 | 0.6 |
| CO MOD A4C, L/min reperfusion | 1.6±0.2 | 1.4±0.2 | 2±0.6 | 0.49 |
| LVEF MOD A4C, % at 1‐month fup | 36.7±3.3 | 46.4±5.3 | 51.4±5.7 | 0.15 |
| ΔLVEF MOD A4C, % | −30±4.7 | −16.4±3.9 | −14.3±6.9 | 0.15 |
| ΔCO MOD A4C, L/min | −0.22±0.43 | −0.21±0.36 | 0.63±0.4 | 0.2 |
Table 3.
Cardiac Enzymes
| Saline (n=9) | Placebo ME (n=9) | Antagomir‐92a ME (n=8) | P Value | |
|---|---|---|---|---|
| Trop I baseline, ng/mL (n=26) | 0.03±0.006 | 0.02±0.004 | 0.02±0.009 | 0.32 |
| Trop I after AMI, ng/mL (n=26) | 0.4±0.13 | 0.3±0.07 | 0.2±0.06 | 0.16 |
| Trop I 6 h, ng/mL (n=22) | >10 | >10 | >10 | — |
Table 4.
TIMI Flow Score in LAD
| Saline (n=9) | Placebo ME (n=9) | Antagomir‐92a ME (n=8) | P Value | |
|---|---|---|---|---|
| Baseline (n=26) | ||||
| TIMI evaluation, n | n=9 | n=9 | n=8 | — |
| 3, n (%) | 9 (100%) | 9 (100%) | 8 (100%) | |
| After AMI and treatment (n=26) | ||||
| TIMI evaluation, n | n=9 | n=9 | n=8 | 0.52 |
| 1, n (%) | 1 (11.1) | 0 | 0 | |
| 2, n (%) | 2 (22.2) | 2 (22.2) | 4 (50) | |
| 3, n (%) | 6 (66.7) | 6 (66.7) | 3 (37.5) | |
| Not assessable*, n (%) | 0 | 1 (11.1) | 1 (12.5) | |
| 1 month after AMI (n=20) | ||||
| TIMI evaluation, n | n=6 | n=7 | n=7 | 0.57 |
| 0, n (%) | 1 (16.7) | 1 (14.3) | 0 | |
| 1, n (%) | 0 | 0 | 0 | |
| 2, n (%) | 0 | 0 | 1 (14.3) | |
| 3, n (%) | 5 (83.3) | 6 (85.7) | 6 (85.7) |
Table 5.
Characteristics of the Minipigs at 1‐Month Follow‐Up
| Saline (n=6) | Placebo ME (n=7) | Antagomir‐92a ME (n=7) | P Value | |
|---|---|---|---|---|
| Age, months | 14.2±1.4 | 14.1±0.7 | 13.9±0.8 | 0.97 |
| Weight, kg | 25.8±3.4 | 28.4±3 | 27.1±2 | 0.82 |
| ΔWeight at 1 month, kg | 0.7±1.9 | 0.5±1.3 | −0.7±1.6 | 0.81 |
| Heart weight, g | 149.6±7.1 | 152±9.8 | 157.1±15.6 | 0.9 |
| Heart rate, beats/min | 100±14.3 | 84±8 | 75±3.7 | 0.18 |
| Blood pressure, mm Hg | ||||
| Systolic | 96±9.8 | 119±8.1 | 119±7.1 | 0.12 |
| Diastolic | 58±7 | 69±5.6 | 68±6.2 | 0.43 |
| O2 Sat, % | 98.2±0.7 | 97.9±0.6 | 97.4±1 | 0.81 |
| CO2, mm Hg | 35.2±1.9 | 36.8±2.3 | 35±1.8 | 0.78 |
| Temperature, °C | 36.7±0.09 | 35.9±0.42 | 36.7±0.6 | 0.45 |
| Hematocrit, % | 22.9±0.97 | 24.8±1.15 | 25.4±2.16 | 0.56 |
| Creatinine, mg/dL | 0.74±0.09 | 0.77±0.07 | 0.79±0.05 | 0.87 |
Figure 11.
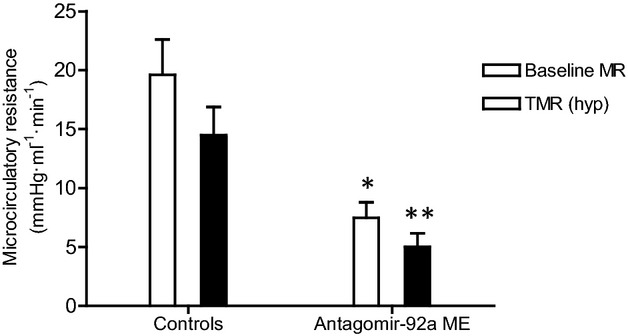
Baseline (baseline MR) and true microcirculatory resistance (TMR) measured 1 month after AMI in the infarct‐related artery of minipigs treated and nontreated with encapsulated antagomir‐92a. The baseline MR was significantly lower in the treated group compared with controls (7.47±1.33 vs 19.62±2.98, _*P_=0.005). n=13. Significantly lower TMR (hyp) was observed in the treated group compared to controls (5.0±1.15 vs 14.49±2.4, _**P_=0.006). n=13. AMI indicates acute myocardial infarction; ME, microspheres; MR, microcirculatory resistance.
Figure 12.
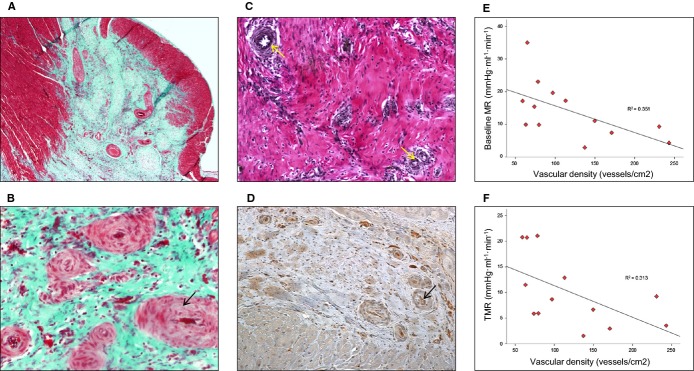
Inhibition of MicroRNA‐92a enhances angiogenesis in infarcted tissue. A and B, Representative Masson‐trichrome‐stained histological slices examined with an optical microscope at ×4 and ×10 magnification. Globally, histologic analysis demonstrated significantly higher vascular density in the necrotic area in the treated group compared to controls. P<0.01 number of vessels of encapsulated antagomir‐92a group compared with untreated. n=20. B, Newly formed vessels exhibit a thicker fibrotic media (black arrow). C, Representative elastic fiber–stained histological slice examined with optical microscope at ×10 magnification demonstrates that neovessels were arterioles with elastic fibers in the tunica media (yellow arrows). D, Collagen IV, present in the basement membrane of vessels, is identified by inmunohistochemical study (anticollagen IV) (black arrow). Newly formed vessels in the infarct area are shown. E, Correlation between the vascular density in all necrotic area and baseline microcirculatory resistance (baseline MR) measured 1 month after AMI. _r_=−0.59, _P_=0.033. n=13. F, Correlation between the vascular density in all necrotic area and true microcirculatory resistance (TMR) measured 1 month after AMI. _r_=−0.56, _P_=0.047. n=13. AMI indicates acute myocardial infarction.
Encapsulated Antagomir‐92a Induces Favorable Healing and Prevents Adverse Remodeling
To determine the effects of encapsulated antagomir‐92a on ventricular remodeling, we compared functional parameters by IVE and morphological and structural parameters in the antagomir‐treated and nontreated groups by ex vivo cardiac magnetic resonance imaging and in short‐axis transverse ventricular histological slices. A significantly higher percentage of control animals with septoapical dyskinesia was identified by IVE (76.9 versus 28.6%, _P_=0.03) (Figure 13A and 13B). A strong tendency toward a better left ventricular ejection fraction in the treated group was observed (51.4±5.7 versus 36.7±3.3 versus 46.4±5.3, _P_=0.15) (Table 2). The percentages of injured ventricular wall thinning adjusted for the normal wall thickness, adverse remodeling‐mediated morphological changes in the LV in CMR, and the myocardial infarct expansion index in histological slices were also significantly higher in controls than in treated animals (Figure 14 and Tables 6 and 7). These findings suggest a protective effect of antagomir‐92a toward cardiac remodeling after AMI that can be attributed to angiogenesis.
Figure 13.
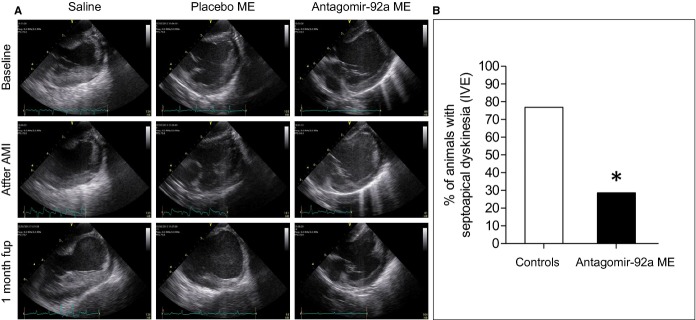
Analysis of regional wall motion dysfunction by intravascular echocardiography (IVE). A, Representative 2‐dimensional images showing the apex of the left ventricle, septum, and mitral valve obtained at baseline, just at the end of ischemia, and at 1 month after AMI are shown. B, One month after AMI, the presence of septoapical dyskinesia was evaluated by an echocardiographer blind to the allocated treatment. The percentage of animals with septoapical dyskinesia in treated and nontreated animals is shown (28.6% vs 76.9%, *P<0.05). n=20. AMI indicates acute myocardial infarction; fup, follow‐up; ME, microspheres.
Figure 14.
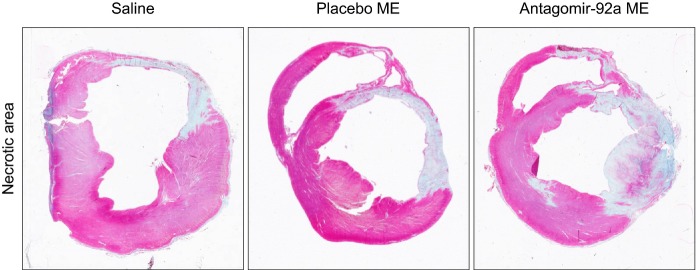
Representative trichrome‐stained short‐axis ventricular sections showing the infarct area of 3 minipigs of the study allocated to each group of treatment. The favorable healing observed in the encapsulated antagomir‐92a treated group is shown. _P_>0.05 necrotic area of treated group versus untreated. ME indicates microspheres.
Table 6.
Parameters of Left Ventricular Remodeling in CMR
| Saline (n=6) | Placebo ME (n=5) | Antagomir‐92a ME (n=6) | P Value | |
|---|---|---|---|---|
| No. of infarcted slices | 4.8±0.3 | 4.8±0.4 | 5.3±0.2 | 0.38 |
| Tmax infarcted wall, mm | 6.07±0.9 | 5.61±0.5 | 9.01±0.6 | 0.006 |
| Tmin infarcted wall, mm | 3.17±0.4 | 4.02±0.9 | 4.35±0.5 | 0.33 |
| Tnormal posterior wall, mm | 13.23±0.5 | 13.52±1.8 | 11.82±0.7 | 0.49 |
| Perc. of minimum thinning, % | 54.79±4.9 | 56.74±4.1 | 22.71±5.5 | <0.0001 |
| Perc. of maximum thinning, % | 76.40±2.18 | 69.86±4.72 | 62.54±4.19 | 0.05 |
| Length of the thinning infarcted wall, mm | 32.2±1.8 | 31.7±4 | 20.5±3.6 | 0.03 |
| LV DN, mm | 14.88±0.68 | 13.78±1.59 | 17.5±1.37 | 0.12 |
| LV DR/DN | 1.93±0.2 | 2.02±0.2 | 1.29±0.1 | 0.03 |
| Adverse remodeling, % (n) | 83.3 (5) | 80 (4) | 16.7 (1) | 0.03 |
Table 7.
Parameters of Left Ventricular Remodeling Analyzed in Short‐Axis Transverse Ventricular Histological Slices
| Saline (n=6) | Placebo ME (n=7) | Antagomir‐92a ME (n=7) | P Value | |
|---|---|---|---|---|
| No. of infarcted slices | 2.5±0.22 | 2.83±0.17 | 2.71±0.18 | 0.5 |
| Areas | ||||
| LV cavity area, cm2 | 4.93±0.48 | 5.03±0.75 | 3.59±0.38 | 0.13 |
| RV cavity area, cm2 | 3.66±0.76 | 4.51±0.81 | 2.96±0.44 | 0.28 |
| Total heart area, cm2 | 22.83±1.48 | 25.43±2.51 | 21.53±1.48 | 0.34 |
| LV ext area, cm2 | 15.22±1.16 | 17.81±1.8 | 14.31±1.33 | 0.23 |
| RV ext area, cm2 | 6.19±1.04 | 7.22±1.12 | 5.58±0.73 | 0.49 |
| Perimeters | ||||
| LV perimeter, cm | 10.27±0.44 | 9.9±0.72 | 9.18±0.27 | 0.29 |
| RV perimeter, cm | 10.18±0.92 | 10.36±0.93 | 9.04±0.66 | 0.47 |
| Total heart perimeter, cm | 17.40±0.53 | 18.13±0.95 | 16.66±0.64 | 0.36 |
| LV ext perimeter, cm | 13.56±2.68 | 14.88±1.05 | 12.55±1.11 | 0.33 |
| RV ext perimeter, cm | 13.22±1.24 | 13.64±0.97 | 11.86±1.04 | 0.48 |
| Diameters | ||||
| LV Dmax, cm | 3.26±0.48 | 3.23±0.23 | 2.71±0.09 | 0.06 |
| LV Dmin, cm | 1.61±0.05 | 1.59±0.21 | 1.61±0.1 | 0.99 |
| LV DR, cm | 3.16±0.21 | 3.19±0.22 | 2.35±0.08 | 0.004 |
| LV DN, cm | 1.64±0.06 | 1.71±0.22 | 1.93±0.19 | 0.47 |
| LV DR/DN | 1.95±0.14 | 2.04±0.28 | 1.29±0.13 | 0.024 |
| Myocardial infarct expansion index | 6.75±1.19 | 6.56±0.64 | 2.8±0.31 | 0.006 |
| Scar lengths | ||||
| Tmax scar, cm | 0.52±0.12 | 0.4±0.03 | 0.68±0.07 | 0.04 |
| Tmin scar, cm | 0.32±0.08 | 0.23±0.02 | 0.39±0.04 | 0.121 |
| Scar length, cm | 3.42±0.28 | 3.21±0.20 | 3.06±0.13 | 0.53 |
Favorable Healing Is Associated With the Major Proportion of Mature Collagen
Qualitative differences between the 2 treatment groups in fibrillar hue content, alignment and spatial distribution of collagen in scars were observed. Multidirectional cross‐linked thick orange and red fibers were the dominant collagen structures in treated animals, whereas longitudinally aligned parallel thin green collagen fibers were exclusively detected in nontreated scars (Figure 15).
Figure 15.
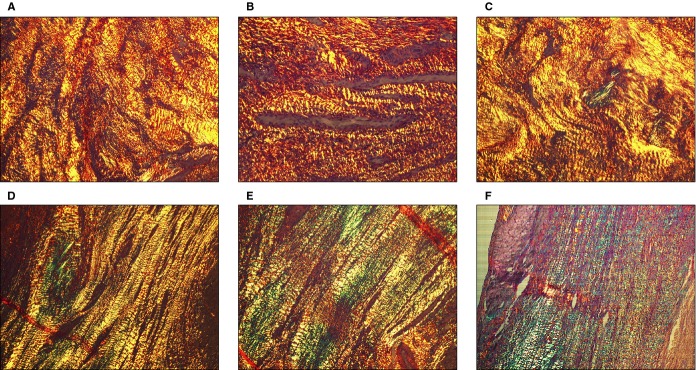
Qualitative assessment of myocardial collagen composition and structural organization by polarized light analysis of picrosirius red–stained histological sections. A different qualitative composition of collagen fibers was observed in scars of treated vs nontreated animals. The cross‐linked structure of mature collagen triple helix was exclusively observed in treated animals scars (A through C), showing reddish color with picrosirius red and polarized light microscopy. However, scars of nontreated animals were mainly composed of immature collagen with longitudinal nonlinked fibers with green refringence (D through F). Moreover, whereas in control animal scars the collagen fibers exhibit a longitudinal layout, swirling and multidirectional fibers was the most abundant disposition in treated scars.
Collagen IV was identified mainly in the peripheral zone and less in the center of the scar. No qualitative differences were observed between groups of the scars (Figure 16).
Figure 16.
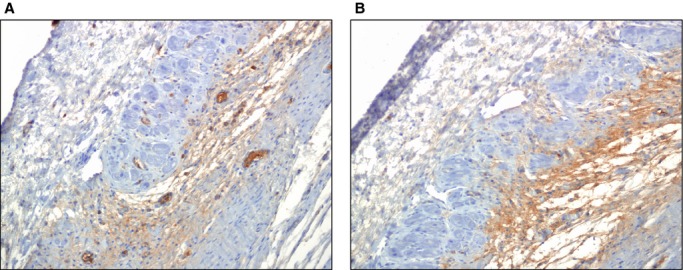
Qualitative assessment of deposition of nonfibrillar collagen IV in the scar at 1 month after AMI. Immunohistochemistry was used to analyze collagen IV content (COL4A2 Antibody [C‐17], Santa Cruz Biotech) in the scar, also identifying basement membrane surrounding blood vessels. A, Representative section of peripheral infarct tissue of an animal treated with antagomir‐92a. Collagen IV content and arterioles are shown (brown coloration). B, Representative section of peripheral infarct tissue of a control animal. Qualitatively, similar collagen IV deposition was observed in treated and nontreated animals. AMI indicates acute myocardial infarction.
Intracoronary Injection of Encapsulated Antagomir‐92a in Reperfused Myocardium Is Not Associated With Adverse Effects
Malignant arrhythmias during ischemia or at reperfusion were frequent, requiring defibrillation, with no differences between groups (Table 8). No antiarrhythmic drugs were administered. An extra 3‐mL bolus of fentanyl was administered in cases of recurrent, nonsustained ventricular arrhythmias or repeated defibrillation, with no differences between groups in total administered dose (_P_=0.68). Moreover, to further address this issue, an insertable loop recorder was randomly implanted in 10 of the study′s 27 minipigs to detect potential episodes of arrhythmia until sacrifice at 1 month postinfarction and treatment. Malignant tachyarrhythmias or clinically relevant bradyarrhythmias were not observed in either treated or control groups, indicating that intracoronary encapsulated antagomir‐92a has no proarrhythmic effect (Table 8). Mortality during or directly after the procedure was 15%. Global study mortality was 23% (Table 9). No differences were observed in short‐term mortality between groups. No vascular tumors were observed in any of the animals upon necropsy analysis, consistent with the absence of ectopic systemic suppression of microRNA‐92a in other, remote organs.
Table 8.
Arrhythmias Detected During the Study
| Saline (n=9) | Placebo ME (n=9) | Antagomir‐92a ME (n=8) | P Value | |
|---|---|---|---|---|
| Ischemic phase (n=26) | ||||
| No arrhythmias, n (%) | 2 (22.2) | 0 (0) | 1 (12.5) | 0.37 |
| Arrhythmias, n (%) | 7 (77.8) | 9 (100) | 7 (87.5) | |
| PVC, n | 5 | 7 | 5 | |
| NSVT, n | 0 | 1 | 1 | |
| Ventricular fibrillation, n | 3 | 3 | 3 | |
| Reperfusion phase (n=26) | ||||
| No arrhythmias, n (%) | 5 (55.6) | 3 (33.3) | 3 (37.5) | 0.6 |
| Arrhythmias, n (%) | 4 (44.4) | 6 (66.7) | 5 (62.5) | |
| Sinus pauses, n | 1 | 1 | 0 | |
| Nodal rhythm, n | 1 | 0 | 0 | |
| IVR, n | 0 | 2 | 1 | |
| PVC, n | 4 | 3 | 3 | |
| NSVT, n | 0 | 0 | 1 | |
| During 30 days after AMI (n=10) | ||||
| Implantable loop recorder | n=4 | n=3 | n=3 | 0.88 |
| No arrhythmias, n (%) | 0 (0) | 0 (0) | 0 (0) | 0.38 |
| Arrhythmias, n (%) | 2 (50) | 3 (100) | 3 (100) | |
| Sinus tachycardia, n | 2 | 3 | 3 | |
| Sinus pause (3 s), n | 0 | 1 | 0 | |
| PSVC, n | 0 | 0 | 1 | |
| Not assessable*, n (%) | 2 (50) | 0 | 0 |
Table 9.
Study Mortality
| Saline (n=9) | Placebo ME (n=9) | Antagomir‐92a ME (n=8) | P Value | |
|---|---|---|---|---|
| Periprocedural mortality*, n (4 of 26: 15.4%) | 2 | 2 | 0 | 0.35 |
| Causes of mortality, n | ||||
| Cardiogenic shock due to severe left ventricular dysfunction secondary to thrombus in left main embolized from catheter during TIMI flow analysis at reperfusion | 1 | |||
| Arrhythmic storm | 1 | |||
| Retroperitoneal hemorrhage | 1 | |||
| Bradycardia and asystole | 1 | |||
| Mortality 30 days after AMI, n (2 of 22: 9.1%) | 1 | 0 | 1 | 0.59 |
| Causes of mortality, n | ||||
| Sudden death (probably arrhythmia. No signs of heart failure were observed in necropsy) | 1 | |||
| Heart failure | 1 | |||
| Global mortality, n (6 of 26: 23%) | 3 | 2 | 1 | 0.59 |
Discussion
Our investigation provides evidence of an effective, vectorized antagomir therapy that induces favorable postischemic myocardial repair. We have demonstrated that a local intracoronary delivery system based on microencapsulation avoids systemic antagomir‐92a biodistribution, allows local, sustained miR‐92a inhibition and neovasculogenesis, and prevents adverse ventricular remodeling.
Adverse ventricular remodeling is presently still the major cause of contractile dysfunction and heart failure after an AMI.24 Despite advances in pharmacological treatments, reperfusion, resynchronization, and cell therapy, its occurrence has not been abolished.25–33 The thinning and expansion of the infarct area, which results in ventricular dilatation, has been associated with a worsened state of the microcirculation.34–36 Consequently, improving the vascular network by induction of neoangiogenesis has already been proposed as a way to prevent adverse ventricular remodeling.2,37–38 Although benefits have been observed in preclinical experiments with proangiogenic factors, little if any effect has been observed thus far in clinical trials. Antagomir‐92a has been described to be cardioprotective and to induce neovascularization in small‐ and large‐animal models, but its beneficial effect against adverse postinfarction remodeling was unknown.13–14 In our study, in a clinically relevant adult minipig model of AMI with transient coronary occlusion and reperfusion, microencapsulated antagomir‐92a induced growth of vessels in the infarcted area and led to a significantly reduced occurrence of adverse ventricular remodeling. This model rules out that the observed biological effects are mediated by pathways or stimuli activated only during the growth period of an animal's life. The underlying mechanism by which induction of neoangiogenesis prevents adverse remodeling has been previously investigated. Prevention of cell death of hypertrophied viable myocytes and modification of collagen deposition and scar formation after neoangiogenesis have been demonstrated in a rodent model of myocardial infarction.2 Accordingly, in our study, the scar of treated animals differed qualitatively from that of controls in the collagen composition, with a higher proportion of mature cross‐linked collagen I fibers. This higher proportion of collagen I and its multidirectional spatial distribution could determine the major stiffness and mechanical strength of the repair tissue and could have contributed to preventing adverse postinfarct remodeling.39–40 While collagen I and III are the most abundant collagens in the reparative scar, recent studies suggest that the nonfibrillar collagens are also deposited during pathological postinfarct healing.41–42 Collagen IV content was detected in the infarct tissue in our study, which could reinforce its role in the organization of the fibrillar collagen network. However, a qualitatively similar proportion of collagen IV deposition was observed in treated and nontreated animals. The influence of the new vessels on cardiac fibroblast activation and fibrillar and nonfibrillar collagen deposition during the healing process requires future investigation.
Several obstacles prevent the translation of intravenous injections of antagomir‐92a to the prevention of adverse remodeling in clinical practice. Since the polycistronic microRNA 17‐92a cluster is ubiquitously expressed, nonselective cell penetration and diffuse miR‐92a inhibition in noncardiac organs observed with systemic and regional application may cause unwanted adverse effects at remote locations.14 In addition, to obtain an adequate and sustained concentration in the target cells, antagomir‐92a must be repeatedly injected, which increases total doses, risks, and costs.13–14 Moreover, the role of the cluster‐17‐92 in carcinogenesis, tumoral vasculogenesis, and invasiveness has been previously shown, which raises concerns about the safety of nonvectorized administration of antagomirs of this cluster.16–17,16–45 To circumvent these obstacles, different drug delivery systems are being investigated. Liposomes and nanoparticles have been developed and used in vivo, but their use has not avoided the potential problems associated with systemic delivery of microRNAs.46–47 Bioengineered nonpathogenic viruses with affinity for the myocardium have also been used, but biodistribution and incomplete affinity for the myocardium requires higher dosage.48–49 Moreover, no study has demonstrated the efficacy and safety of percutaneous intracoronary administration of these delivery vectors without previous aortic clamp.50 To overcome this hurdle, we devised a suitable vehicle for safe intracoronary administration of an antagomir using ME designed with a biocompatible and bioabsorbable polymer. We demonstrated that ME are retained exclusively in the infarct zone. Therefore, the microencapsulated antagomir‐92a can be delivered directly to the target tissue, allowing sustained release during biodegradation of the particle coating. The dose of antagomir‐92a used in our study (0.1 mg/kg body weight) was fully effective in blocking miR‐92a. A previous study in pigs showed efficacy with local heart delivery of 0.03 mg antagomir‐92a/kg body weight.14 The minimal dose of the microencapsulated antagomir capable of suppressing miR‐92a needs to be determined in further studies. A single intracoronary administration downregulated miR‐92a at least 10 days after treatment, which suggests that the disadvantages of repeated injections for up to 7 days after suffering an AMI could be avoided. Thus, this novel strategy of encapsulation and local action with low total dose and without local or systemic toxicity offers opportunities for the therapeutic application of genetic regulators in a wide range of cardiovascular disorders. The number of animals used to assess miR‐92a inhibition did not allow us to assess the time course of antagomir‐92a effect. However, we think that our results demonstrate an effect of antagomir‐92a at the 3 time‐points. The ME release profile is biphasic, characterized by an immediate and rapid release for the first 24 hours, secondary to superficial particle erosion, followed by a second peak of slower release. This biphasic release pattern could explain the biphasic pattern of miR‐92a inhibition.
In our experiments, the sustained inhibition of miR‐92a in the infarcted tissue induced neoangiogenesis, consistent with previous observations.13–14 Ours is the first study that directly demonstrates significantly lower microvascular resistance in the infarct tissue and retention of the response to adenosine, reflecting functionality of the newly generated vessels at 1 month of follow‐up.
Intracoronary injection of ME may cause capillary or arteriolar occlusion, depending of the size and number of the particles, and can cause myocardial ischemic injury. However, ME are used to measure regional myocardial blood flow in large animals, and it is known that with appropriate doses and particle size no significant effects are observed after repeated injections.22 In fact, we did not observe any significant local adverse effects after multiple injections of ME into healthy myocardium. Moreover, injection of ME should be expected to be even safer when performed on necrotic myocardium.
Finally, our study mortality was similar to that reported in previous experimental AMI studies, without differences between treated and nontreated groups. Of 6 pigs that died, 4 died during AMI induction from causes not related to outcomes: 2 because of technical problems in the surgical preparation and 2 due to arrhythmias. To the best of our knowledge, no relationship has been demonstrated between arrhythmias during the acute phase of ischemia‐reperfusion and adverse ventricular remodeling. One of these 2 animals with arrhythmic death during the acute phase was in the saline group. We cannot rule out that the 2 pigs that died after the ischemia–reperfusion procedure had larger infarcts and/or more adverse ventricular remodeling, but they were equally distributed between the control and the encapsulated antagomir‐92a group. Therefore, we do not think that our analysis may have been biased because loss of data.
In summary, this study shows that a single intracoronary administration of encapsulated antagomir‐92a at the time of reperfusion can stimulate neoangiogenesis in the infarct tissue and prevent adverse ventricular postinfarction remodeling in a clinically relevant model of myocardial infarction without evidence of systemic effects. This new therapeutic approach could be useful in patients with AMI treated with emergent percutaneous coronary intervention and at risk of adverse ventricular remodeling.
Sources of Funding
This work was funded by the Spanish Ministry of Science (SAF 2008/03067) and Carlos III Institute of Health (Cardiovascular Research Network RD12/0042/0021, project grants PI12/00788 and PI12/01738 to Garcia‐Dorado, and supported by grants from the Spanish Society of Cardiology and Ulysses 2011 prize to Bellera. Barba is a recipient of a Ramón y Cajal Fellowship.
Disclosures
Garcia‐Dorado, Bellera, Barba, Rodriguez‐Sinovas, Pérez, Ferret, and Asín hold a patent for microencapsulated antagomir‐92a. The remaining authors report no conflicts of interest.
References
- 1.Savoye C, Equine O, Tricot O, Nugue O, Segrestin B, Sautière K, Elkohen M, Pretorian EM, Taghipour K, Philias A, Aumégeat V, Decoulx E, Ennezat PV, Bauters CREmodelage VEntriculaire study group. Left ventricular remodeling after anterior wall acute myocardial infarction in modern clinical practice (from the REmodelage VEntriculaire (REVE) study group). Am J Cardiol. 2006; 98:1144-1149. [DOI] [PubMed] [Google Scholar]
- 2.Kocher AA, Schuster MD, Szabolcs MJ, Takuma S, Burkhoff D, Wang J, Homma S, Edwards NM, Itescu S. Neovascularization of ischemic myocardium by human bone‐marrow‐derived angioblasts prevents cardiomyocyte apoptosis, reduces remodeling and improves cardiac function. Nat Med. 2001; 7:430-436. [DOI] [PubMed] [Google Scholar]
- 3.Stewart DJ, Kutryk MJ, Fitchett D, Freeman M, Camack N, Su Y, Della Siega A, Bilodeau L, Burton JR, Proulx G, Radhakrishnan S. NORTHERN Trial Investigators. VEGF gene therapy fails to improve perfusion of ischemic myocardium in patients with advanced coronary disease: results of the NORTHERN trial. Mol Ther. 2009; 17:1109-1115. [DOI] [PMC free article] [PubMed] [Google Scholar]
- 4.Engelmann MG, Theiss HD, Hennig‐Theiss C, Huber A, Wintersperger BJ, Werle‐Ruedinger AE, Schoenberg SO, Steinbeck G, Franz WM. Autologous bone marrow stem cell mobilization induced by granulocyte colony‐stimulating factor after subacute ST‐segment elevation myocardial infarction undergoing late revascularization: final results from the G‐CSF‐STEMI (Granulocyte Colony‐Stimulating Factor ST‐Segment Elevation Myocardial Infarction) trial. J Am Coll Cardiol. 2006; 48:1712-1721. [DOI] [PubMed] [Google Scholar]
- 5.Ripa RS, Jørgensen E, Wang Y, Thune JJ, Nilsson JC, Søndergaard L, Johnsen HE, Køber L, Grande P, Kastrup J. Stem cell mobilization induced by subcutaneous granulocyte‐colony stimulating factor to improve cardiac regeneration after acute ST‐elevation myocardial infarction: result of the double‐blind, randomized, placebo‐controlled stem cells in myocardial infarction (STEMMI) trial. Circulation. 2006; 113:1983-1992. [DOI] [PubMed] [Google Scholar]
- 6.Kang HJ, Kim HS, Koo BK, Kim YJ, Lee D, Sohn DW, Oh BH, Park YB. Intracoronary infusion of the mobilized peripheral blood stem cell by G‐CSF is better than mobilization alone by G‐CSF for improvement of cardiac function and remodeling: 2‐year follow‐up results of the Myocardial Regeneration and Angiogenesis in Myocardial Infarction with G‐CSF and Intra‐Coronary Stem Cell Infusion (MAGIC Cell) 1 trial. Am Heart J. 2007; 153:237.e1-237.e8. [DOI] [PubMed] [Google Scholar]
- 7.Karimabad HM, Shabestari M, Baharvand H, Vosough A, Gourabi H, Shahverdi A, Shamsian A, Abdolhoseini S, Moazzami K, Marjanimehr MM, Emami F, Bidkhori HR, Hamedanchi A, Talebi S, Farrokhi F, Jabbari‐Azad F, Fadavi M, Garivani U, Mahmoodi M, Aghdami N. Lack of beneficial effects of granulocyte colony‐stimulating factor in patients with subacute myocardial infarction undergoing late revascularization: a double‐blind, randomized, placebo‐controlled clinical trial. Acta Cardiol. 2011; 66:219-224. [DOI] [PubMed] [Google Scholar]
- 8.Ambros V. The functions of animal microRNAs. Nature. 2004; 431:350-355. [DOI] [PubMed] [Google Scholar]
- 9.Poliseno L, Tuccoli A, Mariani L, Evangelista M, Citti L, Woods K, Mercatanti A, Hammond S, Rainaldi G. MicroRNAs modulate the angiogenic properties of HUVECs. Blood. 2006; 108:3068-3071. [DOI] [PubMed] [Google Scholar]
- 10.Anand S, Cheresh DA. Emerging role of micro‐RNAs in the regulation of angiogenesis. Genes Cancer. 2011; 2:1134-1138. [DOI] [PMC free article] [PubMed] [Google Scholar]
- 11.Urbich C, Kuehbacher A, Dimmeler S. Role of microRNAs in vascular diseases, inflammation, and angiogenesis. Cardiovasc Res. 2008; 79:581-588. [DOI] [PubMed] [Google Scholar]
- 12.Zhu H, Fan GC. Role of microRNAs in the reperfused myocardium towards post‐infarct remodelling. Cardiovasc Res. 2012; 94:284-292. [DOI] [PMC free article] [PubMed] [Google Scholar]
- 13.Bonauer A, Carmona G, Iwasaki M, Mione M, Koyanagi M, Fischer A, Burchfield J, Fox H, Doebele C, Ohtani K, Chavakis E, Potente M, Tjwa M, Urbich C, Zeiher AM, Dimmeler S. MicroRNA‐92a controls angiogenesis and functional recovery of ischemic tissues in mice. Science. 2009; 324:1710-1713. [DOI] [PubMed] [Google Scholar]
- 14.Hinkel R, Penzkofer D, Zühlke S, Fischer A, Husada W, Xu QF, Baloch E, van Rooij E, Zeiher AM, Kupatt C, Dimmeler S. Inhibition of microRNA‐92a protects against ischemia/reperfusion injury in a large‐animal model. Circulation. 2013; 128:1066-1075. [DOI] [PubMed] [Google Scholar]
- 15.Stenvang J, Kauppinen S. MicroRNAs as targets for antisense‐based therapeutics. Expert Opin Biol Ther. 2008; 8:59-81. [DOI] [PubMed] [Google Scholar]
- 16.Tsuchida A, Ohno S, Wu W, Borjigin N, Fujita K, Aoki T, Ueda S, Takanashi M, Kuroda M. miR‐92a is a key oncogenic component of the miR‐17‐92 cluster in colon cancer. Cancer Sci. 2011; 102:2264-2271. [DOI] [PubMed] [Google Scholar]
- 17.Hong L, Lai M, Chen M, Xie C, Liao R, Kang YJ, Xiao C, Hu WY, Han J, Sun P. The miR‐17‐92 cluster of microRNAs confers tumorigenicity by inhibiting oncogene‐induced senescence. Cancer Res. 2010; 70:8547-8557. [DOI] [PMC free article] [PubMed] [Google Scholar]
- 18.Garcia‐Dorado D, Théroux P, Elizaga J, Galiñanes M, Solares J, Riesgo M, Gomez MJ, Garcia‐Dorado A, Fernandez Aviles F. Myocardial reperfusion in the pig heart model: infarct size and duration of coronary occlusion. Cardiovasc Res. 1987; 21:537-544. [DOI] [PubMed] [Google Scholar]
- 19.Hackworthy RA, Sorensen SG, Fitzpatrick PG, Barry WH, Menlove RL, Rothbard RL, Anderson JL. Dependence of assessment of coronary artery reperfusion during acute myocardial infarction on angiographic criteria and interobserver variability. Am J Cardiol. 1988; 62:538-542. [DOI] [PubMed] [Google Scholar]
- 20.Fearon WF, Balsam LB, Farouque HM, Caffarelli AD, Robbins RC, Fitzgerald PJ, Yock PG, Yeung AC. Novel index for invasively assessing the coronary microcirculation. Circulation. 2003; 107:3129-3132. [DOI] [PubMed] [Google Scholar]
- 21.Hochman JS, Choo H. Limitation of myocardial infarct expansion by reperfusion independent of myocardial salvage. Circulation. 1987; 75:299-306. [DOI] [PubMed] [Google Scholar]
- 22.Kowallik P, Schulz R, Guth BD, Schade A, Paffhausen W, Gross R, Heusch G. Measurement of regional myocardial blood flow with multiple colored microspheres. Circulation. 1991; 83:974-982. [DOI] [PubMed] [Google Scholar]
- 23.Rodríguez‐Sinovas A, Bis J, Anivarro I, de la Torre J, Bayés‐Genís A, Cinca J. Coronary smooth muscle reactivity to muscarinic stimulation after ischemia‐reperfusion in porcine myocardial infarction. J Appl Physiol. 2003; 95:81-88. [DOI] [PubMed] [Google Scholar]
- 24.Kirkpatrick JN, St John Sutton M. Assessment of ventricular remodeling in heart failure clinical trials. Curr Heart Fail Rep. 2012; 9:328-336. [DOI] [PubMed] [Google Scholar]
- 25.Parodi G, Antoniucci D. Left ventricular remodeling after primary percutaneous coronary intervention. Am Heart J. 2010; 160:S11-S15. [DOI] [PubMed] [Google Scholar]
- 26.Wei S, Chow LT, Sanderson JE. Effect of carvedilol in comparison with metoprolol on myocardial collagen postinfarction. J Am Coll Cardiol. 2000; 36:276-281. [DOI] [PubMed] [Google Scholar]
- 27.Thireau J, Karam S, Fauconnier J, Roberge S, Cassan C, Cazorla O, Aimond F, Lacampagne A, Babuty D, Richard S. Functional evidence for an active role of B‐type natriuretic peptide in cardiac remodelling and pro‐arrhythmogenicity. Cardiovasc Res. 2012; 95:59-68. [DOI] [PubMed] [Google Scholar]
- 28.Yu H, Zhao G, Li H, Liu X, Wang S. Candesartan antagonizes pressure overload‐evoked cardiac remodeling through Smad7 gene‐dependent MMP‐9 suppression. Gene. 2012; 497:301-306. [DOI] [PubMed] [Google Scholar]
- 29.Pitt B, Remme W, Zannad F, Neaton J, Martinez F, Roniker B, Bittman R, Hurley S, Kleiman J, Gatlin MEplerenone Post‐Acute Myocardial Infarction Heart Failure Efficacy and Survival Study Investigators. Eplerenone, a selective aldosterone blocker, in patients with left ventricular dysfunction after myocardial infarction. N Engl J Med. 2003; 348:1309-1321. [DOI] [PubMed] [Google Scholar]
- 30.Carluccio E, Biagioli P, Alunni G, Murrone A, Pantano P, Biscottini E, Zuchi C, Zingarini G, Cavallini C, Ambrosio G. Presence of extensive LV remodeling limits the benefits of CRT in patients with intraventricular dyssynchrony. JACC Cardiovasc Imaging. 2011; 4:1067-1076. [DOI] [PubMed] [Google Scholar]
- 31.Orlic D, Kajstura J, Chimenti S, Jakoniuk I, Anderson SM, Li B, Pickel J, McKay R, Nadal‐Ginard B, Bodine DM, Leri A, Anversa P. Bone marrow cells regenerate infarcted myocardium. Nature. 2001; 410:701-705. [DOI] [PubMed] [Google Scholar]
- 32.Kühn B, del Monte F, Hajjar RJ, Chang YS, Lebeche D, Arab S, Keating MT. Periostin induces proliferation of differentiated cardiomyocytes and promotes cardiac repair. Nat Med. 2007; 13:962-969. [DOI] [PubMed] [Google Scholar]
- 33.Anversa P, Nadal‐Ginard B. Myocyte renewal and ventricular remodelling. Nature. 2002; 415:240-243. [DOI] [PubMed] [Google Scholar]
- 34.Ørn S, Manhenke C, Greve OJ, Larsen AI, Bonarjee VV, Edvardsen T, Dickstein K. Microvascular obstruction is a major determinant of infarct healing and subsequent left ventricular remodelling following primary percutaneous coronary intervention. Eur Heart J. 2009; 30:1978-1985. [DOI] [PubMed] [Google Scholar]
- 35.Weir RA, Murphy CA, Petrie CJ, Martin TN, Balmain S, Clements S, Steedman T, Wagner GS, Dargie HJ, McMurray JJ. Microvascular obstruction remains a portent of adverse remodeling in optimally treated patients with left ventricular systolic dysfunction after acute myocardial infarction. Circ Cardiovasc Imaging. 2010; 3:360-367. [DOI] [PubMed] [Google Scholar]
- 36.Lombardo A, Niccoli G, Natale L, Bernardini A, Cosentino N, Bonomo L, Crea F. Impact of microvascular obstruction and infarct size on left ventricular remodeling in reperfused myocardial infarction: a contrast‐enhanced cardiac magnetic resonance imaging study. Int J Cardiovasc Imaging. 2012; 28:835-842. [DOI] [PubMed] [Google Scholar]
- 37.Ohtsuka M, Takano H, Zou Y, Toko H, Akazawa H, Qin Y, Suzuki M, Hasegawa H, Nakaya H, Komuro I. Cytokine therapy prevents left ventricular remodeling and dysfunction after myocardial infarction through neovascularization. FASEB J. 2004; 18:851-853. [DOI] [PubMed] [Google Scholar]
- 38.Fish JE, Srivastava D. MicroRNAs: opening a new vein in angiogenesis research. Sci Signal. 2009; 2:pe1. [DOI] [PMC free article] [PubMed] [Google Scholar]
- 39.Woodiwiss AJ, Tsotetsi OJ, Sprott S, Lancaster EJ, Mela T, Chung ES, Meyer TE, Norton GR. Reduction in myocardial collagen cross‐linking parallels left ventricular dilatation in rat models of systolic chamber dysfunction. Circulation. 2001; 103:155-160. [DOI] [PubMed] [Google Scholar]
- 40.Badenhorst D, Maseko M, Tsotetsi OJ, Naidoo A, Brooksbank R, Norton GR, Woodiwiss AJ. Cross‐linking influences the impact of quantitative changes in myocardial collagen on cardiac stiffness and remodelling in hypertension in rats. Cardiovasc Res. 2003; 57:632-641. [DOI] [PubMed] [Google Scholar]
- 41.Luther DJ, Thodeti CK, Shamhart PE, Adapala RK, Hodnichak C, Weihrauch D, Bonaldo P, Chilian WM, Meszaros JG. Absence of type VI collagen paradoxically improves cardiac function, structure, and remodeling after myocardial infarction. Circ Res. 2012; 110:851-856. [DOI] [PMC free article] [PubMed] [Google Scholar]
- 42.Shamhart PE, Meszaros JG. Non‐fibrillar collagens: key mediators of post‐infarction cardiac remodeling? J Mol Cell Cardiol. 2010; 48:530-537. [DOI] [PubMed] [Google Scholar]
- 43.Venturini L, Battmer K, Castoldi M, Schultheis B, Hochhaus A, Muckenthaler MU, Ganser A, Eder M, Scherr M. Expression of the miR‐17‐92 polycistron in chronic myeloid leukemia (CML) CD34+ cells. Blood. 2007; 109:4399-4405. [DOI] [PubMed] [Google Scholar]
- 44.Dews M, Homayouni A, Yu D, Murphy D, Sevignani C, Wentzel E, Furth EE, Lee WM, Enders GH, Mendell JT, Thomas‐Tikhonenko A. Augmentation of tumor angiogenesis by a Myc‐activated microRNA cluster. Nat Genet. 2006; 38:1060-1065. [DOI] [PMC free article] [PubMed] [Google Scholar]
- 45.He L, Thomson JM, Hemann MT, Hernando‐Monge E, Mu D, Goodson S, Powers S, Cordon‐Cardo C, Lowe SW, Hannon GJ, Hammond SM. A microRNA polycistron as a potential human oncogene. Nature. 2005; 435:828-833. [DOI] [PMC free article] [PubMed] [Google Scholar]
- 46.Verma DD, Hartner WC, Levchenko TS, Bernstein EA, Torchilin VP. ATP‐loaded liposomes effectively protect the myocardium in rabbits with an acute experimental myocardial infarction. Pharm Res. 2005; 22:2115-2120. [DOI] [PubMed] [Google Scholar]
- 47.Hood JD, Bednarski M, Frausto R, Guccione S, Reisfeld RA, Xiang R, Cheresh DA. Tumor regression by targeted gene delivery to the neovasculature. Science. 2002; 296:2404-2407. [DOI] [PubMed] [Google Scholar]
- 48.Miyazaki Y, Adachi H, Katsuno M, Minamiyama M, Jiang YM, Huang Z, Doi H, Matsumoto S, Kondo N, Iida M, Tohnai G, Tanaka F, Muramatsu S, Sobue G. Viral delivery of miR‐196a ameliorates the SBMA phenotype via the silencing of CELF2. Nat Med. 2012; 18:1136-1141. [DOI] [PubMed] [Google Scholar]
- 49.Barr E, Carroll J, Kalynych AM, Tripathy SK, Kozarsky K, Wilson JM, Leiden JM. Efficient catheter‐mediated gene transfer into the heart using replication‐defective adenovirus. Gene Ther. 1994; 1:51-58. [PubMed] [Google Scholar]
- 50.Iwatate M, Gu Y, Dieterle T, Iwanaga Y, Peterson KL, Hoshijima M, Chien KR, Ross J. In vivo high‐efficiency transcoronary gene delivery and Cre–LoxP gene switching in the adult mouse heart. Gene Ther. 2003; 10:1814-1820. [DOI] [PubMed] [Google Scholar]
