A general method to improve fluorophores for live-cell and single-molecule microscopy (original) (raw)
. Author manuscript; available in PMC: 2015 Sep 1.
Published in final edited form as: Nat Methods. 2015 Jan 19;12(3):244–250. doi: 10.1038/nmeth.3256
Abstract
Specific labeling of biomolecules with bright fluorophores is the keystone of fluorescence microscopy. Genetically encoded self-labeling tag proteins can be coupled to synthetic dyes inside living cells, resulting in brighter reporters than fluorescent proteins. Intracellular labeling using these techniques requires cell-permeable fluorescent ligands, however, limiting utility to a small number of classic fluorophores. Here, we describe a simple structural modification that improves the brightness and photostability of dyes while preserving spectral properties and cell permeability. Inspired by molecular modeling, we replaced the N,_N_-dimethylamino substituents in tetramethylrhodamine with four-membered azetidine rings. This addition of two carbon atoms doubles the quantum efficiency and improves the photon yield of the dye in applications ranging from in vitro single-molecule measurements to super-resolution imaging. The novel substitution is generalizable, yielding a palette of chemical dyes with improved quantum efficiencies that spans the UV and visible range.
Introduction
Fluorescence imaging of specific intracellular molecules requires precise labeling with bright, photostable fluorophores. Genetically encoded fluorophores (green fluorescent protein, GFP, and variants) excel with regard to their genetic specificity of labeling,1 but lack the requisite photostability for single-molecule microscopy and other photon-intensive imaging paradigms.2 Over the past two decades, a number of alternative labeling strategies have been developed that combine the genetic specificity of fluorescent proteins with the favorable photophysics of small molecule fluorophores. These include FlAsH,3 enzyme-based “self-labeling tags” (e.g., SnapTag4 and HaloTag5,6), electrophilic ligand–receptor pairs (e.g., TMPTag7 and coumarin–PYP8), and lipoic acid ligase variants.9 In particular, the self-labeling tags have enabled advanced imaging experiments inside living cells such as super-resolution microscopy7,10,11 and biomolecular tracking at single-molecule resolution.12,13
Although the general collection of chemical dyes is extensive,14–16 relatively few exhibit the cell permeability needed for intracellular labeling. Thus, the available palette of intracellular self-labeling tag ligands has been limited to classic, net neutral fluorophores based on coumarin and rhodamine scaffolds,4–6,17,18 which exhibit excellent membrane permeability and rapid labeling kinetics, but suboptimal brightness and photostability. Previous campaigns to improve dye performance (e.g., Cy, Alexa Fluor), involved substantial modifications such as structural rigidification and addition of sulfonate groups.19–21 These efforts resulted in highly polar, cell-impermeant dyes, useful in vitro22 or on the cell exterior,23 but incompatible with live-cell intracellular applications.
We sought, and now report, a general strategy to improve the brightness of fluorophores through a minimal structural change, thereby preserving cell permeability and efficiency of intracellular labeling. Based on molecular modeling, we replaced the N,_N_-dimethyl group in the classic dye tetramethylrhodamine (TMR) with a four-membered azetidine ring. This minor alteration—a net addition of two carbon atoms—elicited a large increase in quantum yield relative to the parent fluorophore, enabling prolonged observations of single molecules in tracking experiments and localization microscopy with improved spatial resolution. We expanded this strategy to other fluorophores including the coumarin, naphthalimide, acridine, rhodol, carborhodamine, oxazine, and silarhodamine classes, where the straightforward replacement of N,_N_-dialkylamino groups with azetidines also increased quantum yield. This general method represents a marked advance in the chemistry of synthetic labels for biological imaging, allowing substantial improvements in brightness while preserving the requisite small size and high membrane permeability for use in live cells.
Results
Rational design of an improved tetraalkylrhodamine dye
The simplest rhodamine fluorophore, rhodamine 110 (1, Fig. 1a), exhibits an absorption maximum in the blue (_λ_max = 497 nm) with a large extinction coefficient (ε = 7.6 × 10⁴ M−1cm−1), emission in the green (_λ_em = 520 nm), and a high quantum yield (Φ = 0.88).24 Alkylation of the rhodamine elicits a bathochromic shift in absorption and fluorescence emission wavelengths. For example, TMR (2) displays _λ_max/_λ_em = 548 nm/572 nm and ε = 7.8 × 10⁴ M−1cm−1 (Fig. 1a). This shift in spectral properties is accompanied by a large decrease in quantum yield, with TMR showing Φ = 0.41 in aqueous solution. Both of these dyes are used in commercial self-labeling tag substrates and can be used to label intracellular and extracellular proteins in living cells.
Figure 1. Development and utility of JF549.

(a) Spectroscopic data for rhodamines 1–7. (b) Jabłoński diagram showing the process of twisted internal charge transfer (TICT). (c) Synthesis of rhodamines 3–7 from fluorescein (8) using Pd-catalyzed cross-coupling. (d) Two-photon excitation spectra of fluorophores 2, 4–7. (e) Normalized absorption (abs) and fluorescence emission (fl) spectra for tetramethylrhodamine (2) and JF549 (4). (f) Chemical structure of JF549–HaloTag ligand 9 and TMR–HaloTag ligand 10. (g) Confocal maximum projection image of nucleus from a live, washed HeLa cell expressing HaloTag–H2B and incubated with JF549–HaloTag ligand 9; scale bar = 5 μm. (h) Whisker plot comparing brightness and track length of HaloTag–H2B molecules labeled with ligand 9 or 10 (n > 4,000); cross indicates mean; whiskers span 10–90 percentile. (i) _d_STORM fluorescence microscopy image of a fixed U2OS cell expressing HaloTag–H2B and labeled with JF549 ligand 9. The _d_STORM image is comprised of 10,000 consecutive frames and the 44,937 detected particles are displayed according to their localization FWHM. The mean localization error was 17.2 nm, the median localization error was 14.1 nm; scale bar = 5 μm.
A plausible explanation for the lower quantum efficiency of _N,N,N′,N′_-tetraalkylrhodamines such as 2 is the formation of a twisted internal charge transfer (TICT) state. In this process fluorophore 2 absorbs a photon to give an excited state (2*, Fig. 1b), followed by electron transfer from the nitrogen atom to the xanthene ring system with concomitant twisting of the Caryl–N bond (2TICT). TICT is energetically favorable in tetraalkylrhodamine dyes due to the lower ionization potential of N,_N_-dialkylanilines versus less substituted anilines.25 The TICT form relaxes without emission of a photon leading to rapid nonradiative decay of the excited state.25–27 The 2TICT diradical intermediate may also undergo irreversible bleaching reactions.27 Thus, rhodamine derivatives where TICT is disfavored should exhibit increased quantum efficiency, longer fluorescence lifetimes, and higher photostability.
Based on this hypothesis, we reasoned that replacing the N,_N_-dimethyl group in TMR (2) with different sized nitrogen-containing rings (ranging from aziridine to azepane, compounds 3–7, Fig. 1a) might mitigate TICT and improve fluorescent properties. Although previous work had shown the pyrrolidine-containing rhodamine 5 to have a higher fluorescence brightness than the piperidino-rhodamine 6,25,28 azacyclic-rhodamines with smaller or larger ring sizes (3, 4, and 7) had not been explored. Based on quantum mechanical calculations, we predicted that the novel azetidinyl-rhodamine 4 would exhibit superior brightness to TMR (2) and the other alkylated rhodamines 3, 5, 6 and 7 (Supplementary Note).
To test this prediction we synthesized compounds 3–7 from fluorescein (8) using a Pd-catalyzed cross-coupling approach (Fig. 1c, Supplementary Note).28 We then evaluated the photophysical properties of compounds 3–7 in aqueous solution, comparing them to known rhodamines 1 and 2 (Fig. 1a, Supplementary Fig. 1a). Aziridine derivative 3 gave a colorless solution with no discernible fluorescence, suggesting the ring strain in the aziridine substituents forces the rhodamine molecule to adopt a colorless, nonfluorescent lactone form. Compounds 4–7 showed _λ_max and _λ_em values similar to TMR (2) with increased ring size causing a slight bathochromic shift of up to 10 nm. Compounds 4 and 7 showed a ~30% higher extinction coefficient than the other dyes; values of this magnitude have been observed with tetraethylrhodamine.15,28
Although the _λ_max, _λ_em, and ε of the different rhodamine dyes showed only modest dependence on substituent ring size, the fluorescence lifetime (τ) and quantum yield (Φ) varied widely as a function of molecular structure (Fig. 1a). Rhodamine 4 exhibited a high quantum yield value (Φ = 0.88) and long fluorescence lifetime (τ = 3.8 ns), larger than the values for TMR (2; Φ = 0.41, τ = 2.2 ns), and similar to the parent rhodamine 110 (1; Φ = 0.88, τ = 3.3 ns). Rhodamine 4 was also 60% brighter than the pyrrolidine derivative 5, which showed Φ = 0.74 and τ = 3.6 ns. The piperidine derivative 6 showed a sharp decrease in fluorescence with Φ = 0.10 and τ = 0.6 ns; the lifetime values for 5 and 6 are consistent with those measured for similar fluorophores.25 Rhodamine 7 gave slightly higher values of Φ = 0.25 and τ = 1.62 ns relative to 6, suggesting that the increased flexibility of this larger ring can offset the other deleterious structural effects on rhodamine fluorescence.
The improved brightness of rhodamine 4 under one-photon excitation (Fig. 1a) extended to two-photon excitation (Fig. 1d, Supplementary Fig. 1b). This enhancement is brought about by a negligible structural change—the addition of two carbon atoms—that preserves many of the desirable properties of TMR. For example, the absorption and emission spectra of 2 and 4 are superimposable (Fig. 1e) and the dyes show comparable sensitivity to solvent polarity (Supplementary Fig. 1c), suggesting similar cell permeability.18,24 Based on its high brightness, favorable chemical properties, and _λ_max = 549 nm, azetidinylrhodamine 4 was given the name “JF549” (Janelia Fluor 549).
Utility of JF549 in cellular imaging
To evaluate the performance of the dye as a label, we synthesized JF549–HaloTag ligand (9, Fig. 1f) starting from a 6-carboxyfluorescein derivative (Supplementary Note). This molecule is a direct analog of the commercial TMR-based HaloTag ligand 10. We compared the labeling kinetics of compounds 9 and 10 with a novel Cy3 HaloTag ligand, and measured the brightness and photon yield of the resulting conjugates. The JF549 ligand (9) showed comparable labeling kinetics to the TMR ligand (10) and increased brightness relative to the other dyes (Supplementary Note). Incubation of live cells expressing a HaloTag–histone 2B (H2B) fusion with compound 9 resulted in bright nuclear labeling (Fig. 1g) and low cytoplasmic background, demonstrating that the JF549 HaloTag ligand can efficiently cross the membrane of live cells and selectively label the HaloTag protein.
Incubation of 9 or 10 using low amounts of ligand (<50 nM) allowed imaging of single molecules (Supplementary Video 1) and evaluation of fluorophore brightness (photons/s) and photostability (i.e., tracklength, s) of individual molecules of labeled HaloTag–H2B. The JF549 ligand 9 demonstrated a large increase in both brightness and photostability compared to TMR ligand 10 (Fig. 1h). Proteins labeled with 10 showed average photons/s = 1.1 × 10⁴ and a mean track length of 0.72 s. Conjugates of JF549 ligand 9 emit nearly twice the number of photons/s (1.9 × 10⁴) and last about twice as long (average track length = 1.6 s). This improvement in single molecule brightness extended to direct stochastic optical reconstruction microscopy experiments (_d_STORM), where the use of a reducing environment enables the reversible photoswitching of synthetic fluorophores.7,29–31 We labeled cells expressing HaloTag–H2B with JF549 ligand 9 or TMR ligand 10, followed by fixation and imaging using standard _d_STORM conditions. This resulted in a super-resolution image of H2B using ligand 9 (Fig. 1i) or molecule 10 (Supplementary Fig. 2a) with median localization errors (σ) of 14.1 nm and 17.0 nm, respectively (Supplementary Fig. 2b). We could also perform _d_STORM inside living cells using the cellular reducing environment to elicit photoswitching of the JF549 label (Supplementary Fig. 2c).7 Together, our results establish JF549 as the best available ligand in this spectral range for HaloTag conjugation in vitro, in fixed cells, and in live cells, validating our fluorophore design strategy.
Extension of the azetidine strategy to other dye scaffolds
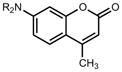
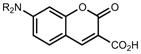
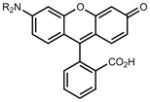
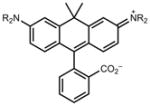
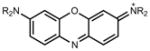
Based on the improved brightness observed with the rhodamine scaffold, we sought to replace N,_N_-dialkyl groups found in other fluorophores with azetidines. The N,_N_-dialkyl motif is found in numerous classic fluorophore scaffolds (Table 1),14 including coumarins (e.g., 11, Coumarin 461), naphthalimides, acridines (e.g., 17, Acridine Orange), rhodols, carborhodamines,24 oxazines (e.g., 23, Oxazine 1), and silarhodamines.18,32 TICT has been proposed as a major contributor to nonradiative decay in these fluorescent systems, leading to modest quantum efficiencies.26 As with the rhodamine case, we used an efficient Pd-catalyzed cross-coupling approach to install the azetidine motif in these fluorophores, starting from accessible aryl halides or aryl triflates (Supplementary Note).
Table 1.
Spectroscopic data for fluorophores 11–26
| Parent structure | Substitution | _λ_max (nm) | ε (M−1 cm−1 | _λ_em (nm) | Φ |
|---|---|---|---|---|---|
 |
 |
372 | 18,000 | 470 | 0.19 |
 |
354 | 15,000 | 467 | 0.96 | |
 |
 |
410 | 35,000 | 471 | 0.03 |
 |
387 | 24,000 | 470 | 0.84 | |
 |
 |
436 | 9,500 | – | <0.01 |
 |
464 | 18,000 | 553 | 0.28 | |
 |
 |
493 | 50,000 | 528 | 0.21 |
 |
492 | 47,000 | 531 | 0.52 | |
 |
 |
518 | 60,000 | 546 | 0.21 |
 |
519 | 59,000 | 546 | 0.85 | |
 |
 |
606 | 121,000 | 626 | 0.52 |
 |
608 | 99,000 | 631 | 0.67 | |
 |
 |
655 | 111,000 | 669 | 0.07 |
 |
647 | 99,000 | 661 | 0.24 | |
 |
 |
643 | 141,000a | 662 | 0.41 |
 |
646 | 152,000a | 664 | 0.54 |
In all cases the azetidine substitution imparted large increases in quantum yield without substantial deleterious effects on other spectral properties (Table 1, Supplementary Fig. 3). Coumarin 461 (11) exhibits _λ_max/_λ_em = 372 nm/470 nm, ε = 1.8 × 10⁴ M−1cm−1, and a modest Φ = 0.19 in aqueous buffer. The analog 12 shows a five-fold increase in quantum yield (Φ = 0.96) along with an 18-nm hypsochromic shift in absorbance maxima (_λ_max = 354 nm). The emission spectrum and extinction coefficient of 12 (_λ_max = 467 nm, ε = 1.5 × 10⁴ M−1cm−1) were similar to the parent dye 11. The widely used 7-(diethylamino)coumarin-3-carboxylic acid (DEAC, 13) displays _λ_max/_λ_em = 410 nm/471 nm, ε = 3.5 × 10⁴ M−1cm−1, but a low quantum yield (Φ = 0.03). The azetidinyl analog 14 showed a shorter absorption maximum (_λ_max = 387 nm) and a smaller extinction coefficient (ε = 2.4 × 10⁴ M−1cm−1). Nonetheless, the emission maxima proved quite similar with _λ_em = 470 nm, and the azetidine substitution increased the quantum yield by almost 30-fold (Φ = 0.84).
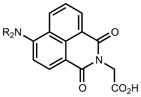
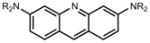
We then considered the napthalimide, acridine, and rhodol fluorophore scaffolds. Dimethylamino-substituted naphthalimides such as compound 15 are important environmentally sensitive fluorophores,33 but have not been useful as general fluorescent labels due to their poor absorbance and fluorescence in water (_λ_max = 436 nm, ε = 9.5 × 10³ M−1cm−1, Φ < 0.01, Table 1). We prepared the azetidinyl analog 16, which showed a bathochromic shift in absorbance maxima (_λ_max = 464 nm), a larger extinction coefficient (ε = 1.8 × 10⁴ M−1cm−1), and a high quantum yield (Φ = 0.28, _λ_em = 553 nm). The classic fluorophore Acridine Orange (17) gave Φ = 0.21 when measured in aqueous solution, consistent with published data.34 The azetidine analog 18 was 2.5-fold brighter with Φ = 0.52. Other spectral properties of the two acridines were similar. Rhodol 19 showed _λ_max/_λ_em = 518 nm/546 nm, and ε = 6.0 × 10⁴ M−1cm−1 and Φ = 0.21, consistent with previous results.35 The azetidine-containing analog 20 had nearly indistinguishable _λ_max, _λ_em, and ε values. However, the replacement of the N,_N_-dimethylamino group in 19 with an azetidine in 20 gave a 4-fold increase in quantum yield (Φ = 0.85).
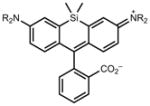
We then turned to longer-wavelength fluorophores. The carbon-containing analog of tetramethylrhodamine (21) exhibited _λ_max/_λ_em = 606 nm/626 nm, ε = 1.21 × 10⁵ M−1cm−1, and Φ = 0.52 in aqueous buffer (Table 1). The azetidinyl-carborhodamine 22 showed similar absorption and emission maxima (_λ_max/_λ_em = 608 nm/631 nm) and extinction coefficient (ε = 9.9 × 10⁴ M−1cm−1), but a higher quantum yield (Φ = 0.67). The classic dye Oxazine 1 (23) showed spectral properties in the far red with _λ_max/_λ_em = 655 nm/669 nm and ε = 1.11 × 10⁵ M−1cm−1, but a relatively low Φ = 0.07. The azetidine substitution in dye 24 gave a small hypsochromic shift (_λ_max/_λ_em = 647 nm/661 nm), a slightly lower extinction coefficient (ε = 9.9 × 10⁴ M−1cm−1), and a 3.4-fold improvement in quantum yield (Φ = 0.24). Finally, the recently described silicon-containing TMR (SiTMR, 25)18,32 showed _λ_max/_λ_em = 643 nm/662 nm and Φ = 0.41; the azetidinyl analog 26 gave similar absorption and emission maxima (_λ_max/_λ_em = 643 nm/662 nm) and a higher Φ = 0.54. Since silarhodamines often adopt a colorless form in water,18,32 we measured the extinction coefficients in acidic ethanol, finding ε = 1.41 × 10⁵ M−1cm−1 for SiTMR (25) and ε = 1.52 × 10⁵ M−1cm−1 for azetidine 26. Overall, these results demonstrate that the azetidinyl substitution is generalizable to different fluorophore scaffolds, producing substantial improvements in quantum yield values.
Cellular imaging using azetidinyl silarhodamine
Compounds based on SiTMR (25) were previously reported to be efficient labels for the SnapTag, HaloTag, and other proteins inside live cells.18,32 Compound 26 exhibits superior brightness (ε × Φ, Table 1) relative to 25 and was given the name JF646 (Janelia Fluor 646). To compare these two dyes directly in cellular imaging experiments we synthesized the HaloTag ligand of the azetidinyl-silarhodamine (27, Fig. 2a) and the known18 HaloTag ligand of SiTMR (28), starting from a novel silafluorescein precursor (Supplementary Note). Both silarhodamine ligands 27 and 28 were excellent labels for super-resolution _d_STORM imaging of HaloTag–H2B (Fig. 2b, Supplementary Fig. 4a), showing median localization errors of 8.4 nm and 9.0 nm, respectively (Supplementary Fig. 4b). We also performed _d_STORM on live cells expressing HaloTag–tubulin and labeled with JF646 ligand 27. We observed excellent photon yields and low background with this label, giving a median σ = 7.1 nm (Supplementary Fig. 4c–e).
Figure 2. Utility of JF646 in cellular imaging.

(a) Chemical structures of JF646–HaloTag ligand 27 and SiTMR–HaloTag ligand 28. (b) _d_STORM fluorescence microscopy image of fixed U2OS cells expressing HaloTag–H2B and labeled with 27. The _d_STORM image is comprised of 5,000 consecutive frames and the 263,415 detected particles are displayed according to their localization FWHM. The mean localization error was 11.1 nm, the median localization error was 8.4 nm; scale bar = 5 μm. (c, d) Absorbance spectra of ligands 28 (5 μM; c) and 27 (5 μM; d) in the absence (−HT) and presence (+HT) of excess HaloTag protein. (e, f) Wide-field fluorescence microscopy image of a live HeLa cell transfected with H2B–HaloTag, incubated with 28 (100 nM; e) or 27 (100 nM; f), and imaged without intermediate washing steps; dashed line indicates cellular boundary; scale bars: 5 μm. (g) Plot of line scan intensity in e (green) as a function of line length. (h) Plot of line scan intensity in f (magenta) as a function of line length. (i) Chemical structure of JF549–SnapTag ligand 29. (j) Overlay of the _d_STORM image of H2B and regions of fast TetR diffusivity (2–10 μm2 s−1; yellow) and slow TetR diffusivity (<2 μm2 s−1; blue).
As noted above, the free silarhodamine dyes 25 and 26 exhibit low visible absorption in aqueous solution, suggesting that the dyes preferentially adopt the closed, UV-absorbing, lactone form. However, conjugation to a protein changes the local environment around the dye, eliciting a large increase in absorbance.18,32 We compared the chromogenicity of ligands 27 and 28 upon reaction with purified protein and in live-cell imaging experiments. The SiTMR ligand 28 showed an enhancement of 6.8-fold upon reaction with excess HaloTag protein in buffer (Fig. 2c), consistent with previous reports.18 The azetidinyl-silarhodamine–HaloTag ligand 27 showed lower background, leading to a larger, 21-fold increase in absorbance under the same conditions (Fig. 2d). We then performed “no wash” imaging experiments using cells expressing the HaloTag–H2B fusion. Incubation with either ligand (100 nM) followed directly by wide-field imaging gave brightly labeled nuclei using both the SiTMR ligand 28 (Fig. 2e) and the JF646 ligand 27 (Fig. 2f). However, SiTMR showed substantial extranuclear fluorescence (Fig. 2g), whereas the JF646 ligand exhibited lower nonspecific staining (Fig. 2h, Supplementary Fig. 4f). Overall, these results show the known SiTMR ligand 28 can be replaced with the structurally similar JF646 ligand 27 to achieve better localization error in super-resolution imaging and lower background in conventional fluorescence microscopy.
The excellent properties of JF549 and JF646 and the large spectral separation between the two fluorophores raised the possibility of imaging two distinct protein species at the single-molecule level in the same living cell. To achieve orthogonal labeling, we prepared the SnapTag ligand of JF549 (29, Fig. 2i, Supplementary Note). We coexpressed HaloTag–H2B and a fusion of the SnapTag enzyme and the Tet repressor protein (SnapTag–TetR) and labeled the HaloTag–H2B with JF646 ligand 27 and the SnapTag–TetR with JF549 ligand 29. We imaged the trajectories of individual JF549-labeled TetR proteins followed by a rapid live-cell _d_STORM experiment of the JF646–H2B conjugate (Supplementary Fig. 4g, Supplementary Video 2). This proof-of-concept, two-color experiment revealed the respective partitions of fast- and slow-diffusing DNA-binding protein in relation to the chromatin structure of the nucleus (Fig. 2j) and showed slowly diffusing TetR colocalized with H2B to a greater extent than with non-colocalized positions (Supplementary Fig. 4h), consistent with previous observations that inert tracers diffuse more slowly in dense chromatin regions.36
Cellular imaging using an azetidinyl-coumarin label
The improvements to coumarin 13 brought about by the azetidine substitution were also interesting, as derivatives of this cell-permeable dye can be used for intracellular labeling. We compared the performance of a commercial SnapTag ligand 30 (i.e., Snap Cell 430; Fig. 3a) to a novel azetidinyl derivative 31, which we synthesized from coumarin 14 (Supplementary Note). Under identical transient transfection, labeling, and imaging conditions, H2B–SnapTag-expressing cells were stained with the red fluorescent nuclear stain DRAQ5 and either known ligand 30 or azetidinyl ligand 31. Using the DRAQ5 staining as a spatial reference (Fig. 3b, c) we measured the intensity of individual nuclei labeled by either SnapTag ligand. Cells incubated with ligand 30 showed low fluorescence intensity (Fig. 3d) whereas cells labeled with 31 showed brighter nuclear labeling (Fig. 3e). Quantification of nuclear intensity showed the cells labeled with azetidine 31 were on average five-fold higher than cells labeled with the commercial compound 30 (Fig. 3f).
Figure 3. Utility of azetidinyl coumarins in cellular imaging.

(a) Chemical structures of commercial coumarin SnapTag ligand 30 and azetidine-containing ligand 31. (b, d) Wide-field fluorescence microscopy images of live HeLa cells expressing SnapTag–H2B and labeled with DRAQ5 and commercial SnapTag ligand 30. (b) Fluorescence of DRAQ5 nuclear staining. (d) Fluorescence of coumarin 30-labeled SnapTag–H2B. (c, e) Wide-field fluorescence microscopy image of live HeLa cells expressing SnapTag–H2B and labeled with DRAQ5 and novel azetidinyl-coumarin SnapTag ligand 31. (c) Fluorescence of DRAQ5 nuclear staining. (e) Fluorescence of coumarin 31-labeled SnapTag–H2B. Scale bars for all images: 50 μm. (f) Quantification of the average nuclear fluorescence above background coumarin label in cells when labeled with ligand 30 (black) or 31 (magenta; error bars show s.e.m.).
Discussion
We report a simple structural modification—the replacement of N,_N_-dialkyl groups with azetidines—that improves the quantum efficiency of classic fluorophores with absorbance maxima from the UV to the far-red. In particular, the azetidine substitution endows JF549 and JF646 with superior brightness while retaining excellent cell penetration and fast labeling kinetics with the HaloTag. These novel dyes should facilitate new microscopic experiments such as multiplexed single-molecule measurements at a high spatiotemporal resolution inside living cells (e.g., Fig. 2j). Such experiments will constitute a major tool in testing models relating molecular architecture and biological dynamics.36,37
In addition to serving as ligands for self-labeling tags, many classic fluorophores are components of fluorescent labels, stains, and indicators.14,15,21 Replacement of the dialkylamino groups in these molecules with azetidines could yield a new generation of probes with improved properties. For example, derivatives of the bright coumarin fluorophores 12 and 14 could find use in other protein-based labeling schemes8,9 or as non-natural amino acids,38 where the size of the fluorophore label is restricted by the biochemical machinery. This general approach to attenuate nonradiative decay sets the stage for combinatorial enhancements via other structural modifications, such as halogenation39 or attachment of triplet-state quenchers,40 to further improve brightness and photostability, altogether pushing the limits of biological imaging.
Online Methods
General Spectroscopic Methods
Fluorescent and fluorogenic molecules for spectroscopy were prepared as stock solutions in DMSO and diluted such that the DMSO concentration did not exceed 1% v/v. Phosphate buffered saline (PBS) was at pH 7.4 unless otherwise noted. Commercial compounds for spectroscopy were of the highest quality available and obtained from the following sources: Exciton (1); Anaspec (2); Promega (10); Sigma–Aldrich (11, 13); Life Technologies (17); AAT Bioquest (23); New England BioLabs (30).
UV–Vis and Fluorescence Spectroscopy
Spectroscopy was performed using 1-cm path length, 3.5-mL quartz cuvettes from Starna Cells or 1-cm path length, 1.0-mL quartz microcuvettes from Hellma. All measurements were taken at ambient temperature (22 ± 2 °C) in 10 mM HEPES, pH 7.3 buffer unless otherwise noted. Absorption spectra were recorded on a Cary Model 100 spectrometer (Varian); reported values for extinction coefficients (ε) are averages (n = 3). Fluorescence spectra were recorded on a Cary Eclipse fluorometer (Varian). Normalized spectra are shown for clarity.
Quantum Yield Determination
All reported quantum yield values were measured in our laboratory under identical conditions using a Quantaurus-QY spectrometer (C11374, Hamamatsu). This instrument uses an integrating sphere to determine photons absorbed and emitted by a sample. Measurements were carried out using dilute samples (A < 0.1) and self-absorption corrections41 were performed using the instrument software. Reported values are averages (n = 3).
Dioxane–H2O Titration
Dioxane–H2O titrations were performed in spectral grade dioxane (Sigma–Aldrich) and milliQ H2O. The solvent mixtures contained 0.01% v/v triethylamine to ensure the rhodamine dyes were in the zwitterionic form. The absorbance values at _λ_max were measured on 5 μM samples (n = 2) using a quartz 96-well microplate (Hellma) and a FlexStation3 microplate reader (Molecular Devices). Values of dielectric constant (εr) were as reported.42
Multiphoton-Photon Spectroscopy
The two-photon measurements were performed as previously described.43,44 Measurements were taken on an inverted microscope (IX81, Olympus) equipped with a 60×, 1.2NA water objective (Olympus). Dye samples were excited with pulses from an 80 MHz Ti-Sapphire laser (Chameleon Ultra II, Coherent). Fluorescence collected by the objective was passed through a shortpass filter (720SP, Semrock) and a bandpass filter (550BP200, Semrock), and detected by a fiber-coupled Avalanche Photodiode (APD). Two different APDs were used, one optimized for low noise for FCS and spectral measurements (SPCM_AQRH-14, Perkin Elmer) and the other for precise timing for lifetime measurements (PDF-CCTB, Micro Photon Devices). The focused laser spot size was measured to be 0.420 μm (radius where intensity drops to 1/e2). Two-photon excitation spectra were taken on samples of 1 μM dye in HEPES buffer, using 1 mW of laser power at the sample across the spectral range of 710 nm to 1080 nm. The peak molecular brightness, defined as the maximum detected count rate per emitting molecule, was obtained by determining the fluorescence count rate and the average number of emitting molecules in the beam using fluorescence correlation spectroscopy (FCS).43 For FCS measurements, a stock dye solution was diluted to 50 nM in 50 mM HEPES, pH 7.2 and excited at discrete laser powers ranging from 5–30 mW, with FCS data acquisition for each power setting taken for 100–200 s. The samples were excited at 830 nm and 1020 nm laser wavelength (the absorption peaks obtained from two photon excitation spectra). The fluorescence signal detected by the APD at each wavelength and power setting was fed to the autocorrelator (Flex03LQ; Correlator.com) and a computer program recorded the autocorrelation function and average fluorescence counts per second, defined as . The measured autocorrelation curve was fit to an FCS diffusion model with a MATLAB program using a customized code,43 to determine the average number of excited molecules in the volume of excitation. The molecular brightness (ε) was thus obtained as the rate of fluorescence per excited molecule defined as ε = /.43 Increasing the laser intensity initially increases the molecular brightness, however at a certain point molecular brightness leveled off or started decreasing, indicating photobleaching or saturation of the molecule in the excitation volume. The maximum or peak brightness achieved before photobleaching or saturation represents the useful proxy for the photostability of a fluorophore.
Fluorescence Lifetime Spectroscopy
For fluorescence lifetime measurements, a pulse picker (Model 350-160, ConOptics) was placed in the laser beam to reduce the pulse frequency from 80 MHz to 20 MHz. Samples (2 μM dye diluted in 50 mM HEPES, pH 7.2, H2O, or CH3OH) were excited at 830 nm laser wavelength and 6 mW laser power. The emitted light was collected by the fast-timing APD and fed to the single-photon counting board (TimeHarp200; PicoQuant). Timing pulses were obtained from a PIN diode (DET01CFC; ThorLabs) monitoring the 20 MHz pulse train. The temporal impulse response of the system was determined by second harmonic generation of laser pulses using a thin nonlinear crystal in place of a dye sample. The lifetime decay data was fit to a single exponential decay function using a custom MATLAB program. Lifetime value of the reference fluorescein dye measured using our system was 4.025 ± 0.015 ns (R2 = 0.99) compared to a literature value of 4.1 ± 0.1 ns.45
Measurement of Increase in Fluorescence of HaloTag Ligands 27 and 28 Upon Reaction with HaloTag Protein
Absorbance measurements were performed in 1 mL quartz cuvettes. HaloTag protein was used as a 100 μM solution in 75 mM NaCl, 50 mM TRIS·HCl, pH 7.4 with 50% v/v glycerol (TBS–glycerol). HaloTag ligands 27 and 28 (5 μM) were dissolved in 10 mM HEPES, pH 7.3 containing 0.1 mg·mL−1 CHAPS. An aliquot of HaloTag protein (1.5 equiv) or an equivalent volume of TBS–glycerol blank was added and the resulting mixture was incubated until consistent absorbance signal was observed (~30 min). Additional HaloTag protein did not elicit an increase in absorbance (not shown). Absorbance scans are averages (n = 2).
Cell Culture, Transfection, and Labeling
HeLa cells (ATCC) and U2OS cells (ATCC) were cultured in Dulbecco’s modified eagle medium (DMEM; Life Technologies) supplemented with 10% v/v fetal bovine serum (FBS; Life Technologies), 1 mM GlutaMax (Life Technologies), and 1 mM sodium pyruvate (Sigma) and maintained at 37 °C in a humidified 5% v/v CO2 environment. These cell lines undergo regular mycoplasma testing by the Janelia Cell Culture Facility. Cells were transfected with HaloTag–H2B, HaloTag–tubulin, SnapTag–TetR, or SnapTag–H2B using an Amaxa Nucleofector (Lonza). Before the imaging experiments, transfected cells were transferred onto a No.1 coverslip (Warner Instruments) that was cleaned by Piranha solution (3:1 v/v mixture of concentrated H2SO4 and 30% v/v hydrogen peroxide). To label live cells with the HaloTag or SnapTag ligands, compounds 9, 10, 27, 28, 29, 30, or 31 were added to the growth medium and the samples incubated for 15 min. Labeling concentrations were typically 100–500 nM for confocal, wide-field, and _d_STORM experiments and 5–50 nM for single-molecule tracking experiments. Cells were then washed briefly with PBS (1×) and then incubated in DMEM–FBS for an additional 15 min. Before imaging, the cells were washed briefly with PBS (3×) and placed in fresh DMEM–FBS for imaging. All washes were omitted in the “no wash” experiments. For nuclear staining, cells were incubated in PBS for 5 min (2×), and then incubated in PBS containing 5 μM DRAQ5 (Cell Signaling) for 5 min, followed by brief wash with PBS (1×). During all imaging experiments, cells were maintained at 37 °C in a humidified 5% CO2 v/v environment supplied by a live-cell incubator (TOKAI HIT).
Microscopy Hardware
Three separate systems were used to acquire microscopic images. Confocal microscopy was performed using a Zeiss LSM 510 META confocal microscope with a LD C-APOCHROMAT 40×/1.2 W Korr M27 UV-VIS-IR objective. Wide-field microscopy, 2D single-molecule tracking, and super-resolution imaging experiments were conducted on a Nikon Eclipse Ti wide field epifluorescence microscope equipped with a 100×, 1.4NA oil-immersion objective lens (Nikon), a Lumencor light source, a set of lasers (405 nm/100 mW, Coherent Cube; 561 nm/200 mW, Cobolt Jive; 633 nm/140 mW, Vortran Stradus), controlled by an Acousto-Optic Tunable Filter (AA Opto-Electronic), two filter wheels (Lambda 10-3; Sutter Instruments), a perfect focusing system (Nikon), and an EMCCD camera (iXon3, Andor). Emission filters (FF01 593/40 or FF01 676/37; Semrock) were placed in front of the cameras for JF549 and JF646 emission. A multi-band mirror (405/488/561/633 BrightLine quad-band bandpass filter, Semrock) was used to reflect the excitation laser beams into the objective. The microscope, cameras, and hardware were controlled through the NIS-Elements software (Nikon). Other live-cell single super-resolution imaging experiments were recorded on a custom-built three-camera RAMM frame (ASI) microscope using an 1.4NA PLAPON 60× OSC objective (Olympus), and a 300 mm focal length tube lens (LAO-300.0, Melles Griot), resulting in 100× overall magnification. Stroboscopic 405 nm excitation of the Stradus 405-100 laser (Vortran) was achieved using a NI-DAQ-USB-6363 acquisition board (National Instruments), which also controlled the 637 nm laser emission from a Stradus 637-140 laser (Vortran). A 2mm-thick quad-band dichroic (ZT 405/488/561/640rpx, Chroma), and a band-pass emission filter (FF01-731/137-25, Semrock) filtered the emitted light. Fluorescence was detected with a back-illuminated EMCCD camera (Andor Technology, Ixon Ultra DU-897U-CS0-EXF, 17 MHz EM amplifier), which was controlled through Micro-Manager (1.4.17).
_d_STORM Imaging
Super-resolution imaging experiments were performed on live samples (Fig. 2j, Supplementary Fig. 2c, Supplementary Fig. 4d, Supplementary Fig. 4g) and fixed cells (Fig. 1i, Fig. 2b, Supplementary Fig. 2a, Supplementary Fig. 4a). For live-cell _d_STORM imaging the cells were labeled, washed, and imaged directly in DMEM–FBS. For fixed cell preparations, cells were labeled, washed, and fixed in 4% paraformaldehyde (Electron Microscopy Sciences) in PBS buffer (pH = 7.5). The cells were imaged in a sealed cell chamber (Life Technologies) containing nitrogen-degassed redox buffer consisting of PBS supplemented with 50 mM mercaptoethylamine (Sigma–Aldrich), 10% w/v glucose, 0.5 mg/mL glucose oxidase (Sigma–Aldrich), and 28400 U/mL catalase (Sigma–Aldrich). Before imaging, JF549 could be efficiently “shelved” in a dark state upon illumination with 2 kW·cm−2 of excitation light (561 nm), and then activated back to a fluorescent state by blue light (405 nm) with low intensity (~20·W cm−2). JF646 fluorophores were converted into a predominately dark state using continuous illumination of 637 nm excitation light at 14 kW·cm−2, after which individual rapidly blinking molecules of JF646 fluorophores were observed. These experiments were conducted on the two wide-field microscope systems described above: the Nikon Eclipse Ti epifluorescence microscope (Fig. 1i, Fig. 2j, Supplementary Fig. 2a, Supplementary Fig. 2c, Supplementary Fig. 4g), and the custom-built three-camera microscope with an ASI RAMM frame (Fig. 2b, Supplementary Fig. 4a, Supplementary Fig. 4d).
_d_STORM Analysis
The spot localization (x, y) was obtained based on the multiple-target tracing (MTT) algorithm46,47 using a custom MATLAB program. For each frame, the PSF of individual fluorophores was fitted into a two-dimensional Gaussian distribution. Integrated fluorescence intensities were calculated and converted to photon counts using analysis routines written in IGOR Pro version 6.34A. Localization errors were calculated using Equation 6 in Mortensen et al.48 Super-resolution images were rendered using the software package Localizer by Dedecker et al.49 running from Igor Pro v. 3.34A, which superimposes the position coordinates of detected spots as Gaussian masks using the fitted intensity values as amplitudes and the localization errors as the widths. The _d_STORM data for experiments comparing two different fluorophore ligands was recorded on the same day under identical illumination conditions.
Two-Color Single-Molecule Experiments
The two-color single-molecule experiments were recorded on the Nikon Eclipse Ti wide field epifluorescence microscope. We first performed a 2D single molecule tracking of SnapTag–TetR–JF549 using a 561-nm laser of excitation intensity ~1 kW cm−2 at a frame rate of 100 Hz. Immediately after the completion of the single-particle tracking experiment, we then imaged HaloTag–H2B–JF646 under the _d_STORM mode as described above. Transmission images were taken before and after the tracking–_d_STORM experiments and a cross-correlation algorithm was employed to calculate the image drift.50 Tracking analysis of TetR was performed using the commercial tracking software DiaTrack (v. 3.03, Semasopht), which identifies and fits the intensity spots of fluorescent particles with 2D Gaussian functions matched to the experimentally determined point-spread function. The diffusion map was created using tracking routines written in IGOR Pro 6.34A, calculating the local apparent diffusion of TetR mobility evaluated on a 20 nm × 20 nm x–y grid from the mean square displacements over a timescale of 10 milliseconds (Fig. 2j). Whenever two or more separate displacements originating within 80 nm of a given grid node were found, a local apparent diffusion coefficient was calculated and plotted. We then selected H2B clusters as the 500 brightest spots in the super-resolved image. From this analysis, we generated a histogram of apparent diffusion coefficients for all trajectories that dwelled within 320 nm of a H2B cluster for at least 10 milliseconds. We then plotted histograms of the diffusion coefficient of both the H2B-colocalized and the non-colocalized TetR trajectories (Supplementary Fig. 4h).
Supplementary Material
1
2
Acknowledgments
We thank S. Eddy and E. Betzig for contributive discussions, M. Dahan (Curie Institut) and X. Darzacq (Berkeley) for the SnapTag–TetR plasmid, M. Tadross (Janelia) for the purified HaloTag protein, and W. Hu (Janelia) for cloning and purifying the recombinant HaloTag–MS2 protein. This work was supported by the Howard Hughes Medical Institute. Salary for R.H.S. is funded by US National Institutes of Health grants GM57071, NS83085, and EB13571.
Footnotes
Author Contributions
J.B.G conceived the project and performed organic synthesis. B.P.E. and J.C. designed and performed cellular microscopy experiments. J.P.S performed organic synthesis. Z.Z. prepared bioconjugates, performed in vitro single-molecule microscopy, and analyzed data. A.R. performed in vitro single-molecule microscopy and analyzed data. R.P. and J.J.M. performed two-photon spectroscopy and fluorescence lifetime measurements. D.N. designed and validated the SnapTag–TetR plasmid. R.H.S. interpreted data. T.L. designed experiments and performed data analysis. L.D.L. conceived the project, performed one-photon spectroscopic measurements, and wrote the manuscript with input from the other authors.
Competing Interests
The authors declare competing interests: patent applications have been filed whose value may be affected by this publication.
References
- 1.Kremers GJ, Gilbert SG, Cranfill PJ, Davidson MW, Piston DW. Fluorescent proteins at a glance. J Cell Sci. 2011;124:157–160. doi: 10.1242/jcs.072744. [DOI] [PMC free article] [PubMed] [Google Scholar]
- 2.Xia T, Li N, Fang X. Single-molecule fluorescence imaging in living cells. Ann Review Phys Chem. 2013;64:459–480. doi: 10.1146/annurev-physchem-040412-110127. [DOI] [PubMed] [Google Scholar]
- 3.Griffin BA, Adams SR, Tsien RY. Specific covalent labeling of recombinant protein molecules inside live cells. Science. 1998;281:269–272. doi: 10.1126/science.281.5374.269. [DOI] [PubMed] [Google Scholar]
- 4.Keppler A, et al. A general method for the covalent labeling of fusion proteins with small molecules in vivo. Nat Biotechnol. 2002;21:86–89. doi: 10.1038/nbt765. [DOI] [PubMed] [Google Scholar]
- 5.Los GV, et al. HaloTag: A novel protein labeling technology for cell imaging and protein analysis. ACS Chem Biol. 2008;3:373–382. doi: 10.1021/cb800025k. [DOI] [PubMed] [Google Scholar]
- 6.Encell LP, et al. Development of a dehalogenase-based protein fusion tag capable of rapid, selective and covalent attachment to customizable ligands. Curr Chem Genomics. 2012;6(Suppl 1-M7):55–71. doi: 10.2174/1875397301206010055. [DOI] [PMC free article] [PubMed] [Google Scholar]
- 7.Wombacher R, et al. Live-cell super-resolution imaging with trimethoprim conjugates. Nat Methods. 2010;7:717–719. doi: 10.1038/nmeth.1489. [DOI] [PubMed] [Google Scholar]
- 8.Hori Y, Ueno H, Mizukami S, Kikuchi K. Photoactive yellow protein-based protein labeling system with turn-on fluorescence intensity. J Am Chem Soc. 2009;131:16610–16611. doi: 10.1021/ja904800k. [DOI] [PubMed] [Google Scholar]
- 9.Uttamapinant C, et al. A fluorophore ligase for site-specific protein labeling inside living cells. Proc Natl Acad Sci USA. 2010;107:10914–10919. doi: 10.1073/pnas.0914067107. [DOI] [PMC free article] [PubMed] [Google Scholar]
- 10.Testa I, et al. Multicolor fluorescence nanoscopy in fixed and living cells by exciting conventional fluorophores with a single wavelength. Biophys J. 2010;99:2686–2694. doi: 10.1016/j.bpj.2010.08.012. [DOI] [PMC free article] [PubMed] [Google Scholar]
- 11.Zhao ZW, et al. Spatial organization of RNA polymerase II inside a mammalian cell nucleus revealed by reflected light-sheet superresolution microscopy. Proc Natl Acad Sci USA. 2014;111:681–686. doi: 10.1073/pnas.1318496111. [DOI] [PMC free article] [PubMed] [Google Scholar]
- 12.Abrahamsson S, et al. Fast multicolor 3D imaging using aberration-corrected multifocus microscopy. Nat Methods. 2013;10:60–63. doi: 10.1038/nmeth.2277. [DOI] [PMC free article] [PubMed] [Google Scholar]
- 13.Chen J, et al. Single-molecule dynamics of enhanceosome assembly in embryonic stem cells. Cell. 2014;156:1274–1285. doi: 10.1016/j.cell.2014.01.062. [DOI] [PMC free article] [PubMed] [Google Scholar]
- 14.Lavis LD, Raines RT. Bright ideas for chemical biology. ACS Chem Biol. 2008;3:142–155. doi: 10.1021/cb700248m. [DOI] [PMC free article] [PubMed] [Google Scholar]
- 15.Beija M, Afonso CAM, Martinho JMG. Synthesis and applications of rhodamine derivatives as fluorescent probes. Chem Soc Rev. 2009;38:2410–2433. doi: 10.1039/b901612k. [DOI] [PubMed] [Google Scholar]
- 16.Lavis LD, Raines RT. Bright building blocks for chemical biology. ACS Chem Biol. 2014;9:855–866. doi: 10.1021/cb500078u. [DOI] [PMC free article] [PubMed] [Google Scholar]
- 17.Gautier A, et al. An engineered protein tag for multiprotein labeling in living cells. Chem Biol. 2008;15:128–136. doi: 10.1016/j.chembiol.2008.01.007. [DOI] [PubMed] [Google Scholar]
- 18.Lukinavičius G, et al. A near-infrared fluorophore for live-cell super-resolution microscopy of cellular proteins. Nature Chem. 2013;5:132–139. doi: 10.1038/nchem.1546. [DOI] [PubMed] [Google Scholar]
- 19.Mujumdar RB, Ernst LA, Mujumdar SR, Lewis CJ, Waggoner AS. Cyanine dye labeling reagents: Sulfoindocyanine succinimidyl esters. Bioconjugate Chem. 1993;4:105–111. doi: 10.1021/bc00020a001. [DOI] [PubMed] [Google Scholar]
- 20.Panchuk-Voloshina N, et al. Alexa Dyes, a series of new fluorescent dyes that yield exceptionally bright, photostable conjugates. J Histochem Cytochem. 1999;47:1179–1188. doi: 10.1177/002215549904700910. [DOI] [PubMed] [Google Scholar]
- 21.Haugland RP, Spence MTZ, Johnson ID, Basey A. The Handbook: A Guide to Fluorescent Probes and Labeling Technologies. 10. Molecular Probes; 2005. [Google Scholar]
- 22.Zhang Z, Revyakin A, Grimm JB, Lavis LD, Tjian R. Single-molecule tracking of the transcription cycle by sub-second RNA detection. eLife. 2014;3:e01775. doi: 10.7554/eLife.01775. [DOI] [PMC free article] [PubMed] [Google Scholar]
- 23.Bosch PJ, et al. Evaluation of fluorophores to label SNAP-tag fused proteins for multicolor single-molecule tracking microscopy in live cells. Biophys J. 2014;107:803–814. doi: 10.1016/j.bpj.2014.06.040. [DOI] [PMC free article] [PubMed] [Google Scholar]
- 24.Grimm JB, et al. Carbofluoresceins and carborhodamines as scaffolds for high-contrast fluorogenic probes. ACS Chem Biol. 2013;8:1303–1310. doi: 10.1021/cb4000822. [DOI] [PMC free article] [PubMed] [Google Scholar]
- 25.Vogel M, Rettig W, Sens R, Drexhage KH. Structural relaxation of rhodamine dyes with different N-substitution patterns—a study of fluorescence decay times and quantum yields. Chem Phys Lett. 1988;147:452–460. [Google Scholar]
- 26.Grabowski ZR, Rotkiewicz K, Rettig W. Structural changes accompanying intramolecular electron transfer: Focus on twisted intramolecular charge-transfer states and structures. Chem Rev. 2003;103:3899–4032. doi: 10.1021/cr940745l. [DOI] [PubMed] [Google Scholar]
- 27.Song X, Johnson A, Foley J. 7-Azabicyclo[2.2.1]heptane as a unique and effective dialkylamino auxochrome moiety: Demonstration in a fluorescent rhodamine dye. J Am Chem Soc. 2008;130:17652–17653. doi: 10.1021/ja8075617. [DOI] [PubMed] [Google Scholar]
- 28.Grimm JB, Lavis LD. Synthesis of rhodamines from fluoresceins using Pd-catalyzed C–N cross-coupling. Org Lett. 2011;13:6354–6357. doi: 10.1021/ol202618t. [DOI] [PMC free article] [PubMed] [Google Scholar]
- 29.Heilemann M, et al. Subdiffraction-resolution fluorescence imaging with conventional fluorescent probes. Angew Chem Int Ed. 2008;47:6172–6176. doi: 10.1002/anie.200802376. [DOI] [PubMed] [Google Scholar]
- 30.Dempsey GT, Vaughan JC, Chen KH, Bates M, Zhuang X. Evaluation of fluorophores for optimal performance in localization-based super-resolution imaging. Nat Methods. 2011;8:1027–1036. doi: 10.1038/nmeth.1768. [DOI] [PMC free article] [PubMed] [Google Scholar]
- 31.Ha T, Tinnefeld P. Photophysics of fluorescence probes for single molecule biophysics and super-resolution imaging. Annu Rev Phys Chem. 2012;63:595–617. doi: 10.1146/annurev-physchem-032210-103340. [DOI] [PMC free article] [PubMed] [Google Scholar]
- 32.Lukinavičius G, et al. Fluorogenic probes for live-cell imaging of the cytoskeleton. Nat Methods. 2014;11:731–733. doi: 10.1038/nmeth.2972. [DOI] [PubMed] [Google Scholar]
- 33.Loving G, Imperiali B. A versatile amino acid analogue of the solvatochromic fluorophore 4-N,N-dimethylamino-1,8-naphthalimide: A powerful tool for the study of dynamic protein interactions. J Am Chem Soc. 2008;130:13630–13638. doi: 10.1021/ja804754y. [DOI] [PMC free article] [PubMed] [Google Scholar]
- 34.Kubota Y, Steiner RF. Fluorescence decay and quantum yield characteristics of acridine orange and proflavine bound to DNA. Biophys Chem. 1977;6:279–289. doi: 10.1016/0301-4622(77)85009-6. [DOI] [PubMed] [Google Scholar]
- 35.Lee LG, Berry GM, Chen CH. Vita Blue: A new 633-nm excitable fluorescent dye for cell analysis. Cytometry. 1989;10:151–164. doi: 10.1002/cyto.990100206. [DOI] [PubMed] [Google Scholar]
- 36.Bancaud A, et al. Molecular crowding affects diffusion and binding of nuclear proteins in heterochromatin and reveals the fractal organization of chromatin. EMBO J. 2009;28:3785–3798. doi: 10.1038/emboj.2009.340. [DOI] [PMC free article] [PubMed] [Google Scholar]
- 37.Bancaud A, Lavelle C, Huet S, Ellenberg J. A fractal model for nuclear organization: Current evidence and biological implications. Nucleic Acids Res. 2012;40:8783–8792. doi: 10.1093/nar/gks586. [DOI] [PMC free article] [PubMed] [Google Scholar]
- 38.Speight LC, et al. Efficient synthesis and in vivo incorporation of acridon-2-ylalanine, a fluorescent amino acid for lifetime and Förster resonance energy transfer/luminescence resonance energy transfer studies. J Am Chem Soc. 2013;135:18806–18814. doi: 10.1021/ja403247j. [DOI] [PMC free article] [PubMed] [Google Scholar]
- 39.Mitronova GY, et al. New fluorinated rhodamines for optical microscopy and nanoscopy. Chem Eur J. 2010;16:4477–4488. doi: 10.1002/chem.200903272. [DOI] [PubMed] [Google Scholar]
- 40.Altman RB, et al. Cyanine fluorophore derivatives with enhanced photostability. Nat Methods. 2012;9:68–71. doi: 10.1038/nmeth.1774. [DOI] [PMC free article] [PubMed] [Google Scholar]
- 41.Suzuki K, et al. Reevaluation of absolute luminescence quantum yields of standard solutions using a spectrometer with an integrating sphere and a back-thinned CCD detector. Phys Chem Chem Phys. 2009;11:9850–9860. doi: 10.1039/b912178a. [DOI] [PubMed] [Google Scholar]
- 42.Critchfield FE, Gibson JA, Jr, Hall JL. Dielectric constant for the dioxane–water system from 20 to 35°. J Am Chem Soc. 1953;75:1991–1992. [Google Scholar]
- 43.Mütze J, et al. Excitation spectra and brightness optimization of two-photon excited probes. Biophys J. 2012;102:934–944. doi: 10.1016/j.bpj.2011.12.056. [DOI] [PMC free article] [PubMed] [Google Scholar]
- 44.Akerboom J, et al. Optimization of a GCaMP calcium indicator for neural activity imaging. J Neurosci. 2012;32:13819–13840. doi: 10.1523/JNEUROSCI.2601-12.2012. [DOI] [PMC free article] [PubMed] [Google Scholar]
- 45.Magde D, Rojas GE, Seybold PG. Solvent dependence of the fluorescence lifetimes of xanthene dyes. Photochem Photobiol. 1999;70:737–744. [Google Scholar]
- 46.Serge A, Bertaux N, Rigneault H, Marguet D. Multiple-target tracing (MTT) algorithm probes molecular dynamics at cell surface. Nature Protocol Exchange. 2008 doi: 10.1038/nprot.2008.1128. [DOI] [Google Scholar]
- 47.Serge A, Bertaux N, Rigneault H, Marguet D. Dynamic multiple-target tracing to probe spatiotemporal cartography of cell membranes. Nat Methods. 2008;5:687–694. doi: 10.1038/nmeth.1233. [DOI] [PubMed] [Google Scholar]
- 48.Mortensen KI, Churchman LS, Spudich JA, Flyvbjerg H. Optimized localization analysis for single-molecule tracking and super-resolution microscopy. Nat Methods. 2010;7:377–381. doi: 10.1038/nmeth.1447. [DOI] [PMC free article] [PubMed] [Google Scholar]
- 49.Dedecker P, Duwé S, Neely RK, Zhang J. Localizer: Fast, accurate, open-source, and modular software package for superresolution microscopy. J Biomed Opt. 2012;17:126008–126008. doi: 10.1117/1.JBO.17.12.126008. [DOI] [PMC free article] [PubMed] [Google Scholar]
- 50.Guizar-Sicairos M, Thurman ST, Fienup JR. Efficient subpixel image registration algorithms. Opt Lett. 2008;33:156–158. doi: 10.1364/ol.33.000156. [DOI] [PubMed] [Google Scholar]
Associated Data
This section collects any data citations, data availability statements, or supplementary materials included in this article.
Supplementary Materials
1
2