High-throughput gene targeting and phenotyping in zebrafish using CRISPR/Cas9 (original) (raw)
Abstract
The use of CRISPR/Cas9 as a genome-editing tool in various model organisms has radically changed targeted mutagenesis. Here, we present a high-throughput targeted mutagenesis pipeline using CRISPR/Cas9 technology in zebrafish that will make possible both saturation mutagenesis of the genome and large-scale phenotyping efforts. We describe a cloning-free single-guide RNA (sgRNA) synthesis, coupled with streamlined mutant identification methods utilizing fluorescent PCR and multiplexed, high-throughput sequencing. We report germline transmission data from 162 loci targeting 83 genes in the zebrafish genome, in which we obtained a 99% success rate for generating mutations and an average germline transmission rate of 28%. We verified 678 unique alleles from 58 genes by high-throughput sequencing. We demonstrate that our method can be used for efficient multiplexed gene targeting. We also demonstrate that phenotyping can be done in the _F_1 generation by inbreeding two injected founder fish, significantly reducing animal husbandry and time. This study compares germline transmission data from CRISPR/Cas9 with those of TALENs and ZFNs and shows that efficiency of CRISPR/Cas9 is sixfold more efficient than other techniques. We show that the majority of published “rules” for efficient sgRNA design do not effectively predict germline transmission rates in zebrafish, with the exception of a GG or GA dinucleotide genomic match at the 5′ end of the sgRNA. Finally, we show that predicted off-target mutagenesis is of low concern for in vivo genetic studies.
Since the publication of the human genome sequence (International Human Genome Sequencing Consortium 2004), genome-wide association studies (GWAS) (Welter et al. 2014) and exome-sequencing projects have been identifying candidate human disease genes at a rapid rate (Rabbani et al. 2014). Clinical and genomic data alone are normally insufficient proof that a candidate gene is responsible for the observed phenotype, and human geneticists are now facing the immense challenge of finding methods to validate those candidate disease genes. One of the most common lines of support for candidate genes is by showing analogous phenotypes in animal models by inactivating the homologous gene, commonly known as a gene “knockout.” For decades, the mouse has been the most popular model organism in validating the function of genes, but large-scale validation of candidate genes in mice is limited by many factors, such as the small number of progeny, the lethality of many knockouts in utero, and relatively expensive husbandry.
For a number of reasons, the zebrafish (Danio rerio) has become an increasingly important model organism for both basic and translational research. The utility of the zebrafish has further increased with a finished sequenced genome (Howe et al. 2013), joining human and mouse as only the third, high-quality genome for vertebrates. In zebrafish, major gene function studies were traditionally carried out using forward genetic screens or using antisense morpholino technology. Targeting specific lesions in the genome was impossible. Morpholinos were an accepted alternative to genomic lesions, but increasingly, there are reports of strong phenotypes that are a result of clearly off-target inhibition (Kok et al. 2014; Law and Sargent 2014). One report by Kok et al. (2014) showed that 80% of gene knockouts did not recapitulate the morpholino phenotype reported for the same gene. This is a significant setback to researchers interested in rapidly testing candidate gene validity in a vertebrate model system.
Recently, many large-scale reverse genetics projects have generated thousands of mutants in zebrafish, which will have a major impact for systematically modeling human disease genes. Typically, these large-scale projects used random mutagenesis either by chemical-based (ENU) or retroviral-mediated methods (Clark et al. 2011; Kettleborough et al. 2013; Varshney et al. 2013a,b). While these methods are effective for inactivating genes in a high-throughput manner, they have certain disadvantages, one of the major ones being that it is nearly impossible to cost-effectively inactivate every gene in the genome with a random mutagenesis scheme. At a certain depth of mutagenesis for any random technique, the cost of identifying new random mutations drops below useful levels, inherently limiting the number of genes mutated using these approaches. In the last few years, targeted mutagenesis methods based on engineered endonucleases such as zinc finger nucleases (ZFNs) or transcription activator-like effector nucleases (TALENs) have been shown to work well in zebrafish (Doyon et al. 2008; Bedell et al. 2012). These engineered synthetic nucleases induce double-stranded breaks in the specific gene of interest, which are often imprecisely repaired by error-prone, non-homologous end joining (NHEJ). More recently, the bacterial type II clustered regularly interspaced short palindromic repeats (CRISPR)/CRISPR-associated (Cas) system has emerged as a new, targeted mutagenesis method in many species, including zebrafish (Gasiunas et al. 2012; Jinek et al. 2012; Cong et al. 2013; Hwang et al. 2013a,b; Jao et al. 2013; Mali et al. 2013; Gagnon et al. 2014; Hsu et al. 2014).
Neither ZFNs nor TALENs are readily amenable to high-throughput mutagenesis projects due to the effort involved in assembling DNA binding domains that work efficiently. CRISPR/Cas9 is much more suited to high-throughput mutagenesis projects because of the simple design requirements, ease of use, and the ability to simultaneously target multiple genes. While the application of CRISPR/Cas9 in zebrafish genome editing has been shown (Chang et al. 2013; Hwang et al. 2013a,b; Jao et al. 2013; Gagnon et al. 2014); high-throughput methods for generating stable mutants had not been developed. Such techniques would be invaluable for rapid testing of multiple candidate genes from GWAS or exome studies in humans without the confounding artifacts often seen with morpholino studies (Law and Sargent 2014). In this study, we demonstrate the efficiency of CRISPR/Cas9 in generating stable, germline-transmitted mutants across 162 independent targets in zebrafish. We further tested its efficiency in multiplexed genome editing, increasing its potential for high-throughput mutagenesis projects. In addition, we demonstrated that phenotypes could be rapidly screened in the _F_1 generation by inbreeding founders, reducing the time needed for phenotyping screening by a generation (≈3–4 mo).
Results
Genome-wide identification of CRISPR targets
To assist in the design of CRISPR targets in zebrafish, we produced a browser extensible data (BED) track computationally predicting 18,367,469 CRISPR 20-mers in the zebrafish reference genome (http://genome.ucsc.edu/cgi-bin/hgHubConnect, “CRISPRs” track on the ZebrafishGenomics track hub). The track allows for rapid selection of guide sequences with embedded information on predicted off-target sites in the genome. The number appearing in the name field of the BED track indicates the number of off-targets for the 12-mer seed region. This track is designed to be a useful first-pass resource for identifying potential CRISPR targets and is complementary to other tools such as http://crispr.mit.edu/ (Supplemental Fig. 1). We also designed two smaller BED files representing the subset of CRISPR targets that can be synthesized in vitro with either T7 “GG CRISPRs” or SP6 “GA CRISPRs.” We based our guide RNA designs on published recommendations for CRISPR design (Hsu et al. 2013). Each 20-mer on the track is upstream of an NGG PAM site and differs by at least three mismatches from any other 20-mer upstream of an NGG or NAG PAM site. In this study, the majority of synthesized targets were from the pool of 13,177,179 targets that are in a region of invariant sequence in the NHGRI-1 line (LaFave et al. 2014), which is closely related to the wild-type TAB-5 line used in this study. This allowed us to avoid the problem of sequence variants that might inhibit gene targeting and thereby compromise data on the efficacy of target design.
Generation of heritable mutations using CRISPR/Cas9
Our goal was to develop an efficient, high-throughput mutagenesis and phenotyping pipeline in zebrafish. The critical step of the CRISPR/Cas9 system is to generate the single-guide RNA (sgRNA), which contains a 20-nucleotide (nt) sequence that targets the genomic loci, and 80 nt of chimeric guide RNA (crRNA:tracrRNA) (Cong et al. 2013; Mali et al. 2013). Most methods rely on subcloning 20-nt target sequences between a promoter (T7) and the crRNA:tracrRNA sequences and obtaining the sgRNAs from in vitro transcription off of the plasmid. We developed a simple and high-throughput method of generating sgRNA using two, partially overlapping oligonucleotides; one target-specific oligonucleotide and the other a generic oligonucleotide that can be used for all constructs, similar to a recently published method by Gagnon et al. (2014). These two oligonucleotides formed a double-stranded template by annealing at the 20-nt overlap and were extended via Taq DNA polymerase; sgRNAs were then synthesized by in vitro transcription directly off the linear, double-stranded DNA (Fig. 1A). As these steps can be done in 96-well format, hundreds of sgRNAs can be synthesized in a few hours, increasing the throughput significantly over cloning-based methods. To test the efficacy of sgRNAs generated by this method, we targeted three genomic loci with known phenotypes such as tyrosinase (Jao et al. 2013), fgf24 (Fischer et al. 2003), and chordin (Haffter et al. 1996) and scored expected phenotypes in the injected embryos (Supplemental Fig. 2). As shown in previous publications, targeting tyrosinase resulted in reduced pigmentation, fgf24 resulted in an absence of pectoral fins, and chordin resulted in ventralized tissues in the tail. Together, these results indicate our oligo-based sgRNA synthesis method is robust.
Figure 1.

Overview of mutagenesis and phenotyping strategies. (A) Single-guide RNA (sgRNA) was synthesized from a template that is generated by annealing and extending oligo A and B. Oligo B is generic and is common in all reactions, while Oligo A contains a T7 promoter, 20-nt target sequence, and another 20 nt overlapping the chimeric gRNA core sequence. Two sgRNAs targeting a single gene were co-injected along with _Cas9_mRNA into either the yolk or the cell of one-cell stage embryos. The injected embryos were raised to generate the founder fish. (B) The founder fish were then outcrossed to wild type to generate heterozygous _F_1 fish. The mutant fish were identified by fluorescence PCR and sequencing. The siblings carrying mutations were then crossed to generate _F_2 progeny, and phenotype-genotype correlations were done using the _F_2 embryos. (C) Alternatively, the founder fish were inbred and phenotyping was performed in the _F_1 generation, and the embryos were genotyped by fluorescence PCR or sequencing. (D) Phenotypes can also be observed in the injected embryos from 0 to 5 d, although off-target effects are more common with this approach. In order to score phenotypes in injected embryos, the sgRNA and Cas9 must be injected in the cell instead of the yolk to achieve maximum efficiency.
We designed sgRNAs to target 162 sites in 83 genes. For each gene, we designed independent sgRNAs targeting two different exons, with the exception of smaller genes with only 1–2 exons; in those cases we targeted two different positions in the same exon. Our overall mutant generation strategy is outlined in Figure 1. To determine the efficiency of CRISPR/Cas9 in inducing germline mutations, we identified mutations in _F_1 progeny by crossing founder fish (_F_0) to wild-type TAB-5 fish and analyzing seven embryos from each founder outcross for insertions or deletions (indels) in the genomic target by fluorescence PCR or sequencing (Figs. 1B, 2). In both approaches, the target region was amplified using three primers: a pair of gene-specific primers, one of which contained M13-forward sequences, and a third M13-forward adapter primer, which was either fluorescently labeled (for ABI size analysis) or contained a unique 6-bp barcode (for Illumina MiSeq analysis) (Fig. 2). Using fluorescence PCR, we obtained data from all 162 targeted genomic sites, and by barcoded PCR, we obtained sequence data from 114 of the same sites.
Figure 2.

Overview of the mutant identification strategies. Mutant alleles were identified by fluorescence PCR and high-throughput sequencing. Gene-specific primers were designed to amplify the regions around the target site (200–300 bp). The forward primer contains an M13-forward sequence on the 5′ end, and the reverse primer contains a pig-tail sequence to reduce size heterogeneity PCR artifacts. Depending on the application, one of two additional primers was added. (Option A) For fluorescent PCR, an M13-forward oligo with the fluorophore FAM attached was added. The resulting primers were run on an ABI 3100 or 3730 along with a size standard to obtain the amplicon sizes accurate to base-pair resolution. The size of the peak relative to the wild-type peak control determines the nature and length of the mutant. (Option B) When amplicons were sequenced, a third primer containing M13-forward sequence with a 6-bp barcode attached to the 5′ end was used. A unique barcode was assigned to each embryo from the same target. The amplicons were sequenced on an Illumina MiSeq platform with 300-bp paired-end reads. The sequences were processed using ampliconDIVider for the identification of insertions and deletions induced by CRISPR/Cas9 (http://research.nhgri.nih.gov/CRISPRz).
To generate a high-throughput and robust mutagenesis pipeline, we determined the minimum number of founders necessary to routinely identify germline mutations from the fluorescence PCR screening data. For nearly every gene, six founder fish were sufficient to identify at least one germline-transmitted mutation. A total of 1080 founders were tested for their ability to generate germline mutations (Fig. 3A), and 567 founders (53%) were positive for carrying mutations in the germline. We showed 138/162 targets had mutagenic activity, i.e., ∼15% of guides failed the initial screening. We typically tested 6–7 founders for each gene, but we found that screening more founders did occasionally identify mutations from lower activity sgRNAs. The overall success rate can therefore be increased by screening more founders per gene, but the cost of increased success is a reduction in total throughput.
Figure 3.

Summary and comparison of CRISPR/Cas9 to ZFN- or TALEN-induced mutations. (A) Summary of mutant identification data compiled from CRISPR/Cas9, TALENs, and ZFNs. The mutants were identified using fluorescent PCR and the aggregate data from each technique is shown. (B) Comparison of the types of mutations detected by sequencing. The mutations were classified in three different groups: deletions, insertions, and complex (at least one deletion and at least one insertion detected within ±30 bp of the 3′ end of the sgRNA or ZFN/TALEN target).
We identified germline mutations in 82 of 83 genes (99%), which demonstrates that by designing at least two targets per gene, there is a very high probability of identifying germline-transmitted mutations from at least one sg|RNA. From 1080 founders, we screened a total of 7525 embryos, and out of these, 2097 embryos (28%) carried mutations (Fig. 3A). The average germline transmission rate for injected fish was 53%, i.e., screening four founders should be sufficient for most sgRNAs injected. The germline transmission rate varied widely from target to target (Supplemental Table 1), and it was as high as 100% for the top quartile of targets.
Fluorescence PCR analysis of the mutant alleles indicates CRISPR/Cas9 generated both deletions and insertions. From 162 targets, we identified 1545 deletions (74%) and 552 insertions (26%) (Fig. 4A). Since we targeted exons, we further identified the insertions or deletions that either changed the reading frame (frameshift) or did not change the reading frame (in-frame). We identified 1056 frameshift deletions (68%), and 489 in-frame deletions (32%), along with 428 frameshift insertions (77%) and 124 in-frame insertions (23%) (Fig. 4A). Most of the mutations (>75%) generated by CRISPR/Cas9 are <12 bp +/− (Fig. 4B). However, we detected mutations up to 182 bp for deletions and 52 bp for insertions. Using the Illumina MiSeq platform, we sequenced amplicons from 114 targets representing 58 genes (Supplemental Files 1, 4–6). We detected at least one allele from 93 of the targets (82%) and identified a total of 678 unique alleles, resulting in an average of seven alleles per gene, with a maximum number of 34 unique alleles (Supplemental Table 2). There were 28 genes with more than 10 alleles. This high efficiency of identified alleles per gene demonstrates the utility of CRISPR/Cas9 for high-throughput mutagenesis projects.
Figure 4.

Distribution of CRISPR/Cas9-induced mutations in the germline. CRISPR/Cas9 induced more deletions than insertions. Approximately two-thirds of the deletions and insertions were frameshift mutations and most likely caused gene truncations. (B) Mutations were classified according to their insertion or deletion size as determined by fluorescent PCR data. Left bars (dark gray) indicate the deletion range and right bars (light gray) indicate insertion sizes. The bars on each extreme of the _x_-axis indicate the total number of mutations (deletions or insertions) that are >20 bp in size. Insertions and deletions >20 bp ranged to the largest detected size of a 182-bp deletion and 52-bp insertion.
Other studies have used large-scale CRISPR targeting of loci in cell culture (Doench et al. 2014) or somatic tissue (Gagnon et al. 2014) to determine general rules for sgRNA design that might maximize efficiency. In terms of predicting mutagenesis rates, none of the sequence-based observations made in Doench et al. (2014) or Gagnon et al. (2014) were significantly predictive in our experiments (Supplemental Figs. 3–6). The only feature that had any predictive value was if we had mismatched bases at the 5′ end of the targeting sequence (Supplemental Fig. 7). T7 requires a GG at the RNA transcriptional start for efficient transcription. Most of the 20-nt genomic targets we selected contained the GG sequence at the 5′ end of the 20-nt genomic target, but because of the T7 promoter requirement, in a few cases we designed 20-nt target sequences that did not have a GG in the genomic sequence at the 5′ end. In these instances, we added one or two additional G bases beyond the 20-nt targeting sequence that did have a genomic sequence match. This had a significant negative impact on the mutagenic activity of the sgRNA, with the median mutagenic frequency being 20% compared to 67% for the guides with a GG match at the 5′ end (Wilcoxon rank sum test with continuity correction, P = 6.432 × 10⁻⁶).
Direct comparison of CRISPR/Cas9 to ZFNs and TALENs
Previously, we targeted 26 genes with ZFNs or TALENs and successfully generated multiple knockout alleles for 21 genes (Sood et al. 2013). In addition to the substantial reduction in cost and increased ease of design and assembly for CRISPR targets compared to ZFNs and TALENs, our data showed that the CRISPRs were significantly more efficient in generating genetic mutations (Fig. 3A). To identify germline-transmitting founders with ZFNs or TALENs, it was typically necessary to screen 60 embryos/founder. Because _F_1 fish from positive founders averaged 40% mutant carriers, seven embryos/founder were almost always sufficient to identify mutations from CRISPR/Cas9 injected founders. We screened more than 20,000 embryos to identify mutations in 21 genes generated by either ZFNs or TALENs, while only ≈7500 embryos were screened to identify mutations in 83 genes using CRISPR. Furthermore, ∼28% of _F_1 progeny from germline-transmitting founders targeted with CRISPR/Cas9 carry the mutant alleles, compared to 5% and 4% for ZFNs and TALENs (Fig. 3A), thus reducing the number of _F_1 embryos that need to be raised for efficient recovery of mutant alleles. Overall, our data demonstrate that CRISPR/Cas9 is by far the most efficient gene targeting method in zebrafish. At the sequence level, indel mutations generated by these gene-editing nucleases can be classified as simple insertions, simple deletions, and complex changes that include both deletion and random insertion (Fig. 3B). Our data showed that ZFNs and CRISPR/Cas9 both caused simple insertions and deletions at a significant rate, while TALENs rarely generated simple insertions in zebrafish, which is consistent with the recent compilation of mutations generated in mammalian and nonmammalian systems with ZFNs and TALENs (Kim et al. 2013).
Comparison of somatic and germline mutations generated by CRISPR/Cas9
To understand how CRISPR/Cas9-mediated mutagenesis impacts different cell types and how the mutations are distributed during zebrafish embryonic development, we compared mutations that were generated in somatic cells of the founder fish to germline-transmitted mutations. We randomly selected 21 founders containing mutations from CRISPR targets with high activity (designated as group I) and 22 founders from CRISPR targets with moderate activity (designated as group II). For somatic mutations, we used tissue from the founder fish's (_F_0) tail fins and amplified the genomic sequences targeted by the CRISPR/Cas9. We also PCR-amplified the same genomic regions in _F_1 embryos known to carry mutations in the targeted region and sequenced them using the Illumina MiSeq platform. Sequence analysis of the mutation frequency showed 2618 mutations were detected in the somatic cells of the injected fish for a mean of 53.4 mutations per founder; 99 of those mutations (3.8%) were transmitted through the germline to the _F_1 generation. Seventy-six percent (75/99) of the mutations found in the _F_1 generation were also detectable in the somatic samples from the corresponding founder tissue (Supplemental Fig. 8).
While the sampling of seven _F_1 embryos underrepresents the total potential mutagenized genomes that might have transmitted through the germline, analysis of mutation distribution in both groups indicates most (76%) mutations transmitted through the germline can be detected in the somatic cells. In contrast, the majority of somatic cell mutations were not found in the _F_1 generation. These data suggest that the majority of germline-transmitted mutations are happening very early after injection. It is known that the zebrafish germ cells are committed at the latest by the 1000-cell stage (Yoon et al. 1997), so any mutation that can be detected in both the somatic tissue and the _F_1 generation most likely was generated in the first 3 h after injection, and they will be the majority of mutants identified in the _F_1 generation. Somatic and germline mutations continue to build up after the germline has been committed, but they will be represented in a much lower percentage of _F_1 embryos.
CRISPR/Cas9 can generate heritable large deletions
When injected in pairs, ZFNs and TALENs have been shown to induce genomic modification such as deletions and inversions (Gupta et al. 2013; Lim et al. 2013). We investigated whether CRISPR/Cas9 induced heritable large deletions when two sgRNAs were simultaneously used. We routinely injected two sgRNAs targeting two different sites for each gene to ensure mutant recovery, so we were able to test the frequency of deletions during the normal process of identifying mutants. Primer pairs flanking the two target sites were used to amplify the junction sequence between the two targets; it was possible to amplify the junction across the intervening region only when a large deletion occurred. We screened 15 targeted genes by fluorescent PCR and detected 24 large deletions. Five out of 15 (33%) genes had deletion events, with 24 embryos out of 322 from germline-transmitting founders carrying these deletions. The deletions occurred at an average rate of ∼3% (Fig. 5A). If the founders were first selected for germline transmission of mutations at a single target site, the transmission rate was boosted to 7.4%. The germline transmission rate for big deletions was consistent with the reported 1%–3% somatic mutagenesis rate described previously (Xiao et al. 2013). The junction sequences were confirmed by Sanger sequencing. We detected a 25,717-bp deletion in man2a1, a 9632-bp in mgat1b, a 1687-bp in man2b1, and a 676-bp deletion in mgat3a (Fig. 5B–E). Together, our results show that CRISPR/Cas9 can be used to efficiently generate large deletions.
Figure 5.

Heritable chromosomal deletions induced by CRISPR/Cas9. (A) Summary of detected large deletions between two target sites. Large deletions were identified in man2a1, mgat1b, man2b1, and mgat3a. (B) Graphical representation of the man2a1 locus and the sequence of the deletion interval. (C_–_E) Sequence of the deleted interval for mgat1b, man2b1, and mgat3a. The target sites are marked in gray, while the PAM sites are underlined. The sequences were obtained from the PCR products across the two target sites. The top strand represents the wild-type sequence and the bottom strand represents the junction sequences between two target sites. The size of the deletion is indicated on the right side.
Heritable multiplex genome editing induced by CRISPR/Cas9
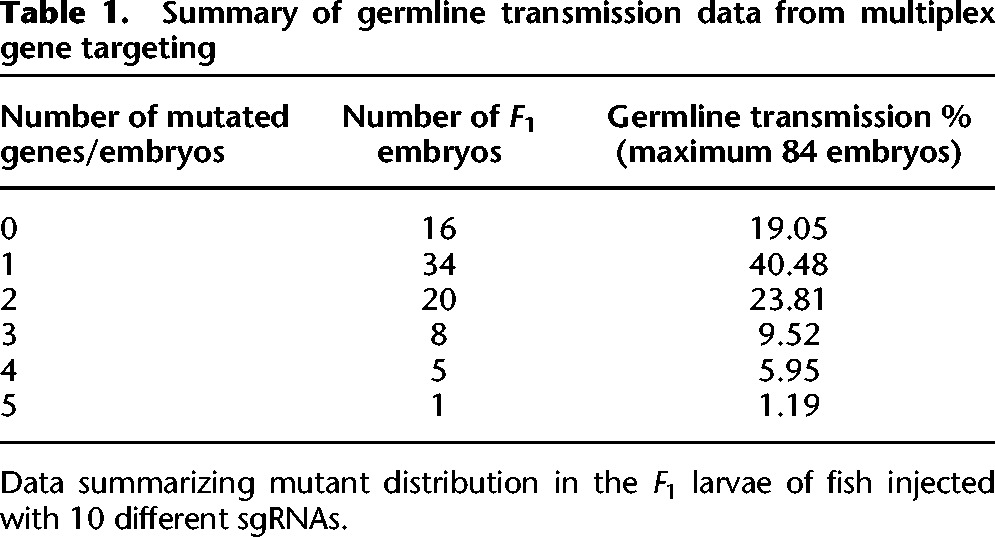
The CRISPR/Cas9 system is capable of targeting multiple genomic loci simultaneously, making it a versatile technology for multiplex gene targeting. This could be a significant tool given that zebrafish frequently have duplicated paralogs or functionally redundant genes. Jao and colleagues targeted five different genomic loci simultaneously, and associated phenotypes were observed in the injected embryos (Jao et al. 2013). We examined multiplex targeting for generating germline mutations as an approach to further increase mutagenesis throughput. We randomly selected 10 gene targets and synthesized 10 sgRNAs by pooling 10 oligos in a single reaction. We then co-injected ∼2 nL of the sgRNA mixture (100 ng/µL) and 150 ng/µL _Cas9_mRNA into the yolk of one-cell stage embryos and raised injected embryos to adults. The injected founder fish (_F_0) were crossed with wild-type fish (TAB-5), and seven embryos from 12 different founders were tested by fluorescence PCR as described above. We observed gene editing in seven out of 10 targeted loci with germline efficiencies from 5% to 88% (Supplemental Table 3). One target also did not work when injected individually, suggesting that the failure for that guide was not a result of the multiplexing. Forty percent of the embryos had mutations in one gene, 24% embryos in two genes, 10% in three genes, 6% in four genes, and one embryo carried germline mutations in five genes (Table 1). Given that 40% of the _F_1 embryos were carrying mutations in only one gene, 8–10 loci can be targeted simultaneously and fish carrying a single mutation can readily be identified in the _F_1 generation. Multiplexing increases the mutagenesis throughput 10-fold by reducing the animal husbandry needed to identify single mutant carriers. There is a small but measurable drop in mutagenic efficiency when multiplexing, most of which can be compensated for by increased concentration or more careful injection techniques.
Table 1.
Summary of germline transmission data from multiplex gene targeting
Phenotypic analysis of CRISPR/Cas9-induced alleles in the _F_1 generation
The primary purpose for generating knockout alleles is to study the consequences of gene function loss. Traditionally, phenotypic analysis is done using homozygous mutants generated by inbreeding heterozygous mutant carriers. Previous studies showed CRISPR/Cas9 can generate bi-allelic mutations and phenotypes can often be detected directly in injected embryos (_F_0) (Jao et al. 2013). In order to develop a high-throughput phenotypic pipeline, we sought to test whether phenotypic analysis can systematically be done in the _F_1 generation by inbreeding injected founders (Fig. 1B–D). We inbred a number of founders and collected embryos from the _F_1 generation to screen mutant phenotypes and correlate them with genotypes. _F_1 embryos were genotyped by both fluorescence PCR and sequencing. Consistent with other studies, most knocked-out genes did not display a readily observable embryonic phenotype (Kettleborough et al. 2013), but there were crosses with phenotypes clearly linked to the mutation.
For example, we targeted the tyrosine kinase receptor fgfr4 (Ota et al. 2010) and inbred founders that had not been prescreened to confirm germline transmission of mutants. Six founder pairs were crossed and one cross had embryos that displayed consistent phenotypes of heart edema, reduced midbrain-hindbrain, and modestly shortened bodies (Fig. 6). These founders had been injected with two different sgRNAs targeting two different genomic loci (targets 1 and 2: T1, T2). Both loci were tested in five embryos with phenotypes and 43 normal-looking embryos. All phenotypically normal embryos were either genotyped as wild type or heterozygous; all five phenotypic embryos were compound heterozygous mutants.
Figure 6.
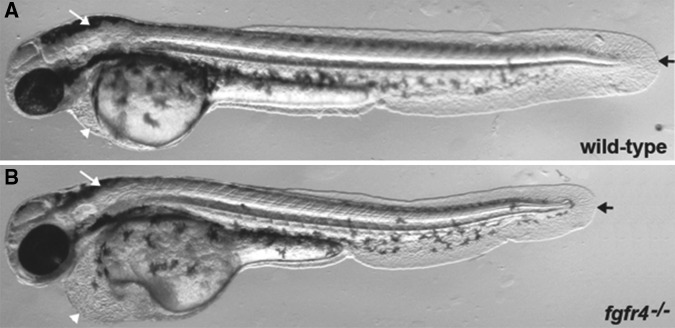
_fgfr4_−/− phenotype identified by inbreeding injected founder fish. Two single-guide RNAs (sgRNAs) targeting two different exons of the fgfr4 gene were co-injected with _Cas9_mRNA into wild-type embryos and raised to adults to generate founder fish (_F_0). Six pairs of founder fish (_F_0) were inbred and scored for mutant phenotypes. One of the six pairs showed multiple embryos with the same phenotype observable at 48 h post-fertilization. (A) Wild-type embryo at 48 h post-fertilization. White arrow indicates a normally sized hindbrain, white arrowhead indicates a normal heart chamber, and black arrow represents a normal tail length. (B) An fgfr4 compound heterozygous mutation displaying multiple phenotypes. White arrow indicates a reduced hindbrain region, white arrowhead points to a heart edema, and black arrow shows the shortened body axis. All phenotypes were only found in the compound heterozygous mutant embryos.
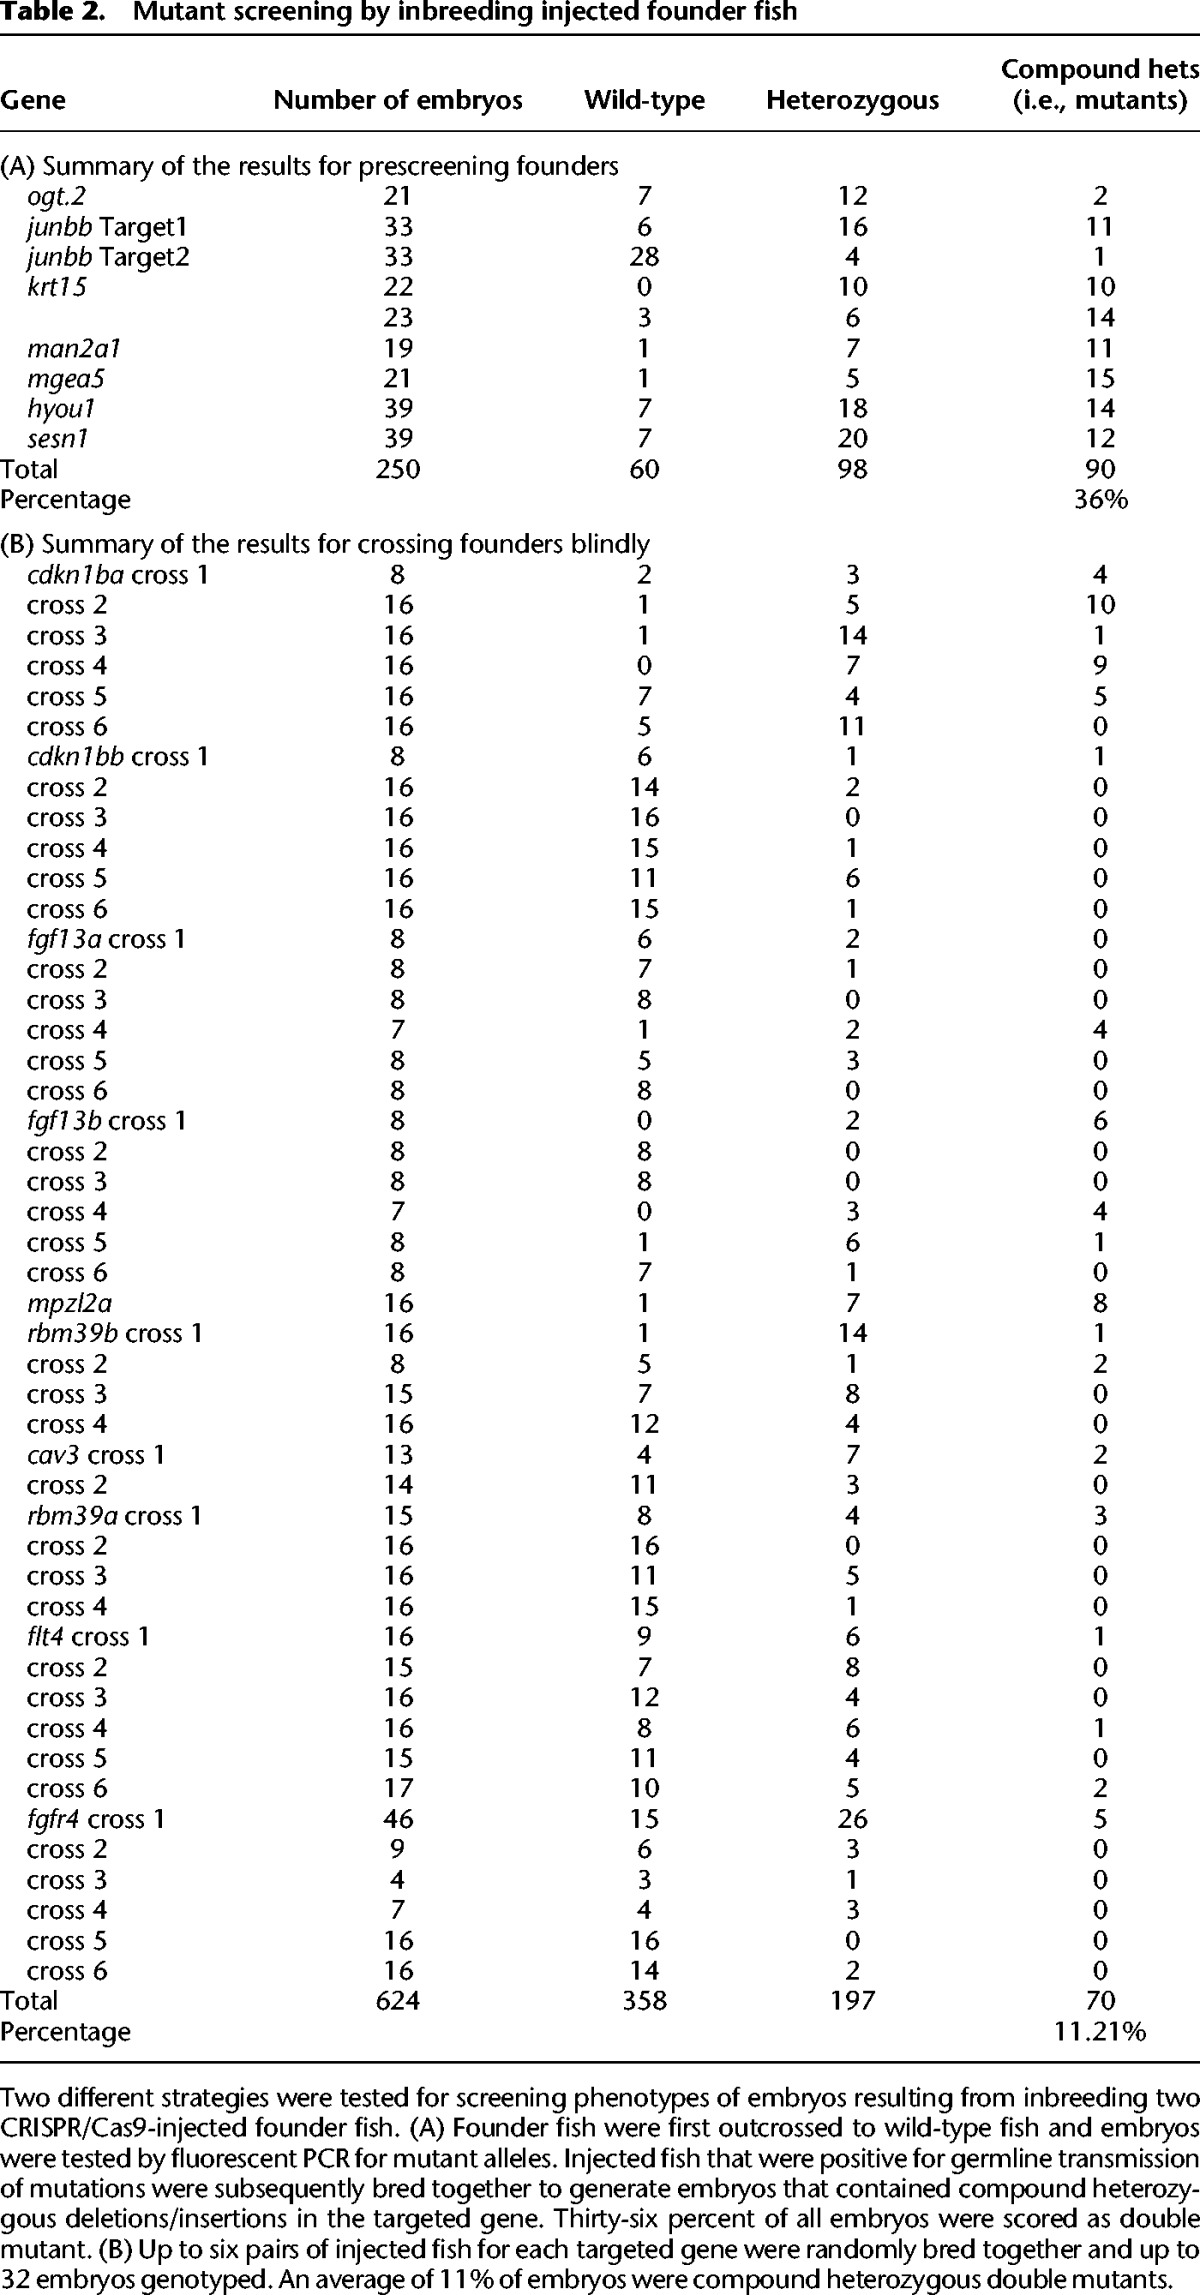
We tested 19 genes by founder inbreeding using two different strategies. The first strategy was to “prescreen” the founders by outcrossing to wild-type fish and testing embryos for germline transmission of mutations. Germline-positive founders were then crossed to generate _F_1 fish with compound heterozygous mutations. We tested eight different genomic targets with this approach and an average of 36% of the _F_1 larvae were scored as compound heterozygous mutations (Table 2A). The second strategy was to cross founder fish without prescreening. We tested 10 genes in this fashion, including the previously mentioned fgfr4. Forty-one percent of crosses had at least one identified compound heterozygous mutant larva; 11% of all embryos were compound heterozygous mutants. There were no cases in either strategy where no compound heterozygous mutants were identified. These tests demonstrate that embryos can consistently be screened in the _F_1 generation for mutant phenotypes, thus saving a minimum of 3 mo of animal husbandry when initially testing for phenotypes.
Table 2.
Mutant screening by inbreeding injected founder fish
Phenotypic correlation between human disease loci and zebrafish mutations
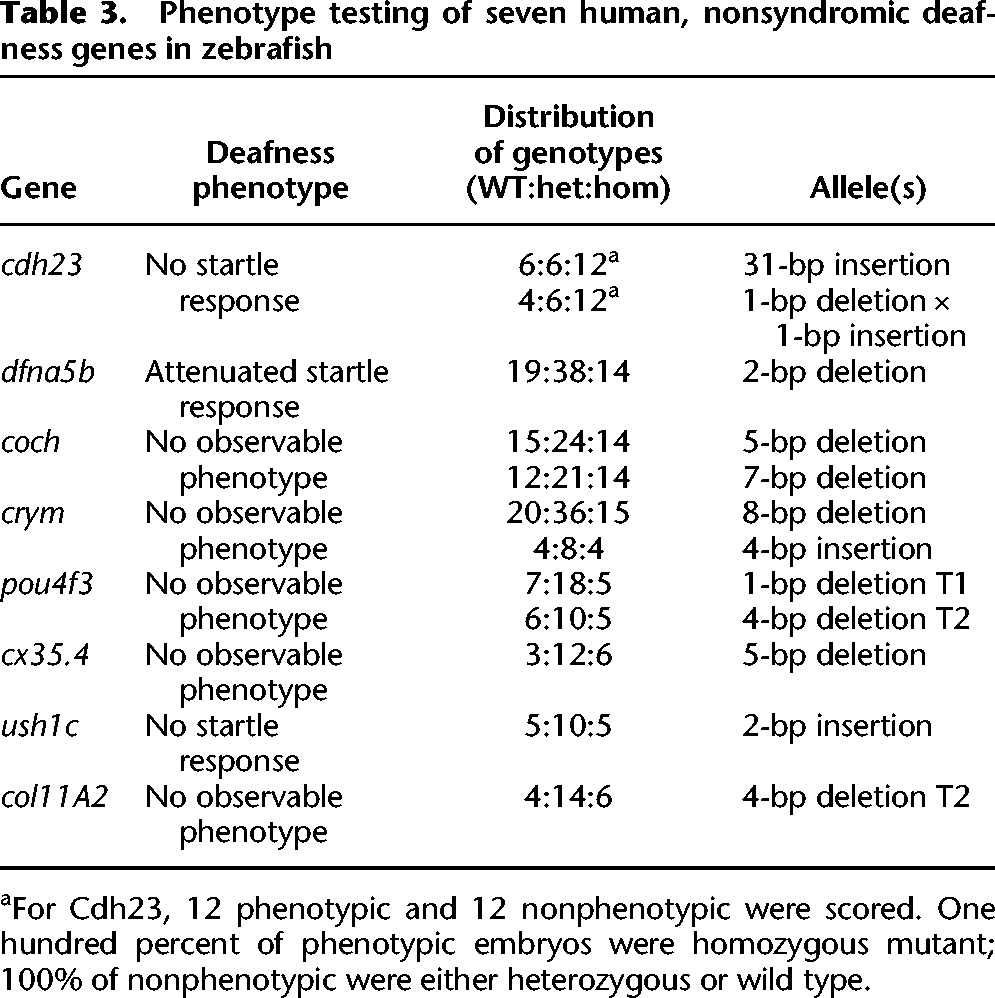
To get an initial estimate of how often zebrafish can be used to rapidly confirm candidate genes for human diseases, we chose eight genes (Table 3) from a highly curated list of genes that when mutated are known to cause nonsyndromic deafness in humans (Van Camp and Smith). Zebrafish larvae can be rapidly tested for hearing and vestibular function by tapping on the dish to elicit an acoustic startle response (Nicolson et al. 1998). Of the eight tested, three genes (cdh23, dfna5b, and ush1c) displayed a loss of startle response directly linked to the genotype of the fish (Table 3). All three of these genes have published phenotypes from either mutants or morpholino inhibition (Busch-Nentwich et al. 2004; Sollner et al. 2004; Phillips et al. 2011). Our observed phenotypes for cdh23 and ush1c matched the published mutant phenotypes exactly; however, our observed phenotype for dfna5b was significantly less severe than the morpholino inhibition phenotype reported in Busch-Nentwich et al. (2004). Specifically, we did not see the reported craniofacial defects reported by Busch-Nentwich, potentially reinforcing the recent cautions emerging regarding the use of morpholinos for phenotypic analysis (Kok et al. 2014). It is notable that the jaw phenotypes reported by Busch-Nentwich only emerged at relatively high morpholino concentrations (15–40 ng), suggesting that this phenotype might represent an off-target effect of the morpholinos used. Five of the eight genes did not display an obvious deafness phenotype despite strong evidence of their involvement in human deafness. This most likely represents the general limitations of simple gene inactivation in assessing human disease loci, which does not fully represent the variety of ways mutations can influence protein function or pathology.
Table 3.
Phenotype testing of seven human, nonsyndromic deafness genes in zebrafish
Analysis of off-target activities induced by CRISPR/Cas9
CRISPR/Cas9 not only induces mutations at the intended target sites but can also bind to similar sequences and induce mutations at other genomic loci. CRISPR/Cas9 has a tolerance for mismatches at the 5′ end of the target site but less so in the seed region (8–12 nt) at the 3′ end adjacent to the PAM site. Three independent studies have shown CRISPR/Cas9 could induce mutations even at the sites with up to five mismatches (Fu et al. 2013; Hsu et al. 2013; Pattanayak et al. 2013). We investigated the co-inheritance of mutations generated at the target site and at related off-target locations induced by CRISPR/Cas9. From our collection of 162 targets that we used for identifying germline mutations, we selected five targets with different levels of activity at the target location; these targets were _eya4_-T2, _dfna5b_-T2, _ptprn2_-T2, _marveld2b_-T1, and _fndc7a_-T2, and their mutagenic activities were 84%, 78%, 37%, 12%, and 5%, respectively. We selected a subset of potential off-target locations that were located specifically in exons of other genes. We selected five off-targets from each sgRNA that differed from the target sequence ranging from three to nine mismatches, and PCR-amplified the off-target genomic loci. Amplicons were pooled and sequenced on the Illumina MiSeq sequencing platform. Only one of the 25 off-target loci tested displayed a detectable mutation (Supplemental Table 4). The _dfna5b_-OT1 with three mismatches generated a 3-bp deletion, and other off-targets did not show any activity. Generally speaking, between segregation of unlinked mutations and the low occurrence of predicted off-target sites in exons or regulatory elements, off-target effects confounding phenotypic analysis of mutations in zebrafish can be considered a relatively small risk.
Discussion
Human candidate disease genes are being identified at a rapid rate from various GWAS and exome-sequencing projects, and these candidates need to be functionally validated. Zebrafish has been increasingly used to validate candidate disease genes because they represent a model organism that is a good compromise between speed of testing and relative closeness to human biology (Davis et al. 2014). For example, a recent, large-scale exome-sequencing project identified genes putatively causing developmental disorders. This study quickly validated 21 candidate genes in zebrafish using morpholino-mediated knockdown (Deciphering Developmental Disorders Study 2015). However, a recent report demonstrated that morpholino-mediated knockdown in zebrafish caused significantly more off-target induced phenotypes than was typically believed (Kok et al. 2014). In fact, 80% of the morphant phenotypes were not recapitulated by an actual genetic knockout of the matching gene, and many of the traditional controls used with morpholinos were also subject to misleading artifacts. There are currently no commonly used, high-throughput methods available in zebrafish that can substitute for morpholino-mediated knockdown to quickly verify the phenotype of a gene knockout. We describe here a high-throughput, streamlined pipeline for generating genomic lesions in zebrafish genes by CRISPR/Cas9. The targeting mutagenesis pipeline we described here includes a rapid method of generating sgRNA, mutant identification by fluorescence PCR, preliminary phenotype screening by inbreeding injected founder fish, and verification of insertions or deletions by multiplexed next-generation sequencing.
CRISPR/Cas9-mediated mutagenesis studies in zebrafish have reported mutagenesis efficiencies from 17% to 90%, but germline transmission rates were based on a small number of targets (Chang et al. 2013; Hwang et al. 2013a,b; Jao et al. 2013; Gagnon et al. 2014). This study provides enough germline transmission data to confidently identify the average efficiency for mutations induced by CRISPR/Cas9 and to robustly test the validity of guidelines for efficient sgRNA design.
We targeted two different loci for each gene and found we had a 99% success rate for generating mutations across 83 genes. The average rate of positive founders from more than 1000 fish tested was ≈50%, meaning that, on average, every other injected embryo transmitted mutations through the germline to the next generation. Although the average germline transmission rate was ≈50%, the rate varied substantially from target to target, ranging from 0% to 100% (Supplemental Table 1). When mutations were detected in the _F_1 generation, on average >50% of the _F_1 offspring were mutant carriers. Our data shows CRISPR/Cas9 was on average six times more efficient at making mutations in zebrafish when compared to ZFNs or TALENs (Fig. 3A).
Comparing the efficiency of targeting across 162 sgRNAs, we can make several conclusions about target efficacy. First, >75% of the targets we designed had activities with >20% germline success (Supplemental Table 1, compare first and second quartile). This has the important ramification that for the majority of targets tested, six to eight injected embryos was sufficient to identify mutant carriers. Similarly, in most fish, 50% or more of the embryos were mutant carriers, so for high-throughput mutagenesis, we routinely only had to test seven _F_1 embryos to confidently identify mutants. Although some weak trends could be detected in our data, most of the published “rules” for sgRNA design did not have statistically significant effects on targeting efficiency across a large number of genomic targets, leading us to conclude that most of the variation in efficiency is not a result of deviating from the “ideal” design.
The one sgRNA feature that we were able to demonstrate had a very strong effect on targeting efficiency was when there were mismatched bases at the 5′ end of the sgRNA. Hwang et al. (2013b) reported no loss of guide activity if the GG dinucleotide necessary for T7 RNA synthesis was not part of the genomic target sequence. In contrast, we found of the 30 sgRNAs that contained extra, mismatched bases at the 5′ end of the sgRNA, nine failed completely (30%), and only five of the 30 targets were in the top 50% in terms of activity. However, sgRNAs that started with a GG that matched the genome had only 15 failures from 132 targets (11%) (Supplemental Table 1). In other words, having a one- or two-base mismatch at the 5′ end of the sgRNA makes the guide three times more likely to fail completely. This is an effect similar to what was seen in Gagnon et al. (2014) when they used nonconsensus starting dinucleotides for T7 (GA or AG), and our interpretation is that the loss of activity they saw was the result of mismatched bases from “slippage” being incorporated at the 5′ end of the sgRNA. If you remove the sgRNA targets with 5′ mismatches from our data, the overall success rate improves to 88%. We have not established whether the loss in efficiency is a result of the mismatched bases at the 5′ end or that the total length of the sgRNA is 1–2 bases longer.
We saw relatively little in terms of off-target effects compared to the data coming from cell culture studies. One possible reason for the high off-target rates observed in cell culture and minimal off-target events in zebrafish is the duration of Cas9/sgRNA activity. This may be because of a shorter duration of Cas9 activity, faster dividing cells, or segregation of unlinked loci during meiosis. Regardless of the reason, off-target effects appear to be of minimal concern. We agree with the conclusions in Kok et al. (2014) that morpholino-generated phenotypes are problematic without confirmation from cognate mutant alleles.
We showed three methods for determining phenotype. The fastest method is to observe phenotypes in the injected embryos when the guide RNA is sufficiently active. While occasionally effective, there are significant limitations to this approach. In particular, if the phenotype is unknown, then off-target artifacts are possible just as they are for morpholinos, and it is not possible to confirm the phenotype/genotype correlation by genetic linkage. We showed the second approach of inbreeding injected fish can be an efficient way to rapidly screen for mutant phenotypes. It is somewhat more difficult than “traditional” screening because you are looking at the effects of compound heterozygous mutants with non-Mendelian distributions, but as a “first-pass” screening method it can be very effective. The traditional route (demonstrated with our tests of the human deafness genes) can provide clear, unambiguous results with Mendelian distributions allowing for high-resolution linkage. The methods described here can routinely determine mutant phenotypes in ∼3 mo for tens to hundreds of genes, depending on need. The key limitation when it comes to functional annotation of genes remains the accuracy and sensitivity of detecting phenotypes once the gene is inactivated. High resolution and high-throughput phenotyping remains a fundamental challenge for genetics.
Methods
Designing of CRISPR targets
We generated the SpCas9 CRISPR track by using Bowtie version 0.12.7 to identify relevant sequences (Langmead et al. 2009). We began by identifying all the NGG and NAG protospacer-adjacent motifs (PAMs) in version Zv9 of the zebrafish genome. For each 12-mer “seed” region 5′ of these sites, we counted the number of other seed regions that could be aligned with no more than one mismatch. This number indicates the number of potential off-target sites based on the seed alone. We expanded the analysis to the full 20-mer 5′ of the PAMs and identified the number of other such 20-mers that could be aligned with no more than two mismatches. The final output represented in the track are the 20-mers that meet the following criteria:
- NGG PAM site
- At least three mismatches in the full 20-mer, relative to all possible off-targets
The 18,367,469 CRISPR targets identified in this manner are viewable in the University of California, Santa Cruz (UCSC) Genome Browser in the “CRISPRs” track of the “ZebrafishGenomics” data hub at http://genome.ucsc.edu/cgi-bin/hgHubConnect, or in the Ensembl genome browser by uploading http://research.nhgri.nih.gov/manuscripts/Burgess/zebrafish/downloads/NHGRI-1/hub.txt as a TrackHub (Kent et al. 2002; Flicek et al. 2014). The name field of the BED file indicates the sequence of the 20-mer and the number of off-target 12-mers that are less than two mismatches away from the seed region. Note that this is an overestimate of the number of off-targets for the full 20-mer, as mismatches in the region upstream of the seed may further reduce the number of off-targets. In general, a lower number in this field indicates a CRISPR target less likely to cut at an off-target site. The values in the score column are scaled to the number of seed off-targets, such that targets with fewer off-targets appear as darker bars on the UCSC Genome Browser (Kent et al. 2002). Most targets used in this study start with GG followed by N18, which are directly upstream of the NGG PAM sequence (5′-GG-N18-NGG-3′) to satisfy the requirement for in vitro transcription using a T7 promoter. Three tracks are provided: “CRISPRs,” which lists all predicted targets, “GG CRISPRs,” which lists targets that can be synthesized by T7 in vitro, and “GA CRISPRs,” which lists targets that can be synthesized with SP6.
sgRNA template assembly and preparation of sgRNA and _Cas9_mRNA
We used a cloning-free method to generate sgRNA templates. To generate sgRNA templates, an oligo consisting of the T7 promoter, 18- to 20-nt target sequences, and 20-nt sequence that overlapped to a generic sgRNA template was designed as follows (IDT): 5′-TAATACGACTCACTATA-GGN(18-20)-GTTTTAGAGCTAGAAATAGC-3′.
The two guanines at the beginning of the target sequence are required for in vitro transcription and are the first two bases to be transcribed. Although for most sgRNAs we chose targets that start with GG, this requirement was relaxed for 30 of the targets, and extra guanines were added if the target did not start with two guanines. The targeting oligo was annealed with an 80-nt chimeric sgRNA core sequence: (5′-AAAAGCACCGACTCGGTGCCACTTTTTCAAGTTGATAACGGACTAGCCTTATTTTAACTTGCTATTTCTAGCTCTAAAAC-3′). The annealed oligos were then filled in using Phusion polymerase (New England BioLabs) under the following conditions: 98°C for 2 min; 50°C for 10 min; 72°C for 10 min.
The quality of the assembled oligos was checked on a 2.5% agarose gel. Approximately 2–3 µL of gRNA template was then used to transcribe RNA by in vitro transcription using the HiScribe T7 High Yield RNA Synthesis kit (New England BioLabs) according to the manufacturer's instructions. The sgRNAs were precipitated using isopropanol/sodium acetate (pH 5.2).
For _Cas9_mRNA, the zebrafish codon optimized cas9 plasmid pT3TS-nls-zCas9-nls was used as template (Jao et al. 2013). The template DNA was linearized by XbaI and purified using a QIAprep purification column (Qiagen). Five hundred to 1000 ng linearized template was used to synthesize capped RNA using the mMESSAGE mMACHINE T3 kit (Life Technologies) and precipitated using LiCl.
Embryo injections
All animal husbandry procedures were performed according to approved NHGRI animal protocol G-01-3. All injections were performed in the wild-type strain TAB-5. Approximately 2 nL total volume of Cas9 RNA and sgRNA were co-injected into the yolk of one-cell stage embryos. We used two different concentrations: ≈25 pg of sgRNA per target with ≈300 pg Cas9, or ≈50 pg sgRNA per target with ≈150 pg Cas9. Injected embryos were then raised to adulthood to generate “founder” fish (_F_0).
Multiplex RNA synthesis and injection
To test the efficiency of multiplex gene targeting, we chose 10 targets randomly. The targeting oligos from each target were pooled together in equimolar concentrations (10 µM each). The sgRNA assembly was performed using the pooled guide oligos and the backbone oligo as described above. The resulting pool of templates was used for in vitro transcription. The pool of RNA representing all targets (≈200 pg) was co-injected with Cas9 (≈300 pg).
Founder screening, _F_1 genotyping, and deletion testing by fluorescence PCR
Genomic DNA extraction
Injected fish were grown to adulthood and screened for germline transmission of CRISPR-induced mutations by fluorescence PCR (Sood et al. 2013). Each putative founder fish was crossed with a wild-type fish and embryos were harvested at 24–72 h post-fertilization in 96-well plates, one embryo per well. Typically, we analyzed seven embryos/founder and raised the remaining embryos to adulthood. This method allowed us to screen 12 founders/plate with positive (DNA from wild-type fish of same strain) and negative controls (water) for PCR. The embryo plate was centrifuged briefly and excess embryo medium was removed from the wells. The plate was then processed for DNA extraction using the DNA Extract-N-Amp Tissue PCR kit (Sigma-Aldrich; St. Louis, MO, USA) or NaOH/Tris-HCl (Meeker et al. 2007). For extraction using the kit, embryos were incubated in 32 μL of a 4:1 mixture of extraction solution and tissue preparation solution at room temperature for 10 min, heated to 95°C for 5 min, and mixed with 25 μL of neutralization solution by vortexing. DNA was then diluted 10× with ultra-clean water to remove any PCR inhibitors in the mixture. Note that this dilution step is very important for success of the protocol. Both original and diluted DNA can be stored at −20°C for up to 6 mo.
Fluorescence PCR
PCR reactions used 1.5 μL of diluted DNA and 5 μL of PCR mix containing AmpliTaq Gold DNA polymerase (Life Technologies) with appropriate buffer, MgCl2, dNTPs, and equimolar ratios of the following three primers at 5 pmol/μL: M13F primer with fluorescent tag (6-FAM, HEX, or TAMRA), amplicon-specific forward primer with M13 forward tail (5′-TGTAAAACGACGGCCAGT-3′) and 5′ PIG-tailed (5′-GTGTCTT-3′) amplicon-specific reverse primer (gene-specific primers are listed in Supplemental File 2) (Brownstein et al. 1996). PCR conditions were as follows: denaturation at 94°C for 12 min, followed by 35 cycles of amplification (94°C for 30 sec, 57°C for 30 sec, and 72°C for 30 sec), final extension at 72°C for 10 min, and indefinite hold at 4°C. Ten microliters of 1:25 mixture of ROX400 size-standard and Hi-Di formamide (Life Technologies) were added to 1.5 μL of PCR product and samples were denatured at 95°C for 5 min. Denatured PCR products were analyzed to identify wild-type and mutant fragments generated by insertion or deletion on a Genetic Analyzer 3130xl using POP-7 polymer. Data were analyzed for allele sizes and corresponding peak heights using the local Southern algorithm available in the Genescan and Genotyper software of the GeneMapper software package (Life Technologies). The allele sizes were used to calculate the observed indel mutations. Mutations from two independent founders that were not in multiples of 3 bp and thus predicted to be frameshift truncations were selected for further confirmation by sequencing. Adult _F_1 progeny of these founder fish were genotyped similarly by fluorescent PCR using DNA extracted from fin clips.
Deletion screening
We tested for possible deletion of the regions between two targets in several genes where mutations were detected individually for both targets. Fluorescence PCR was performed using the same protocol as described above except the forward primer of the target site in the 5′ exon was mixed with the reverse primer of the target site for the 3′ exon. The deletions were confirmed by sequencing of the PCR products from the samples that yielded a peak of significant peak height under these conditions.
Multiplex barcode sequencing
Targeted regions were amplified using gene-specific primers and a third primer containing a 6-bp barcode (Supplemental File 3). The barcoding allowed us to multiplex up to 96 samples from each targeted region. The PCR amplicons were purified using a QIAquick PCR purification kit. Equimolar concentrations from each target were pooled together to construct the sequencing library. Libraries compatible with Illumina HiSeq 2500 sequencing were constructed from 100 ng CRISPR DNA using the Ovation Ultralow Library System (NuGEN). The libraries were quantitated by qPCR (KAPA Biosystems). Approximately 10 million 300-base read pairs were generated on an Illumina MiSeq sequencer. Three libraries were prepared in this manner. The sequence data were processed using RTA version 1.18.54 and CASAVA version 1.8.2.
Deletion/insertion variant identification
We identified the deletion and insertion variants (DIVs) using ampliconDIVider v.1.0.0 (http://research.nhgri.nih.gov/CRISPRz). This software uses cutadapt v.1.3 (Martin 2011) to trim nongenomic DNA from the reads, NovoAlign v.3.02.07 (http://www.novocraft.com/) to align trimmed reads to amplicons from version Zv9 of the zebrafish genome (Howe et al. 2013), bam2mpg and mpg2vcf.pl (http://research.nhgri.nih.gov/software/bam2mpg/) (Teer et al. 2010) to identify samples with DIVs, sam2pairwise v.1.0.0 to (https://github.com/mlafave/sam2pairwise) visualize DIV-containing reads as pairwise alignments, and SAMtools v.0.1.19 (Li et al. 2009), BAMtools v.2.3.0 (Barnett et al. 2011), and bgzip to process file formats. We identified all DIVs that overlapped the region 30 bp + or − from the 3′ end of the guide RNA sequence and used MUSCLE v3.8.31 to visualize the multiple sequence alignments (Edgar 2004). The alignments in Supplemental File 1 are in ClustalW format and have been manually rearranged such that the reference sequence is the first line. We summed and compared DIVs by identifying the type (deletion or insertion), position from the 5′ end of the fragment, and length of the variant.
Statistical analysis
The statistical analyses carried out in Supplemental Figures 3–7 were carried out in R v.3.0.2 using kruskal.test() (Supplemental Figs. 3–6) and wilcox.test() (Supplemental Fig. 7; R Core Team 2013). The significance threshold was adjusted from P = 0.05 to P = 0.01 by Bonferroni correction. These figures were created using ggplot2 v.0.9.3.1 (Wickham 2009).
Data access
All sequence data derived from PCR amplicons for CRISPR targets have been submitted to the NCBI BioProject database (http://www.ncbi.nlm.nih.gov/bioproject) under accession number PRJNA262180.
Acknowledgments
We thank Colin Huck, Dustin Prebilic, and other staff of the National Institutes of Health zebrafish facility for excellent animal care, Julia Fekecs for illustrations and graphics work, and Robert Blakesley, Alice Young, Baishali Maskeri, and the National Intramural Sequencing Center (NISC) for providing sequence data. This research was supported by the Intramural Research Program of the National Human Genome Research Institute (NHGRI), National Institutes of Health (S.M.B. and R.S.), R01DK088686 (W.C.), and Science for Life Laboratory, Sweden (J.L.).
Footnotes
[Supplemental material is available for this article.]
Freely available online through the Genome Research Open Access option.
References
- Barnett DW, Garrison EK, Quinlan AR, Stromberg MP, Marth GT. 2011. BamTools: a C++ API and toolkit for analyzing and managing BAM files. Bioinformatics 27: 1691–1692. [DOI] [PMC free article] [PubMed] [Google Scholar]
- Bedell VM, Wang Y, Campbell JM, Poshusta TL, Starker CG, Krug RG II, Tan W, Penheiter SG, Ma AC, Leung AY, et al. 2012. In vivo genome editing using a high-efficiency TALEN system. Nature 491: 114–118. [DOI] [PMC free article] [PubMed] [Google Scholar]
- Brownstein MJ, Carpten JD, Smith JR. 1996. Modulation of non-templated nucleotide addition by Taq DNA polymerase: primer modifications that facilitate genotyping. Biotechniques 20: 1004–1006, 1008–1010. [DOI] [PubMed] [Google Scholar]
- Busch-Nentwich E, Sollner C, Roehl H, Nicolson T. 2004. The deafness gene dfna5 is crucial for ugdh expression and HA production in the developing ear in zebrafish. Development 131: 943–951. [DOI] [PubMed] [Google Scholar]
- Chang N, Sun C, Gao L, Zhu D, Xu X, Zhu X, Xiong JW, Xi JJ. 2013. Genome editing with RNA-guided Cas9 nuclease in zebrafish embryos. Cell Res 23: 465–472. [DOI] [PMC free article] [PubMed] [Google Scholar]
- Clark KJ, Balciunas D, Pogoda HM, Ding Y, Westcot SE, Bedell VM, Greenwood TM, Urban MD, Skuster KJ, Petzold AM, et al. 2011. In vivo protein trapping produces a functional expression codex of the vertebrate proteome. Nat Methods 8: 506–515. [DOI] [PMC free article] [PubMed] [Google Scholar]
- Cong L, Ran FA, Cox D, Lin S, Barretto R, Habib N, Hsu PD, Wu X, Jiang W, Marraffini LA, et al. 2013. Multiplex genome engineering using CRISPR/Cas systems. Science 339: 819–823. [DOI] [PMC free article] [PubMed] [Google Scholar]
- Davis EE, Frangakis S, Katsanis N. 2014. Interpreting human genetic variation with in vivo zebrafish assays. Biochim Biophys Acta 1842: 1960–1970. [DOI] [PMC free article] [PubMed] [Google Scholar]
- Deciphering Developmental Disorders Study. 2015. Large-scale discovery of novel genetic causes of developmental disorders. Nature 519: 223–228. [DOI] [PMC free article] [PubMed] [Google Scholar]
- Doench JG, Hartenian E, Graham DB, Tothova Z, Hegde M, Smith I, Sullender M, Ebert BL, Xavier RJ, Root DE. 2014. Rational design of highly active sgRNAs for CRISPR-Cas9-mediated gene inactivation. Nat Biotechnol 32: 1262–1267. [DOI] [PMC free article] [PubMed] [Google Scholar]
- Doyon Y, McCammon JM, Miller JC, Faraji F, Ngo C, Katibah GE, Amora R, Hocking TD, Zhang L, Rebar EJ, et al. 2008. Heritable targeted gene disruption in zebrafish using designed zinc-finger nucleases. Nat Biotechnol 26: 702–708. [DOI] [PMC free article] [PubMed] [Google Scholar]
- Edgar RC. 2004. MUSCLE: multiple sequence alignment with high accuracy and high throughput. Nucleic Acids Res 32: 1792–1797. [DOI] [PMC free article] [PubMed] [Google Scholar]
- Fischer S, Draper BW, Neumann CJ. 2003. The zebrafish fgf24 mutant identifies an additional level of Fgf signaling involved in vertebrate forelimb initiation. Development 130: 3515–3524. [DOI] [PubMed] [Google Scholar]
- Flicek P, Amode MR, Barrell D, Beal K, Billis K, Brent S, Carvalho-Silva D, Clapham P, Coates G, Fitzgerald S, et al. 2014. Ensembl 2014. Nucleic Acids Res 42: D749–D755. [DOI] [PMC free article] [PubMed] [Google Scholar]
- Fu Y, Foden JA, Khayter C, Maeder ML, Reyon D, Joung JK, Sander JD. 2013. High-frequency off-target mutagenesis induced by CRISPR-Cas nucleases in human cells. Nat Biotechnol 31: 822–826. [DOI] [PMC free article] [PubMed] [Google Scholar]
- Gagnon JA, Valen E, Thyme SB, Huang P, Ahkmetova L, Pauli A, Montague TG, Zimmerman S, Richter C, Schier AF. 2014. Efficient mutagenesis by Cas9 protein-mediated oligonucleotide insertion and large-scale assessment of single-guide RNAs. PLoS One 9: e98186. [DOI] [PMC free article] [PubMed] [Google Scholar]
- Gasiunas G, Barrangou R, Horvath P, Siksnys V. 2012. Cas9-crRNA ribonucleoprotein complex mediates specific DNA cleavage for adaptive immunity in bacteria. Proc Natl Acad Sci 109: E2579–E2586. [DOI] [PMC free article] [PubMed] [Google Scholar]
- Gupta A, Hall VL, Kok FO, Shin M, McNulty JC, Lawson ND, Wolfe SA. 2013. Targeted chromosomal deletions and inversions in zebrafish. Genome Res 23: 1008–1017. [DOI] [PMC free article] [PubMed] [Google Scholar]
- Haffter P, Granato M, Brand M, Mullins MC, Hammerschmidt M, Kane DA, Odenthal J, van Eeden FJ, Jiang YJ, Heisenberg CP, et al. 1996. The identification of genes with unique and essential functions in the development of the zebrafish, Danio rerio. Development 123: 1–36. [DOI] [PubMed] [Google Scholar]
- Howe K, Clark MD, Torroja CF, Torrance J, Berthelot C, Muffato M, Collins JE, Humphray S, McLaren K, Matthews L, et al. 2013. The zebrafish reference genome sequence and its relationship to the human genome. Nature 496: 498–503. [DOI] [PMC free article] [PubMed] [Google Scholar]
- Hsu PD, Scott DA, Weinstein JA, Ran FA, Konermann S, Agarwala V, Li Y, Fine EJ, Wu X, Shalem O, et al. 2013. DNA targeting specificity of RNA-guided Cas9 nucleases. Nat Biotechnol 31: 827–832. [DOI] [PMC free article] [PubMed] [Google Scholar]
- Hsu PD, Lander ES, Zhang F. 2014. Development and applications of CRISPR-Cas9 for genome engineering. Cell 157: 1262–1278. [DOI] [PMC free article] [PubMed] [Google Scholar]
- Hwang WY, Fu Y, Reyon D, Maeder ML, Kaini P, Sander JD, Joung JK, Peterson RT, Yeh JR. 2013a. Heritable and precise zebrafish genome editing using a CRISPR-Cas system. PLoS One 8: e68708. [DOI] [PMC free article] [PubMed] [Google Scholar]
- Hwang WY, Fu Y, Reyon D, Maeder ML, Tsai SQ, Sander JD, Peterson RT, Yeh JR, Joung JK. 2013b. Efficient genome editing in zebrafish using a CRISPR-Cas system. Nat Biotechnol 31: 227–229. [DOI] [PMC free article] [PubMed] [Google Scholar]
- International Human Genome Sequencing Consortium. 2004. Finishing the euchromatic sequence of the human genome. Nature 431: 931–945. [DOI] [PubMed] [Google Scholar]
- Jao LE, Wente SR, Chen W. 2013. Efficient multiplex biallelic zebrafish genome editing using a CRISPR nuclease system. Proc Natl Acad Sci 110: 13904–13909. [DOI] [PMC free article] [PubMed] [Google Scholar]
- Jinek M, Chylinski K, Fonfara I, Hauer M, Doudna JA, Charpentier E. 2012. A programmable dual-RNA-guided DNA endonuclease in adaptive bacterial immunity. Science 337: 816–821. [DOI] [PMC free article] [PubMed] [Google Scholar]
- Kent WJ, Sugnet CW, Furey TS, Roskin KM, Pringle TH, Zahler AM, Haussler D. 2002. The human genome browser at UCSC. Genome Res 12: 996–1006. [DOI] [PMC free article] [PubMed] [Google Scholar]
- Kettleborough RN, Busch-Nentwich EM, Harvey SA, Dooley CM, de Bruijn E, van Eeden F, Sealy I, White RJ, Herd C, Nijman IJ, et al. 2013. A systematic genome-wide analysis of zebrafish protein-coding gene function. Nature 496: 494–497. [DOI] [PMC free article] [PubMed] [Google Scholar]
- Kim Y, Kweon J, Kim JS. 2013. TALENs and ZFNs are associated with different mutation signatures. Nat Methods 10: 185. [DOI] [PubMed] [Google Scholar]
- Kok FO, Shin M, Ni C, Gupta A, Grosse AS, van Impel A, Kirchmaier BC, Peterson-Maduro J, Kourkoulis G, Male I, et al. 2014. Reverse genetic screening reveals poor correlation between morpholino-induced and mutant phenotypes in zebrafish. Dev Cell 32: 97–108. [DOI] [PMC free article] [PubMed] [Google Scholar]
- LaFave MC, Varshney GK, Vemulapalli M, Mullikin JC, Burgess SM. 2014. A defined zebrafish line for high-throughput genetics and genomics: NHGRI-1. Genetics 198: 167–170. [DOI] [PMC free article] [PubMed] [Google Scholar]
- Langmead B, Trapnell C, Pop M, Salzberg SL. 2009. Ultrafast and memory-efficient alignment of short DNA sequences to the human genome. Genome Biol 10: R25. [DOI] [PMC free article] [PubMed] [Google Scholar]
- Law SH, Sargent TD. 2014. The serine-threonine protein kinase PAK4 is dispensable in zebrafish: identification of a morpholino-generated pseudophenotype. PLoS One 9: e100268. [DOI] [PMC free article] [PubMed] [Google Scholar]
- Li H, Handsaker B, Wysoker A, Fennell T, Ruan J, Homer N, Marth G, Abecasis G, Durbin R. 2009. The Sequence Alignment/Map format and SAMtools. Bioinformatics 25: 2078–2079. [DOI] [PMC free article] [PubMed] [Google Scholar]
- Lim S, Wang Y, Yu X, Huang Y, Featherstone MS, Sampath K. 2013. A simple strategy for heritable chromosomal deletions in zebrafish via the combinatorial action of targeting nucleases. Genome Biol 14: R69. [DOI] [PMC free article] [PubMed] [Google Scholar]
- Mali P, Yang L, Esvelt KM, Aach J, Guell M, DiCarlo JE, Norville JE, Church GM. 2013. RNA-guided human genome engineering via Cas9. Science 339: 823–826. [DOI] [PMC free article] [PubMed] [Google Scholar]
- Martin M. 2011. Cutadapt removes adapter sequences from high-throughput sequencing reads. EMBnetjournal 17: 10–12. [Google Scholar]
- Meeker ND, Hutchinson SA, Ho L, Trede NS. 2007. Method for isolation of PCR-ready genomic DNA from zebrafish tissues. Biotechniques 43: 610, 612, 614. [DOI] [PubMed] [Google Scholar]
- Nicolson T, Rusch A, Friedrich RW, Granato M, Ruppersberg JP, Nusslein-Volhard C. 1998. Genetic analysis of vertebrate sensory hair cell mechanosensation: the zebrafish circler mutants. Neuron 20: 271–283. [DOI] [PubMed] [Google Scholar]
- Ota S, Tonou-Fujimori N, Tonou-Fujimori N, Nakayama Y, Ito Y, Kawamura A, Yamasu K. 2010. FGF receptor gene expression and its regulation by FGF signaling during early zebrafish development. Genesis 48: 707–716. [DOI] [PubMed] [Google Scholar]
- Pattanayak V, Lin S, Guilinger JP, Ma E, Doudna JA, Liu DR. 2013. High-throughput profiling of off-target DNA cleavage reveals RNA-programmed Cas9 nuclease specificity. Nat Biotechnol 31: 839–843. [DOI] [PMC free article] [PubMed] [Google Scholar]
- Phillips JB, Blanco-Sanchez B, Lentz JJ, Tallafuss A, Khanobdee K, Sampath S, Jacobs ZG, Han PF, Mishra M, Titus TA, et al. 2011. Harmonin (Ush1c) is required in zebrafish Muller glial cells for photoreceptor synaptic development and function. Dis Model Mech 4: 786–800. [DOI] [PMC free article] [PubMed] [Google Scholar]
- Rabbani B, Tekin M, Mahdieh N. 2014. The promise of whole-exome sequencing in medical genetics. J Hum Genet 59: 5–15. [DOI] [PubMed] [Google Scholar]
- R Core Team. 2013. R: a language and environment for statistical computing. The R Foundation for Statistical Computing, Vienna, Austria: http://www.R-project.org/. [Google Scholar]
- Sollner C, Rauch GJ, Siemens J, Geisler R, Schuster SC, Muller U, Nicolson T, Tubingen Screen C. 2004. Mutations in cadherin 23 affect tip links in zebrafish sensory hair cells. Nature 428: 955–959. [DOI] [PubMed] [Google Scholar]
- Sood R, Carrington B, Bishop K, Jones M, Rissone A, Candotti F, Chandrasekharappa SC, Liu P. 2013. Efficient methods for targeted mutagenesis in zebrafish using zinc-finger nucleases: data from targeting of nine genes using CompoZr or CoDA ZFNs. PLoS One 8: e57239. [DOI] [PMC free article] [PubMed] [Google Scholar]
- Teer JK, Bonnycastle LL, Chines PS, Hansen NF, Aoyama N, Swift AJ, Abaan HO, Albert TJ, Margulies EH, Green ED, et al. 2010. Systematic comparison of three genomic enrichment methods for massively parallel DNA sequencing. Genome Res 20: 1420–1431. [DOI] [PMC free article] [PubMed] [Google Scholar]
- Van Camp G, Smith RJH. Hereditary Hearing Loss Homepage (http://hereditaryhearingloss.org). [Google Scholar]
- Varshney GK, Huang H, Zhang S, Lu J, Gildea DE, Yang Z, Wolfsberg TG, Lin S, Burgess SM. 2013a. The Zebrafish Insertion Collection (ZInC): a web based, searchable collection of zebrafish mutations generated by DNA insertion. Nucleic Acids Res 41: D861–D864. [DOI] [PMC free article] [PubMed] [Google Scholar]
- Varshney GK, Lu J, Gildea DE, Huang H, Pei W, Yang Z, Huang SC, Schoenfeld D, Pho NH, Casero D, et al. 2013b. A large-scale zebrafish gene knockout resource for the genome-wide study of gene function. Genome Res 23: 727–735. [DOI] [PMC free article] [PubMed] [Google Scholar]
- Welter D, MacArthur J, Morales J, Burdett T, Hall P, Junkins H, Klemm A, Flicek P, Manolio T, Hindorff L, et al. 2014. The NHGRI GWAS Catalog, a curated resource of SNP-trait associations. Nucleic Acids Res 42: D1001–D1006. [DOI] [PMC free article] [PubMed] [Google Scholar]
- Wickham H. 2009. ggplot2: elegant graphics for data analysis. Springer, New York. [Google Scholar]
- Xiao A, Wang Z, Hu Y, Wu Y, Luo Z, Yang Z, Zu Y, Li W, Huang P, Tong X, et al. 2013. Chromosomal deletions and inversions mediated by TALENs and CRISPR/Cas in zebrafish. Nucleic Acids Res 41: e141. [DOI] [PMC free article] [PubMed] [Google Scholar]
- Yoon C, Kawakami K, Hopkins N. 1997. Zebrafish vasa homologue RNA is localized to the cleavage planes of 2- and 4-cell-stage embryos and is expressed in the primordial germ cells. Development 124: 3157–3165. [DOI] [PubMed] [Google Scholar]