MicroRNA profiling of clear cell renal cell cancer identifies a robust signature to define renal malignancy (original) (raw)
Abstract
MicroRNAs are short single-stranded RNAs that are associated with gene regulation at the transcriptional and translational level. Changes in their expression were found in a variety of human cancers. Only few data are available on microRNAs in clear cell renal cell carcinoma (ccRCC). We performed genome-wide expression profiling of microRNAs using microarray analysis and quantification of specific microRNAs by TaqMan real-time RT-PCR. Matched malignant and non-malignant tissue samples from two independent sets of 12 and 72 ccRCC were profiled. The microarray-based experiments identified 13 over-expressed and 20 down-regulated microRNAs in malignant samples. Expression in ccRCC tissue samples compared with matched non-malignant samples measured by RT-PCR was increased on average by 2.7- to 23-fold for the hsa-miR-16, −452*, −224, −155 and −210, but decreased by 4.8- to 138-fold for hsa-miR-200b, −363, −429, −200c, −514 and −141. No significant associations between these differentially expressed microRNAs and the clinico-pathological factors tumour stage, tumour grade and survival rate were found. Nevertheless, malignant and non-malignant tissue could clearly be differentiated by their microRNA profile. A combination of miR-141 and miR-155 resulted in a 97% overall correct classification of samples. The presented differential microRNA pattern provides a solid basis for further validation, including functional studies.
Keywords: clear cell renal cell carcinoma, microRNA profiling, microarray, RT-PCR
Introduction
MicroRNAs represent a class of endogenous single-stranded non-coding small RNAs of about 22 nucleotides. It is currently assumed that the human genome encodes approximately 1000 microRNAs that are involved in the regulation of about 30% of all genes [1]. Until now, 678 human microRNAs have been identified and annotated in the miRBase database release 11.0 at the Sanger Institute (http://microrna.sanger.ac.uk/).
MicroRNAs are important regulators in gene expression at the transcriptional and translational levels [2] and seem to play an important and possibly a dominant role in tumour biology. The first description of microRNAs linked to human disease identified the down-regulation of single microRNAs in B-cell chronic lymphocytic leukaemia [3]. Subsequent studies proved the deviant expression of microRNAs in many different tumours in comparison with normal tissues of lung [4], pancreas [5], colon [6], breast [7], liver [8], prostate [9] or other solid tumours [10]. Also, an association of microRNAs with tumour stage and grade, prognosis of disease and progression under therapy or survival of patients was demonstrated for various cancer types [11, 12]. These studies constitute the promising potential of microRNAs as tumour classifiers and as prognostic and predictive biomarkers [5, 13, 14]. Recently, we summarized the current state of knowledge about microRNAs in urological tumours [15]. However, although renal cell carcinoma (RCC) is 1 of the 10 most frequent tumours [16], the published data on microRNA in human RCC are surprisingly sparse [17, 18]. There were a few microarray-based studies including expression data from kidney only in comparison with other organs but not to RCC [10, 19–21]. During the revision of this paper, a report on microRNAs on RCC was published [22]. On the other hand, there are reports on the role of microRNAs in non-tumoural kidney pathology. For example, 20 differently expressed microRNAs were recently identified in acute rejection after renal transplantation [23].
This lack of data prompted us to (i) determine and compare the expression profiles of microRNA in RCC in comparison with normal renal tissue, (ii) explore possible associations between microRNA expression patterns and clinico-pathological data, (iii) test the potential clinical usefulness of microRNAs as diagnostic and prognostic markers and (iv) provide a reliable differential microRNA profile as a solid basis for further functional studies. This study focussed on clear cell RCC (ccRCC), the most common (75% of cases) renal cancer sub-type with the most serious prognosis [24].
Materials and methods
Patients and tissue samples
The study was successively performed on two independent sample sets. Set one included 12, set two 72 kidney tissue sample pairs (malignant and non-malignant tissue samples from the same kidney) derived from adult patients undergoing radical nephrectomy at the University Hospital Charitè between February 2004 and August 2008 (Table 1). The use of the patient material for the research study was approved by the Medical Ethics Committee of the Charité. All tumour types were ccRCC. Tumour classification and stage were established according to the 2002 TNM System and the 2004 WHO Classification (Table 1).
Table 1.
Clinico-pathologic characteristics of the clear cell renal cell carcinoma patients studied in two sample sets
| Patient characteristics | Set 1 | Set 2 | Both sets |
|---|---|---|---|
| Age (median years; range) | 63 | 66 | 65 (40–92) |
| Sex (number) | |||
| Male | 7 | 50 | 57 |
| Female | 5 | 22 | 27 |
| Tumour characteristics | |||
| Pathological stage | |||
| pT1 | 2 | 41 | 43 |
| pT2 | 1 | 2 | 3 |
| pT3 | 9 | 26 | 35 |
| pT4 | - | 3 | 3 |
| Grading | |||
| G1 | - | 6 | 6 |
| G2 | 9 | 54 | 63 |
| G3 | 3 | 9 | 12 |
| G4 | - | 3 | 3 |
| Surgical margins | |||
| R0 | 12 | 61 | 73 |
| R1 | - | 5 | 5 |
| R2 | - | 4 | 4 |
| Rx | - | 2 | 2 |
| Lymph node stage | |||
| N0 | 10 | 31 | 41 |
| N1 | - | - | - |
| N2 | 1 | 3 | 4 |
| Nx | 1 | 38 | 39 |
| Metastases | |||
| M0 | 8 | 61 | 69 |
| M1 | 4 | 11 | 15 |
| Follow-up (mean month) | 27.4 | 25.1 | 26.0 |
| Survival | |||
| Deceased | 4 | 18 | 22 |
| Alive | 8 | 54 | 62 |
RNA extraction
Matched malignant and non-malignant specimens from the same kidney were collected in RNAlater Stabilization Reagent (Qiagen, Hilden, Germany). Total RNA including microRNAs was isolated using the miRNeasy Mini Kit (Qiagen). RNA yield and quality were determined with a NanoDrop 1000 Spectrophotometer (NanoDrop Technologies, Montchanin, DE) and a 2100 Bioanalyzer (Agilent Technologies, Santa Clara, CA).
MicroRNA microarray experiments
Microarray experiments were carried out as one-colour hybridizations on human catalog 8-plex 15 K microRNA microarrays (AMADID 016436) from Agilent encoding probes for 470 human and 64 human viral microRNAs from the Sanger database v9.1. Analyses were done initially with 12 matched malignant and non-malignant sample pairs of set 1 (Table 1). All reaction steps were carried out after the miRNA Microarray System Protocol Version 1.0, April 2007 (Agilent). An amount of 100 ng total RNA was dephosphorylated with Calf Intestine Alkaline Phosphatase (GE Healthcare, Chalfont St. Giles, Buckinghamshire, UK), denaturated with DMSO and used as RNA acceptor in a T4 RNA ligase–mediated reaction with the RNA donor 3′,5′-cytidine bisphosphate having a single Cy3 label attached to the 3′ phosphate of the nucleotide (Cy3-pCp). The labelling reaction was performed at 16°C for 2 hrs, then column purified, dried down and re-suspended in blocking and hybridization buffer. Labelled samples were prepared after the Agilent Microarray Chamber Kit instruction hybridized at 55°C for 20 hrs and microarrays were washed, scanned and processed according to the supplier’s protocol. After scanning at 5-μm resolution with DNA microarray laser scanner (Agilent), features were extracted with an image analysis tool version A.9.5.3 using default protocols and settings (Agilent). Data analysis was carried out on the Rosetta Resolver System Version 7.0. Intensity experiments were created with the Intensity Experiment Manager from Resolver by combining all hybridizations derived from malignant and non-malignant samples, respectively. ‘In silico’ ratio profiles and ratio experiments were generated by the Ratio Experiment Wizard after selection of either malignant and non-malignant samples derived from individual patients or by combining malignant and non-malignant intensity experiments.
Microarray data discussed in this publication have been deposited in NCBI Gene Expression Omnibus (GEO, http://www.ncbi.nlm.nih.gov/geo/) and are accessible through GEO Series accession number GSE12105.
MicroRNA real-time quantitative RT-PCR analysis
A two-step RT-PCR was performed using TaqMan MicroRNA Assays (Applied Biosystems, Foster City, CA) that detect only mature microRNAs. Reverse transcription was performed in 15 μl using 10 ng of total RNA, 0.25 mM of each dNTP, 50 U AB Multiscribe Reverse Transcriptase, 25 nM microRNA RT-primer, 3.75 U AB RNase Inhibitor and 1× RT-buffer. The PCR reaction volume of 10 μl included 1 μl microRNA-specific cDNA, 1× TaqMan Universal PCR Master Mix NoAmpErase UNG and gene-specific 1× TaqMan MicroRNA real-time PCR-Assay solution. The PCR was performed according to the suppliers instructions on an AB 7900HT instrument with SDS Software version 2.1.1 (Applied Biosystems) in 384-well plates for sample set 1 and on a LightCycler 480 with Software version 1.3.0 (Roche Applied Science, Mannheim, Germany) in 96-well plates for sample set 2. All PCR reactions were carried out in triplicates. Each PCR run included a no template control with water instead of cDNA. To minimize the analytical variation, paired malignant and non-malignant samples were always analysed on one PCR plate. Expression values were calculated using a relative standard curve. Standard curves of diluted microRNA-specific cDNAs as well as of snRNA RNU6B from pooled kidney tissues were generated and the PCR efficiencies calculated. The undiluted sample was set 100. The resulting standard curve was given in arbitrary units. In each PCR run, diluted secondary standards were used for calibration in the generated gene-specific standard curves. The analytical reliability of PCR methods was characterized by the efficiency of amplification between 1.96 and 2.03 and the precision of repeated measurements tested with snRNU6B and miR-16 (_n_= 10) of 0.43% and 0.75% at threshold cycles (Ct values) of 29.76 ± 0.13 and of 23.08 ± 0.17, respectively.
All microRNAs were normalized to the expression of the endogenous reference gene snRNA RNU6B, which was stably expressed in non-malignant and malignant samples. The ratio of target microRNA expression to RNU6B expression was calculated for each individual sample, and the multiples of the ratios in malignant tissue samples compared with non-malignant matched samples were tested for significance.
Prediction of microRNA targets
Prediction of putative target genes was performed using the three programs: TargetScan 4.2 (http://www.targetscan.org), miRanda (http://microrna.sanger.ac.uk) and PictTar (http://pictar.mdc-berlin.de).
Statistical analysis
For validation of microarray results, a two-sample Student’s t-test was applied on all intensity profiles, although a one-sample t-test was applied to the ratio experiments comprising individual patients. Principal component analysis (PCA) was used for data reduction on either experiment or reporter level. Cluster analysis was done on features or reporter levels with the 2D Matrix Wizard from Resolver with an agglomerative algorithm using average link as heuristic criteria and Manhattan distance as metric similarity measure on both intensity profiles and ratio experiments. All analysis criteria were combined making the microarray results extremely robust and highly reproducible.
For validation of RT-PCR results, statistical analyses were performed with software packages SPSS version 15.0 (SPSS Software, Munich, Germany) and GraphPad Prism for Windows, version 5.01 (GraphPad Software, San Diego, CA). Depending on the distribution of data (D’Agustino-Pearson omnibus normality test), statistical comparisons were done with parametric (paired or un-paired Student’s t-test) or non-parametric tests (Wilcoxon test for paired samples; Mann–Whitney test). Correlations were characterized by the Spearman’s correlation coefficient _r_s. P < 0.05 values (two-sided) were considered as statistically significant. Receiver operation characteristics (ROC) analysis was used to characterize the capacity of a single microRNA or a combination to discriminate between malignant and non-malignant tissue samples. Cox regression analysis was performed to assess the validity of microRNAs as prognostic markers of survival of RCC patients.
Sample size determinations and power calculations were performed using the softwares GraphPad Statmate for Windows, version 2.0 (GraphPad Software) and MedCalc, version 10.0.2 (Mariakerke, Belgium) on the basis of a two-sided alpha error of 5% and a power of 80% (Supplemental Text S1).
Results
Characteristics of RNA samples
The mean A260/A280 ratio of all 84 RNA samples amounted to 1.99 ± 0.04 (arithmetic mean ± S.D.), and the RNA integrity values obtained by Bioanalyzer 2100 measurements were 8.2 ± 0.85 (range: 6.0–9.2).
MicroRNA microarray expression data
Analyses were done initially with 12 matched malignant and non-malignant sample pairs of set 1 (Table 1). The stepwise statistical analyses of microarray intensity data are described and shown in the Supplemental Figure S1 as well as in Figs. 1 and 2. At first all single 24 intensity profiles were analysed, then the 12 intensity ratios of malignant to non-malignant samples and the presence–absence of sample signal intensities. As a result of these calculations and by application of a Venn diagram, 134 signal features were detected as differently expressed microRNAs and were used for further analysis.
Figure 1.
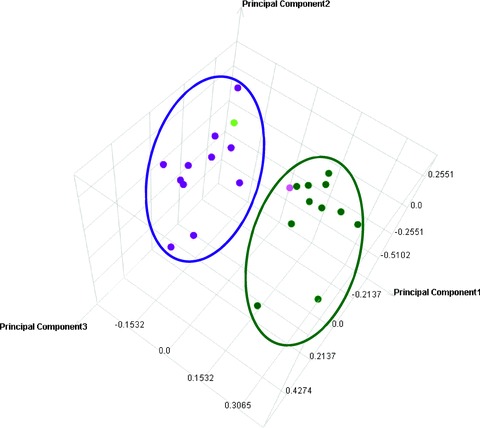
Principal Component Analysis (PCA) for distinct separation of malignant and non-malignant sample groups. Intensity profiles of 12 different ccRCC tissue samples and matched non-malignant samples were reduced to lower dimension by PCA, a mathematical procedure that transforms a number of variables in expression data into a number of uncorrelated variables called principal components. PCA was used to identify uncorrelated variables and differences between sample groups and identified those components that explain the maximum amount of variance possible in the linearly transformed components between the sample groups. The dot plot illustrates the dimensionality reduction in intensity profiles by retaining those characteristics of the data set that contribute most to its variance, by keeping lower-order principal components and ignoring higher-order ones. Thereby two distinct and separated groups of samples were identified, namely, ccRCC tissue samples in green (on right) and non-malignant samples in pink (on left). All samples were grouped accordingly, except one non-malignant tissue sample (light pink dot on right) and one malignant tissue sample (light green dot on left).
Figure 2.
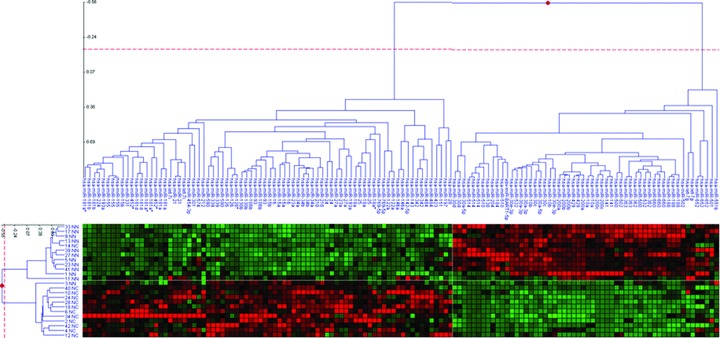
Two-dimensional cluster analysis across intensity profiles (on left) and microRNA reporters (on top). The Matrix Viewer displays hierarchical trees (on top and left) and a heat map (bottom). In the heat map, the log(ratio) data threshold was set at −2 to +2, and items are depicted by colour saturation with green squares encode for down-regulation and red items encode for up-regulated microRNAs. The dendrogram on the left comprises 12 different ccRCC tissue samples and matched non-malignant samples. The dendrogram on top depicts microarray probes that were identified with high significance. Note that depicted cluster results were generated on reporter level, as individual microRNAs were represented redundantly on the array with different sequences.
This group of 134 candidate reporters was used for PCA on intensity profile levels (Fig. 1) to compress the multi-dimensional data to lower dimensions. The PCA-plot visualizes that all tissue samples were classified into two distinct groups. Only two samples, a non-malignant and a malignant sample, showed an exception (Fig. 1).
Furthermore, a hierarchical 2D-cluster analysis was applied without any statistical cuts on all 24 intensity profiles and 134 reporters derived from the primary data-analysis steps. The _Z_-score was cropped to −2 to +2 in the heat map (Fig. 2). MicroRNA reporters are displayed as dendrogram on top, and intensity profiles are displayed as tree on the left of the heat map. The heat map depicts two clearly separated clusters. One group corresponds to up-regulated (red squares) reporters, and the other cluster matches to down-regulated (green squares) reporters in ccRCC samples, respectively. Note that the 134 reporters comprise only 76 different human microRNAs. Most samples (left side of the heat map) were grouped correctly into two well-separated ccRCC and non-malignant clusters. Only two misclassified samples were detected. Again, one non-malignant sample (named 3NN) was found in the ccRCC cluster, and one sample (named 14NC) was sorted into the non-malignant cluster. Hence, the cluster analysis was in complete concordance with the PCA analysis.
To render the analysis more robust and to reduce the high number of differentially identified results, reporters comprising individual microRNAs were combined into single values, and a cut-off at two-fold absolute change between ccRCC and matched non-malignant ratio experiments was applied. We identified 33 microRNAs that were regulated over two-fold change (Table 2). Among this result, 13 microRNAs were over-expressed, and 20 microRNAs were down-regulated in malignant ccRCC samples compared with the matched non-malignant samples.
Table 2.
MicroRNAs differentially expressed in malignant to matched non-malignant tissue samples of clear cell renal cell carcinoma (microarray results)
| MicroRNA | Fold changes† | P values | |
|---|---|---|---|
| Over-expressed | |||
| 1‡ | hsa-miR-122a | 41.4 | <0.0001 |
| 2‡ | hsa-miR-18a* | 6.8 | 0.0023 |
| 3‡ | hsa-miR-452* | 5.1 | 0.0001 |
| 4‡ | hsa-miR-224 | 4.4 | <0.0001 |
| 5‡ | hsa-miR-210 | 4.3 | 0.02479 |
| 6‡ | hsa-miR-34b | 3.5 | <0.0001 |
| 7‡ | hsa-miR-155 | 3.2 | 0.01047 |
| 8 | hsa-miR-34a | 2.9 | <0.0001 |
| 9 | hsa-miR-130b | 2.8 | <0.0001 |
| 10 | hsa-miR-21 | 2.5 | 0.0009 |
| 11 | hsa-miR-142–5p | 2.2 | 0.0171 |
| 12 | hsa-miR-193a | 2.2 | <0.0001 |
| 13 | hsa-miR-18a | 2.0 | <0.0001 |
| Under-expressed | |||
| 1‡ | hsa-miR-184 | −12.1 | 0.0004 |
| 2‡ | hsa-miR-514 | −9.5 | 0.0366 |
| 3‡ | hsa-miR-200c | −8.8 | 0.0075 |
| 4‡ | hsa-miR-510 | −8.1 | 0.0012 |
| 5‡ | hsa-miR-141 | −7.3 | 0.0262 |
| 6‡ | hsa-miR-138 | −5.2 | 0.0078 |
| 7‡ | hsa-miR-429 | −3.4 | <0.0001 |
| 8‡ | hsa-miR-200b | −3.1 | <0.0001 |
| 9‡ | hsa-miR-363 | −3.0 | <0.0001 |
| 10 | hsa-miR-532 | −2.7 | <0.0001 |
| 11 | hsa-miR-660 | −2.7 | <0.0001 |
| 12 | hsa-miR-362 | −2.7 | <0.0001 |
| 13 | hsa-miR-200a | −2.6 | <0.0001 |
| 14 | hsa-miR-10a | −2.5 | <0.0001 |
| 15 | hsa-miR-502 | −2.3 | 0.0005 |
| 16 | hsa-miR-204 | −2.3 | 0.0065 |
| 17 | hsa-miR-30a-3p | −2.2 | <0.0001 |
| 18 | hsa-miR-500 | −2.1 | <0.0001 |
| 19 | hsa-miR-30c | −2.1 | <0.0001 |
| 20 | hsa-miR-30a-5p | −2.0 | <0.0001 |
MicroRNA RT-PCR expression analysis
Based on the microarray results, we examined the expression level of 16 (highlighted in grey) out of the 33 microRNAs with RT-PCR (Table 2). These microRNAs showed at least three-fold changed expression between malignant and the non-malignant samples by microarray analysis. For that purpose, two RNA pools from the same 12 matched RNA samples used for the microarray experiments were prepared mixing equal parts. In addition, we determined miR-16, RNU6B, RNU19 and Z30 as possible reference genes [25]. We excluded microRNAs from further quantifications if Ct values were >35 in one of the both pooled samples (microRNAs in italic letters in Table 2). Therefore, only 10 microRNAs (microRNAs in bold letters in Table 2) were quantified in the individual samples. The RNU19 as possible reference gene showed a Ct difference of 0.98 between both pools of the malignant and non-malignant samples and was also excluded from the following analyses. The Ct differences for miR-16, RNU6B and Z30 were <0.5 between the pool samples and were furthermore investigated by PCR.
Subsequently, two sample sets were analysed with RT-PCR: set 1 for validation of the microarray results and set 2 as an independent control (Table 1). In set 1, we used the same 12 sample pairs as used in the microarray analysis and carried out quantitative PCR of 11 microRNAs, RNU6B and Z30. The miR-16 expression was significantly higher expressed in malignant samples compared with matched non-malignant samples (mean ± S.D.: 21.84 ± 11.8 versus 12.45 ± 4.8; _P_= 0.016; Wilcoxon test) and was considered as regulated microRNA, thus inappropriate for proper normalization. From the two studied snRNAs RNU6B and Z30, the expression of RNU6B did not differ between the sample pairs (_P_= 0.315), whereas that of Z30 did (_P_= 0.049). Thus, RNU6B could be used as reference gene for normalization of microRNA data. The multiples of the ratios target microRNA to RNU6B of malignant samples to non-malignant sample pairs were calculated (Fig. 3, left blank columns = set 1). The PCR results were in accordance with the microarray results since the same microRNAs were up- or down-regulated.
Figure 3.
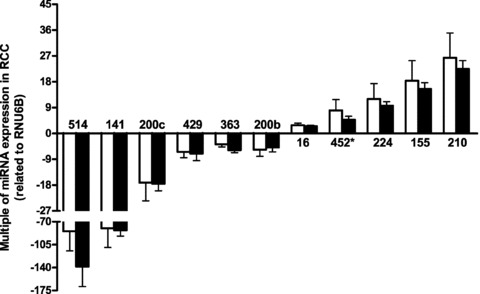
Multiples of microRNA expression ratios in clear cell renal cell carcinoma tissue samples compared with matched non-malignant samples measured in two sample sets. The gene expressions were normalized to RNU6B expression. Data are given as means ± S.E.M. The left blank columns represent the multiples of microRNA expressions in RCC samples of set 1 and the right-filled columns represent the multiples of microRNA expressions in RCC samples of set 2. No significant differences were observed between all microRNAs of set 1 and set 2 (_P_= 0.230–0.977; Mann–Whitney test), but all microRNAs were significantly different between malignant and non-malignant samples (P < 0.0001; Wilcoxon test).
To improve the accuracy and reliability of the study according to a sample size and power calculation (Supplemental Text S1), we included 72 additional sample pairs as set 2 (Table 1). The six strongest up- and down-regulated microRNAs of the mentioned microRNA panel (miR-210, −155, 224 and miR-514, −141, 200c) were quantified in all samples by PCR, the others were measured in 12 random kidney sample pairs of this set 2 (Table 1; Fig. 3). Multiples of the relative microRNA expression in the malignant to the non-malignant sample pairs were not significantly different between both study sets (_P_= 0.230–0.977; Mann–Whitney test) and were therefore combined for further calculations. All 11 microRNAs were differently expressed in malignant and non-malignant samples (P < 0.0001; Wilcoxon test). The down-regulation of miR-141 and miR-514 in tumour samples was more distinct as the strongest up-regulation of miR-210.
Correlation between microRNAs and clinico-pathological data
The microRNA expression ratios were correlated among each other (Supplemental Table S1). The statistically significant Spearman’s correlation coefficients ranged from _r_S=−0.186 (miR-155 to miR-200c; _P_= 0.041) to _r_S= 0.940 (miR-200b to miR-200c; P < 0.001).
No significant associations between all microRNAs and the pathological factors were found (G-groups: _P_= 0.176–0.869; pT-groups: _P_= 0.186–0.846; M-groups: _P_= 0.093–0.830; Mann–Whitney test).
ROC analyses were performed to characterize the ability of microRNAs to discriminate malignant and non-malignant samples (Table 3). The high areas under the ROC curves and the overall correct classification rates illustrate the high discriminatory power of the microRNAs. Particularly, the combination of miR-141 and miR-155 resulted in a 97% overall correct classification of samples (Table 3). However, none of the microRNAs was associated with the survival of the patients (_P_= 0.203–0.864; Cox regression and Kaplan–Meier analysis), whereas the classical risk factors as tumour stage, grade and size were verified in our study group (Supplemental Table S2).
Table 3.
Performance of microRNAs to discriminate between malignant and non-malignant tissue samples from renal cell carcinoma
| MicroRNA | AUC† | Percentage of samples correctly classified‡ |
|---|---|---|
| Single | ||
| hsa-miR-200c | 0.97 ± 0.014 | 94 |
| hsa-miR-141 | 0.97 ± 0.015 | 93 |
| hsa-miR-155 | 0.94 ± 0.020 | 85 |
| hsa-miR-210 | 0.94 ± 0.019 | 85 |
| hsa-miR-429 | 0.93 ± 0.038 | 85 |
| hsa-miR-224 | 0.92 ± 0.025 | 86 |
| hsa-miR-363 | 0.92 ± 0.043 | 83 |
| hsa-miR-514 | 0.90 ± 0.025 | 84 |
| hsa-miR-200b | 0.90 ± 0.047 | 75 |
| hsa-miR-452* | 0.83 ± 0.059 | 77 |
| hsa-miR-16 | 0.83 ± 0.028 | 73 |
| Combination§ | ||
| hsa-miR-141 + hsa-miR-155 | 0.98 ± 0.012 | 97 |
Putative miRNAs target genes
The putative targets of the dysregulated microRNAs provides a sound basis for further functional studies in ccRCC. For that purpose, various in silico methods for target gene prediction using different algorithms and ranking criteria have been developed [26]. To demonstrate an example, the corresponding targets of the strongest up- and down-regulated microRNAs were predicted using the computational programs TargetScan, PicTar and miRanda (Supplemental Table S3). Genes identified by at least two of the three programs were considered [27]. For the up-regulated miR-210 and miR-155, 10 and 163 putative targets were identified, whereas 291 and 411 targets were found for the down-regulated miR-141 and miR-200c, respectively. Out of these potential 875 targets in total, 157 were commonly recorded by all three algorithms.
Discussion
The limited number of known microRNAs makes their analysis comparatively convenient, and a wealth of studies have attempted to use microRNAs for diagnostic purposes to classify tumours [28, 29]. Although few cases of human clear cell renal cell carcinoma (ccRCC) have already been included in comparative microRNA studies, a larger series of renal tumours has not been profiled yet [17, 30]. Nakada _et al._[22] very recently published the microRNA profiles from 16 ccRCC and 4 chromophobe RCC samples in comparison with those from 6 normal renal tissue samples.
We used an array-based screening step analysing 12 matched pairs of histologically confirmed tumours with adjacent normal tissue. To further validate the most significantly dysregulated microRNAs, a complex three-step validation was conducted. The first step was establishing stem-loop primer RT-PCR protocols using pooled sample material for the 16 microRNAs with a two-fold change (tumour versus normal) in the array profiles. We found Ct values >35 for six microRNAs, which were therefore excluded from further analysis. The next step was to measure all 11 (including miR-16) differentially expressed microRNAs in those samples that had been subjected to array analysis. Generally, a good concordance of both techniques was seen. The third validation step was to confirm differential miRNA expression in an independent test cohort. Importantly, the analysis of the test set could fully reproduce the fold changes described in the training set, which clearly illustrates the high reproducibility of this microRNA profile.
These data demonstrate the power of microRNAs to differentiate between malignant and non-malignant tissue samples (Table 3). Several single microRNAs like miR-200c and miR-141 classified more than 90% of all samples correctly and the combination of the two microRNAs miR-141 and miR-155 identified 97%. To clarify, if this microRNA profile is specific to ccRCC, further analysis of other solid tumours is mandatory and underway. Other studies have demonstrated that microRNA profiles hold promise to classify tumours of uncertain histogenetical origin [31]. This is interesting, for conventional mRNA profiling techniques have yielded unsatisfactory results [32].
In a brief global assessment of our findings, we found more microRNAs down-regulated (_n_= 20) than up-regulated (_n_= 13) considering a fold change of two, which is in line with previous studies [19, 22]. Also, the fold changes for the down-regulated microRNAs were slightly higher than for up-regulated microRNAs, which was particularly valid for miR-514 and miR-141. Interestingly, Gottardo _et al._[17] analysed miR-profiles of 20 renal carcinomas and 3 non-matching normal renal tissues using an array platform that represented 245 microRNAs and found only 4 microRNAs significantly up-regulated in RCC (miR-28, miR-185, miR-7–2 and let-7f-2) with rather low mean fold changes (1.21–1.42), but no down-regulation of microRNAs. Also, there was no overlap with our data, which might be attributed to the different array platforms. A significantly better concordance was seen in comparison with the data of Nakada _et al._[22], who used the same array and RT-PCR platforms as in our study. Here, 5 out of 15 down-regulated microRNAs were also among our list of down-regulated microRNAs. An even higher overlap was seen in the list of up-regulated microRNAs (five out of six). Also, no correlation was seen of microRNA expression with nuclear tumour grade, which we can confirm with our larger series of cases.
We can also confirm the strong down-regulation of miR-141, which belongs to the miR-200 family. With the exception of miR-200a, all of these are down-regulated in ccRCC and correlated to each other, which hints at a co-regulation. Using the target prediction softwares TargetScan, miRanda and PicTar and considering the very stringent strategy of only common targets for the three algorithms, the genes chromodomain helicase DNA-binding protein 9 (CHD9), embryonic lethal, abnormal vision Drosophila-like 2 (ELAVL2), oligodendrocyte transcription factor 3 (OLIG3) and protocadherin-8 (PCDH8) were identified as putative targets of the miR-141 and miR-200c (Supplemental Table S3). The relationship between oncogenesis and ELAVL2 and PCDH2 was already proven in other tumours but not in ccRCC [33, 34]. So far, CHD9 and OLIG3 have not been related to tumourigenesis. Very recently, Gregory _et al._[32] linked down-regulation of the miR-200 family together with miR-205 functionally with epithelial mesenchymal transition (EMT). In cell models, down-regulation of miR-200a, miR-200b and miR-205 led to a loss of the epithelial appearance in favour of a mesenchymal phenotype, which could be reversed by forced expression of miR-200a, miR-200b or miR-205 pre-microRNAs. The strong down-regulation of these microRNAs in ccRCC might be indicative of a raised propensity of tumour cells to undergo EMT. This is not surprising because renal cell cancer is a highly malignant neoplasm that often shows de-differentiated areas with sarcomatoid features during tumour progression, which defines EMT. Because markers of EMT have generally been linked to more aggressive disease, they represent important candidates as novel prognostic markers.
Comparing our microRNA-profile of ccRCC with other solid tumours, we found an unexpected overlap with hepatocellular carcinoma: miR-18 and miR-224 are up-regulated in both tumour entities, whereas miR-200a is down-regulated. A mismatch is represented by miR-122, which is highly up-regulated in ccRCC but reported lost in hepatocellular cancer [8, 35].
Among the list of differentially expressed microRNAs in ccRCC we also identified miR-21, a microRNA that has been implicated in blocking apoptosis in glioblastoma cells [36]. MiR-21 is also over-expressed in breast cancer and promotes cell proliferation [37]. Inhibition of apoptosis is a hallmark of cancer [38], and likewise up-regulation of miR-21 appears to be a microRNA-hallmark of cancer because it has been found in breast, colon, endocrine neoplasms of the pancreas, lung, prostate and gastric cancer [5, 39].
Another microRNA from our profile commonly found up-regulated in human tumours is miR-155. Coded by the gene BIC, which cooperates with c-myc to induce lymphomagenesis in a chicken model of lymphoma, miR-155 was the first microRNA that was ascribed oncogenic properties [40]. Recent studies found miR-155 highly up-regulated in lymphomas [41, 42] and various solid tumours [4, 7, 43, 44]. A prognostic value of miR-155 has been reported for non-small cell lung cancer [4]. However, having profiled the six most differentially expressed microRNAs in a cohort of 84 clinically well-characterized RCC cases without demonstrating any prognostic value of any microRNAs attenuates our optimism to find novel prognostic markers using microRNAs.
The microRNA we found strongest up-regulated in ccRCC by RT-PCR is miR-210. This finding is not completely unexpected because the expression of miR-210 is strongly responsive to the hypoxia-inducible factor-1alpha (HIF-1alpha) [45]. Moreover, a majority of hereditary and sporadic clear cell carcinoma of the kidney is caused by an inactivation of the Von Hippel-Lindau (VHL) tumour suppressor gene [46] that leads to an accumulation of HIF-1alpha with subsequent activation of HIF target genes, including miR-210 [45]. The VHL dependency of miR-210 induction has been confirmed in cell line models of ccRCC [47]. Functionally, miR-210 over-expression inhibits apoptosis in cancer cell lines [45]. Recently, Ephrin-A3 has been shown a direct target of miR-210 affecting the migration, survival, apoptosis of cells and possibly modulating the angiogenic response to hypoxia [48]. Because we have no data concerning the VHL mutation status of our tumour cohort, we can only assume that the strong miR-210 up-regulation we observed is caused by VHL inactivation that is nearly endogenous to ccRCC. However, we could not show a prognostic value of miR-210 as demonstrated for breast cancer [47].
We also identified specific microRNAs with a highly reproducible dysregulation in ccRCC that have not been described before and which could prove useful to differentiate solid tumours and their metastases.
The prediction of the putative targets of the differentially expressed microRNAs exemplified by the approach with the strongest up- and down-regulated microRNAs (Supplemental Table S3) showed that a single microRNA can affect hundreds of genes. Thus, it is obvious that our profiling study as a first systematic investigation on microRNAs in ccRCC can only be considered as a basic, but essential step towards identifying the putative functional role of microRNAs in this tumour entity. The newly introduced method of microRNA induction or knockdown on a proteome-wide scale could essentially support this aim [49].
Some limitations of this study should be mentioned and discussed. First, one critical point in each study is the number of samples. A sound survival analysis to assess the prognostic value of a marker generally requires a sample size and power calculated tumour cohort. The number of samples examined in this study based on a corresponding calculation (Supplemental Text S1) were appropriate to identify prognostic risk factors in RCC patients as shown by the survival data depending on the typical tumour characteristics like tumour stage and grade. Thus, the critical point of a limited number of samples is rather unwarranted. In addition, the similar expression results obtained in the stepwise validation procedure let us assume that the risk of type II error does not exist in this study. Moreover, the probability of a type I error could be excluded as far as possible because of the high significance level of differential expressions of microRNAs between malignant and non-malignant tissue samples (Fig. 3; P < 0.0001). Second, the current study is limited by the strictly conservative data-reduction approach that used only microRNAs differentially expressed for at least two-fold using the microarray analysis and three-fold using the PCR data of the pooled samples from set 1. This approach was deliberately pursued in order to discover very distinctly expressed microRNAs in ccRCC. Third, this study was limited to the ccRCC sub-type; the other histological sub-types should be profiled as well in further studies. Fourth, the issue of appropriate reference genes for the relative quantification of microRNA quantitative RT-PCR data is up to now an open question [50]. To normalize the microRNA RT-PCR data, we initially analysed the candidate housekeeping genes RNU6B, RNU19, Z30 and miR-16 that were also used by others [32, 50–53]. Only RNU6B was stably expressed in both normal and tumour compartments. RNU6B is a small nuclear RNA with 106 nucleotides in contrast to the microRNAs with about 22 nucleotides. However, it is obvious that its similar expression in both sample groups ensures a more accurate normalization than microRNAs like miR-16.
In conclusion, this comprehensive study of microRNA profiles in human ccRCC provides plenty of new and valuable data and information concerning the differential expression of microRNAs. The microRNAs identified in this study might open up new therapeutic options for ccRCC, which poorly responds to conventional chemotherapy. Targeting microRNAs directly with antisense nucleotides, for example, by using so-called antagomirs that represent chemically engineered anti-sense nucleotides, can silence endogenous microRNA expression [54]. This novel approach appears promising and clearly warrants intense study.
Acknowledgments
This research was supported in part by the Sonnenfeld-Stiftung (to M.J., K.J. and G.K) and the Urologic Research Foundation, Berlin (to K.J.). We greatly thank Silke Klotzek for her valuable assistance in PCR measurements.
Supporting Information
Fig. S1 First steps of microRNA microarray data analysis.
Table S1 Correlation matrix between the microRNAs
Table S2 Univariate Cox regression analysis of microRNAs and clinico-pathologic parameters in renal cell carcinoma patients in relation to cancer-specific death
Table S3 Prediction of potential target genes for the strongest up- and down-regulated microRNAs
Text S1 Sample size determinations and power calculations
Please note: Wiley-Blackwell are not responsible for the content or functionality of any supporting materials supplied by the authors. Any queries (other than missing material) should be directed to the corresponding author for the article.
Supporting info item
Supporting info item
Supporting info item
Supporting info item
Supporting info item
References
- 1.Waldman SA, Terzic A. MicroRNA signatures as diagnostic and therapeutic targets. Clin Chem. 2008;54:943–4. doi: 10.1373/clinchem.2008.105353. [DOI] [PubMed] [Google Scholar]
- 2.Fabbri M, Croce CM, Calin GA. MicroRNAs. Cancer J. 2008;14:1–6. doi: 10.1097/PPO.0b013e318164145e. [DOI] [PubMed] [Google Scholar]
- 3.Calin GA, Dumitru CD, Shimizu M, et al. Frequent deletions and down-regulation of micro- RNA genes miR15 and miR16 at 13q14 in chronic lymphocytic leukemia. Proc Natl Acad Sci USA. 2002;99:15524–9. doi: 10.1073/pnas.242606799. [DOI] [PMC free article] [PubMed] [Google Scholar]
- 4.Yanaihara N, Caplen N, Bowman E, et al. Unique microRNA molecular profiles in lung cancer diagnosis and prognosis. Cancer Cell. 2006;9:189–98. doi: 10.1016/j.ccr.2006.01.025. [DOI] [PubMed] [Google Scholar]
- 5.Roldo C, Missiaglia E, Hagan JP, et al. MicroRNA expression abnormalities in pancreatic endocrine and acinar tumors are associated with distinctive pathologic features and clinical behavior. J Clin Oncol. 2006;24:4677–84. doi: 10.1200/JCO.2005.05.5194. [DOI] [PubMed] [Google Scholar]
- 6.Cummins JM, He Y, Leary RJ, et al. The colorectal microRNAome. Proc Natl Acad Sci USA. 2006;103:3687–92. doi: 10.1073/pnas.0511155103. [DOI] [PMC free article] [PubMed] [Google Scholar]
- 7.Iorio MV, Ferracin M, Liu CG, et al. MicroRNA gene expression deregulation in human breast cancer. Cancer Res. 2005;65:7065–70. doi: 10.1158/0008-5472.CAN-05-1783. [DOI] [PubMed] [Google Scholar]
- 8.Murakami Y, Yasuda T, Saigo K, et al. Comprehensive analysis of microRNA expression patterns in hepatocellular carcinoma and non-tumorous tissues. Oncogene. 2006;25:2537–45. doi: 10.1038/sj.onc.1209283. [DOI] [PubMed] [Google Scholar]
- 9.Ozen M, Creighton CJ, Ozdemir M, et al. Widespread deregulation of microRNA expression in human prostate cancer. Oncogene. 2008;27:1788–93. doi: 10.1038/sj.onc.1210809. [DOI] [PubMed] [Google Scholar]
- 10.Molnar V, Tamasi V, Bakos B, et al. Changes in miRNA expression in solid tumors: an miRNA profiling in melanomas. Semin Cancer Biol. 2008;18:111–22. doi: 10.1016/j.semcancer.2008.01.001. [DOI] [PubMed] [Google Scholar]
- 11.Wu W, Sun M, Zou GM, et al. MicroRNA and cancer: Current status and prospective. Int J Cancer. 2007;120:953–60. doi: 10.1002/ijc.22454. [DOI] [PubMed] [Google Scholar]
- 12.Calin GA, Croce CM. MicroRNA signatures in human cancers. Nat Rev Cancer. 2006;6:857–66. doi: 10.1038/nrc1997. [DOI] [PubMed] [Google Scholar]
- 13.Waldman SA, Terzic A. Translating MicroRNA discovery into clinical biomarkers in cancer. JAMA. 2007;297:1923–5. doi: 10.1001/jama.297.17.1923. [DOI] [PubMed] [Google Scholar]
- 14.Schetter AJ, Leung SY, Sohn JJ, et al. MicroRNA expression profiles associated with prognosis and therapeutic outcome in colon adenocarcinoma. JAMA. 2008;299:425–36. doi: 10.1001/jama.299.4.425. [DOI] [PMC free article] [PubMed] [Google Scholar]
- 15.Schaefer A, Jung M, Kristiansen G, et al. MicroRNAs and cancer: current state and future perspectives in urologic oncology. Urol Oncol. 2008 doi: 10.1016/j.urolonc.2008.10.021. 2008; doi:Epub ahead of print, December 29, 10.1016/j.urolonc.2008.10.021. [DOI] [PubMed] [Google Scholar]
- 16.Jemal A, Siegel R, Ward E, et al. Cancer statistics, 2008. CA Cancer J Clin. 2008;58:71–96. doi: 10.3322/CA.2007.0010. [DOI] [PubMed] [Google Scholar]
- 17.Gottardo F, Liu CG, Ferracin M, et al. Micro-RNA profiling in kidney and bladder cancers. Urol Oncol. 2007;25:387–92. doi: 10.1016/j.urolonc.2007.01.019. [DOI] [PubMed] [Google Scholar]
- 18.Dutta KK, Zhong Y, Liu YT, et al. Association of microRNA-34a overexpression with proliferation is cell type-dependent. Cancer Sci. 2007;98:1845–52. doi: 10.1111/j.1349-7006.2007.00619.x. [DOI] [PubMed] [Google Scholar]
- 19.Lu J, Getz G, Miska EA, et al. MicroRNA expression profiles classify human cancers. Nature. 2005;435:834–8. doi: 10.1038/nature03702. [DOI] [PubMed] [Google Scholar]
- 20.Shingara J, Keiger K, Shelton J, et al. An optimized isolation and labeling platform for accurate microRNA expression profiling. RNA. 2005;11:1461–70. doi: 10.1261/rna.2610405. [DOI] [PMC free article] [PubMed] [Google Scholar]
- 21.Chen C, Guegler KJ. MicroRNA quantitation by TaqMan® real-time PCR. In: Clarke NJ, Sanseau P, editors. MicroRNAs: biology, function and expression. DNA Press; 2007. pp. 299–322. In:, editors.. Eaglerville:. [Google Scholar]
- 22.Nakada C, Matsuura K, Tsukamoto Y, et al. Genome-wide microRNA expression profiling in renal cell carcinoma: significant down-regulation of miR-141 and miR-200c. J Pathol. 2008;216:418–27. doi: 10.1002/path.2437. [DOI] [PubMed] [Google Scholar]
- 23.Sui W, Dai Y, Huang Y, et al. Microarray analysis of MicroRNA expression in acute rejection after renal transplantation. Transpl Immunol. 2008;19:81–5. doi: 10.1016/j.trim.2008.01.007. [DOI] [PubMed] [Google Scholar]
- 24.Lopez-Beltran A, Scarpelli M, Montironi R, et al. 2004 WHO classification of the renal tumors of the adults. Eur Urol. 2006;49:798–805. doi: 10.1016/j.eururo.2005.11.035. [DOI] [PubMed] [Google Scholar]
- 25.Wong L, Lee K, Russell I, et al. Application note 127AP11–01, Applied Biosystems Endogenous controls for real-time quantitation of miRNA using TaqMan® microRNA-assays.
- 26.Rajewsky N. microRNA target predictions in animals. Nat Genet. 2006;38:S8–13. doi: 10.1038/ng1798. [DOI] [PubMed] [Google Scholar]
- 27.Kuhn DE, Martin MM, Feldman DS, et al. Experimental validation of miRNA targets. Methods. 2008;44:47–54. doi: 10.1016/j.ymeth.2007.09.005. [DOI] [PMC free article] [PubMed] [Google Scholar]
- 28.Lowery AJ, Miller N, McNeill RE, et al. MicroRNAs as prognostic indicators and therapeutic targets: potential effect on breast cancer management. Clin Cancer Res. 2008;14:360–5. doi: 10.1158/1078-0432.CCR-07-0992. [DOI] [PubMed] [Google Scholar]
- 29.Sassen S, Miska EA, Caldas C. MicroRNA: implications for cancer. Virchows Arch. 2008;452:1–10. doi: 10.1007/s00428-007-0532-2. [DOI] [PMC free article] [PubMed] [Google Scholar]
- 30.Rosenfeld N, Aharonov R, Meiri E, et al. MicroRNAs accurately identify cancer tissue origin. Nat Biotechnol. 2008;26:462–9. doi: 10.1038/nbt1392. [DOI] [PubMed] [Google Scholar]
- 31.Ramaswamy S, Tamayo P, Rifkin R, et al. Multiclass cancer diagnosis using tumor gene expression signatures. Proc Natl Acad Sci USA. 2001;98:15149–54. doi: 10.1073/pnas.211566398. [DOI] [PMC free article] [PubMed] [Google Scholar]
- 32.Gregory PA, Bert AG, Paterson EL, et al. The miR-200 family and miR-205 regulate epithelial to mesenchymal transition by targeting ZEB1 and SIP1. Nat Cell Biol. 2008;10:593–601. doi: 10.1038/ncb1722. [DOI] [PubMed] [Google Scholar]
- 33.D’Alessandro V, Muscarella LA, Copetti M, et al. Molecular detection of neuron-specific ELAV-like-positive cells in the peripheral blood of patients with small-cell lung cancer. Cell Oncol. 2008;30:291–7. doi: 10.3233/CLO-2008-0424. [DOI] [PMC free article] [PubMed] [Google Scholar]
- 34.Yu JS, Koujak S, Nagase S, et al. PCDH8, the human homolog of PAPC, is a candidate tumor suppressor of breast cancer. Oncogene. 2008;27:4657–65. doi: 10.1038/onc.2008.101. [DOI] [PMC free article] [PubMed] [Google Scholar]
- 35.Kutay H, Bai S, Datta J, et al. Downregulation of miR-122 in the rodent and human hepatocellular carcinomas. J Cell Biochem. 2006;99:671–8. doi: 10.1002/jcb.20982. [DOI] [PMC free article] [PubMed] [Google Scholar]
- 36.Chan JA, Krichevsky AM, Kosik KS. MicroRNA-21 is an antiapoptotic factor in human glioblastoma cells. Cancer Res. 2005;65:6029–33. doi: 10.1158/0008-5472.CAN-05-0137. [DOI] [PubMed] [Google Scholar]
- 37.Zhu S, Si ML, Wu H, et al. MicroRNA-21 targets the tumor suppressor gene tropomyosin 1 (TPM1) J Biol Chem. 2007;282:14328–36. doi: 10.1074/jbc.M611393200. [DOI] [PubMed] [Google Scholar]
- 38.Hanahan D, Weinberg RA. The hallmarks of cancer. Cell. 2000;100:57–70. doi: 10.1016/s0092-8674(00)81683-9. [DOI] [PubMed] [Google Scholar]
- 39.Volinia S, Calin GA, Liu CG, et al. A microRNA expression signature of human solid tumors defines cancer gene targets. Proc Natl Acad Sci USA. 2006;103:2257–61. doi: 10.1073/pnas.0510565103. [DOI] [PMC free article] [PubMed] [Google Scholar]
- 40.Tam W, Hughes SH, Hayward WS, et al. Avian bic, a gene isolated from a common retroviral site in avian leukosis virus-induced lymphomas that encodes a noncoding RNA, cooperates with c-myc in lymphomagenesis and erythroleukemogenesis. J Virol. 2002;76:4275–86. doi: 10.1128/JVI.76.9.4275-4286.2002. [DOI] [PMC free article] [PubMed] [Google Scholar]
- 41.Eis PS, Tam W, Sun L, et al. Accumulation of miR-155 and BIC RNA in human B cell lymphomas. Proc Natl Acad Sci USA. 2005;102:3627–32. doi: 10.1073/pnas.0500613102. [DOI] [PMC free article] [PubMed] [Google Scholar]
- 42.Kluiver J, Poppema S, de Jong D, et al. BIC and miR-155 are highly expressed in Hodgkin, primary mediastinal and diffuse large B cell lymphomas. J Pathol. 2005;207:243–9. doi: 10.1002/path.1825. [DOI] [PubMed] [Google Scholar]
- 43.Gillis AJ, Stoop HJ, Hersmus R, et al. High-throughput microRNAome analysis in human germ cell tumours. J Pathol. 2007;213:319–28. doi: 10.1002/path.2230. [DOI] [PubMed] [Google Scholar]
- 44.Takamizawa J, Konishi H, Yanagisawa K, et al. Reduced expression of the let-7 microRNAs in human lung cancers in association with shortened postoperative survival. Cancer Res. 2004;64:3753–6. doi: 10.1158/0008-5472.CAN-04-0637. [DOI] [PubMed] [Google Scholar]
- 45.Kulshreshtha R, Ferracin M, Wojcik SE, et al. A microRNA signature of hypoxia. Mol Cell Biol. 2007;27:1859–67. doi: 10.1128/MCB.01395-06. [DOI] [PMC free article] [PubMed] [Google Scholar]
- 46.Kaelin WG., Jr Molecular basis of the VHL hereditary cancer syndrome. Nat Rev Cancer. 2002;2:673–82. doi: 10.1038/nrc885. [DOI] [PubMed] [Google Scholar]
- 47.Camps C, Buffa FM, Colella S, et al. hsa-miR-210 is induced by hypoxia and is an independent prognostic factor in breast cancer. Clin Cancer Res. 2008;14:1340–8. doi: 10.1158/1078-0432.CCR-07-1755. [DOI] [PubMed] [Google Scholar]
- 48.Fasanaro P, D’Alessandra Y, Di S, et al. MicroRNA-210 modulates endothelial cell response to hypoxia and inhibits the receptor tyrosine kinase ligand Ephrin-A3. J Biol Chem. 2008;283:15878–83. doi: 10.1074/jbc.M800731200. [DOI] [PMC free article] [PubMed] [Google Scholar]
- 49.Selbach M, Schwanhausser B, Thierfelder N, et al. Widespread changes in protein synthesis induced by microRNAs. Nature. 2008;455:58–63. doi: 10.1038/nature07228. [DOI] [PubMed] [Google Scholar]
- 50.Peltier HJ, Latham GJ. Normalization of microRNA expression levels in quantitative RT-PCR assays: identification of suitable reference RNA targets in normal and cancerous human solid tissues. RNA. 2008;14:844–52. doi: 10.1261/rna.939908. [DOI] [PMC free article] [PubMed] [Google Scholar]
- 51.Chen Y, Stallings RL. Differential patterns of microRNA expression in neuroblastoma are correlated with prognosis, differentiation, and apoptosis. Cancer Res. 2007;67:976–83. doi: 10.1158/0008-5472.CAN-06-3667. [DOI] [PubMed] [Google Scholar]
- 52.Mott JL, Kobayashi S, Bronk SF, et al. mir-29 regulates Mcl-1 protein expression and apoptosis. Oncogene. 2007;26:6133–40. doi: 10.1038/sj.onc.1210436. [DOI] [PMC free article] [PubMed] [Google Scholar]
- 53.Visone R, Russo L, Pallante P, et al. MicroRNAs (miR)-221 and miR-222, both overexpressed in human thyroid papillary carcinomas, regulate p27Kip1 protein levels and cell cycle. Endocr Relat Cancer. 2007;14:791–8. doi: 10.1677/ERC-07-0129. [DOI] [PubMed] [Google Scholar]
- 54.Krutzfeldt J, Rajewsky N, Braich R, et al. Silencing of microRNAs in vivo with ‘antagomirs’. Nature. 2005;438:685–9. doi: 10.1038/nature04303. [DOI] [PubMed] [Google Scholar]
Associated Data
This section collects any data citations, data availability statements, or supplementary materials included in this article.
Supplementary Materials
Supporting info item
Supporting info item
Supporting info item
Supporting info item
Supporting info item