GLP-1 stimulates insulin secretion by PKC-dependent TRPM4 and TRPM5 activation (original) (raw)
Abstract
Strategies aimed at mimicking or enhancing the action of the incretin hormone glucagon-like peptide 1 (GLP-1) therapeutically improve glucose-stimulated insulin secretion (GSIS); however, it is not clear whether GLP-1 directly drives insulin secretion in pancreatic islets. Here, we examined the mechanisms by which GLP-1 stimulates insulin secretion in mouse and human islets. We found that GLP-1 enhances GSIS at a half-maximal effective concentration of 0.4 pM. Moreover, we determined that GLP-1 activates PLC, which increases submembrane diacylglycerol and thereby activates PKC, resulting in membrane depolarization and increased action potential firing and subsequent stimulation of insulin secretion. The depolarizing effect of GLP-1 on electrical activity was mimicked by the PKC activator PMA, occurred without activation of PKA, and persisted in the presence of PKA inhibitors, the KATP channel blocker tolbutamide, and the L-type Ca2+ channel blocker isradipine; however, depolarization was abolished by lowering extracellular Na+. The PKC-dependent effect of GLP-1 on membrane potential and electrical activity was mediated by activation of Na+-permeable TRPM4 and TRPM5 channels by mobilization of intracellular Ca2+ from thapsigargin-sensitive Ca2+ stores. Concordantly, GLP-1 effects were negligible in Trpm4 or Trpm5 KO islets. These data provide important insight into the therapeutic action of GLP-1 and suggest that circulating levels of this hormone directly stimulate insulin secretion by β cells.
Introduction
Type 2 diabetes currently affects approximately 350 million individuals in the world (1). It is caused by insufficient insulin secretion, often in combination with impaired insulin action (2). The reduced insulin secretion has been attributed to impaired β cell function, β cell mass, or a combination of the two (2).
Therapies based on the incretin hormone glucagon-like peptide 1 (GLP-1) have been introduced during the last 10 years. They include long-lasting GLP-1 analogs and inhibitors of dipeptidyl peptidase 4 (DPP-4), the enzyme degrading the active form of GLP-1 [GLP-1(7-36) amide] to its less active metabolite [GLP-1(9-36) amide]. Their actions culminate in e glucose-dependent stimulation of insulin secretion from the pancreatic β cells (3, 4).
The plasma concentration of biologically active GLP-1 [GLP-1(7-36) amide] is in the picomolar range and does not increase beyond ~20 pM, even after a meal (5, 6). Moreover, administration of DPP-4 inhibitors increases the peripheral blood concentration of GLP-1 by only a few picomolars and yet results in marked stimulation of insulin secretion and a fall in plasma glucose levels (5, 6). Effects of physiological levels of GLP-1 in neurons (7), skeletal muscle cells (8), hepatocytes (9), and adipocytes (10, 11) have been reported. Nevertheless, most in vitro studies of the effects GLP-1 on pancreatic islet function use nanomolar (1–100 nM) concentrations of GLP-1 (12–15), i.e., levels >100- to 10,000-fold higher than those occurring physiologically. The use of such high concentrations is predicated on receptor-binding assays and measurements of intracellular cAMP accumulation, which suggest a half-maximal effective concentration (EC50) of approximately 5 nM (16–18). Because of the huge discrepancy between the plasma GLP-1(7-36) levels and those assumed required to stimulate insulin secretion in isolated pancreatic islets, it has been proposed that GLP-1 released from the intestinal L cells acts by activation of vago-vagal reflexes that culminate in neurally mediated stimulation of insulin secretion (19).
The GLP-1 receptor (GLP-1R) is coupled to the GTP-binding protein Gαs, which activates adenyl cyclase, and many of the effects of GLP-1 are mediated by an increase in the intracellular cAMP levels. However, coupling to the GTP-binding proteins Gαi/o and Gαq/11 has also been reported (20–23), but the downstream functional consequences remain largely unexplored.
Here, we have determined the concentration dependence of the stimulatory effect of GLP-1 on glucose-stimulated insulin secretion in intact mouse and human pancreatic islets. We demonstrate that GLP-1 stimulates insulin secretion with an EC50 of approximately 0.4 pM and that a concentration of 1 pM is at least as stimulatory as 10 nM. This effect involves activation of the GLP-1R and is PKC-dependent and mediated by membrane depolarization due to activation of Na+-permeable TRPM4 and TRPM5 channels, culminating in increased action potential firing rates and Ca2+-dependent stimulation of insulin exocytosis.
Results
Picomolar concentrations of GLP-1 stimulate insulin secretion, electrical activity, and [Ca2+]i oscillations.
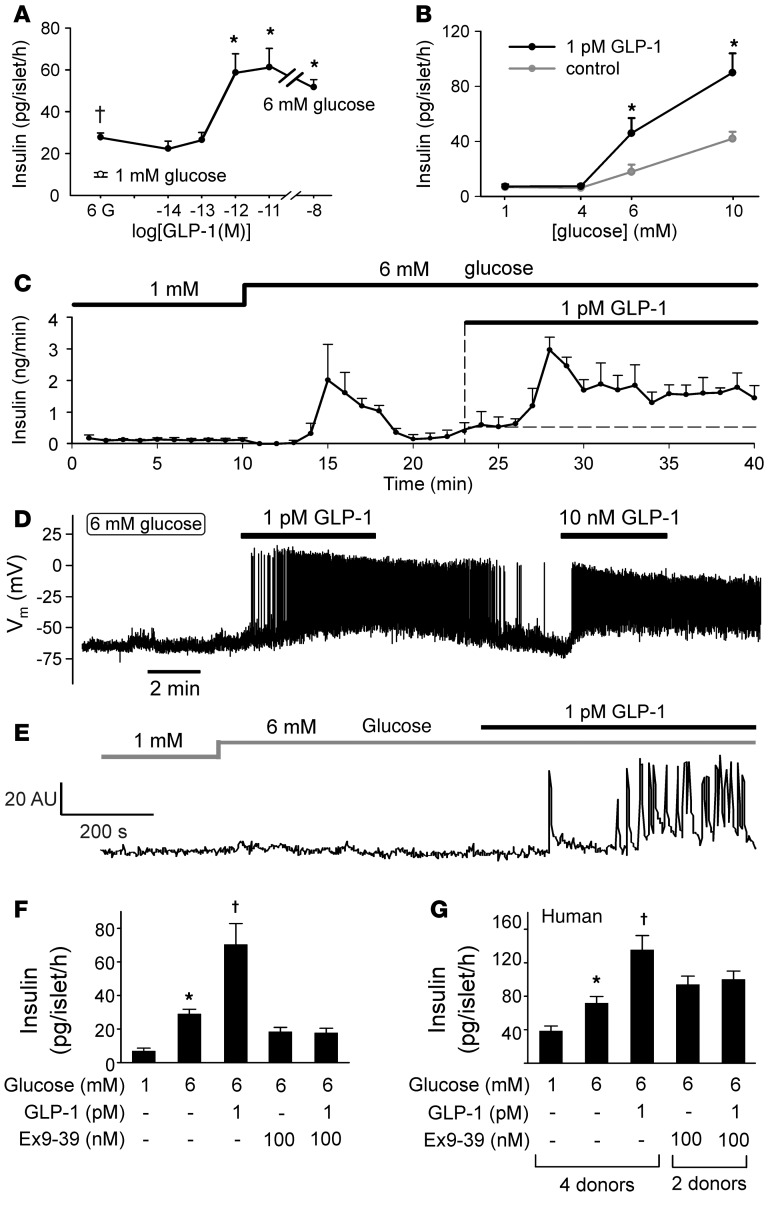
In mouse islets, GLP-1 potentiated glucose-induced insulin secretion in a dose-dependent manner at between 0.1 pM and 10 pM, with a calculated EC50 of approximately 0.4 pM (Figure 1A). Thus, the stimulatory effect of 1 pM GLP-1 was maximal and as strong as that observed at 10 nM, which (if anything) produced less stimulation than a 1,000- to 10,000-fold lower concentration.
Figure 1. Stimulatory effects of picomolar concentrations of GLP-1 on insulin secretion, electrical activity, and [Ca2+]i.
(A) Insulin secretion measured at 6 mM glucose (black circle) and increasing concentrations of GLP-1 (n = 4–8 experiments). The white circle shows insulin secretion measured at 1 mM glucose in the absence of GLP-1. †P<0.05 vs. 1 mM glucose, *P < 0.05 vs. 6 mM glucose (1-way ANOVA with Dunnett’s post-hoc test). (B) Insulin secretion at 1, 4, 6, and 10 mM glucose in the absence and presence of 1 pM GLP-1 (n = 9 experiments). *P < 0.01 vs. no GLP-1 (Student’s t test). (C) GLP-1 (1 pM) stimulated insulin secretion from perfused mouse pancreas (n = 4). (D) Membrane potential recording from a β cell exposed sequentially to 1 pM and 10 nM GLP-1 (representative of 24 of 25 cells). (E) Spontaneous [Ca2+]i oscillations in a β cell within an intact islet exposed to 1 pM GLP-1 (representative of 23 of 35 cells in 3 islets from 3 mice). (F) Insulin secretion in mouse islets at 6 mM glucose in the absence and presence of 1 pM GLP-1 and/or 100 nM exendin (9-39) (Ex9-39). *P < 0.05 vs. 1 mM glucose, †P < 0.05 vs. 6 mM glucose (n = 3–5; 1-way ANOVA with Dunnett’s post-hoc test). (G) As in F but using human islets (n = 8–12 with islets from 2–4 donors). *P < 0.05 vs. 1 mM glucose, †P < <0.05 vs. 6 mM glucose (n = 3–5; 1-way ANOVA with Dunnett’s post-hoc test).
We determined the glucose dependence of the stimulatory effect of 1 pM GLP-1 (Figure 1B). Whereas GLP-1 was without effect at 1 and 4 mM glucose, insulin secretion at 6 and 10 mM was strongly potentiated. Thus, the stimulatory effect of picomolar levels of GLP-1 is only observed at glucose concentrations that are themselves stimulatory.
We confirmed the stimulatory capacity physiological concentrations of GLP-1 using the perfused pancreas preparation, whereby GLP-1 is delivered by the vascular system (Figure 1C). Increasing glucose from 1 to 6 mM evoked a biphasic stimulation of insulin secretion and transiently increased it from a basal rate of 0.1 ng/min to a peak value of approximately 2 ng/min, after which the secretory rate fell to approximately 0.5 ng/min. Subsequent administration of 1 pM GLP-1 produced a marked biphasic stimulation of insulin secretion, in excess of that evoked by 6 mM glucose alone, to a new peak value of 3 ng/min, before declining to a new plateau of of approximately 1.5 ng/min.
Insulin secretion is secondary to β cell electrical activity. We therefore correlated the stimulation of insulin secretion by low and high concentrations of GLP-1 to the effects on electrical activity (Figure 1D). In single β cells exposed to 6 mM glucose alone, the membrane potential averaged –66 ± 7 mV (n = 36), but only a fraction of these cells (10%, 4 of 40 cells) generated spontaneous action potentials, and then only transiently upon addition of glucose, echoing the transient stimulation of insulin secretion. However, upon application of 1 pM GLP-1, action potential firing was initiated in almost every cell (24 of 25 cells). At steady state, the rate of action potential firing in β cells exposed to 6 mM glucose averaged 0.003 ± 0.003 Hz, which increased to 3.4 ± 0.3 Hz (n = 24) after addition of 1 pM GLP-1. The response to 1 pM GLP-1 was at least as strong as that evoked by a 10,000-fold higher concentration of the incretin hormone (Figure 1D).
The effects of GLP-1 on electrical activity correlated with the induction of [Ca2+]i oscillations in a subset of cells within intact mouse pancreatic islets (Figure 1E). At 6 mM glucose alone, spontaneous [Ca2+]i oscillations were seen in only approximately 5% of the cells (similar to the fraction of cells generating spontaneous action potentials). However, GLP-1 (consistent with data of Figure 1D and previous reports, see ref. 24) resulted in substantial recruitment of cells, and in the simultaneous presence of 1 pM GLP-1 and 6 mM glucose, 65% of cells showed [Ca2+]i oscillations. A similar increase in the fraction of cells exhibiting [Ca2+]i oscillations was observed when glucose was elevated from 6 to 20 mM (25).
We finally confirmed that the effects of 1 pM GLP-1 on glucose-induced insulin secretion can be blocked by the GLP-1R antagonist exendin (9-39). In this series of experiments, GLP-1 potentiated insulin secretion at 6 mM glucose 2.5-fold, an effect that was completely reversed by exendin (9-39) (Figure 1F). In addition, picomolar concentrations of GLP-1 stimulated insulin secretion in human islets, an effect that was likewise antagonized by exendin (9-39) (Figure 1G). These observations suggest that the effects of picomolar levels of GLP-1 in both mouse and human β cells are mediated by the previously characterized GLP-1R (17).
Picomolar concentrations of GLP-1 stimulate L-type Ca2+ channel activity and β cell exocytosis.
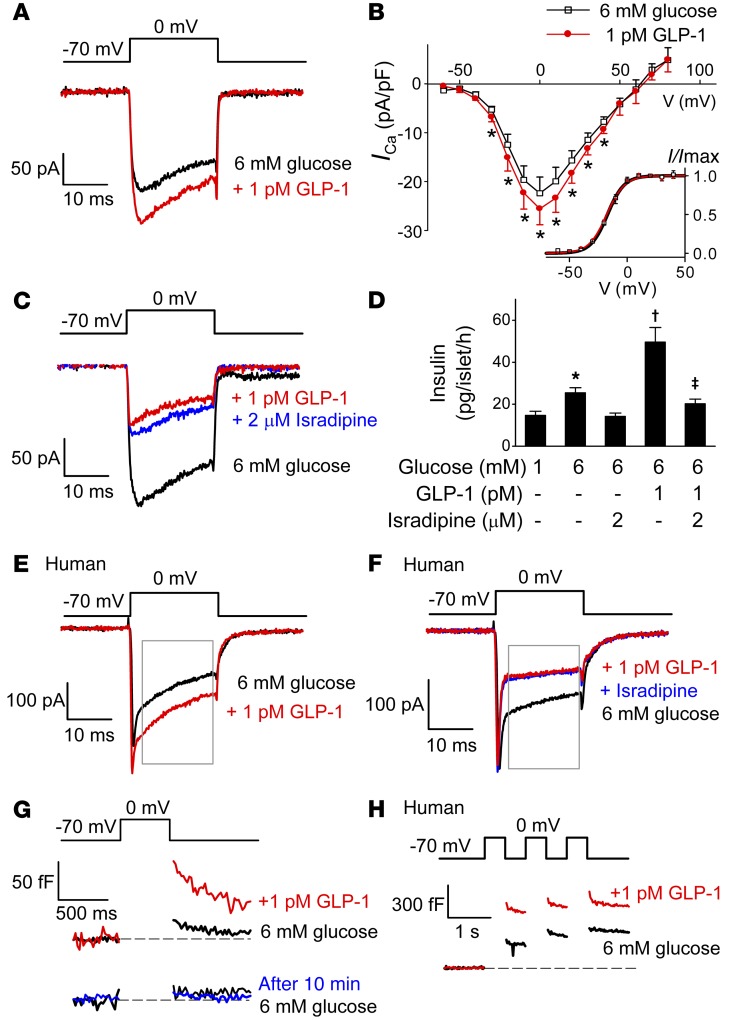
In single mouse β cells exposed to 6 mM glucose, addition of 1 pM GLP-1 increased the integrated Ca2+ current (_Q_Ca) evoked by a 20-ms voltage-clamp pulse from –70 mV to 0 mV by approximately 15%, from –2.6 ± 0.47 pC to –3.2 ± 0.59 pC (P < 0.01 by paired Student’s t test; Figure 2A). In previous experiments using 10 nM GLP-1, no effect on _Q_Ca was detected (26), a finding we confirmed (data not shown).
Figure 2. Stimulatory effects of low concentrations of GLP-1 depend on L-type Ca2+ channels.
(A) GLP-1 (1 pM) enhances mouse β cell Ca2+ currents (_I_Ca) evoked by 20-ms depolarization from –70 mV to 0 mV (n = 7 cells from 5 mice). (B) Current-voltage (I_-V) relationships of whole-cell Ca2+ currents in the absence (black) and presence (red) of GLP-1. Current amplitudes have been normalized to cell capacitance. Ca2+ current activation curves are shown in the inset in the absence and presence of GLP-1. *P < 0.05 vs. control by paired Student’s t test (n = 5 cells from 3 mice). (C) GLP-1 inhibits I_Ca when added in the presence of isradipine (added 5 minutes prior to the addition of GLP-1) (n = 5 cells from 3 mice). (D) Effects of GLP-1 on insulin secretion in mouse islets in the absence and presence of GLP-1 and/or isradipine. Isradipine was included during the 30-minute preincubation. *P < 0.05 vs. 1 mM glucose; †_P < 0.05 vs. 6 mM glucose; ‡_P < 0.01 vs. 6 mM glucose plus GLP-1 (n = 7–8; 1-way ANOVA with Dunnett’s post-hoc test). (E and F) As in A and C but using human β cells (n = 13 cells from 6 donors in E; n = 6 cells from 3 donors in F). Rectangles indicate the period used for measuring charge entry (_Q_Ca) to avoid contribution of voltage-gated Na+ current (initial spiky component). (G) Exocytosis measured as an increase in membrane capacitance evoked by 500-ms depolarizations from –70 mV to 0 mV under control conditions (6 mM glucose, black) and 10 minutes after addition of GLP-1 (red). A control experiment showing that when GLP-1 was not added, the exocytotic responses remained small and stable for 10 minutes (blue; n = 5), is also shown. (H) Exocytosis elicited by a train of three 500-ms depolarizations from –70 mV to 0 mV in a human β cell before (black) and 10 minutes after (red) the addition of GLP-1 (representative of 5 cells from 3 donors).
Figure 2B shows the peak Ca2+ current-voltage relationships recorded under control conditions and in the presence of 1 pM GLP-1. GLP-1 increased the peak Ca2+ currents during pulses to membrane potentials of between –20 mV and +20 mV by 10% to 15%. We examined whether the increased peak Ca2+ current amplitude was associated with a shift in the voltage dependence of the gating. However, no differences in the activation parameters were observed between control conditions, which, following addition of GLP-1 and _V_h (the membrane potential at which activation is half-maximal; see Methods and Equation 1), averaged –17 ± 1 mV and –17 ± 2 mV in the absence and presence of 1 pM GLP-1, respectively.
The increase in _Q_Ca produced by 1 pM GLP-1 reflects activation of L-type Ca2+ channels (Figure 2C). The L-type Ca2+ channel blocker isradipine reduced _Q_Ca from –2.6 ± 0.70 pC to –0.68 ± 0.09 pC (P < 0.01 by paired Student’s t test). When 1 pM GLP-1 was added in the presence of isradipine, it decreased _Q_Ca to –0.59 ± 0.09 pC (P < 0.05 vs. isradipine alone; paired Student’s t test). The significance of L-type Ca2+ channels was further explored by measurements of glucose- and GLP-1–induced insulin secretion (Figure 2D). GLP-1 (1 pM) potentiated insulin secretion at 6 mM glucose by 200%. This effect was almost completely abrogated (–85%) by isradipine.
In human β cells, GLP-1 increased the L-type Ca2+ current from –3.0 ± 0.6 pC to –3.4 ± 0.8 pC (P < 0.05, paired Student’s t test; Figure 2E). Application of isradipine inhibited _Q_Ca by 48% ± 9% (P < 0.05), and GLP-1 had no effect in the presence of the blocker (Figure 2F).
Insulin granule exocytosis evoked by 500-ms depolarizations from –70 mV to 0 mV increased approximately 5-fold in response to application of 1 pM GLP-1, from 7±4 fF under basal conditions to 36 ± 18 fF 10 minutes after addition of the hormone (P < 0.05, paired Student’s t test; Figure 2G). In separate control experiments, no spontaneous increase in exocytosis was detected over 10 minutes in the absence of GLP-1 (Figure 2G, bottom). In addition, GLP-1 (1 pM) enhanced depolarization-evoked exocytosis in human β cells; the responses to the first depolarization of a train averaged 95 ± 23 fF and 163 ± 36 fF (P < 0.05, paired Student’s t test; Figure 2H) in the absence and presence of 1 pM GLP-1, respectively.
Low concentrations of GLP-1 stimulate insulin secretion by a PKA-independent mechanism.
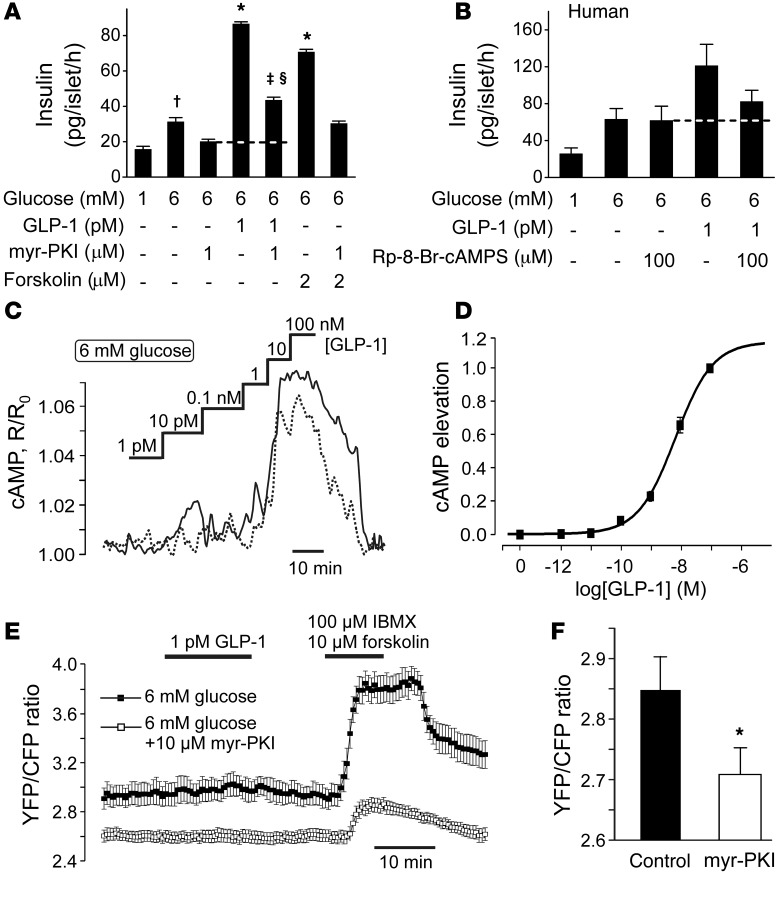
We have previously demonstrated that high (supraphysiological) concentrations of GLP-1 potentiate glucose-induced insulin secretion by a PKA-dependent mechanism (26). We confirmed that this is also the case for low (picomolar) GLP-1 concentrations (Figure 3A). In these experiments, GLP-1 (1 pM) enhanced glucose-induced insulin secretion by >175%. Inclusion of the membrane-permeable PKA inhibitor myristoylated protein kinase inhibitor (myr-PKI; 1 μM) reduced the stimulatory effect of GLP-1 by 60%. Importantly, 40% of the stimulatory effect of GLP-1 was resistant to myr-PKI. Similar effects were observed with PKA, which was inhibited with 8-bromoadenosine-3′, 5′-cyclic monophosphorothioate, Rp-isomer (Rp-8-Br-cAMPS) (data not shown). Like GLP-1, the adenylate cyclase activator forskolin potentiated glucose-induced insulin secretion. This effect was also reversed by myr-PKI, but the suppression was stronger than that for glucose and no myr-PKI–resistant component of secretion was observed. We conclude that the stimulatory effects of GLP-1 on insulin secretion are mediated by mechanisms that are partially PKA independent.
Figure 3. PKA-independent effects of GLP-1.
(A) Effects of glucose and 1 pM GLP-1 on insulin secretion in mouse islets in the absence and presence of the membrane-permeable PKA inhibitor myr-PKI (1 μM; introduced during 30-minute preincubation). †P < 0.05 vs. 1 mM glucose; *P < 0.01 vs. 6 mM glucose; ‡P < 0.01 vs. 6 mM glucose plus 1 pM GLP-1; §P < 0.01 vs. 6 mM glucose and 1 μM myr-PKI (n = 8 experiments; 1-way ANOVA with Dunnett’s post-hoc test). (B) As in A but using human islets (n = 6–7 from 3 donors, not the same as in Figure 1G) and using Rp-8-Br-cAMPS to inhibit PKA. (C) Changes in [cAMP]i concentration in response to increasing concentrations of GLP-1 (indicated above the traces) measured using recombinant cAMP sensor Epac2-camps in 2 representative cells (continuous and dotted lines). The CFP/YFP ratio R has been normalized to its initial value _R_0. (D) Relationship between GLP-1 concentration and elevation of [cAMP]i (n = 33 cells from 4 mice). The dose-response curve was fit to a Hill equation (Equation 2). (E) PKA activity measured in single cells from PKI-pretreated (n = 22, white squares) and control (n = 24, black squares) cells. GLP-1, 3-isobutyl-1-methylxanthine (IBMX) and forskolin were added as indicated. (F) Basal YFP/CFP ratio in control (n = 67) and PKI-pretreated (n = 65, 1 hour, 10 μM) islet cells. *P < 0.05 (Mann-Whitney nonpaired test).
An indication of a PKA-independent effect was observed in human islets when PKA was inhibited by Rp-8-Br-cAMPS (Figure 3B), but this effect did not attain statistical significance.
We measured the effect of increasing concentrations of GLP-1 on cytoplasmic cAMP levels ([cAMP]i) in pancreatic islet cells using the genetically encoded Förster resonance energy transfer (FRET) reporter Epac2-camps (27). GLP-1 at concentrations below 1 nM had no effect on [cAMP]i, whereas higher concentrations (≥1 nM) consistently increased [cAMP]i (Figure 3C), with an EC50 of 5.7 ± 0.9 nM (Figure 3D).
We monitored PKA activity using an AKAR3 FRET sensor (28). In agreement with the cAMP measurements, addition of GLP-1 (1 pM) did not result in any activation of PKA, regardless of whether the experiments were conducted in the absence or presence of myr-PKI, but the response to the combination of forskolin and 3-isobutyl-1-methylxanthine was reduced by approximately 70% in the presence of myr-PKI (Figure 3E). Basal PKA activity (measured as the initial YFP/CFP ratio) was reduced in cells treated with myr-PKI (Figure 3F).
Picomolar concentrations of GLP-1 activate PKC.
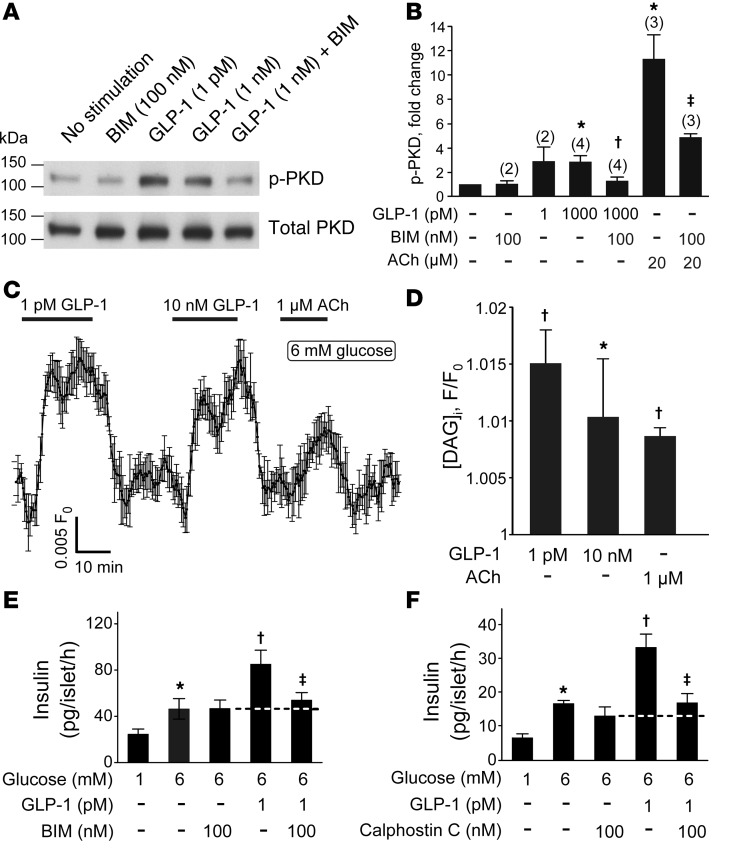
It has been reported that GLP-1, in addition to activating PKA, activates PKC (29). Direct measurement of PKC activity using in vitro substrates requires large quantities of cells and is not feasible for studies on pancreatic islet cells. However, once activated, PKC phosphorylates numerous endogenous substrates, some of which may be used as a downstream readout of its activity. PKC is known to phosphorylate and activate protein kinase D1 (PKD1) (30). We assessed the levels of activated endogenous PKD1 under basal conditions and in the presence of 1 pM or 1 nM GLP-1 with Western blotting, using antibodies specific for phosphorylated PKD1. Acetylcholine (ACh; 20 μM), an agonist known to cause PKC activation in β cells (31), was used as a positive control. As shown in Figure 4, A and B, stimulation of islets with 1 pM or 1 nM GLP-1 increased PKD1 phosphorylation by an average of 200%. GLP-1 had virtually identical effects in the absence and presence of the ATP-regulated K+ (KATP) channel activator diazoxide (100 μM), indicating that the activation of PKC by GLP-1 is not secondary to the stimulation of electrical activity (data not shown). In parallel measurements, ACh increased PKD1 phosphorylation by >1,000%. The effects of both GLP-1 and ACh were reversed by bisindolylmaleimide (BIM), consistent with the idea that activation of PKD1 is mediated by activation of PKC.
Figure 4. PKC-dependent effects of GLP-1.
(A) Representative blots of activated PKD1 and total PKD1 in mouse islets. p-PKD, phosphorylated PKD1. (B) Mean fold change in activated PKD1 relative to no stimulation control in response to GLP-1 in untreated or BIM-treated islets. The number of independent experiments (n) is indicated above the each bar. Mean ± SEM (where n > 2) or mean ± range (n = 2). *P = 0.01 vs. unstimulated; †P < 0.05 vs. 1 nM GLP-1 alone; ‡P < 0.05 vs. ACh alone (1-way ANOVA with Dunnett’s post-hoc test). (C) The effect of GLP-1 on [DAG]i measured in single cells from dispersed pancreatic islets. Characteristic responses to 1 pM and 10 nM GLP-1 as well as 1 μM ACh (added as indicated above the trace, n = 9). (D) Comparison of the effect of 1 and 10 pM GLP-1 on [DAG]i (n = 30 cells from 2 mice). All values are statistically higher than baseline (P < 0.05), apart from 10 nM GLP-1. *P < 0.05 vs. 1 pM GLP-1; †P < 0.05 vs. baseline (Friedman ANOVA with Dunn-Bonferroni post-hoc test). (E and F) Effects of 1 pM GLP-1 on insulin secretion in the absence and presence of the membrane-permeable PKC inhibitors (BIM, n = 9; calphostin C, n = 4) (100 nM; introduced during 30-minute preincubation). *P < 0.05 vs. 1 mM glucose, †P < 0.05 vs. 6 mM glucose, ‡P < 0.05 vs. 6 mM glucose plus 1 pM GLP-1 (1-way ANOVA with Dunnett’s post-hoc test).
We also measured the effect of GLP-1 on the submembrane levels of diacylglycerol ([DAG]i) in pancreatic islet cells using a genetically encoded probe, Upward DAG (32). Addition of GLP-1 at concentrations as low as 1 pM resulted in a rapid and reversible increase in [DAG]i levels (Figure 4C). Notably, application of a 10,000-fold higher concentration of GLP-1 did not result in a further increase in [DAG]i (Figure 4, C and D). In fact, the response to the high concentration of GLP-1 was, if anything, lower than that produced by 1 pM. ACh, when used at the low concentration of 1 μM, also evoked a small increase in [DAG]i. We conclude that 1 pM GLP-1 is a fairly strong activator of PLC, with a resultant increase in [DAG]i.
We confirmed the involvement of PKC in the stimulatory effect of GLP-1 on insulin secretion using the PKC inhibitors BIM and calphostin C (Figure 4, E and F). Both compounds abolished the stimulatory effect of GLP-1.
Human GLP-1R functionally activates a Gαq chimera.
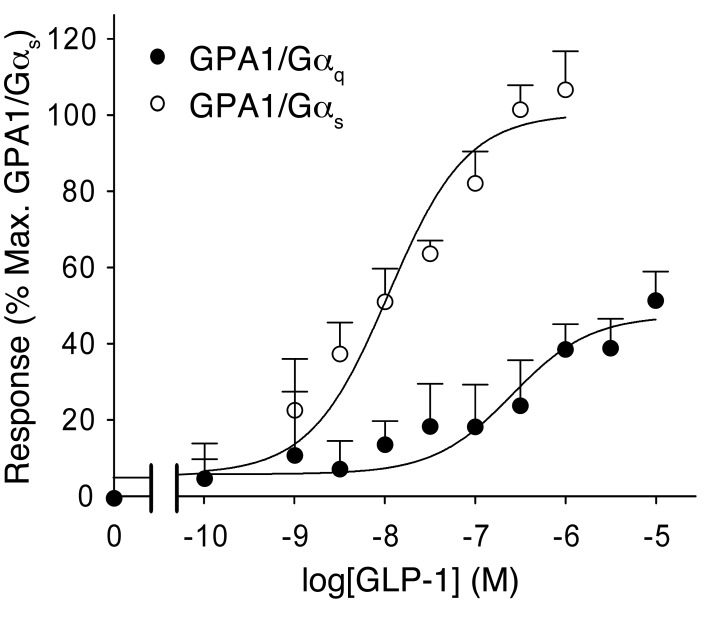
It is well established that the GLP-1R activates Gαs and thereby increases cAMP production. However, it has been suggested that GLP-1 can also bind to Gαi and Gαq (20–23), which are linked to activation of PLC, generation of DAG, and activation of PKC. We coexpressed the GLP-1R with mammalian Gαs and Gαq as previously described (33). Stimulation of the GLP-1R expressed in the Gαq-containing yeast strain resulted in a robust response (Figure 5).
Figure 5. Activation of Gαq by GLP-1.
Dose-response curves of GLP-1 in yeast strains expressing GPA1/Gαq and GPA1/Gαs chimaeras. Activation of the reporter gene was calculated as a percentage of the maximum response observed (n = 7–8 experiments).
cAMP/PKA-independent and PLC/PKC-dependent effects of GLP-1.
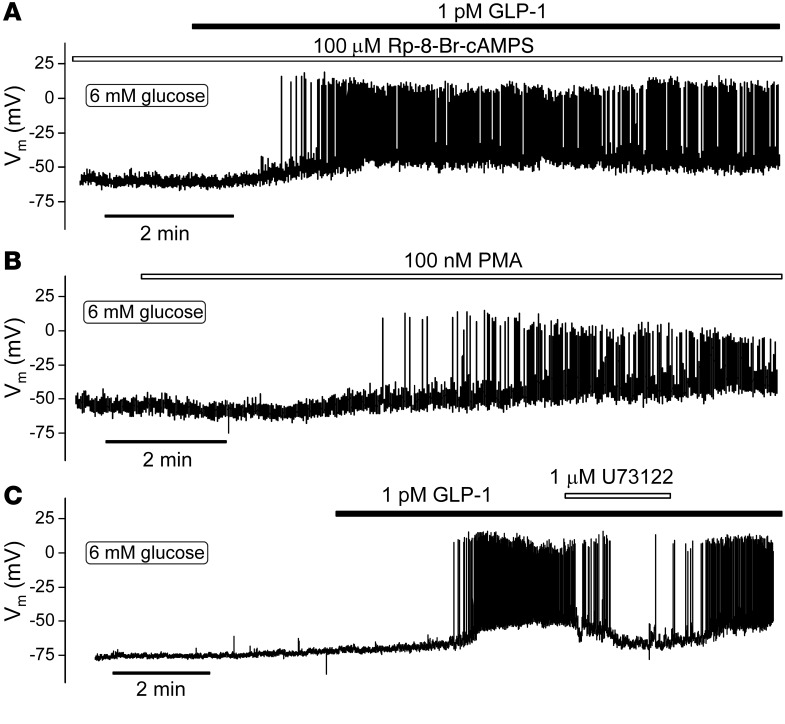
We tested the effects of low concentrations of GLP-1 on electrical activity in the presence of the PKA inhibitors Rp-8-Br-cAMPS and myr-PKI (Figure 6A). Unexpectedly, and unlike what has been previously reported for high concentrations of the hormone (26), 1 pM GLP-1 remained capable of initiating electrical activity under these experimental conditions. This effect appeared qualitatively similar to that observed under control conditions (cf. Figure 1D).
Figure 6. PKA-independent stimulation of β cell electrical activity.
(A) Representative membrane potential recording from a single β cell pretreated with 100 μM Rp-8-Br-cAMPS (n = 4 cells from 2 mice) or myr-PKI (n = 4 cells from 2 mice, not shown). Note initiation of electrical activity by GLP-1 in the presence of Rp-8-Br-cAMPS. (B) Effect of the PKC activator PMA on membrane potential (n = 5 cells from 4 mice). (C) Effect of the PLC inhibitor U73122 on action potential firing triggered by 1 pM GLP-1 (n = 8 cells from 6 mice). Note reversible inhibition. All measurements were performed using the perforated patch whole-cell technique in the presence of 6 mM glucose.
The stimulatory effect of low concentrations of GLP-1 was mimicked by the PKC activator PMA (Figure 6B). Like GLP-1, PMA depolarized the β cell and initiated action potential firing. In the presence of PMA, GLP-1 exerted no additive stimulatory effect (data not shown). Application of U73122, an inhibitor of PLC, reversibly antagonized the stimulatory effect of GLP-1 on β cell electrical activity (Figure 6C), in agreement with a previous report (29).
Collectively, the data in Figures 3 to 6 suggest that GLP-1 depolarizes the β cell and triggers action potential firing by a PKA-independent but PKC-dependent mechanism that involves activation of PLC by Gαq-coupled GLP-1Rs.
KATP channel–dependent and –independent effects of GLP-1.
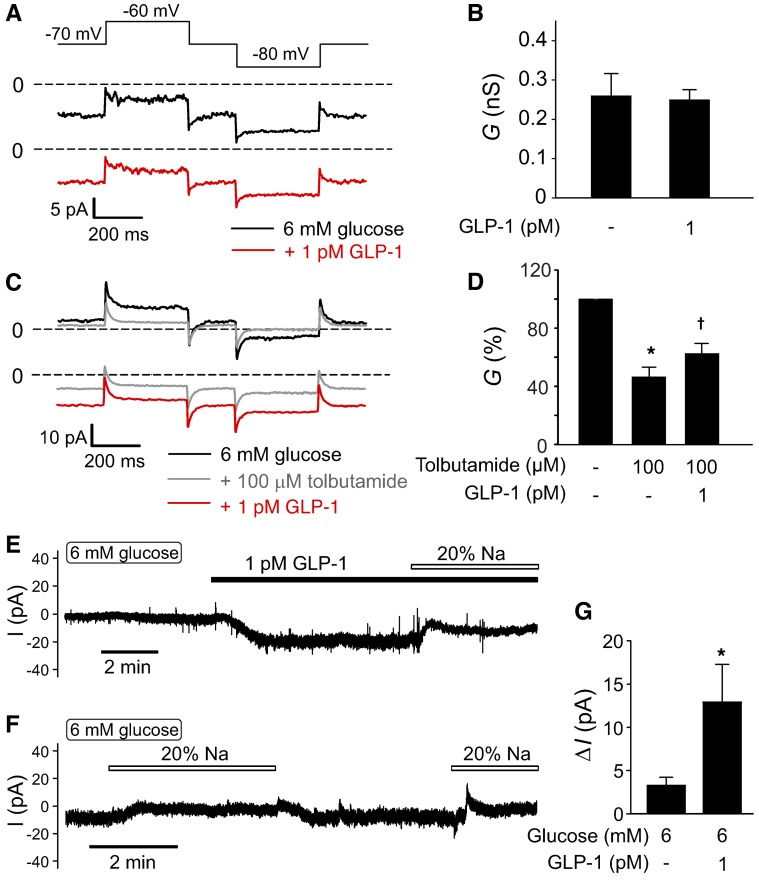
It has previously been reported that high concentrations of GLP-1 stimulate electrical activity and insulin secretion by inhibition of KATP channels (12–15). Application of 1 pM GLP-1 was without detectable inhibitory effect on whole-cell membrane conductance in the presence of 6 mM glucose (Figure 7, A and B). We confirmed that KATP channel activity, albeit at a low level, persisted in the presence of 6 mM glucose (Figure 7, C and D). Thus, addition of the KATP channel blocker tolbutamide reduced membrane conductance by 50%. Interestingly, addition of GLP-1 (1 pM) in the continued presence of tolbutamide increased the whole-cell membrane conductance.
Figure 7. Physiological concentrations of GLP-1 activate a depolarizing membrane current in β cells.
(A) Whole-cell resting currents activated by application of ±10 mV voltage pulses from a holding potential of –70 mV. Measurements were made at 6 mM glucose alone (black trace) and 10 minutes after addition of 1 pM GLP-1 (red trace). (B) Summary of effects of 1 pM GLP-1 on resting membrane conductance (G) calculated from the experiments in A. Note that GLP-1 is without a detectable inhibitory effect (n = 4 cells from 4 mice). (C) As in A but testing responses at 6 mM glucose alone (black trace) after addition of 100 μM tolbutamide (gray trace) and following addition of GLP-1 in the continued presence of glucose and tolbutamide (red trace). (D) Summary of effects of tolbutamide and GLP-1 on membrane conductance (G) calculated from the current excursions in response to voltage pulses (C) and expressed as a percentage of that at 6 mM glucose. *P < 0.05 vs. 6 mM glucose; †P < 0.05 vs. 6 glucose plus tolbutamide (n = 5 from 4 mice; 1-way ANOVA with Dunnett’s post-hoc test). (E) Membrane current at –70 mV recorded in the presence of 6 mM glucose before and after addition of 1 pM GLP-1 and effect of lowering [Na+]o from 140 mM to 28 mM (“20% Na+”). (F) As in E but showing effects of lowering [Na+]o in the presence of 6 mM glucose alone. (G) Histogram summarizing effects of lowering [Na+]o on the current at –70 mV (Δ_I_) in the presence of 6 mM glucose alone (n = 8 cells from 4 mice) or in the presence of 6 mM glucose and 1 pM GLP-1 (n = 6 cells from 4 mice). *P < 0.01 vs. normal [Na+]o (Student’s t test) All measurements in this figure were performed using the perforated patch whole-cell technique.
We characterized this KATP channel–independent conductance by whole-cell voltage-clamp measurements. In 6 β cells, application of GLP-1 evoked an inward current when holding at –70 mV that averaged –9 ± 2 pA (P < 0.001, paired Student’s t test; Figure 7E). Reduction of extracellular Na+ in the presence of GLP-1 abolished this current and reduced the holding current by 13 ± 4 pA (P < 0.01, paired Student’s t test). When extracellular Na+ was reduced in the presence of 6 mM glucose alone (i.e., without GLP-1), the reduction of the holding current was much smaller and amounted to only 3 ± 1 pA (Figure 7, F and G). Thus, we conclude that GLP-1 depolarizes the β cell by activation of Na+-permeable conductance that is activated to a much lower extent by glucose alone. The latter conclusion is in agreement with the reported weak effects of Na+ removal on glucose-induced electrical activity (34).
KATP channel–independent effect is mediated by activation of TRPM4 and TRPM5 channels.
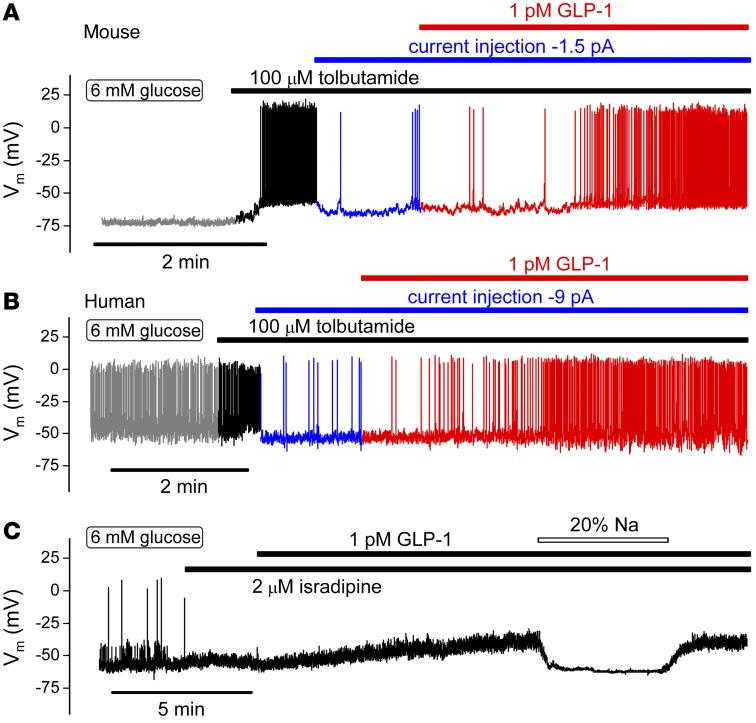
We used pharmacological ion channel blockers to establish the electrophysiological basis underlying the stimulatory effects of low concentrations of GLP-1 on β cell electrical activity. We first ascertained that GLP-1 remains capable of stimulating β cell electrical activity, even when KATP channel activity has been pharmacologically suppressed. Figure 8 shows membrane potential recordings from mouse and human β cells exposed to 6 mM glucose. Whereas mouse β cells are electrically silent at this glucose concentration, human β cells are electrically active and fire spontaneous action potentials at a high frequency. In both mouse and human β cells, addition of the KATP channel blocker tolbutamide resulted in membrane depolarization and stimulation of action potential firing. The cells were then hyperpolarized, and action potential firing was reduced by injection of negative current. In the hyperpolarized mouse β cells exposed to tolbutamide, addition of GLP-1 still resulted in a 60-fold increase in action potential firing, from 0.06 ± 0.03 Hz in the presence of glucose and tolbutamide alone to 3.6 ± 0.6 Hz in the presence of GLP-1 (P < 0.005, paired Student’s _t_ test). In similarly hyperpolarized human β cells, 1 pM GLP-1 increased action potential firing in the presence of tolbutamide >25-fold (Figure 8B), from a basal rate of 0.04 ± 0.02 Hz to 1.1 ± 0.74 Hz (P < 0.001, paired Student’s t test). These experiments suggest that GLP-1 depolarizes mouse and human β cells by a mechanism that is (at least partially) KATP channel independent.
Figure 8. GLP-1 stimulates electrical activity by activation of a Na+-dependent and KATP channel–independent mechanism.
(A and B) Membrane potential recording from (A) mouse (n = 6 cells from 2 mice) and (B) human (n = 4 cells from 3 donors) β cells. Tolbutamide and GLP-1 were added as indicated above traces. Electrical activity in the presence of glucose and tolbutamide was suppressed by injection of hyperpolarizing current (–1.5 pA in A and –9 pA in B as indicated) in the different experiments. For clarity, the recordings have been color coded (gray, 6 mM glucose; black, after addition of tolbutamide; blue, after injection of hyperpolarizing current; red, after application of GLP-1). (C) GLP-1 remains capable of depolarizing mouse β cells in the presence of the L-type Ca2+ channel blocker isradipine but does not evoke action potential firing (n = 6 from 3 mice). The depolarizing action of GLP-1 was reversibly suppressed by lowering [Na+]o to 28 mM (“20% Na”) (n = 3 from 2 mice).
In addition, we tested the effects of GLP-1 on electrical activity in mouse β cells in the presence of the L-type Ca2+ channel blocker isradipine. As shown in Figure 8C, isradipine inhibited action potential firing. GLP-1 application in the presence of isradipine remained capable of depolarizing the β cell but was without stimulatory effect on action potential firing, consistent with the important role played by L-type Ca2+ channels in β cell electrical activity (35) and secretion (Figure 2D). In the absence of regenerative electrical activity, the effect of GLP-1 on the β cell membrane potential could be accurately measured. Under these conditions, 1 pM GLP-1 depolarized the β cells by 11 ± 2 mV (P < 0.01, paired Student’s t test), an effect that was fully reversed upon lowering of extracellular Na+ concentration ([Na+]o) (20% of normal [Na+]o). Thus, the depolarizing effect of GLP-1 was not mediated by activation of L-type Ca2+ channels but rather a conductance permeable to Na+ (cf. Figure 7E).
Role of TRPM4 and TRPM5 channels in electrical activity and insulin secretion evoked by GLP-1.
Preliminary experiments suggested that the stimulatory effects of GLP-1 on electrical activity and insulin secretion were sensitive to 9-phenanthrol, an inhibitor of Ca2+-activated TRPM4 Na+-permeable ion channels (ref. 23 and Supplemental Figure 1, A and B; supplemental material available online with this article; doi:10.1172/JCI81975DS1). We explored this possibility further by comparing the effects of GLP-1 on insulin secretion in islets from wild-type and Trpm4–/– mice. We also tested the effects of ablating TRPM5 channels, which are expressed in pancreatic β cells and similarly regulated (23).
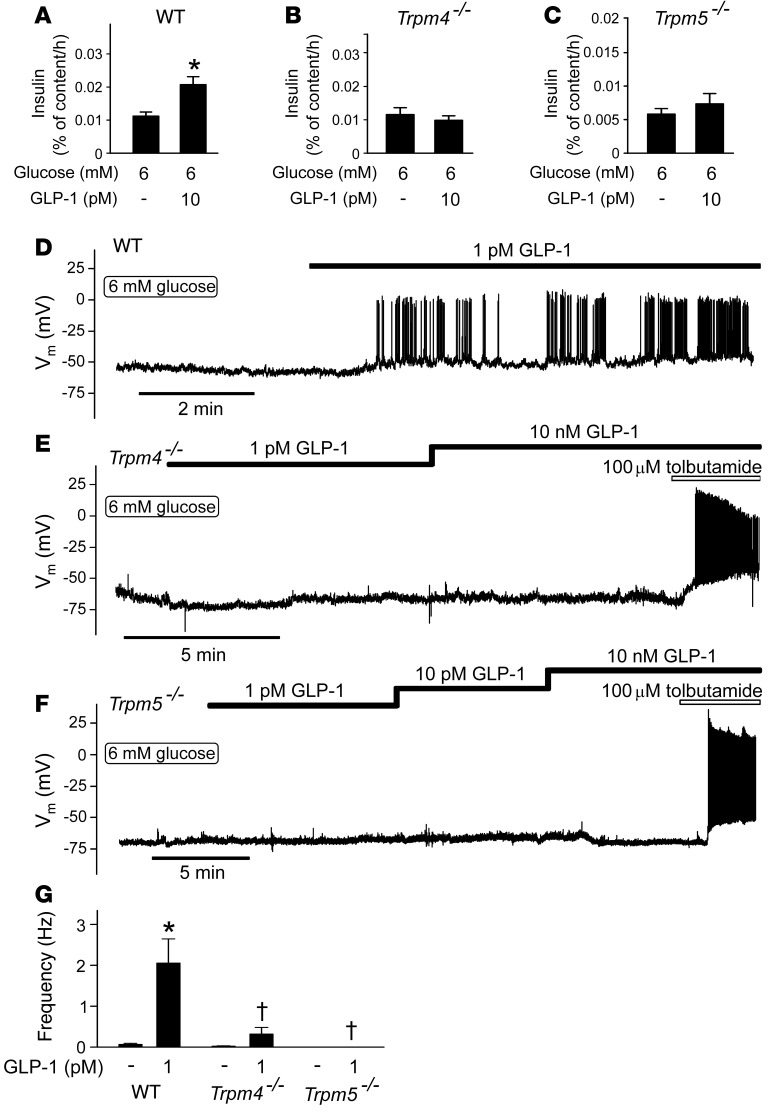
In wild-type islets, the stimulatory effect of 6 mM glucose was potentiated by approximately 85% in the presence of 10 pM GLP-1 (Figure 9A), an effect that did not occur in Trpm4–/– islets (Figure 9B) or Trpm5–/– islets (Figure 9C). By contrast, Trpm4–/– and Trpm5–/– islets remained as responsive as wild-type islets to glucose (Supplemental Figure 2, A–C). In wild-type islets, insulin secretion above basal (1 mM) was >15-fold higher at 20 mM glucose than at 6 mM. This observation is in good agreement with the finding that only 5% of the β cells are electrically active and generate Ca2+ oscillations at 6 mM glucose (Figure 1E). We conclude, in agreement with earlier reports (25, 36), that increasing glucose concentrations stimulate insulin secretion by recruitment of β cells.
Figure 9. GLP-1 acts by a TRPM4- and TRPM5-dependent mechanism.
(A–C) Effects of 10 pM GLP-1 on insulin secretion in islets from (A) wild-type, (B) Trpm4–/–, and (C) Trpm5–/– mice exposed to 6 mM glucose. *P < 0.05 vs. 6 mM glucose (n = 6 islets from 7–9 mice; 1-way ANOVA with Dunnett’s post-hoc test). (D–F) Effects of GLP-1 (1 pM to 10 nM) on electrical activity in (D) wild-type (n = 5 cells from 2 mice), (E) Trpm4–/– (n = 9 cells from 5 mice), and (F) Trpm5–/– (n = 7 cells from 5 mice) β cells isolated from C57BL6/N mice. (G) Histogram summarizing action potential frequency in β cells exposed to 6 mM glucose in the absence or presence of GLP-1 glucose in wild-type, Trpm4–/–, and Trpm5–/– β cells as in D–F. *P < 0.05 vs. 6 mM glucose (Student’s t test); †P < 0.05 vs. 6 mM glucose plus GLP-1 (wild-type; 1-way ANOVA with Dunnett’s post-hoc test).
We explored the functional significance of TRPM4 and TRPM5 channels further by membrane potential recordings. Trpm4–/– β cells retained some limited responsiveness to GLP-1 (Figure 9E), but the effect was weak compared with that in wild-type cells (Figure 9D). β Cells in Trpm5–/– islets were completely refractory to stimulation with GLP-1 (Figure 9F). The effects of GLP-1 on action potential firing in wild-type, Trpm4–/–, and Trpm5–/– β cells are summarized in Figure 9G. The strong suppression of insulin secretion evoked by GLP-1 in Trpm4–/– and Trpm5–/– islets is echoed by equally strong reductions in action potential firing.
GLP-1 increases [Ca2+]i in hyperpolarized β cells.
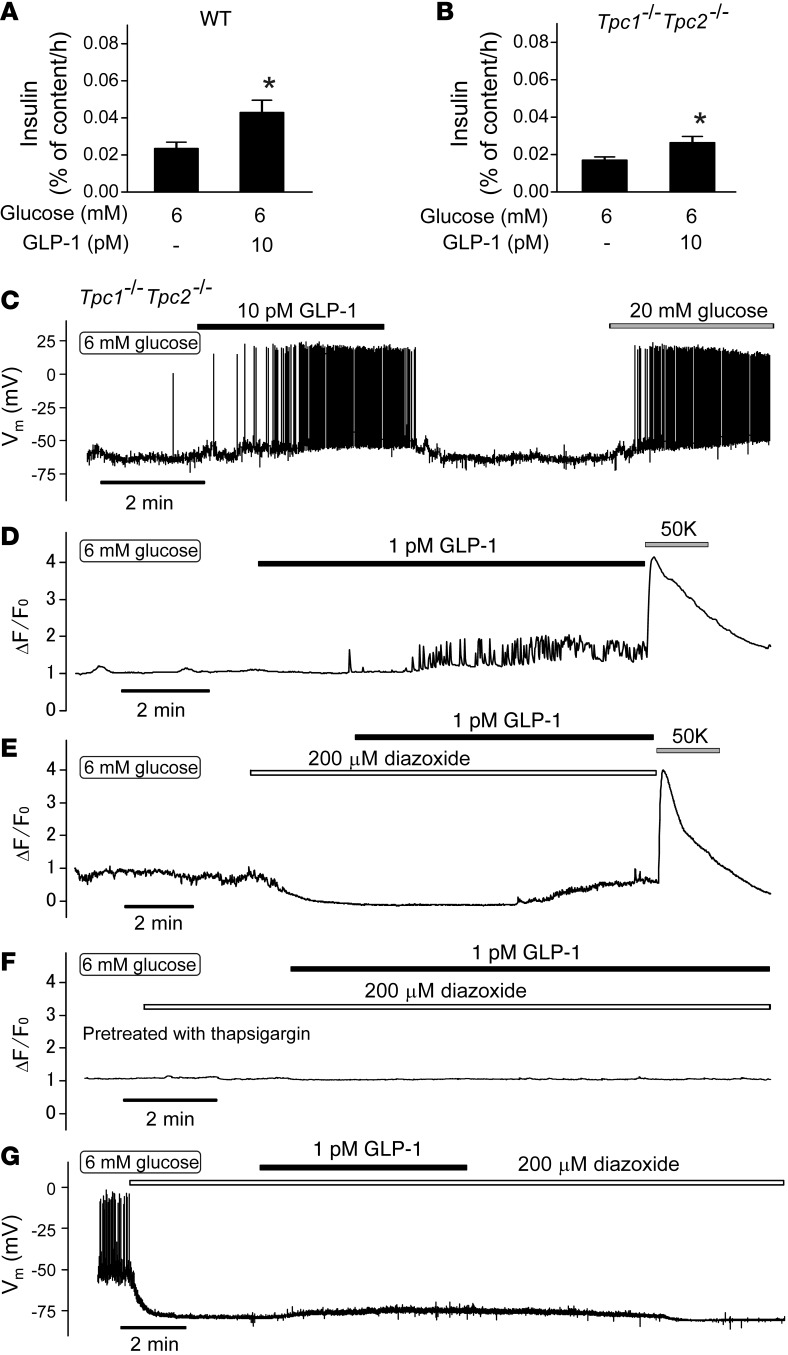
How does GLP-1 activate the TRPM4 and TRPM5 channels? It has been reported that GLP-1 increases the islet content of NAADP (37), which may release Ca2+ from intracellular acidic stores by activation of two-pore channel 1 (TPC1) or TPC2 (38). This would provide a potential link between GLP-1 and activation of TRPM4 and TRPM5 channels, which are Ca2+ activated (37). We investigated this using Tpc1 Tpc2 double KO (DKO) mice. However, Tpc1 Tpc2 DKO islets retained full responsiveness to GLP-1 with regard to both secretion (Figure 10, A and B) and electrical activity (Figure 10C). Tpc1 Tpc2 DKO islets were also responsive to 20 mM glucose (Supplemental Figure 3, A and B)
Figure 10. GLP-1 mobilizes intracellular Ca2+.
(A and B) Effects of GLP-1 (10 pM) on insulin secretion in islets from (A) wild-type and (B) Tpc1 Tpc2 DKO mice exposed to 6 mM glucose (n = 7–8 islets from 6–7 mice). *P < 0.05 vs. 6 mM glucose (1-way ANOVA with Dunnett’s post-hoc test). (C) Effects of 10 pM GLP-1 on electrical activity in Tpc1 Tpc2 DKO β cells. Note that GLP-1 stimulates electrical activity in Tpc1 Tpc2 DKO β cells (n = 4). (D–F) Change in fluo-3 fluorescence (ΔF/F0) measured in single cells in small islet cell clusters from NMRI mice. Diazoxide (200 μM), GLP-1 (1 pM), [K+]o (50 mM), and thapsigargin (1 μM) were applied as indicated by horizontal lines. Representative traces of 7 to 12 cells from 3 to 7 experiments. (G) Failure of GLP-1 to evoke electrical activity in the presence of diazoxide (200 μM). Glucose was present at a concentration of 6 mM throughout. Note spontaneous action potential firing at 6 mM glucose, suppression of action potential firing, and membrane repolarization evoked by application of diazoxide and small and reversible depolarization produced by GLP-1 (n = 6 from 4 mice).
Activation of PLC by GLP-1 (see above) could be expected to increase [Ca2+]i by InsP3-dependent mobilization from intracellular stores. To address this possibility, we measured [Ca2+]i in isolated β cells. In agreement with the [Ca2+]i measurements in intact pancreatic islets (Figure 1E), application of 1 pM GLP-1 in the presence of 6 mM glucose consistently induced rapid [Ca2+]i oscillations (Figure 10D). We then repeated the experiment in the presence of the KATP channel activator diazoxide (200 μM). Application of diazoxide reduced basal [Ca2+]i at 6 mM glucose. Interestingly, application of GLP-1 (1 pM) in the presence of diazoxide still increased [Ca2+]i, but the effect was smaller and did not exhibit any oscillations but only an increase to a new plateau level (Figure 10E). The experiments were concluded by membrane depolarization produced by increasing the extracellular K+ concentration ([K+]o) to 50 mM. This invariably elicited a large increase in [Ca2+]i, both in the absence and presence of diazoxide. When GLP-1 was applied in the presence of diazoxide and to cells pretreated with thapsigargin (1 μM), no GLP-1–induced increase in [Ca2+]i was observed (Figure 10F).
Finally, we ascertained that GLP-1 did not evoke electrical activity in the presence of the KATP channel activator diazoxide. When applied to β cells exposed to 6 mM glucose, diazoxide (200 μM) hyperpolarized the membrane potential to –80 ± 1 mV. Application of GLP-1 induced a reversible depolarization of 10 ± 4 mV (P < 0.05, paired Student’s t test) but did not evoke action potential firing (Figure 10G).
Discussion
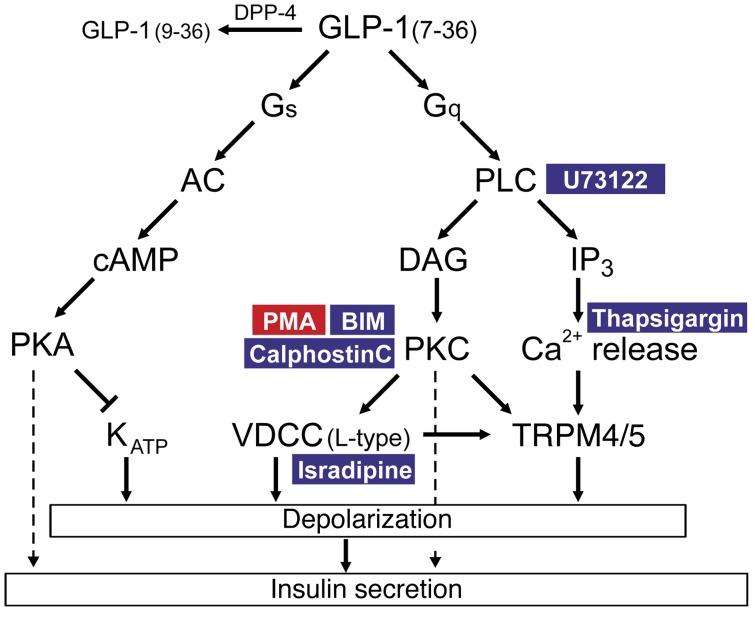
We have revisited the mechanisms by which GLP-1 stimulates insulin secretion in mouse and human β cells. Most previous in vitro studies have been conducted in cell lines or using rodent islets, and it is not immediately evident to what extent these findings can be extended to humans. Another problem is that most in vitro studies have employed very high concentrations of GLP-1 (1,000- to 10000-fold higher than the peripheral plasma concentration). Here, we have characterized the effects of physiological concentrations of GLP-1 (1–10 pM) on insulin secretion and electrical activity. We show that such low concentrations are as effective (if not more effective) as the higher concentrations previously employed. We dissect the signal transduction pathways involved and provide evidence for the involvement of a PLC/PKC-dependent mechanism, culminating in the activation of a Na+-permeable conductance. Here, we discuss key aspects of this work. We first consider the mechanism by which physiological concentrations exert the stimulatory effect on the β cell. We then turn to the functional implications of our findings and the impact they have on the mechanism of action of GLP-1 in vivo. Figure 11 summarizes schematically the effects of low concentrations of GLP-1 on β cell signal transduction pathways that culminate in stimulation of insulin secretion.
Figure 11. Schematic summarizing the effects of GLP-1 on signal transduction pathways relevant to the stimulation of insulin secretion.
In addition to activating Gαs, GLP-1 also leads to activation of Gαq, leading to the activation of PLC and production of DAG, with resultant activation of PKC and elevation of [Ca2+]i by IP3-induced Ca2+ mobilization from thapsigargin-sensitive Ca2+ stores, which (together with the activation of PKC) results in activation of TRPM4 and TRPM5 channels, membrane depolarization, and initiation of action potential firing. GLP-1 also stimulates Ca2+ entry via L-type Ca2+ channels, but this effect is relatively small and is not sufficient to explain the initiation of electrical activity. Additionally, GLP-1 closes KATP channels, accounting for the weak depolarization that persists at low extracellular Na+ and in some Trpm4–/– and Trpm5–/– β cells. Low concentrations of GLP also enhanced depolarization-evoked exocytosis, but this effect requires electrical activity/Ca2+ entry to operate. This also explains why PKC inhibition leads to complete loss of insulin secretion stimulated by GLP-1. This is because, unless electrical activity is initiated, these distal effects will not operate. In the schematic, pharmacological activators and inhibitors are highlighted in red and blue, respectively. AC, adenylyl cyclase; VDCC, voltage-dependent Ca2+ channels.
Picomolar concentrations of GLP-1 stimulate insulin secretion by PKC-dependent mechanisms.
We found that a large component of the stimulatory effect of GLP-1 on glucose-stimulated insulin secretion was sensitive to inhibitors of PKA (such as Rp-8-Br-cAMPS and myr-PKI). Unexpectedly, 40% of the stimulatory effect on insulin secretion persisted in the presence of myr-PKI and GLP-1 remained capable of stimulating β cell electrical activity in the presence of PKA inhibitors.
We believe that the PKA-resistant component depends on PKC activity. This is suggested by the observation that the PKC inhibitors BIM and calphostin C abolished the stimulatory effect of GLP-1 on insulin secretion, while not affecting that evoked by glucose alone. Further evidence for the involvement of PKC in the stimulatory effect of GLP-1 comes from the observations that its effect on β cell electrical activity can be mimicked by the PKC activator PMA and the ability of GLP-1 to produce PKC-dependent phosphorylation of PKD1, previously identified as a regulator of insulin secretion (39). It seems possible that activation of PKC is downstream of Gαq-dependent activation of PLC. This is suggested by three pieces of evidence. First, GLP-1 binding to GLP-1R led to the activation of Gαq in a yeast recombinant system expressing the mammalian G protein (Figure 5). Second, pharmacological inhibition of PLC abolished the stimulation of β cell electrical activity induced by GLP-1. Third, application of GLP-1 at picomolar concentrations led to an increased intracellular concentration of DAG (Figure 4, C and D).
It may seem surprising that the PKC inhibitors abolished the stimulatory effect on insulin secretion, given that the PKA-resistant component of GLP-1–induced secretion only amounted to 40% of the total stimulatory effect. This we attribute to a hierarchy of the PLC/PKC- and PKA-dependent effects. Whereas PKC is required for the initiation of electrical activity and stimulation of Ca2+ influx, the PKA-dependent mechanism principally potentiates the downstream effects by enhanced Ca2+-dependent exocytosis. Thus, the PKA-dependent effects will not operate in the absence of electrical activity (which is PKC dependent).
In addition to the PKA- and PKC-dependent effects we discuss above, GLP-1 has also been postulated to activate the low-affinity cAMP-sensing protein Epac-2. However, the finding that GLP-1, when applied at a concentration of 1 pM, has almost no effect on intracellular cAMP levels, makes it unlikely that the low-affinity cAMP sensor Epac-2 contributes much to the stimulatory effect of picomolar concentrations of GLP-1.
The observation that GLP-1 did not increase intracellular cAMP (Figure 3, C and D) may seem in conflict with the finding that 60% of its stimulatory action on insulin secretion was inhibited by myr-PKI (Figure 3A). It could be argued that GLP-1 may produce an increase in cAMP too small to be detected by the assay we used here, but this explanation seems less likely, given that our measurements of PKA activity failed to detect any increase in its activity in response to GLP-1. Importantly, pretreatment of the cells with myr-PKI reduced basal PKA activity (Figure 3, E and F). Thus, it appears that PKA is tonically active in the β cell and that such activity is required for the full secretory response. Indeed, not only the effect of GLP-1 was reduced by pretreatment with myr-PKI; there was also a tendency toward reduced insulin secretion to 6 mM glucose.
GLP-1 stimulates electrical activity by a Na+-dependent mechanism.
We found that GLP-1 increases the amplitude of the voltage-gated Ca2+ current. Pancreatic β cells are equipped with several types of voltage-gated Ca2+ channel, but our measurements in both mouse and human β cells suggest that GLP-1 selectively increases the L-type Ca2+ current, as no stimulation was detected in the presence of isradipine, a blocker of L-type Ca2+ channels. It is important to note, however, that the effect of GLP-1 on the Ca2+ current is fairly small and that GLP-1 had no effect on the gating of the current. Thus, we argue that the contribution of the increased Ca2+ current to the stimulatory effect of GLP-1 on electrical activity and insulin secretion is marginal.
Our Ca2+ imaging experiments as well as membrane potential recordings suggest that an important component of the stimulatory action of GLP-1 is mediated by initiation of electrical activity (Figure 1D). Part of this effect may result from enhanced glucose-induced closure of the KATP channels (as was previously reported, refs. 24, 26). Importantly, we observed no net reduction of the resting membrane conductance in response to GLP-1 and GLP-1 remained capable of stimulating electrical activity in the presence of a maximally inhibitory concentration of tolbutamide. Collectively, these observations suggest that closure of KATP channels is not the sole mechanism by which GLP-1 stimulates β cell electrical activity.
In both mouse and human β cells, the ability of GLP-1 to produce membrane depolarization and initiate action potential firing was dependent on extracellular Na+. Thus, we confirm earlier reports that the action of GLP-1 involves a Na+-dependent mechanism (40, 41). However, the molecular identity of this Na+-permeable conductance was not conclusively established previously, and it is also unclear whether similar mechanisms operate in mouse and human β cells. We can exclude involvement of voltage-gated Na+ channels, because tetrodotoxin did not interfere with the stimulatory action of GLP-1 (data not shown). In voltage-clamp measurements, GLP-1 activated a small voltage-independent Na+-dependent inward current with an amplitude of only approximately 10 pA. However, because the input resistance of the β cell is very high (>1 GΩ) in the presence of insulin-releasing glucose concentrations, even currents as small as this can exert a marked depolarizing effect on the membrane potential (>10 mV) and trigger action potential firing. It is implicit from the small current activated by GLP-1 that it will not be able to initiate electrical activity and insulin secretion unless the KATP channels are almost fully inhibited. This explains why the stimulatory effect of GLP-1 is glucose dependent, with no or little stimulatory action at low glucose concentrations (Figure 1, B and C), and why GLP-1 loses its stimulatory effect on β cell electrical activity in the presence of diazoxide. It is likely that our failure to detect much suppression of the resting K+ conductance (principally reflecting KATP channel activity) is because the increase in membrane conductance resulting from the activation of a background Na+-dependent current obscures the reduction due to closure of the KATP channels.
Our membrane potential and insulin secretion measurements in Trpm4–/– and Trpm5–/– β cells and islets suggest that both TRPM4 and TRPM5 channels are crucial to the stimulatory effect of physiological concentrations of GLP-1. We attributed the stimulatory effect of GLP-1 on β cell electrical activity, which remained after lowering [Na+]o, to membrane depolarization, resulting from KATP channel closure. A role of TRPM5 channels in the response to GLP-1 is also consistent with the reported deterioration of glucose tolerance following oral glucose administration in Trpm5 KO mice (23).
TRPM4 and TRPM5 channels are Ca2+ activated (42). It is therefore of interest that application of GLP-1 produced an increase in [Ca2+]i in hyperpolarized cells, suggesting it reflects mobilization from intracellular Ca2+ stores, that was sensitive to the SERCA inhibitor thapsigargin. It is also possible that the TRPM4 and TRPM5 channels are regulated by PKC in a Ca2+-independent way at the ambient submembrane [Ca2+]i. In this context, it is of interest that the PKC activator PMA mimics the effect of GLP-1 on electrical activity, and there is documented evidence for modulation of TRPM4 and TRPM5 by PKC (43, 44).
Coda.
Information on the concentration dependence of the insulinotropic effect of GLP-1(7-36) has important physiological implications. The concentrations of GLP-1 customarily used in vitro (1–100 nM) (12–15) are several orders of magnitude higher than the physiological total plasma concentrations and even the portal concentration (>20 pM, ref. 45). In fact, most of the GLP-1 secreted by the intestinal L cells is rapidly degraded by DPP-4 and never reaches the pancreatic islets (46). If GLP-1 is only active at nanomolar concentrations (as suggested by in vitro assays of cAMP production; refs. 47, 48), then it is highly unlikely that circulating GLP-1 will stimulate insulin secretion. These considerations prompted the idea that the hormone instead acts by activation of vago-vagal reflexes (49). However, our findings that GLP-1 at concentrations as low as 1 pM evokes electrical activity in β cells and results in a strong stimulation of insulin secretion in both mouse and human cells/islets (in agreement with previous findings in mouse insulinoma cells; refs. 50, 51) argue that circulating levels of GLP-1(7-36) are adequate to account for the incretin effect. The concept that circulating levels mediate the effects of GLP-1 in vivo is also easily reconciled with the observation that the incretin effect remains intact in patients that have received a whole-pancreas transplant (52), i.e., when the normal innervation has been surgically severed.
Methods
Chemicals.
GLP-1(7-36) amide and the GLP-1R antagonist exendin (9-39) were purchased from Bachem. The L-type calcium channel blocker isradipine was purchased from Alomone Labs. The membrane-permeable PKA inhibitors Rp-8-Br-cAMPS and myr-PKI were obtained from Biolog Life Science Institute and TOCRIS, respectively. The PKC inhibitors BIM and calphostin C were from Merck. Thapsigargin was purchased from TOCRIS. Tolbutamide, diazoxide, acetyl choline, PMA, U-73122 hydrate, and other compounds were obtained from Sigma-Aldrich.
Animals, mouse islet isolation, and cell culture.
Most experiments were performed using islets and/or β cells isolated from female NMRI mice (Charles River), fed a normal diet ad libitum.
Trpm4–/– and Trpm5–/– mice were generated as previously described (35, 53). Both mouse lines were backcrossed for 9 generations on the C57BL6/N background.
DKO mice for both Tpc1 and Tpc2 genes were derived from dihybrid crosses between _Tpc1_T159 (54) and _Tpc2_YHD437 (55) homozygote mutant animals. Lack of Tpc1 and Tpc2 expression was confirmed by RT-PCR. Age- and sex-matched C57BL6/N wild-type animals were used as controls.
Mice were kept in a conventional vivarium with a 12-hour-dark/12-hour-light cycle and ad libitum access to food and water and were killed by cervical dislocation.
Pancreatic islets were isolated by collagenase as previously reported (25). For preparation of single β cells (electrophysiology), freshly isolated islets were incubated in enzyme-free Hank’s medium (Invitrogen) and dissociated into cells/cell clusters by gentle trituration using a 1,000-μl pipette. Dispersed cells were plated on plastic 35-mm tissue culture dishes (Sarstedt Inc.) and maintained in RPMI 1640 containing 10 mM glucose (mouse) or 7.5 mM glucose (human) supplemented with 10% calf serum, 100 U/ml penicillin, and 100 μg/ml streptomycin (Life Technologies Corporation). The cells were maintained in tissue culture for up to 36 hours before the electrophysiological experiments.
Human islets.
Pancreatic islets were isolated in the Oxford Diabetes Research & Wellness Foundation Human Islet Isolation Facility according to published protocols (56, 57). Single β cells were prepared for electrophysiology essentially as described above for mouse cells.
Insulin measurements.
Static and dynamic measurements of insulin release were performed as reported previously (25).
Electrophysiological recordings.
All recordings were performed using an EPC-9 patch-clamp amplifier (HEKA Electronics) using the perforated patch whole-cell technique. Amphotericin B (0.24 mg/ml) was used to establish electrical contact with the cell interior as previously described (58). The extracellular solution for recordings of membrane potential contained 140 mM NaCl, 3.6 mM KCl, 1.5 mM CaCl2, 0.5 mM MgSO4, 0.5 mM NaH2PO4, 5 mM NaHCO3, 10 mM HEPES, and 6 mM glucose (pH 7.4, with NaOH). The pipette solution consisted of 128 mM K-gluconate, 10 mM NaCl, 10 mM KCl, 1 mM MgCl2, and 5 mM HEPES (pH 7.35, with KOH). The extracellular solution for recordings of Ca2+ currents and capacitance contained 118 mM NaCl, 5.6 mM KCl, 2.6 mM CaCl2, 1.2 mM MgCl2, 5 mM HEPES, 20 mM TEA-Cl, and 6 mM glucose (pH 7.4, with NaOH). The pipette solution consisted of 76 mM Cs2SO4, 10 mM NaCl, 10 mM KCl, 1 mM MgCl2, and 5 mM HEPES (pH 7.35, with CsOH). When extracellular Na+ was reduced to 20% of the normal concentration, it was substituted equimolarly by the nonpermeant cation _N_-methyl-d-glucamine+.
For the measurement of exocytosis and Ca2+ currents, the cells were voltage clamped at –70 mV, and voltage-dependent calcium channels were activated by 20-ms depolarizations to 0 mV applied at 1-minute intervals for measuring the effects of GLP-1 on the magnitude of the Ca2+ current.
Exocytosis was measured as increases in cell capacitance evoked by 500-ms depolarizations from –70 mV to 0 mV before and 10 minutes after applying GLP-1 using the Sine+DC technique (59).
Effects of GLP-1 on the whole-cell KATP channel conductance were measured in the perforated patch mode by interrupting the membrane potential recordings (in the current-clamp mode) and switching the amplifier into the voltage-clamp mode. The whole-cell KATP conductance was then measured by application of ±10 mV voltage excursion from a holding potential of –70 mV. All electrophysiological measurements were made at +32°C. The identity of the β cells was confirmed by immunohistochemistry as described previously (60, 61).
[Ca2+]i measurements.
Confocal [Ca2+]i imaging in intact islets was conducted essentially as described previously (62). [Ca2+]i imaging was also performed on isolated cells or small clusters following dissociation of the islets. In these experiments, cells were plated in glass-bottom dishes and maintained in tissue culture overnight in RPMI 1640 medium containing 10 mM d-glucose. Prior to the experiments, the cells were washed twice in imaging buffer (63) containing 6 mM d-glucose and then loaded with 2 μM fluo-3AM in the same buffer for 45 minutes at 30°C. After removal of the loading buffer, the cells were incubated for another 45 minutes in the absence of the indicator to allow complete de-esterification. In some experiments, 1 μM thapsigargin was added during the de-esterification step after 25 minutes. The cells were superfused at a rate of approximately 1 ml/min, and images were acquired on a Zeiss Axio Observer with ×40/1.2W C-Apo Corr lens and illuminated by a Zeiss Colibri.2 system at 488 nm with 15-ms exposure and 2 frames per second. Data are depicted as change in background corrected fluorescence relative to fluorescence at the beginning of the recordings.
cAMP measurements.
The effect of GLP-1 on cAMP levels ([cAMP]i) in pancreatic islet cells was studied using a recombinant FRET sensor, Epac2-camps (27). Epac2-camps was delivered via an adenoviral infection (104 units per cell). The imaging experiments were performed 36 to 48 hours after infection using a Zeiss Axioskop 2FS microscope equipped with a ×40/1.3 objective, Lambda DG-4 exciter (Sutter Instruments), and Orca-R2 cooled CCD camera (Hamamatsu). The CFP fluorescence was excited at 436 nm; the emitted light was collected at 485 nm and 535 nm using a Dual-View Beamsplitter (Photometrics). The images were acquired using open-source Micro-Manager software (developed at Ron Vale’s lab, UCSF, San Francisco, California, USA), and fluorescence (F) was normalized to the initial fluorescence (F0), after which the CFP/YFP ratio (R) was calculated (using ImageJ) by dividing the intensity of fluorescence emitted at 485 nm (CFP) with that emitted at 535 nm (YFP). Data analysis and representation were performed with Igor Pro (Wavemetrics).
PKA activity measurements.
Real-time changes in PKA activity were reported in pancreatic islet cells using recombinant FRET probe AKAR3 (28). Islets isolated from NMRI mice were dispersed into single cells and plated on glass coverslips. AKAR3 was delivered via an adenoviral infection (103 units per cell). Imaging experiments were performed 36 hours after infection using a Zeiss Axioskop FS2 microscope equipped with a ×40/1.3 objective (Carl Zeiss). The fluorescence was excited at 436 nm; the emitted light was collected at 485 (CFP) and 515 (YFP) nm. The cells were kept at 33°C to 35°C and superfused continuously throughout the experiment. The images were acquired using Micro-Manager software and fluorescence (F) normalized to the initial fluorescence (F0) using ImageJ. Data analysis and representation were performed with Igor Pro (Wavemetrics). AKAR3 was a gift from Jin Zhang, Department of Pharmacology and Molecular Sciences, The Johns Hopkins University School of Medicine, Baltimore, Maryland, USA.
DAG measurements.
The effect of GLP-1 on [DAG]i in pancreatic islet cells was studied using a recombinant circularly permutated probe, Upward DAG (Montana Molecular). Islets isolated from NMRI mice were dispersed into a single-cell suspension as described above and plated on glass coverslips. Upward DAG was delivered via a BacMam infection (103 units per cell), according to the manufacturer’s guidelines. Imaging experiments were performed 48 hours after infection using a Zeiss AxioZoom.V16 zoom microscope equipped with a ×2.3/0.57 objective (Carl Zeiss). The fluorescence was excited at 480 nm, and the emitted light was collected at 515 nm. The cells were kept at 33°C to 35°C and superfused continuously throughout the experiment. The images were acquired using Zen Blue software (Carl Zeiss) and normalized to the initial fluorescence and reported as F/F0 using ImageJ. Data analysis and representation was performed with Igor Pro (Wavemetrics).
Determination of PKC-dependent activation of PKD1.
Freshly isolated mouse islets were handpicked and maintained in RPMI supplemented with 6 mM glucose, 10 mM HEPES, and 0.1% BSA for 5 hours prior to stimulation. Islets (150 per condition) were subsequently preincubated in RPMI with or without BIM for 60 minutes and stimulated for 10 minutes with the compounds indicated in the figure legends.
After incubation, the supernatants were discarded; islets were washed in ice-cold PBS once and lysed in RIPA buffer containing 20 mM Tris-HCl (pH 7.5), 150 mM NaCl, 1 mM EDTA, 1 mM EGTA, 1% NP-40, 1% sodium deoxycholate, 2.5 mM β-glycerophosphate, and 1 mM Na3VO4; and supplemented with protease and phosphatase inhibitors (Life Sciences/Roche).
The lysates were subjected to SDS-PAGE, transferred to PVDF membrane (Bio-Rad), and probed with primary antibodies to phospho-PKD1 (Ser744/748 2054, Cell Signaling Technology) and total PKD1 (2052, Cell Signaling Technology), calnexin (208880, Calbiochem), and β-actin (ab49900, AbCam). HRP-conjugated secondary anti-mouse and anti-rabbit antibodies were from Dako. Blots were visualized using ECL detection reagent (Clarity Western ECL substrate, Bio-Rad) and exposure to X-ray film (Amersham Hyperfilm ECL, GE Healthcare). Each phospho-PKD blot was stripped and reprobed for total PKD1 to determine activation (phospho-PKD/total PKD intensity ratios). Data were expressed as mean fold change relative to no stimulation control in each experiment.
Yeast-based assay of GLP-1R activation of G proteins.
Yeast nitrogen base and yeast extract were purchased from Difco. Fluorescein-di-β-d-glucopyranoside (FDGlu) was purchased from Invitrogen. General yeast procedures were performed as described previously (23, 56). We have previously demonstrated the expression of human GLP-1R in dual-reporter chimeric Gαq, and Gαs (MMY14 and MMY24) containing Saccharomyces cerevisiae strains (33). Receptor signaling was measured using the yeast growth assay. Cells were initially grown in SD-URA to establish a starter culture prior to overnight growth in SD-URA-HIS media at 30°C to remove basal activity. Yeast cells were then assayed using FDGlu-supplemented media in the presence of different concentrations of GLP-1 ligand (0.01 nM–10 μM). Fluorescence was measured on a TECAN Infinite M200 microplate reader (TECAN Ultra Evolution).
Statistics.
Statistical analyses were performed using IBM SPSS statistics software. Unless otherwise indicated, data are presented as mean ± SEM. Statistical significance was evaluated using the 2-tailed Student’s t test (single comparisons), ANOVA (multiple comparisons), or Friedman’s test with Dunn-Bonferroni post-hoc (multiple comparisons on paired nonparametric data). Dunnett’s test was used for post-hoc analysis with ANOVA where data were compared with a single control or with multiple controls. A P value of less than 0.05 was considered significant. All experiments on wild-type cells were performed on cells/islets pooled from multiple animals.
The concentration-response relationships (Figure 4) were analyzed using Prism 6.0e (Graphpad Software) using the 3-parameter logistic equation to obtain EC50 and the maximal effect (Emax) values.
To derive the Ca2+ channel activation properties, the currents (I) elicited by membrane depolarization to voltage V were divided by the driving force (V – _E_Ca, where _E_Ca represents the reversal potential for the Ca2+ current determined experimentally for each experiment). The maximal current (_I_max) and _E_Ca were obtained by fitting each current-voltage (_I_-V). The individual activation relation was fitted to the function
(Equation 1)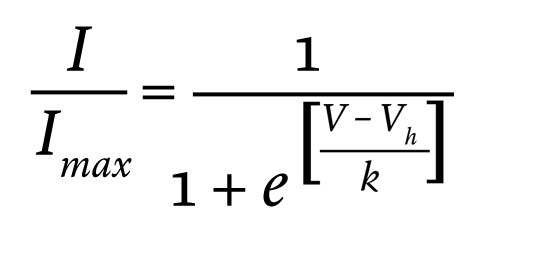
where Vh is the membrane potential at which the activation is half-maximal and k is the slope factor.
The dose-response relationship between GLP-1 and cytosolic cAMP (measured as R) was fitted with a Hill equation
(Equation 2)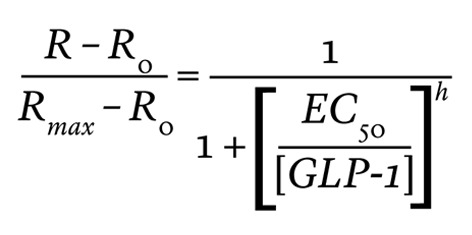
where R is the CFP/YFP ratio of the Epac-2-camps sensor that was observed at the GLP-1 concentration of [_GLP-1_]; Rmax is the CFP/YFP ratio at 100 nM GLP-1; _R_0 is the CFP/YFP ratio at 0 nM GLP-1; EC50 is the concentration of GLP-1 that produces a half-maximal increase of R; and h is the Hill (cooperativity) coefficient.
Study approval.
All experiments on mouse β cells and islets were conducted in accordance with the United Kingdom Animals (Scientific Procedures) Act (1986) and the University of Oxford ethical guidelines.
Breeding of Trpm4 and Trpm5 KO mice was approved by the ethical committee of Katholieke Universiteit Leuven.
Human pancreases were obtained with ethical approval of the NHS National Research Ethics Centre, Oxfordshire, United Kingdom (REC B) and clinical consent from heart-beating donors.
Author contributions
MS, RR, AIT, CYC, MVC, BH, KP, TR, NR, WRS, AS, EV, and CW researched data, contributed to the discussion, and reviewed/edited the manuscript. PRVJ supplied the human islets. AG and RV provided KO mouse models. VON and JG contributed to the cAMP measurements, and MZ contributed to the measurements of PKA activity. AG, MK, GL, RV, and KK contributed to the discussion. MS and PR planned the experiments and wrote the paper.
Supplementary Material
Supplemental data
Acknowledgments
We thank David Wiggins for excellent technical assistance. This work was supported by the Medical Research Council, Diabetes UK (to R. Ramracheya ), Oxford Biomedical Research Centre (to A. Tarasov), the Wellcome Trust (Senior Investigator Awards to A. Galione and P. Rorsman), the Warwick Impact Fund (to C. Weston and G. Ladds), the Biotechnology and Biological Sciences Research Council (to G. Ladds), the Knut and Alice Wallenberg Foundation (to P. Rorsman), and the Swedish Research Council (to P. Rorsman). The initial stages of M. Shigeto’s stay in Oxford were supported by a fellowship from Kawasaki Medical School.
Footnotes
Conflict of interest: The authors have declared that no conflict of interest exists.
Reference information:J Clin Invest. 2015;125(12):4714–4728. doi:10.1172/JCI81975.
See the related Commentary beginning on page 1.
References
- 1.Danaei G, et al. National, regional, and global trends in fasting plasma glucose and diabetes prevalence since 1980: systematic analysis of health examination surveys and epidemiological studies with 370 country-years and 2.7 million participants. Lancet. 2011;378(9785):31–40. doi: 10.1016/S0140-6736(11)60679-X. [DOI] [PubMed] [Google Scholar]
- 2.Weir GC, Bonner-Weir S. Islet β cell mass in diabetes and how it relates to function, birth, and death. Ann N Y Acad Sci. 2013;1281:92–105. doi: 10.1111/nyas.12031. [DOI] [PMC free article] [PubMed] [Google Scholar]
- 3.Deacon CF, Holst JJ. Dipeptidyl peptidase-4 inhibitors for the treatment of type 2 diabetes: comparison, efficacy and safety. Expert Opin Pharmacother. 2013;14(15):2047–2058. doi: 10.1517/14656566.2013.824966. [DOI] [PubMed] [Google Scholar]
- 4.Ussher JR, Drucker DJ. Cardiovascular actions of incretin-based therapies. Circ Res. 2014;114(11):1788–1803. doi: 10.1161/CIRCRESAHA.114.301958. [DOI] [PubMed] [Google Scholar]
- 5.Balas B, et al. The dipeptidyl peptidase IV inhibitor vildagliptin suppresses endogenous glucose production and enhances islet function after single-dose administration in type 2 diabetic patients. J Clin Endocrinol Metab. 2007;92(4):1249–1255. doi: 10.1210/jc.2006-1882. [DOI] [PubMed] [Google Scholar]
- 6.Ahrén B. DPP-4 inhibitors. Best Pract Res Clin Endocrinol Metab. 2007;21(4):517–533. doi: 10.1016/j.beem.2007.07.005. [DOI] [PubMed] [Google Scholar]
- 7.Imeryuz N, Yegen BC, Bozkurt A, Coskun T, Villanueva-Penacarrillo ML, Ulusoy NB. Glucagon-like peptide-1 inhibits gastric emptying via vagal afferent-mediated central mechanisms. Am J Physiol. 1997;273(4 pt 1):G920–G927. doi: 10.1152/ajpgi.1997.273.4.G920. [DOI] [PubMed] [Google Scholar]
- 8.Luque MA, et al. Glucagon-like peptide-1 (GLP-1) and glucose metabolism in human myocytes. J Endocrinol. 2002;173(3):465–473. doi: 10.1677/joe.0.1730465. [DOI] [PubMed] [Google Scholar]
- 9.Lopez-Delgado MI, Morales M, Villanueva-Penacarrillo ML, Malaisse WJ, Valverde I. Effects of glucagon-like peptide 1 on the kinetics of glycogen synthase a in hepatocytes from normal and diabetic rats. Endocrinology. 1998;139(6):2811–2817. doi: 10.1210/endo.139.6.6045. [DOI] [PubMed] [Google Scholar]
- 10.Villanueva-Penacarrillo ML, Marquez L, Gonzalez N, Diaz-Miguel M, Valverde I. Effect of GLP-1 on lipid metabolism in human adipocytes. Horm Metab Res. 2001;33(2):73–77. doi: 10.1055/s-2001-12428. [DOI] [PubMed] [Google Scholar]
- 11.Valverde I, Merida E, Delgado E, Trapote MA, Villanueva-Penacarrillo ML. Presence and characterization of glucagon-like peptide-1(7-36) amide receptors in solubilized membranes of rat adipose tissue. Endocrinology. 1993;132(1):75–79. doi: 10.1210/endo.132.1.8380388. [DOI] [PubMed] [Google Scholar]
- 12.Fridolf T, Ahren B. GLP-1(7-36) amide stimulates insulin secretion in rat islets: studies on the mode of action. Diabetes Res. 1991;16(4):185–191. [PubMed] [Google Scholar]
- 13.MacDonald PE, El-Kholy W, Riedel MJ, Salapatek AM, Light PE, Wheeler MB. The multiple actions of GLP-1 on the process of glucose-stimulated insulin secretion. Diabetes. 2002;51(suppl 3):S434–S442. doi: 10.2337/diabetes.51.2007.s434. [DOI] [PubMed] [Google Scholar]
- 14.Gromada J, Brock B, Schmitz O, Rorsman P. Glucagon-like peptide-1: regulation of insulin secretion and therapeutic potential. Basic Clin Pharmacol Toxicol. 2004;95(6):252–262. doi: 10.1111/j.1742-7843.2004.t01-1-pto950502.x. [DOI] [PubMed] [Google Scholar]
- 15.Doyle ME, Egan JM. Mechanisms of action of glucagon-like peptide 1 in the pancreas. Pharmacol Ther. 2007;113(3):546–593. doi: 10.1016/j.pharmthera.2006.11.007. [DOI] [PMC free article] [PubMed] [Google Scholar]
- 16.Henquin JC. Triggering and amplifying pathways of regulation of insulin secretion by glucose. Diabetes. 2000;49(11):1751–1760. doi: 10.2337/diabetes.49.11.1751. [DOI] [PubMed] [Google Scholar]
- 17.Goke R, et al. Exendin-4 is a high potency agonist and truncated exendin-(9-39)-amide an antagonist at the glucagon-like peptide 1-(7-36)-amide receptor of insulin-secreting beta-cells. J Biol Chem. 1993;268(26):19650–19655. [PubMed] [Google Scholar]
- 18.Knudsen LB, et al. Potent derivatives of glucagon-like peptide-1 with pharmacokinetic properties suitable for once daily administration. J Med Chem. 2000;43(9):1664–1669. doi: 10.1021/jm9909645. [DOI] [PubMed] [Google Scholar]
- 19.Holst JJ. The physiology of glucagon-like peptide 1. Physiol Rev. 2007;87(4):1409–1439. doi: 10.1152/physrev.00034.2006. [DOI] [PubMed] [Google Scholar]
- 20.Bavec A, Hallbrink M, Langel U, Zorko M. Different role of intracellular loops of glucagon-like peptide-1 receptor in G-protein coupling. Regul Pept. 2003;111(1-3):137–144. doi: 10.1016/S0167-0115(02)00282-3. [DOI] [PubMed] [Google Scholar]
- 21.Hallbrink M, Holmqvist T, Olsson M, Ostenson CG, Efendic S, Langel U. Different domains in the third intracellular loop of the GLP-1 receptor are responsible for Galpha(s) and Galpha(i)/Galpha(o) activation. Biochim Biophys Acta. 2001;1546(1):79–86. doi: 10.1016/S0167-4838(00)00270-3. [DOI] [PubMed] [Google Scholar]
- 22.Montrose-Rafizadeh C, et al. Pancreatic glucagon-like peptide-1 receptor couples to multiple G proteins and activates mitogen-activated protein kinase pathways in Chinese hamster ovary cells. Endocrinology. 1999;140(3):1132–1140. doi: 10.1210/endo.140.3.6550. [DOI] [PubMed] [Google Scholar]
- 23.Colsoul B, et al. Loss of high-frequency glucose-induced Ca2+ oscillations in pancreatic islets correlates with impaired glucose tolerance in Trpm5–/– mice. Proc Natl Acad Sci U S A. 2010;107(11):5208–5213. doi: 10.1073/pnas.0913107107. [DOI] [PMC free article] [PubMed] [Google Scholar]
- 24.Holz GGt, Kuhtreiber WM, Habener JF. Pancreatic beta-cells are rendered glucose-competent by the insulinotropic hormone glucagon-like peptide-1(7-37) Nature. 1993;361(6410):362–365. doi: 10.1038/361362a0. [DOI] [PMC free article] [PubMed] [Google Scholar]
- 25.Zhang Q, et al. Na+ current properties in islet α- and β-cells reflect cell-specific Scn3a and Scn9a expression. J Physiol. 2014;592(pt 21):4677–4696. doi: 10.1113/jphysiol.2014.274209. [DOI] [PMC free article] [PubMed] [Google Scholar]
- 26.Gromada J, Ding WG, Barg S, Renstrom E, Rorsman P. Multisite regulation of insulin secretion by cAMP-increasing agonists: evidence that glucagon-like peptide 1 and glucagon act via distinct receptors. Pflugers Arch. 1997;434(5):515–524. doi: 10.1007/s004240050431. [DOI] [PubMed] [Google Scholar]
- 27.Nikolaev VO, Bunemann M, Hein L, Hannawacker A, Lohse MJ. Novel single chain cAMP sensors for receptor-induced signal propagation. J Biol Chem. 2004;279(36):37215–37218. doi: 10.1074/jbc.C400302200. [DOI] [PubMed] [Google Scholar]
- 28.Allen MD, Zhang J. Subcellular dynamics of protein kinase A activity visualized by FRET-based reporters. Biochem Biophys Res Commun. 2006;348(2):716–721. doi: 10.1016/j.bbrc.2006.07.136. [DOI] [PubMed] [Google Scholar]
- 29.Suzuki Y, Zhang H, Saito N, Kojima I, Urano T, Mogami H. Glucagon-like peptide 1 activates protein kinase C through Ca2+-dependent activation of phospholipase C in insulin-secreting cells. J Biol Chem. 2006;281(39):28499–28507. doi: 10.1074/jbc.M604291200. [DOI] [PubMed] [Google Scholar]
- 30.Rozengurt E. Protein kinase D signaling: multiple biological functions in health and disease. Physiology. 2011;26(1):23–33. doi: 10.1152/physiol.00037.2010. [DOI] [PMC free article] [PubMed] [Google Scholar]
- 31.Gao ZY, Gilon P, Henquin JC. The role of protein kinase-C in signal transduction through vasopressin and acetylcholine receptors in pancreatic B-cells from normal mouse. Endocrinology. 1994;135(1):191–199. doi: 10.1210/endo.135.1.8013353. [DOI] [PubMed] [Google Scholar]
- 32.Tewson P, Westenberg M, Zhao Y, Campbell RE, Quinn AM, Hughes TE. Simultaneous detection of Ca2+ and diacylglycerol signaling in living cells. PLoS One. 2012;7(8): doi: 10.1371/journal.pone.0042791. [DOI] [PMC free article] [PubMed] [Google Scholar]
- 33.Weston C, Poyner D, Patel V, Dowell S, Ladds G. Investigating G protein signalling bias at the glucagon-like peptide-1 receptor in yeast. Br J Pharmacol. 2014;171(15):3651–3665. doi: 10.1111/bph.12716. [DOI] [PMC free article] [PubMed] [Google Scholar]
- 34.Gall D, Gromada J, Susa I, Rorsman P, Herchuelz A, Bokvist K. Significance of Na/Ca exchange for Ca2+ buffering and electrical activity in mouse pancreatic β-cells. Biophys J. 1999;76(4):2018–2028. doi: 10.1016/S0006-3495(99)77359-5. [DOI] [PMC free article] [PubMed] [Google Scholar]
- 35.Rorsman P, Eliasson L, Kanno T, Zhang Q, Gopel S. Electrophysiology of pancreatic β-cells in intact mouse islets of Langerhans. Prog Biophys Mol Biol. 2011;107(2):224–235. doi: 10.1016/j.pbiomolbio.2011.06.009. [DOI] [PubMed] [Google Scholar]
- 36.Low JT, et al. Glucose principally regulates insulin secretion in mouse islets by controlling the numbers of granule fusion events per cell. Diabetologia. 2013;56(12):2629–2637. doi: 10.1007/s00125-013-3019-5. [DOI] [PMC free article] [PubMed] [Google Scholar]
- 37.Kim BJ, et al. Generation of nicotinic acid adenine dinucleotide phosphate and cyclic ADP-ribose by glucagon-like peptide-1 evokes Ca2+ signal that is essential for insulin secretion in mouse pancreatic islets. Diabetes. 2008;57(4):868–878. doi: 10.2337/db07-0443. [DOI] [PubMed] [Google Scholar]
- 38.Arredouani A, Evans AM, Ma J, Parrington J, Zhu MX, Galione A. An emerging role for NAADP-mediated Ca2+ signaling in the pancreatic β-cell. Islets. 2010;2(5):323–330. doi: 10.4161/isl.2.5.12747. [DOI] [PMC free article] [PubMed] [Google Scholar]
- 39.Sumara G, et al. Regulation of PKD by the MAPK p38Δ in insulin secretion and glucose homeostasis. Cell. 2009;136(2):235–248. doi: 10.1016/j.cell.2008.11.018. [DOI] [PMC free article] [PubMed] [Google Scholar]
- 40.Fridolf T, Ahren B. GLP-1(7-36)amide-stimulated insulin secretion in rat islets is sodium-dependent. Biochem Biophys Res Commun. 1991;179(1):701–706. doi: 10.1016/0006-291X(91)91429-G. [DOI] [PubMed] [Google Scholar]
- 41.Kato M, Ma HT, Tatemoto K. GLP-1 depolarizes the rat pancreatic beta cell in a Na(+)-dependent manner. Regul Pept. 1996;62(1):23–27. doi: 10.1016/0167-0115(95)00164-6. [DOI] [PubMed] [Google Scholar]
- 42.Nilius B, et al. Voltage dependence of the Ca2+-activated cation channel TRPM4. J Biol Chem. 2003;278(33):30813–30820. doi: 10.1074/jbc.M305127200. [DOI] [PubMed] [Google Scholar]
- 43.Vennekens R, Nilius B. Insights into TRPM4 function, regulation and physiological role. Handb Exp Pharmacol. 2007;(179):269–285. doi: 10.1007/978-3-540-34891-7_16. [DOI] [PubMed] [Google Scholar]
- 44.Liman ER. TRPM5 and taste transduction. Handb Exp Pharmacol. 2007;(179):287–298. doi: 10.1007/978-3-540-34891-7_17. [DOI] [PubMed] [Google Scholar]
- 45.Toft-Nielsen MB, et al. Determinants of the impaired secretion of glucagon-like peptide-1 in type 2 diabetic patients. J Clin Endocrinol Metab. 2001;86(8):3717–3723. doi: 10.1210/jcem.86.8.7750. [DOI] [PubMed] [Google Scholar]
- 46.Hansen L, Deacon CF, Orskov C, Holst JJ. Glucagon-like peptide-1-(7-36)amide is transformed to glucagon-like peptide-1-(9-36)amide by dipeptidyl peptidase IV in the capillaries supplying the L cells of the porcine intestine. Endocrinology. 1999;140(11):5356–5363. doi: 10.1210/endo.140.11.7143. [DOI] [PubMed] [Google Scholar]
- 47.Gefel D, Hendrick GK, Mojsov S, Habener J, Weir GC. Glucagon-like peptide-I analogs: effects on insulin secretion and adenosine 3′,5′-monophosphate formation. Endocrinology. 1990;126(4):2164–2168. doi: 10.1210/endo-126-4-2164. [DOI] [PubMed] [Google Scholar]
- 48.Green BD, Gault VA, Flatt PR, Harriott P, Greer B, O’Harte FP. Comparative effects of GLP-1 and GIP on cAMP production, insulin secretion, and in vivo antidiabetic actions following substitution of Ala8/Ala2 with 2-aminobutyric acid. Arch Biochem Biophys. 2004;428(2):136–143. doi: 10.1016/j.abb.2004.05.005. [DOI] [PubMed] [Google Scholar]
- 49.Holst JJ, Deacon CF. Glucagon-like peptide-1 mediates the therapeutic actions of DPP-IV inhibitors. Diabetologia. 2005;48(4):612–615. doi: 10.1007/s00125-005-1705-7. [DOI] [PubMed] [Google Scholar]
- 50.Gromada J, et al. Glucagon-like peptide I increases cytoplasmic calcium in insulin-secreting beta TC3-cells by enhancement of intracellular calcium mobilization. Diabetes. 1995;44(7):767–774. doi: 10.2337/diab.44.7.767. [DOI] [PubMed] [Google Scholar]
- 51.Shigeto M, Katsura M, Matsuda M, Ohkuma S, Kaku K. Low, but physiological, concentration of GLP-1 stimulates insulin secretion independent of the cAMP-dependent protein kinase pathway. J Pharmacol Sci. 2008;108(3):274–279. doi: 10.1254/jphs.08090FP. [DOI] [PubMed] [Google Scholar]
- 52.Rickels MR, Mueller R, Markmann JF, Naji A. Effect of glucagon-like peptide-1 on β- and α-cell function in isolated islet and whole pancreas transplant recipients. J Clin Endocrinol Metab. 2009;94(1):181–189. doi: 10.1210/jc.2008-1806. [DOI] [PMC free article] [PubMed] [Google Scholar]
- 53.Vennekens R, et al. Increased IgE-dependent mast cell activation and anaphylactic responses in mice lacking the calcium-activated nonselective cation channel TRPM4. Nat Immunol. 2007;8(3):312–320. doi: 10.1038/ni1441. [DOI] [PubMed] [Google Scholar]
- 54.Ruas M, et al. TPC1 has two variant isoforms, and their removal has different effects on endo-lysosomal functions compared to loss of TPC2. Mol Cell Biol. 2014;34(21):3981–3992. doi: 10.1128/MCB.00113-14. [DOI] [PMC free article] [PubMed] [Google Scholar]
- 55.Calcraft PJ, et al. NAADP mobilizes calcium from acidic organelles through two-pore channels. Nature. 2009;459(7246):596–600. doi: 10.1038/nature08030. [DOI] [PMC free article] [PubMed] [Google Scholar]
- 56.Lake SP, et al. Large-scale purification of human islets utilizing discontinuous albumin gradient on IBM 2991 cell separator. Diabetes. 1989;38(suppl 1):143–145. doi: 10.2337/diab.38.1.s143. [DOI] [PubMed] [Google Scholar]
- 57.Ricordi C, Lacy PE, Finke EH, Olack BJ, Scharp DW. Automated method for isolation of human pancreatic islets. Diabetes. 1988;37(4):413–420. doi: 10.2337/diab.37.4.413. [DOI] [PubMed] [Google Scholar]
- 58.Ammala C, Ashcroft FM, Rorsman P. Calcium-independent potentiation of insulin release by cyclic AMP in single β-cells. Nature. 1993;363(6427):356–358. doi: 10.1038/363356a0. [DOI] [PubMed] [Google Scholar]
- 59.Ammala C, Eliasson L, Bokvist K, Larsson O, Ashcroft FM, Rorsman P. Exocytosis elicited by action potentials and voltage-clamp calcium currents in individual mouse pancreatic B-cells. J Physiol. 1993;472:665–688. doi: 10.1113/jphysiol.1993.sp019966. [DOI] [PMC free article] [PubMed] [Google Scholar]
- 60.Braun M, et al. Voltage-gated ion channels in human pancreatic β-cells: electrophysiological characterization and role in insulin secretion. Diabetes. 2008;57(6):1618–1628. doi: 10.2337/db07-0991. [DOI] [PubMed] [Google Scholar]
- 61.Gopel SO, et al. Activation of Ca(2+)-dependent K(+) channels contributes to rhythmic firing of action potentials in mouse pancreatic β cells. J Gen Physiol. 1999;114(6):759–770. doi: 10.1085/jgp.114.6.759. [DOI] [PMC free article] [PubMed] [Google Scholar]
- 62.Girard CA, et al. Expression of an activating mutation in the gene encoding the KATP channel subunit Kir6.2 in mouse pancreatic β cells recapitulates neonatal diabetes. J Clin Invest. 2009;119(1):80–90. doi: 10.1172/JCI35772. [DOI] [PMC free article] [PubMed] [Google Scholar]
- 63.Reinbothe TM, Safi F, Axelsson AS, Mollet IG, Rosengren AH. Optogenetic control of insulin secretion in intact pancreatic islets with β-cell-specific expression of Channelrhodopsin-2. Islets. 2014;6(1): doi: 10.4161/isl.28095. [DOI] [PMC free article] [PubMed] [Google Scholar]
Associated Data
This section collects any data citations, data availability statements, or supplementary materials included in this article.
Supplementary Materials
Supplemental data
