Alternative 3'UTRs act as scaffolds to regulate membrane protein localization (original) (raw)
. Author manuscript; available in PMC: 2015 Dec 31.
Published in final edited form as: Nature. 2015 Apr 20;522(7556):363–367. doi: 10.1038/nature14321
Abstract
About half of human genes use alternative cleavage and polyadenylation (ApA) to generate mRNA transcripts that differ in the length of their 3' untranslated regions (3'UTRs) while producing the same protein 1–3. Here we show in human cell lines that alternative 3' UTRs differentially regulate the localization of membrane proteins. The long 3'UTR of CD47 enables efficient cell surface expression of CD47 protein, whereas the short 3'UTR primarily localizes CD47 protein to the endoplasmic reticulum. CD47 protein localization occurs post-translationally and independently of RNA localization. In our model of 3' UTR-dependent protein localization, the long 3' UTR of CD47 acts as a scaffold to recruit a protein complex containing the RNA-binding protein HuR (also known as ELAVL1) and SET4 to the site of translation. This facilitates interaction of SET with the newly translated cytoplasmic domains of CD47 and results in subsequent translocation of CD47 to the plasma membrane via activated RAC1 5. We also show that CD47 protein has different functions depending on whether it was generated by the short or long 3'UTR isoforms. Thus, ApA contributes to the functional diversity of the proteome without changing the amino acid sequence. 3' UTR-dependent protein localization has the potential to be a widespread trafficking mechanism for membrane proteins because HuR binds to thousands of mRNAs6–9, and we show that the long 3' UTRs of CD44, ITGA1 and TNFRSF13C, which are bound by HuR, increase surface protein expression compared to their corresponding short 3' UTRs. We propose that during translation the scaffold function of 3' UTRs facilitates binding of proteins to nascent proteins to direct their transport or function—and that this role of 3' UTRs can be regulated by ApA.
Alternative 3'UTR isoform abundance was shown to be highly cell type-specific and can change upon proliferation, differentiation and transformation 1–3. Alternative 3'UTR isoforms produce the same protein, but the long 3'UTRs contain additional regulatory elements that can regulate mRNA localization and protein abundance 1,2,10. We have discovered a new function of 3'UTRs: they can regulate protein localization independently of RNA localization.
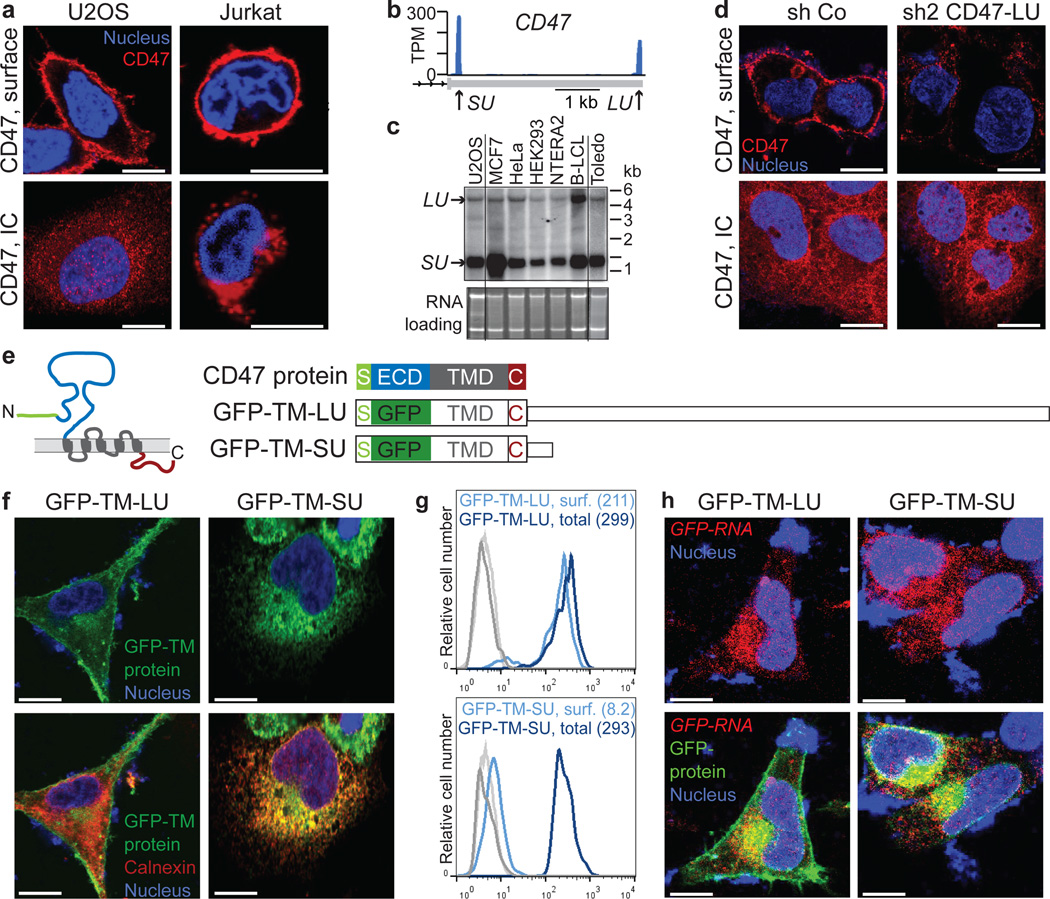
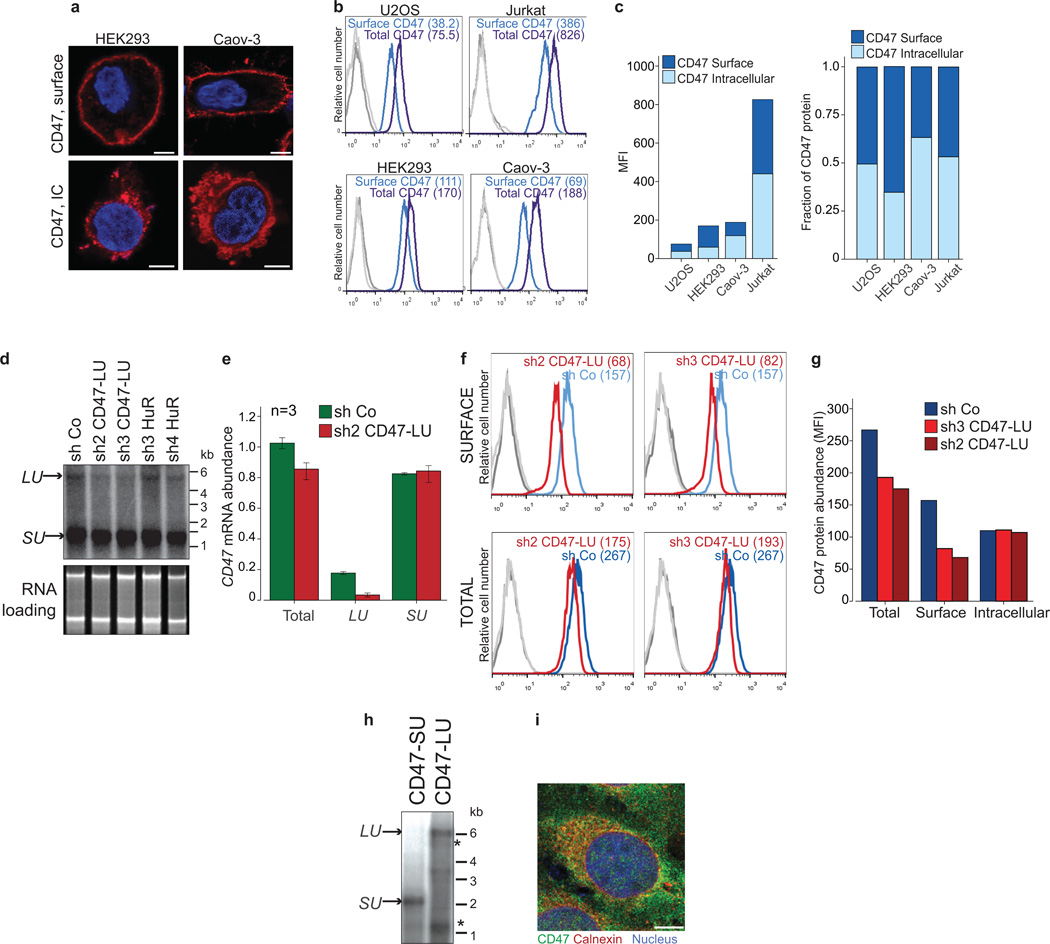
CD47 is best known as a ubiquitous cell surface molecule that acts as a marker of self and protects cells from phagocytosis by macrophages 11,12. We found CD47 protein expressed on the cell surface as well as intracellularly (Fig. 1a and Extended Data Fig. 1a–c). The CD47 gene produces alternative 3' UTRs as determined by the 3'-end sequencing method 3'-seq and confirmed by northern blot analysis (Fig. 1b, c) 3. Exclusive knockdown of the longer 3'UTR isoform by short hairpin RNAs (shRNAs) decreased CD47 surface expression without changing intracellular expression (Fig. 1d and Extended Data Fig. 1d–g). This suggests that the long 3'UTR isoform facilitates cell surface localization of CD47 protein.
Figure 1. The long 3'UTR of CD47 localizes GFP-TM protein to the plasma membrane, whereas the short 3'UTR localizes it to the endoplasmic reticulum.
(A) Fluorescence confocal microscopy of endogenous CD47 protein in non-permeabilized (top) and permeabilized (bottom) cells. IC, intracellular.
(B) 3'-seq analysis of naïve B cells shows two 3'UTR isoforms of CD47 mRNA (short 3'UTR (SU) and long 3'UTR (LU)). Shown is the last exon of the gene model. Isoform abundance shown in transcripts per million (TPM).
(C) Northern blot analysis of human cell lines confirming CD47 mRNA isoforms from (b). The corresponding ethidium-bromide-stained RNA gel is shown as loading control.
(D) Staining of U2OS cells as in (a) after transfection of a control shRNA (sh Co) or an shRNA against the long CD47 3'UTR isoform.
(E) CD47 protein contains an N-terminal signal peptide (S; green), ECD (blue), five TMDs (grey) and a cytoplasmic C-terminus (C; red). In both constructs, the ECD was replaced with GFP and either fused with the long (GFP-TM-LU) or the short CD47 3'UTR (GFP-TM-SU). Constructs are drawn to scale.
(F) Fluorescence confocal microscopy of fixed U2OS cells after transfection of GFP-TM-LU or GFP-TM-SU. Bottom, with additional staining of the endoplasmic reticulum with anti-calnexin.
(G) FACS analysis of GFP expression in transfected U2OS cells with (dark blue lines, detection of total expression) and without permeabilization (light blue lines, detection of surface (surf.) expression). Values for mean fluorescence intensity (MFI) are shown in parentheses. Unstained cells are shown in grey. Representative image from more than twenty experiments.
(H) RNA-fluorescence in situ hybridization (FISH) (red) against GFP in permeabilized U2OS cells after transfection of GFP-TM-LU or GFP-TM-SU. Bottom panel also shows GPF-TM protein.
a, d, f and h are representative images from hundreds of cells. Scale bars, 10 µm.
To test this hypothesis, we asked whether green fluorescent protein (GFP) encoded by an mRNA containing the long (with a mutated proximal polyadenylation signal; Extended Data Fig. 1h) or the short 3'UTR of CD47 would localize differently. To allow GFP to enter the secretory pathway, we replaced the extracellular domain (ECD) of CD47 with GFP, while preserving the CD47 signal peptide, transmembrane domains (TMDs) and C-terminus, which we refer to as GFP-TM (Fig. 1e). We observed that GFP-TM encoded by an mRNA containing the long 3'UTR of CD47 (GFP-TM-LU) localizes primarily to the cell surface whereas GFP-TM encoded by an mRNA with the short 3'UTR of CD47 (GFP-TM-SU) localizes predominantly to the endoplasmic reticulum (Fig. 1f and Extended Data Fig. 1i). The localization results were confirmed by fluorescence-activated cell sorting (FACS) analysis, using an anti-GFP antibody on permeabilized and non-permeabilized cells to measure total and surface GFP levels, respectively (Fig. 1g). The localization step occurs at the protein level, as both the LU- and SU- containing GFP transcripts show a similar distribution near the perinuclear ER (Fig. 1h). Thus the LU isoform of CD47 encodes information that is necessary for cell surface expression of GFP-TM protein, in a manner independent of RNA localization.
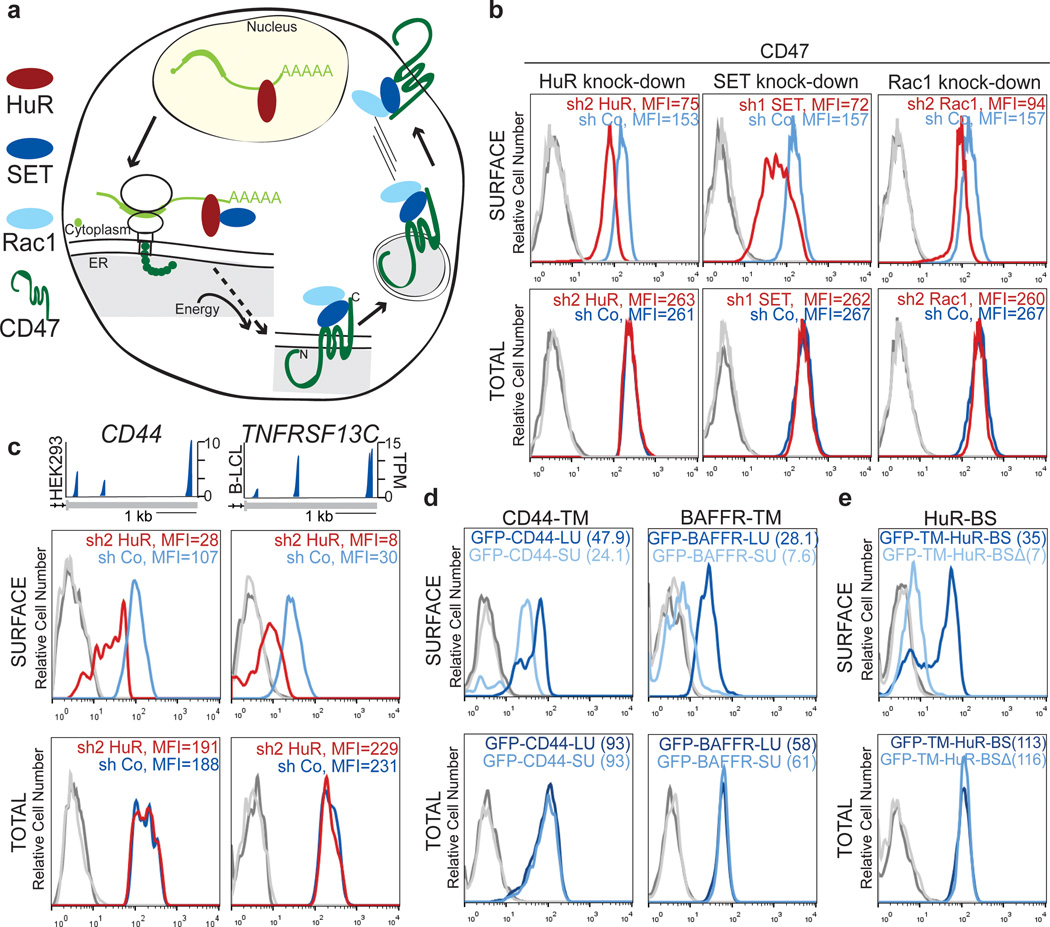
To address the mechanism of 3'UTR-dependent protein localization (UDPL; Fig. 2a), we reasoned there must be an RNA-binding protein (RBP) that binds to the long, but not the short, 3'UTR of CD47. The long 3'UTR of CD47 contains many uridine-rich elements (see later) which are potentially bound by HuR 6–9. HuR is known for its role in mRNA stabilization and translation activation 7,13,14. However, HuR KD by shRNAs did not affect CD47 mRNA abundance or isoform levels, nor did it affect total CD47 protein levels (Fig. 2b, bottom and Extended Data Fig. 1d, 2a–c). But, strikingly, KD of HuR reduced CD47 surface expression (Fig. 2b, top and Extended Data Fig. 2c). This suggests that for CD47, HuR mediates protein localization post-translationally.
Figure 2. 3'UTR-dependent protein localization (UDPL) depends on HuR, SET and RAC1, and mediates surface localization of membrane proteins.
(A) Model of UDPL. HuR binds to the long 3'UTR and recruits SET. During translation of CD47 mRNA this protein complex is targeted to the endoplasmic reticulum (ER) surface where SET binds to the newly translated cytoplasmic domains of CD47. This step likely requires energy. SET interacts with RAC1 and active RAC1 translocates SET and CD47 to the plasma membrane.
(B) FACS analysis of endogenous CD47 protein expression in HEK293 cells. Left panel is after transfection of control shRNA (shCo) or shRNAs against HuR (shown are all GFP+ cells). Middle and right panels depict cells stably expressing the indicated shRNAs. Surface CD47 (top) and total CD47 protein (bottom) were measured.
(C) 3'-seq analysis for CD44 in HEK293 cells and for TNFRSF13C in B-LCL cells, as shown in Fig. 1b. FACS analysis of endogenous CD44 protein in HEK293 cells (left) and endogenous BAFFR protein in SHSY-5Y cells (right) shown as in b (left).
(D) Left, FACS analysis of GFP after transfection of constructs containing a signal peptide and GFP fused to the TMD and C terminus of CD44 and either the long 39UTR (dark blue line) or the short 3'UTR(light blue line) in U251 cells. Right, as in left panel, but for BAFFR with transfection into HeLa cells.
(E) FACS analysis of GFP expression shows that HuR-BS is sufficient for surface localization of GFP-TM (dark blue line). Deletion of the binding sites from the HuR-BS construct (HuR-BSΔ) abrogates GFP surface expression (light blue line).
For b, c, d and e surface and total protein expression were determined and shown as in Fig. 1g. Representative images from three (sh2 HuR, n = 5) biological replicates.
Beyond the role of HuR as an RBP 6–9, HuR interacts through protein–protein interactions with SET, ANP32A and ANP32B 4. Nuclear SET binds to histone tails and prevents acetylation 15, but phosphorylated SET localizes to the cytoplasm and the surface of the endoplasmic reticulum 5,16. Also, SET interacts with RAC1, and active RAC1 translocates SET to the plasma membrane 5. In our model of UDPL (Fig. 2a), HuR binds to the long 3'UTR of CD47 and recruits SET. Upon targeting of the mRNA to the ER surface, the scaffold function of the 3'UTR results in local recruitment of SET to the site of translation. After translation of CD47 mRNA, the ECD is located in the ER lumen, whereas its C-terminus is cytoplasmic. This allows SET to interact with the newly translated cytoplasmic domains of CD47 and to translocate CD47 to the plasma membrane via active Rac1. Transfer of SET from CD47 mRNA to CD47 protein likely requires energy input, as has been shown for transfer of the signal peptide from the signal recognition particle to the translocation channel 17. In this model of UDPL, surface expression of CD47-LU depends on SET and active RAC1. And indeed, knockdown of SET or RAC1 by shRNAs reduced surface expression of CD47 without affecting overall CD47 levels (Fig. 2b and Extended Data Fig. 2c–e).
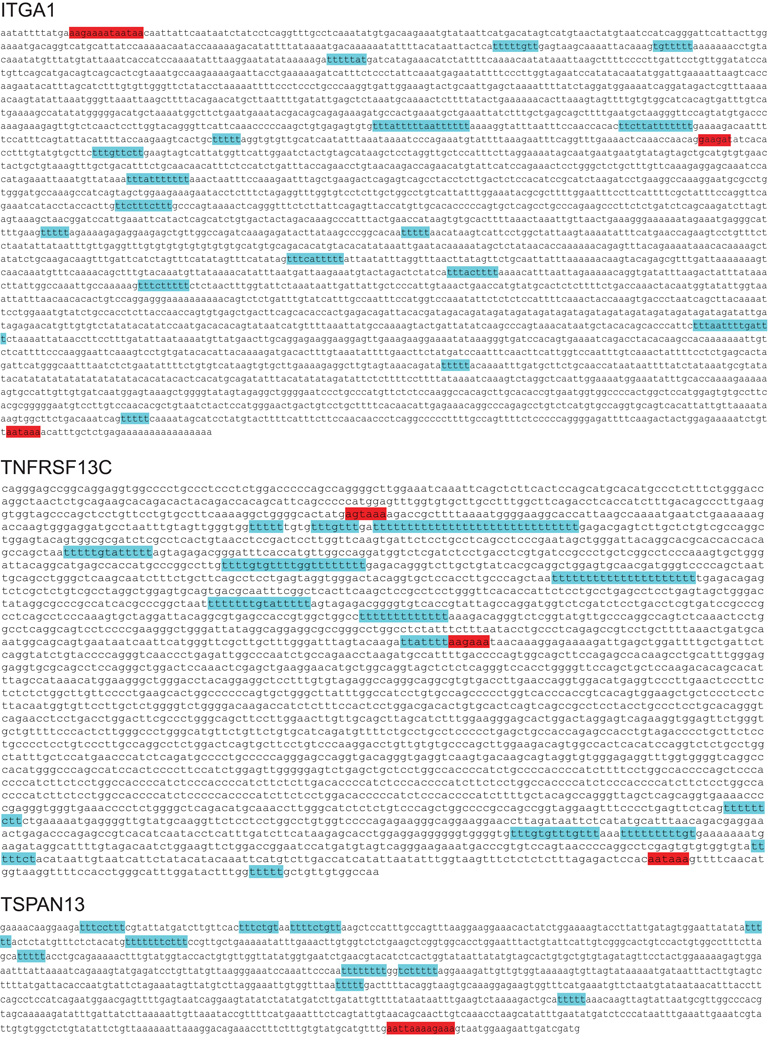
To determine if UDPL is a more widespread phenomenon, we examined the localization of four additional transmembrane proteins which are derived from mRNAs with 3'UTR isoforms that can be bound by HuR 6–8 (Extended Data Fig. 3, 4). TSPAN13 has only one 3'UTR isoform, whereas the other three genes [CD44, ITGA1, TNFRSF13C (encoding BAFF receptor, BAFFR)] use ApA to generate alternative 3'UTR isoforms (Fig. 2c and Extended Data Fig. 2a, f) 3. As was the case for CD47, KD of HuR decreased surface expression of all four proteins without changing total protein levels (Fig. 2c and Extended Data Fig. 2f). As was done for CD47, we generated GFP-fused LU and SU constructs for CD44, ITGA1, and TNFRSF13C with their respective TMDs, C-termini and 3'UTRs. For all tested genes, the longer 3'UTR increased surface localization of GFP-TM (Fig. 1f–h, 2d and Extended Data Fig. 2g). This demonstrates that UDPL has the potential to be a widespread phenomenon.
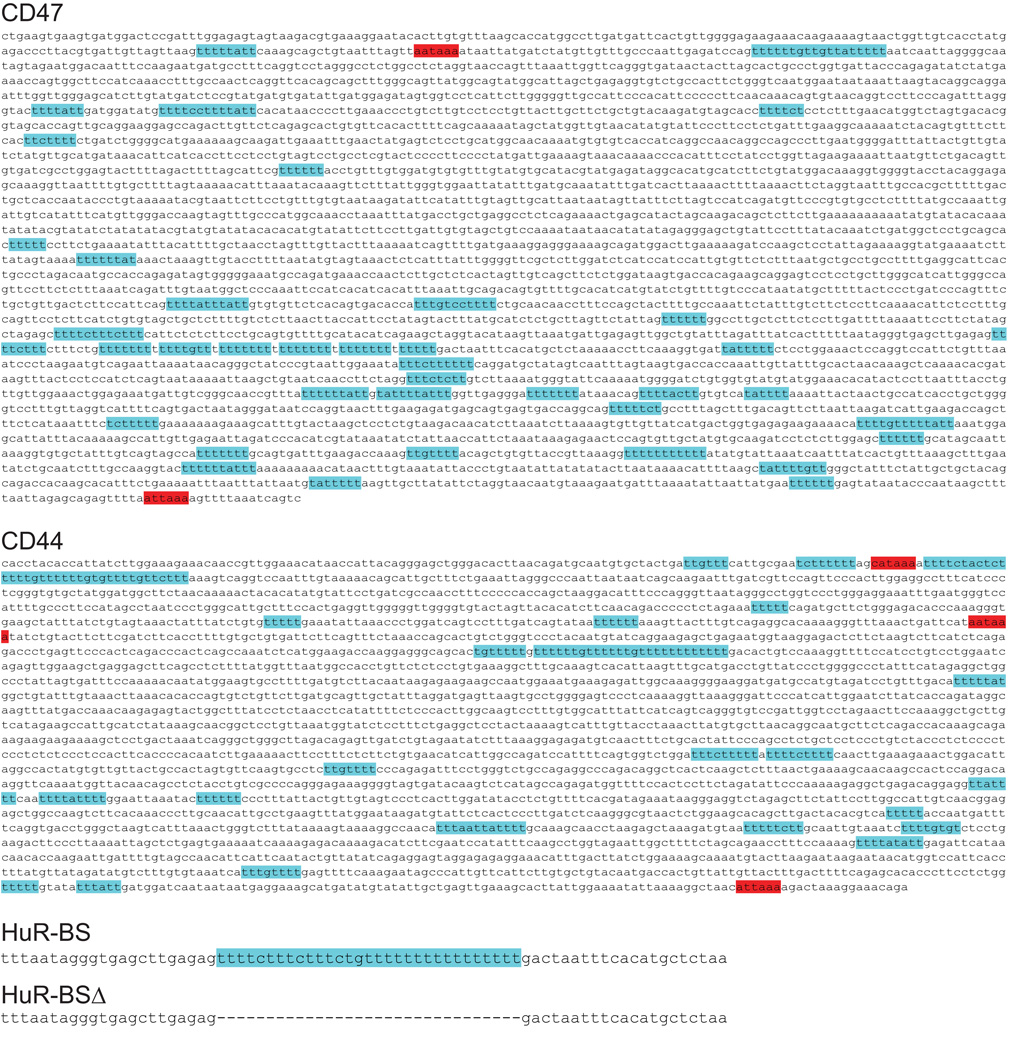
The 3' UTR of CD47 contains over 30 putative HuR-binding sites (Extended Data Fig. 3). We tested whether a 3'UTR with a few HuR-binding sites (HuR-BS) (Extended Data Fig. 3) is enough to mediate surface localization. Indeed, the uridine-rich sequence was necessary and sufficient for surface localization of GFP-TM, although it was less potent than the full-length 3'UTR of CD47 (Fig. 2e).
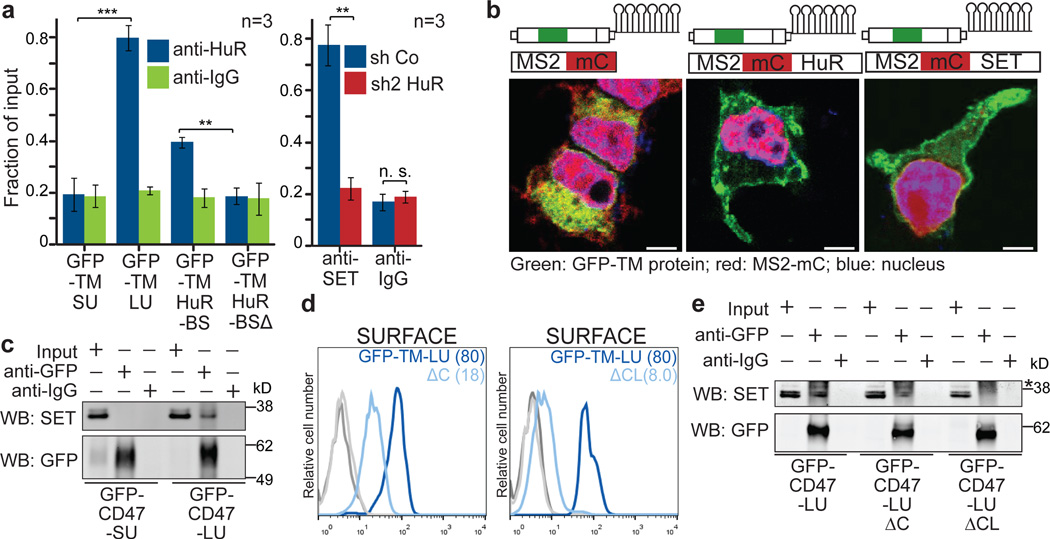
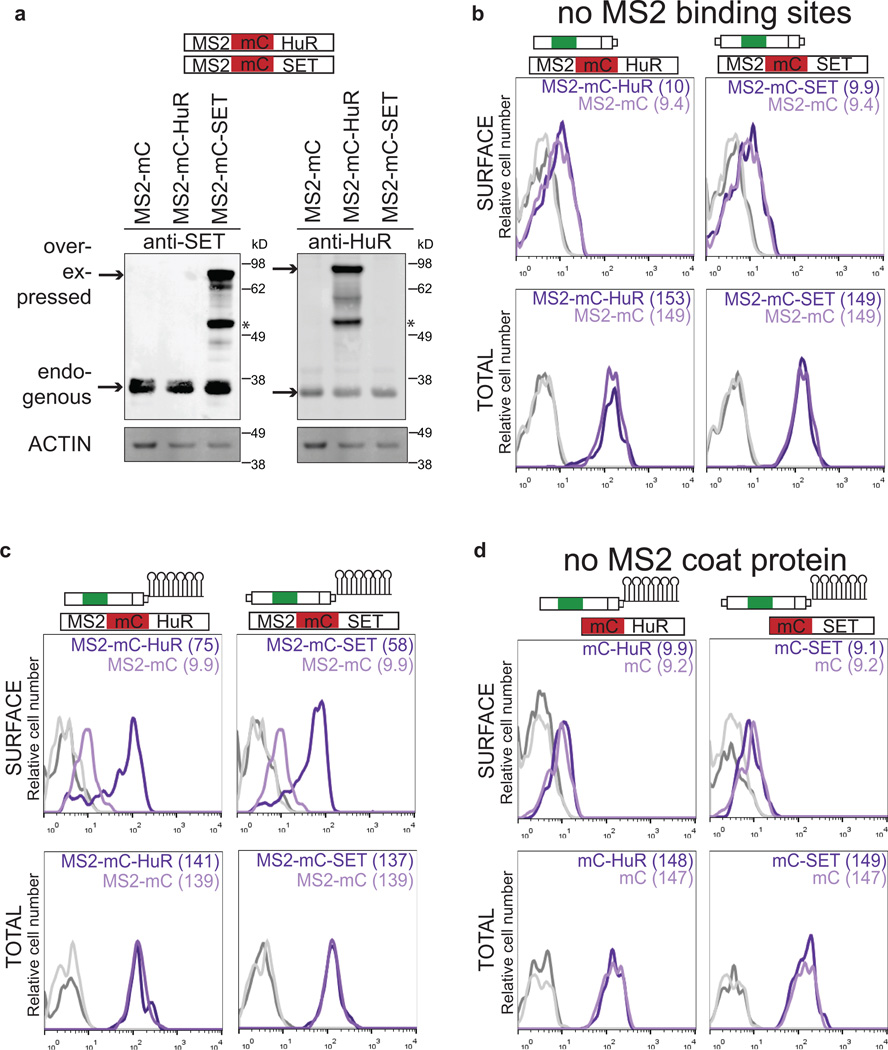
Next, we investigated each step of our UDPL model in more detail. We demonstrated by RNA immunoprecipitation (RNA-IP) that HuR binds to the HuR-BS and to the LU but not to the SU isoform of CD47 (Fig. 3a, left). SET also associates with the long 3'UTR of CD47, which is dependent on HuR (Fig. 3a, right). SET or HuR overexpression was insufficient to localize GFP-TM-SU to the cell surface (Extended Data Fig. 5a, b). However, tethering of SET or HuR to the short 3'UTR isoform of CD47 was sufficient to redirect GFP-TM localization from the ER to the plasma membrane (Fig. 3b and Extended Data Fig. 5c, d; see Extended Data Fig. 5 for experimental details). This indicates that local recruitment of SET to the site of translation, mediated by the scaffold function of the long 3'UTR, is required for UDPL.
Figure 3. Mechanism of UDPL.
(A) Left, RNA-immunoprecipitation after transfection of the indicated constructs into HEK293 cells. Protein-RNA complexes were pulled-down with anti-HuR antibody and GFP abundance was normalized to GAPDH and is shown as fraction of input. Right, RNA co-immunoprecipitation after transfection of the indicated shRNAs. Protein-RNA complexes were pulled down with anti-SET antibody and the abundance of CD47-LU was normalized to GAPDH and is shown as fraction of input. Shown is mean ± s.d., n = 3 biological replicates. ***P < 0.0003, **_P_ < 0.002, NS, not significant, (_P_ > 0.05), two-sided t-test for independent samples.
(B) MS2-binding sites (see Extended Data Fig. 5) were added to GFP-TM-SU and co-transfected with MS2-mC (left), MS2-mC-HuR (middle) or MS2-mC-SET (right). mC, mCherry. Fluorescence confocal microscopy of HEK293 cells after transfection of indicated constructs shows that recruitment of HuR or SET to the short 3'UTR redirects localization of GFP protein from the endoplasmic reticulum to the cell surface. Representative images from hundreds of cells. Scale bars, 10 µm.
(C) Co-immunoprecipitation of endogenous SET using anti-GFP antibody after transfection of CD47-SU or CD47-LU in HEK293 cells (for constructs, see Fig. 4a). 2% of input was loaded.
(D) FACS analysis of surface GFP expression after transfection of GFP-TM-LU (dark blue line), GFP-TM-LU with a C-terminal deletion (ΔC; light blue line; left) or with destruction of both SET-binding sites (ΔC and K163A, K166A, K175A; ΔCL; light blue line, right). Shown as in Fig. 1g. Representative image from more than four experiments.
(E) Co-immunoprecipitation of endogenous SET using anti-GFP antibody after transfection of the indicated constructs. 2% of input was loaded. Asterisk indicates unspecific band.
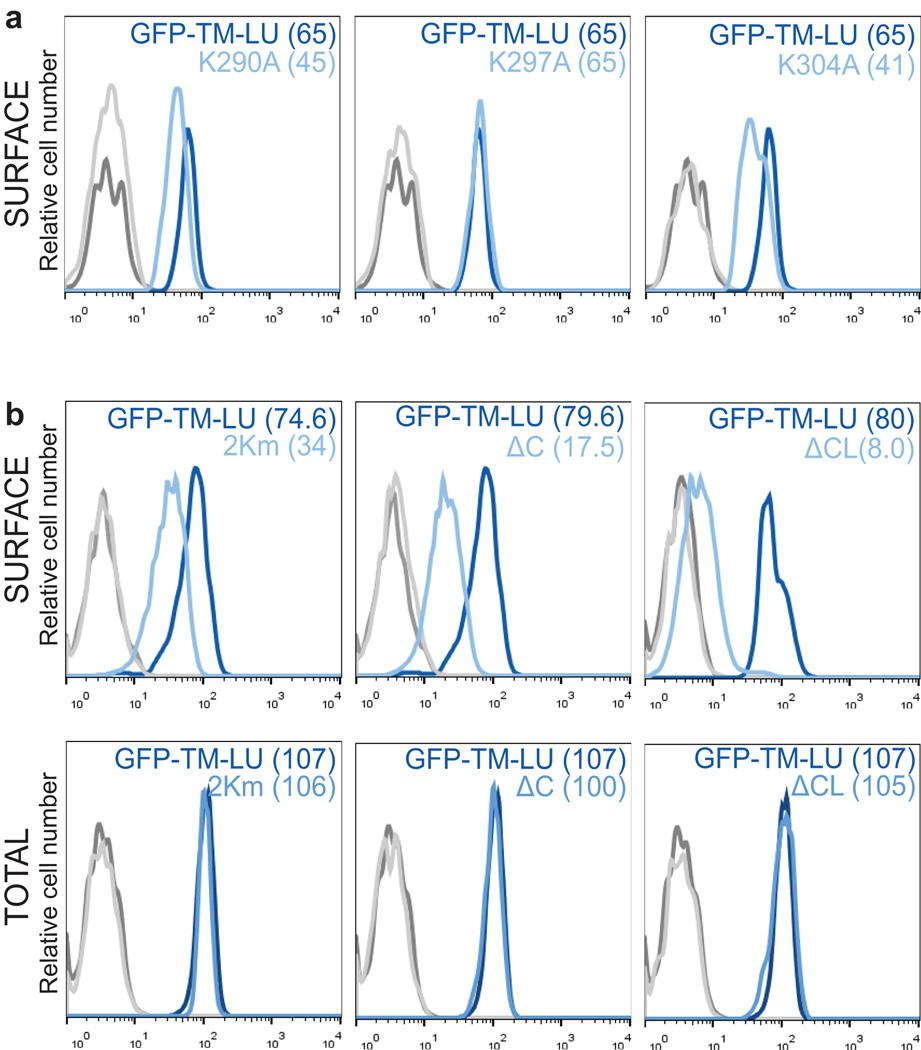
Furthermore, by co-immunoprecipitation we demonstrated that endogenous SET only interacts with CD47-LU protein, but not with CD47-SU protein (Fig. 3c). Since SET binds to lysine residues 18, we mutated single lysines in the C-terminus of CD47 which decreased GFP-TM surface localization by up to 37% (Extended Data Fig. 6a). Mutation of 2/5 lysines decreased it by more than 50% and deletion of the entire C-terminus decreased it by 80% (GFP-TM-LUΔC; Fig. 3d and Extended Data Fig. 6b). Additional mutation of three lysines in the first cytoplasmic loop abolished surface GFP expression (GFP-TM-LUΔCL; Fig. 3d and Extended Data Fig. 6b). The reduction in surface expression is likely due to partial or complete loss of SET binding to CD47, as demonstrated by co-IP (Fig. 3e).
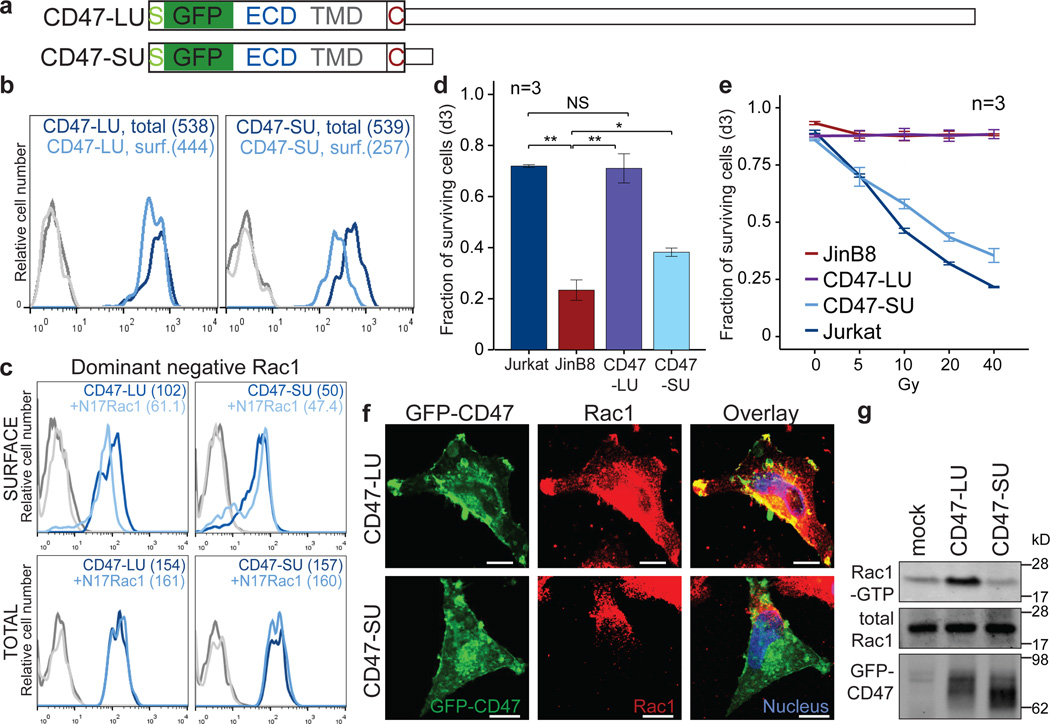
To test if the difference in surface localization has phenotypic consequences, we added the ECD of CD47 to the GFP constructs (called CD47-LU or CD47-SU; Fig. 4a). Both constructs resulted in comparable overall CD47 protein levels (Extended Data Fig. 7a). CD47-LU efficiently localized to the cell surface via UDPL mediated by active RAC1 (Fig. 4b, c and Extended Data Fig. 7b). Whereas GFP expressed from the GFP-TM-SU construct nearly completely localized to the endoplasmic reticulum (Fig. 1f–h), CD47-SU primarily localizes to the endoplasmic reticulum, but also localizes partially to the cell surface, but independently of active RAC1 (Fig. 4b, c).
Figure 4. CD47 protein has different functions dependent on whether it was generated by the SU or LU isoform.
(A) To generate GFP-CD47, GFP was inserted in frame between the signal peptide and the rest of the CD47 open reading frame. GFP-CD47 was fused with either the long or short CD47 3'UTR, called CD47-LU and CD47-SU respectively.
(B) FACS analysis of surface (surf.; light blue) and total (dark blue) GFP–CD47 expression in transfected JinB8 cells. Shown as in Fig. 1g. Representative images from four experiments.
(C) FACS analysis of GFP expression after transfection of CD47-LU or CD47-SU with or without co-transfection of dominant-negative RAC1 (N17RAC1). Shown as in Fig. 1g. Representative images from n = 7 (LU) and n = 2 (SU) experiments.
(D) Fraction of Mitomycin C-treated cells that survived at d3 after co-culture with macrophages is displayed for Jurkat, JinB8 (CD47−/−) and the GFP+ JinB8 cells after nucleofection of CD47-LU or CD47-SU. Shown is mean ± s.d., n = 3 biological replicates. **P < 0.005, *_P_ < 0.02, NS, not significant (_P_ > 0.05), two-sided t-test for independent samples.
(E) The fraction of surviving cells (TO-PRO3 negative) measured by FACS analysis at day 3 after γ-irradiation is shown for the same populations as in (d). Shown is mean ± s.d., n = 3 biological replicates of the 20% of cells with the highest GFP expression. Gy, Gray.
(F) Fluorescence confocal microscopy of permeabilized U251 cells after transfection of CD47-LU or CD47-SU co-stained with anti-RAC1 antibody. Yellow indicates co-localization. Representative images from hundreds of cells. Scale bars, 10 µm.
(G) Immunoprecipitation of endogenous RAC1–GTP (active RAC1) in HEK293 cells after transfection of CD47-LU, CD47-SU, or empty vector. Total RAC1 and GFP–CD47 were measured from input. n=3 biological replicates.
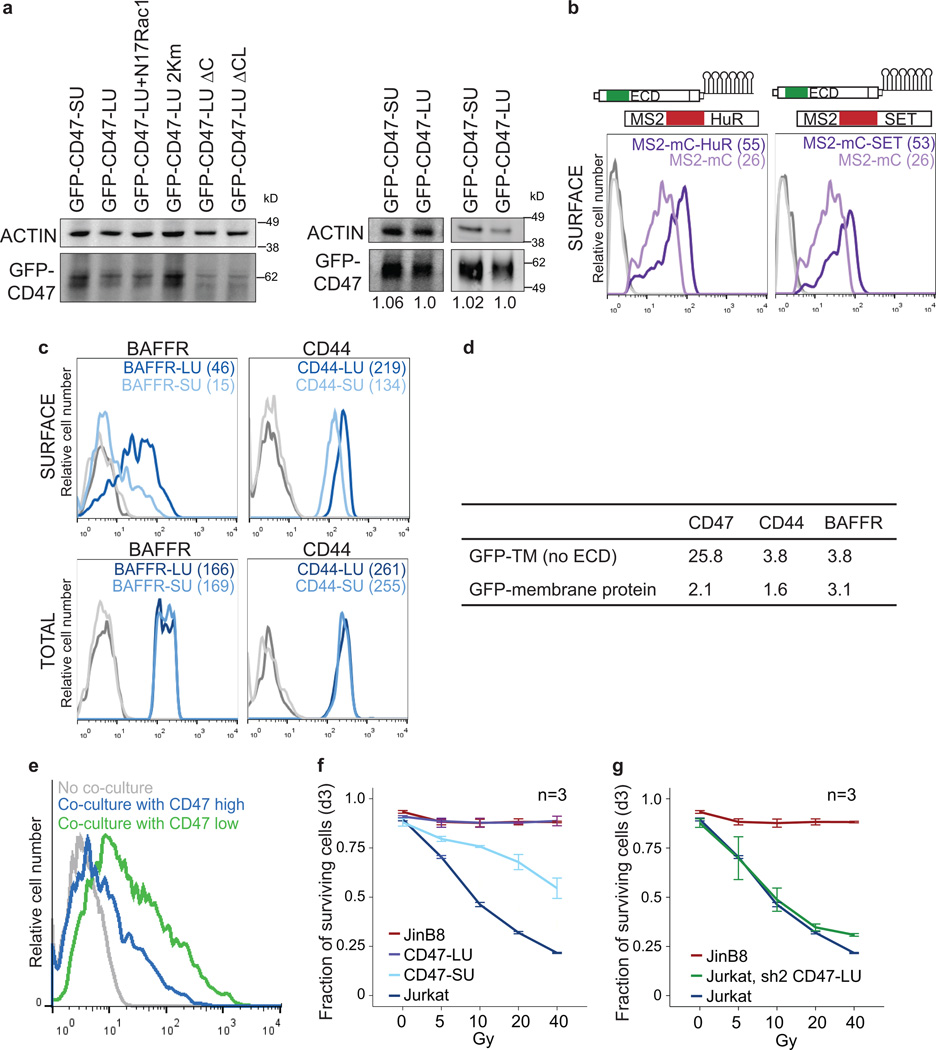
We added the respective ECDs to CD44 and BAFFR, which also increased surface expression of their SU isoforms compared with their GFP-TM isoforms, but to a lesser extent than was observed for CD47 (Extended Data Fig. 7c, d). Di- or multimerization of cell surface receptor subunits, which often occurs through their ECDs, is a common strategy for overcoming ER retention, because it results in masking of ER retention signals 19. We speculate that CD47-SU, CD44-SU and BAFFR-SU might use such a mechanism (though the multimerization partners are unknown) for their partial surface expression. In the case of BAFFR the ECD only increased surface expression by 1.2-fold indicating that BAFFR strongly depends on UDPL for surface expression (Extended Data Fig. 7d). This is supported by the absence of BAFFR on B cells in Rac-deficient mice 20. Taken together, our data suggests that membrane proteins rely on UDPL for surface expression to varying degrees.
Cells with high CD47 surface levels are protected from phagocytosis by macrophages (Extended Data Fig. 7e) 12. To examine if the difference in surface expression of CD47-LU and CD47-SU protects cells to a different extent from phagocytosis, we used CD47-deficient Jurkat cells (called JinB8 cells 21) and expressed similar total amounts of CD47-LU or CD47-SU (Extended Data Fig. 7a). Co-culture of these cells with macrophages demonstrated that CD47-LU fully protected the cells, whereas CD47-SU only partially protected the cells from phagocytosis (Fig. 4d).
CD47 also functions in the regulation of apoptosis 22, as JinB8 cells or tissues from Cd47 knock-out mice 23 fail to undergo apoptosis after γ-irradiation 24,25. Interestingly, expression of CD47-SU in JinB8 cells restored apoptosis, but expression of CD47-LU did not affect the loss-of-apoptosis phenotype (Fig. 4e and Extended Data Fig. 7f, g). Thus, when a cell requires increased CD47 surface expression, transcriptional upregulation alone would be non-optimal as it would confer increased susceptibility to apoptosis. ApA-generated 3'UTR isoforms allow independent regulation of differentially localized and functionally distinct CD47 protein.
As the surface localization of CD47-SU is RAC1-independent, it also does not co-localize with RAC1 at the plasma membrane (Fig. 4f). In contrast, CD47-LU shows strong co-localization with RAC1 at lamellipodia (Fig. 4f). Both activated RAC1 and CD47 are necessary for efficient cell migration and activated RAC1 localizes to the leading edge of migrating cells 5,23,26. We show that only the expression of CD47-LU resulted in changes in cell morphology with the generation of lamellipodia at the leading edge of cells. Furthermore, CD47-LU, but not CD47-SU resulted in increased active RAC1 (Fig. 4g) which suggests that CD47-LU may cooperate with RAC1 during cell migration. Thus, CD47 protein localized to the same cellular compartment, but produced by the SU or LU mRNA isoforms, can exert different functions. It is currently not known if other surface proteins derived from their LU or SU isoforms also have distinct biological roles.
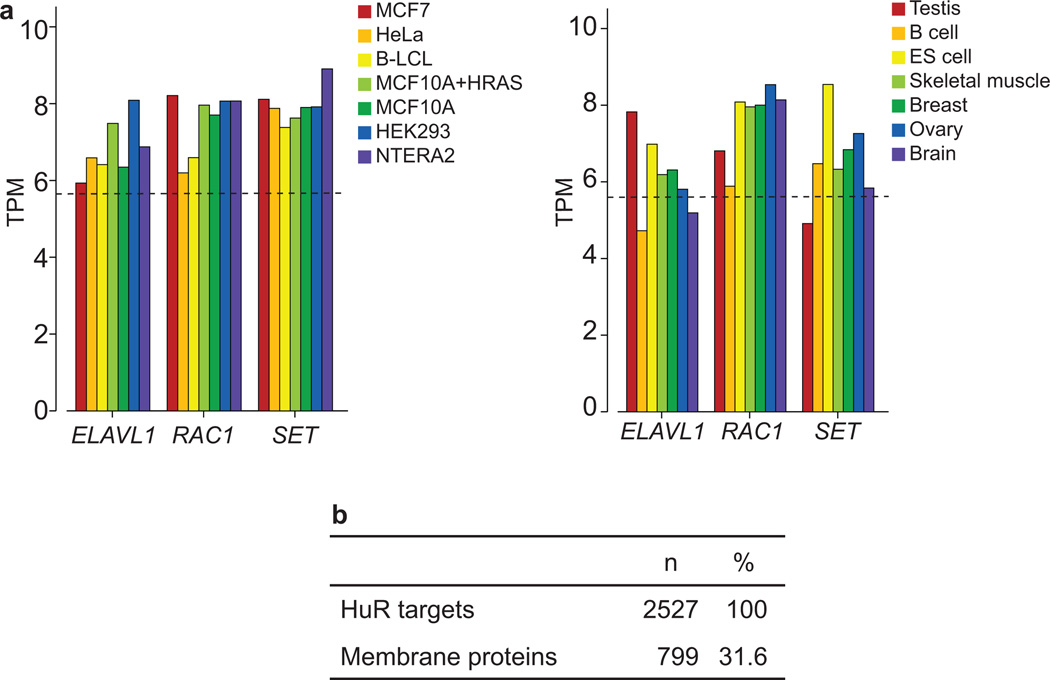
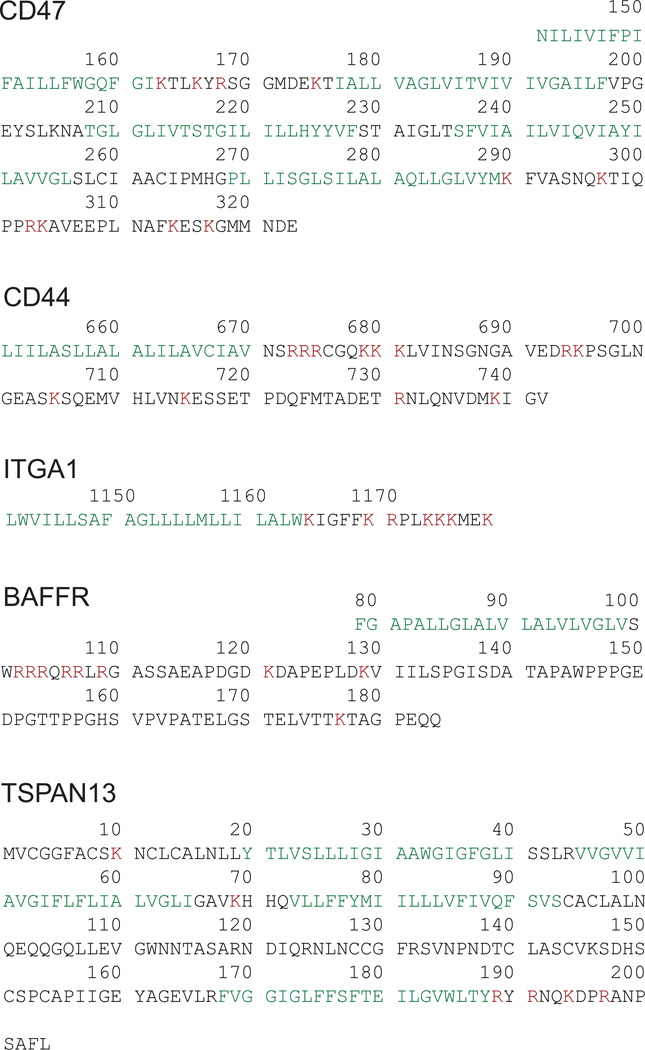
We propose that UDPL is a widespread mechanism for surface expression of membrane proteins. All currently known components of the pathway (HuR, SET and RAC1) are ubiquitously and highly expressed (Extended Data Fig. 8a) 3. UDPL requires the presence of HuR-binding sites in the 3'UTR and SET-binding sites in the cytoplasmic domains of membrane proteins (Extended Data Figs 3, 4 and 9). All candidates tested so far that met both requirements used UDPL for surface expression (Figs 1f–h, 2d, 4b and Extended Data Figs 2g, 7c). HuR-binding sites are highly abundant as HuR binds to thousands of mRNAs6–9, with a third of them being membrane proteins (Extended Data Fig. 8b). Although the SET-binding motif is currently unknown, we (Fig. 3d, e and Extended Data Fig. 6) and others have shown that SET binds to positively charged amino acids in histone tails or cytoplasmic domains of membrane proteins 18,27. According to the positive-inside rule for integral membrane proteins, the cytoplasmic domains of membrane proteins are enriched in positively charged amino acids for topological reasons 28. Therefore, potential SET-BS in cytoplasmic domains of membrane proteins are very widespread.
So far, efforts to determine the consequences of alternative 3'UTRs have largely focused on mRNA stability and translation 1,2,29. We expand the known functions of 39UTRs and show that they can act as scaffolds for RBPs that serve as adaptors to recruit effector proteins to the site of translation, which determines subcellular protein localization and function. With respect to CD47, CD44, ITGA1, TSPAN13 and BAFFR, the adaptor protein is HuR and the effector protein is SET. We further speculate that the scaffold function of 3'UTRs may extend beyond the regulation of membrane proteins. RBPs could recruit other effector proteins, for example, enzymes that post-translationally modify proteins, as was shown for long non-coding RNAs 30. We showed here that CD47 produced by alternative 3'UTR isoforms localizes to different cellular compartments and has independent and sometimes opposite functions with respect to cell survival and cell migration. Thus, through generation of alternative 3'UTR isoforms, ApA contributes to functional diversity of the proteome without changing the amino acid sequence.
Online Methods
Cell lines
MCF7 (breast cancer), HeLa (cervical cancer), HEK293 (embryonic kidney), Caov-3 (ovarian carcinoma), NTERA2 (embryonic carcinoma) and THP-1 cells (monocytic leukemia) were purchased from ATCC. B-LCL are Epstein Barr virus (EBV)-immortalized human B cells described earlier 3. U2OS cells (sarcoma) were a gift from Thijn Brummelkamp (Netherlands Cancer Institute, Netherlands), Toledo (B cell lymphoma) cells were a gift from Markus Mueschen (UCSF), U251 (glioblastoma) cells were a gift from Ingo Mellinghoff (MSKCC), SHSY-5Y (neuroblastoma) cells were a gift from Thomas Tuschl (Rockefeller University) and Jurkat (T cell leukemia) and JinB8 (CD47-negative Jurkat) cells were a gift from William Frazier (Washington University).
Constructs
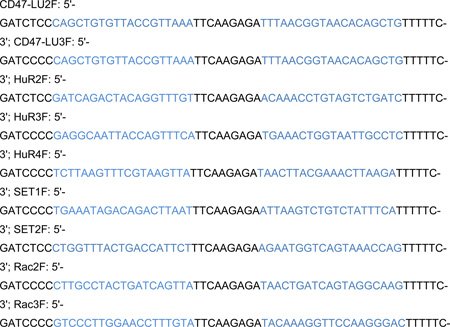
For some of the shRNA knockdown experiments, pSUPERretropuro was modified by cloning IRES::GFP (derived from pMSCVpig) 2 downstream of puromycin in order to obtain pSUPERretropuro containing enhanced (e)GFP (shRNA-GFP). The following DNA oligonucleotides served as shRNA precursors and were cloned into pSUPER-GFP or pSUPER:
The sequence of shRNA1 SET and of shRNA Control were published earlier 31,32. The GFP-fusion constructs were generated in pcDNA3.1 expression vector (Life Technologies). The short and long 3'UTRs of CD47 were PCR-amplified from genomic DNA using Q5 High Fidelity DNA polymerase (NEB) and the primers listed below and inserted between the NotI and XbaI sites. To obtain expression of only the long 3'UTR isoform of CD47, the proximal polyadenylation site was mutated from AAUAAA to ACUCAA using the QuikChange Multi Site Directed Mutagenesis Kit (Agilent). The resulting plasmids were used to test qPCR primers for accuracy in measuring short to long 3'UTR isoform ratios (see later). The short 3'UTR of CD47 used in the MS2-BS construct was cloned from the plasmid containing the long 3'UTR with the mutated proximal polyadenylation site. eGFP was PCR-amplified from pMSCV-pig and inserted upstream of each CD47 3'UTR (BamHI, NotI). The signal peptide of CD47 was generated by annealing two DNA oligonucleotides which were inserted into the BamHI site. To generate the GFP-TM constructs, the sequence of the TMDs and C-terminal tail of CD47 (the longest isoform, isoform 4 33) were cloned from Toledo cDNA and inserted downstream of eGFP (BsrgI, NotI). Isoform 4 was chosen as it is the most abundant isoform in Jurkat cells (data not shown). The two nucleotides of eGFP that occur after the BsrgI site were included in the forward primer. To generate the GFP-CD47 constructs, the ECD, TMDs and C-terminus of CD47 were PCR-amplified from Toledo cDNA using the TM reverse primer and the CDS forward primer and inserted downstream of eGFP (BsrgI, NotI). The sequence of HuR-BS and HuR-BSΔ are shown in Extended Data Fig. 3 and replaced the long 3'UTR in GFP-TM-LU. The GFP constructs containing the TMDs and C-termini fused to either the long or short 3'UTRs of CD44, ITGA1, and TNFRSF13C were generated as follows. TMDs, C-termini and short 3'UTRs of CD44, ITGA1 and TNFRSF13C were cloned from Toledo, SHSY-5Y and B-LCL cDNA respectively and inserted downstream of eGFP (BsrgI, XbaI). Short 3'UTRs consisted of the first 122 nucleotides of CD44, the first 45 nucleotides of ITGA1 and the first 337 nucleotides of TNFRSF13C. Long 3'UTRs: 3068 nucleotides after the stop codon of CD44 and 3996 nucleotides after the stop codon of ITGA1 were used. For TNFRSF13C , 1221 nucleotides after the stop codon together with the last 600 nucleotides of the 3'UTR (nucleotides 2712 – 3311 after the stop codon containing the majority of HuR-binding sites) were used as long 3'UTR and were cloned from genomic DNA. To generate BAFFR-SU and -LU, the complete open reading frame of TNFRSF13C (without the start codon) was amplified from human B cell cDNA and cloned using Gibson Assembly Cloning (NEB) into pcDNA3.1 vector used above downstream of eGFP. To generate CD44-SU and -LU, the open reading frame of CD44 (without the start codon) was amplified from cDNA of the human breast cancer cell line MDA-MB231 and cloned using Gibson Assembly Cloning (NEB) into pcDNA3.1 vector used above downstream of eGFP. To generate the GFP-TM-LUΔC construct the sequence of just the TMDs of CD47 was cloned from Toledo cDNA using the TM forward primer and TMΔC reverse primer and inserted downstream of eGFP (BsrgI, NotI). The 24 MS2-binding sites were cloned from a plasmid obtained from Jeffrey Gerst (Weizman Institute) 34 using the primers listed below (XbaI, ApaI). The constructs in which K163, K166, K175, K290, K297 and K304 were mutated to alanines were generated using the QuikChange Multi Site Directed Mutagenesis Kit (Agilent).
CD47UTRF: 5'-ATGCGCGGCCGCAGTGAAGTGATGGACTCCGATT-3'; CD47shortUTRR: 5'-ATGCTCTAGATGGGCAAACAACATAGATCA-3'; CD47longUTRR: 5'-ATGCTCTAGAAACACATTGGACTGATTTAAAACTT-3'; GFPF: 5'-ATGCGGATCCATGGTGAGCAAGGGCGA-3'; GFPR: 5'-ATGCGCGGCCGCTTACTTGTACAGCTCGTCCATG-3'; SPCD47F: 5'-GATCCATGTGGCCCCTGGTAGCGGCGCTGTTGCTGGGCTCGGCGTGCTGCGGATCAGCTG-3'; SPCD47R: 5'-GATCCAGCTGATCCGCAGCACGCCGAGCCCAGCAACAGCGCCGCTACCAGGGGCCACATG-3'; CD47TMF: 5'-ATGCTGTACAAGATTCTTATTGTTATTTTCCCAATT-3'; CD47TMR: 5'-ATGCGCGGCCGCTTATTCATCATTCATCATTCCTT-3'; CD47CDSF: 5'-ATGCTGTACAAGCAGCTACTATTTAATAAAACAA-3';
TMΔCR: 5'-ATGCGCGGCCGCTTATTTCATATAAACTAGTCCAAGTAA-3' MS2-BSF: 5'-ATGCTCTAGAGGGCCCTATATATCGATCCTAAG-3'; MS2-BSR: 5'-ATGCGGGCCCTTTATTATGCTTGGTACCGAGCTCG-3'
To create the MS2 fusion constructs 35, the pUG34-MS2-GFP-SBP plasmid was obtained from Jeffrey Gerst 34. SBP was replaced by either HuR, SET or a stop codon. HuR and SET were PCR-amplified from U2OS cDNA using the primers listed below (BsrgI, XbaI). The stop codon was generated by annealing two DNA oligonucleotides (BsrgI, XbaI). mCherry was PCR-amplified and replaced GFP (BamHI, BsrgI). After cloning was complete, all plasmids were sequenced to assure fidelity of the sequences.
HuRF: 5'- ATGCCGTACGAGTCTAATGGTTATGAAGACCACA-3'; HuRR: 5'- ATGCTCTAGATTATTTGTGGGACTTGTTGGT-3'; SETF: 5'- ATGCTGTACAAGTCGGCGCCGGCGGCCAAA-3'; SETR: 5'- ATGCTCTAGATTAGTCATCTTCTCCTTCATCCTC-3'; StopF: 5'- GTACAAGTAATAATAAT-3'; StopR: 5'- CTAGATTATTATTACTT-3'; mCherryF: 5'-ATGCGGATCCGTGAGCAAGGGCGAGGAG-3'; mCherryR: 5'-TTACTTGTACAGCTCGTCCATGC-3'
The N17RAC1 construct was provided by Alan Hall (MSKCC) 36.
Transfections
For transfections into U2OS, HEK293, HeLa and U251 cells Lipofectamine 2000 (Invitrogen) and for SHSY-5Y cells Xtreme reagent (Roche) was used. JinB8 and Jurkat cells were transfected using the Neon Transfection System (Invitrogen) according to the manufacturer’s protocol for transfecting Jurkat cells. To account for differences in the sizes of transfected plasmids the same molar amounts were transfected. When RNA was to be extracted, the cells were grown in the presence of high amounts of puromycin (4 mg/ml) for three days and FACS analysis was performed to ensure that >90% of the cells were GFP+.
Generation of cell lines with stable expression of shRNAs
Stable cell lines were generated as described previously 2.
FACS analysis
For surface FACS (in order to detect surface protein expression), cells were incubated with mouse anti-CD47-PerCy5.5 (BD Biosciences, 561261), mouse anti-CD44-PE (BD Biosciences, 561858), chicken anti-GFP (Abcam, ab13970), mouse anti-ITGA1-PE (BD Biosciences, 555749), mouse anti-BAFFR-PE (BD Biosciences, 554680) or rabbit anti-TSPAN13 (Genetex, GTX52155) in FACS buffer A (0.5% FBS in PBS) for 30 minutes at 4°C, and then washed twice in FACS Buffer A. For detection of GFP and TSPAN13, cells were then incubated with goat anti-chicken alexa fluor 568 (Invitrogen, A11041) and goat anti-rabbit alexa fluor 680 (Invitrogen, A-21076) respectively, for 30 minutes at 4°C, and then washed twice in FACS Buffer A. At least 30,000 cells were analyzed on a BD FACSCalibur cell analyzer (BD Biosciences) and FACS data was computed using the FlowJo VX software.
For intracellular FACS (in order to detect total protein expression), cells were fixed for 15 minutes at room temperature (RT) in fixation buffer (4% PFA, 0.02% sodium azide, and 0.1% Tween 20 in PBS), washed in FACS buffer B (0.02% sodium azide, 0.1% Tween 20 in PBS), permeabilized for 10 minutes at 4°C in permeabilization buffer (0.02% sodium azide, 0.1% Tween 20 and 10% dimethyl sulfoxide in PBS), washed, re-fixed for 5 minutes at RT in fixation buffer, and washed again. Cells were incubated with the same primary and secondary antibodies as for surface FACS in FACS buffer B for 30 minutes at 4°C, and then washed twice in FACS Buffer B. For live/dead analysis by FACS, cells were incubated with TO-PRO3 in FACS buffer A (0.5% FBS in PBS) for 10 minutes at 4°C, and then washed twice in FACS Buffer A. Cells were analyzed is the same manner as for surface FACS.
For all the GFP expressing plasmids the 20% of cells with the highest GFP expression are shown.
Immunocytochemistry
For surface staining of CD47, cells were fixed for 15 minutes at RT in fixation buffer A (4% PFA and 0.02% sodium azide in PBS), washed with PBS, blocked for 15 minutes at 4°C in 5% Normal Goat Serum (Invitrogen, PCN5000) in PBS and then incubated with mouse anti-human CD47 (Santa Cruz, sc-59079) primary antibody for 1 hour at 4°C in PBS. Following washing in PBS, donkey anti-mouse alexa fluor 594 (Invitrogen, A-21203) secondary antibody was incubated for 1 hour at 4°C in PBS, and during the last 10 minutes of incubation DAPI (Invitrogen, D1306) was added, followed by three washes of PBS. Mowiol mounting media (Sloan Kettering Institute, Molecular Cytology Core Facility) was used to mount the slides. Imaging was performed at the Sloan Kettering Institute Molecular Cytology Core Facility, on a Leica TCS SP5 confocal microscope, using a 63x, 1.4 numerical aperture oil objective.
For intracellular staining of CD47, cells were fixed for 15 minutes at RT in fixation buffer B (4% PFA, 0.02% sodium azide, and 0.1% Tween 20 in PBS), washed in wash buffer (0.02% sodium azide, 0.1% Tween 20 in PBS), permeabilized for 10 minutes at 4°C in permeabilization buffer (0.02% sodium azide, 0.1% Tween 20 and 10% dimethyl sulfoxide in PBS), washed, re-fixed for 5 minutes at RT in fixation buffer B, washed and blocked for 15 minutes at 4°C in 5% Normal Goat Serum in wash buffer. Mouse anti-CD47 (Santa Cruz, sc-59079) primary antibody was incubated overnight at 4°C in wash buffer. The strong permeabilization and overnight staining were necessary to visualize intracellular CD47, as the CD47 antibody recognizes an epitope in the ECD of CD47 which is located in the lumen of the ER. Due to the extended treatment with a buffer containing Tween 20 the plasma membrane could no longer be visualized in these cells.
For co-staining of GFP with Calnexin or RAC1, the cells were fixed for 15 minutes at RT in fixation buffer B (4% PFA, 0.02% sodium azide, and 0.1% Tween 20 in PBS), washed with wash buffer B, blocked for 15 minutes at 4°C in 5% Normal Goat Serum (Invitrogen, PCN5000) in wash buffer and then incubated with rabbit anti-Calnexin (Santa Cruz, sc-11397) or mouse anti-RAC1 (Abcam, ab12048) primary antibodies for 1 hour at 4°C in wash buffer. Following washing, goat anti-rabbit alexa fluor 680 (Invitrogen, A-21076) or donkey anti-mouse alexa fluor 594 (Invitrogen, A-21203) secondary antibodies were incubated for 1 hour at 4°C in wash buffer, and during the last 10 minutes of incubation DAPI (Invitrogen, D1306) was added, followed by three washes. Mounting and imaging was performed as for the surface staining. Due to the lack of permeabilization and short period in Tween 20, the plasma membrane was still visible. When Calnexin was co-stained with endogenous CD47, the protocol for intracellular staining of CD47 was used and the plasma membrane was again not visible.
Alexa fluor 594 and 680 were pseudo-colored red and endogenous GFP and mCherry were imaged as they appear, without any antibody.
RNA-FISH
Custom Stellaris FISH Probes (Biosearch Technologies) were designed for the open reading frame of eGFP using the Stellaris Probe designer website, and with the assistance of Biosearch Technologies staff. The probes were conjugated to the Quasar 670 fluorochrome. Staining was carried out according to the manufacturer’s protocols. Briefly, 24 hours after transfection of the GFP-TM constructs cells were trypsinized and plated on Millicell EZ glass slides (Millipore) and allowed to grow over night. Cells were washed in PBS, fixed in 4% PFA at RT for 10 minutes and permeabilized in 70% ethanol at 4°C for 2 hours. Following washing, the probes were hybridized at 37°C for 4 hours, washed, incubated with DAPI at 37°C for 30 minutes, washed and mounted in Mowiol mounting media. Imaging was performed as for the surface immunostaining. RNA was pseudo-colored red, and GFP was imaged as it appears, without any antibody.
3'-seq
3'-seq reads of naïve B cells, B-LCL and HEK293 cells were analyzed and visualized as described previously 3.
Northern Blot analysis
Northern blots were performed as previously described 2.
CD47 probe F: 5'-TTGATGGAGCTCTAAACAAGTCC-3'; CD47 probe R: 5'-GAATAACCAATATGGCAATGACG-3'; GFP probe F: 5'-TAAACGGCCACAAGTTCAGC-3'; GFP probe R: 5'-CTTGTACAGCTCGTCCATGC-3'
Quantitative PCR
RNA was extracted using TRI Reagent (Ambion) according to the manufacturer’s protocol. cDNA was synthesized using random hexamers and the TaqMan Reverse Transcription Kit (Applied Biosystems). qRT-PCR was performed using the Power SYBR Green master mix (Applied Biosystems) on a 7500 HT Fast Real-Time PCR System (Applied Biosystems). Each reaction was performed in triplicate. The experiments were performed at least three times to obtain at least three biological replicates. The following primers were used to quantify total CD47 mRNA, the long 3'UTR isoform of CD47 and GAPDH for normalization.
CD47TotalF: 5'-AGTGATGGACTCCGATTTGG-3'; CD47TotalR: 5'-GGGTCTCATAGGTGACAACCA-3'; CD47LongF: 5'-AAGAGAACTCCAGTGTTGCT-3'; CD47LongR: 5'-ACGGTAACACAGCTGTAAAACA-3'; GAPDHF: 5'-ACAACTTTGGTATCGTGGAAGG-3'; GAPDHR: 5'-TATTTGGCAGGTTTTTCTAGACG-3'
To measure 3'UTR isoform expression by qRT-PCR and to take into account different affinities of primers, we generated a standard using plasmids that contained either the short or the long 3'UTR of CD47 (see earlier). We mixed together known quantities of the two plasmids ranging from 3:1 to 1:3 of short to long 3'UTR and performed qPCR on these mixtures to test the accuracy of our primer sets. The fraction of the long 3'UTR isoform corresponds to the 2CT difference. The log2 value of the CT difference corresponds to the fraction of the long 3'UTR isoform. The fraction of the short 3'UTR isoform was obtained by subtracting the fraction of the long 3'UTR isoform from the total CD47 mRNA.
Immunoprecipitation of RNA complexes and RT–PCR
GFP-TM-LU, GFP-TM-SU, GFP-TM-HuR-BS and GFP-TM-HuR-BSΔ were transfected into HEK293 cells and immunoprecipitation of protein-RNA complexes was carried out as previously described 37. RNA-IPs were performed with cross-linking to prevent re-association of HuR with mRNA after lysis 38. Briefly, cells were harvested and washed twice in cold PBS. Formaldehyde was added to a final concentration of 1% (v/v) and the cells were incubated at RT for 10 minutes. The reaction was quenched by addition of glycine to a final concentration of 0.25 M and incubated at RT for 5 minutes. Following centrifugation the cell pellet was washed twice in cold PBS and resuspended in RIPA buffer [25 mM Tris-HCl (pH=7.4), 150 mM NaCl, 1% NP-40, 1% Na-deoxycholate, 0.1% SDS, 1 mM EDTA, protease inhibitor cocktail (Roche, 04693124001)]. The mRNPs were solubilized by three rounds of sonication for 15 seconds each in a Misonix Ultrasonic Processor S-4000 at an output of 8–9 W. Insoluble material was removed by centrifugation. Lysates were pre-cleared by addition of magnetic protein A beads (Millipore, LSKMAGA10) and incubation for 30 minutes at 4°C with constant mixing. The pre-cleared lysate was divided into three parts. One portion was retained for the input control and anti-HuR (Millipore, 07–1735) or IgG (Santa Cruz, sc-2025) were added to the two other portions and incubated at 4°C for 2 hours. Magnetic protein A beads (Millipore, LSKMAGA10) were added and incubated at 4°C for 1 hour. The beads were washed five times with high stringency RIPA buffer (50 mM Tris-HCl (pH=7.4), 1 M NaCl, 1% NP-40, 1% sodium deoxycholate, 0.1% SDS, and 1 mM EDTA). The crosslinking was reversed by resuspending the beads in 50 mM Tris-Cl (pH=7.0), 5 mM EDTA, 10 mM DTT and 1% SDS, followed by incubation at 70°C for 45 minutes. RNA was extracted from the beads and buffer using TRI Reagent (Ambion) according to the manufacturer’s protocol, and cDNA was synthesized as previously described. qRT-PCR was carried out using primers for GAPDH (see earlier) and GFP, so as not to amplify endogenous CD47. The primers used were as follows: GFPF: 5'-TAAACGGCCACAAGTCAGC-3'; GFPR: 5'- AAGTCGTGCTGCTTCATGTG-3';
HEK293 cells transiently transfected with sh2 HuR or sh Co were used to assess the presence of SET on endogenous CD47 mRNA and the requirement of HuR for this association. Cells were transfected and treated with high dose puromycin for 3 days. FACS analysis was used to ensure greater than 90% of surviving cells expressed the shRNA. RNA-IP was carried out as described above, but using anti-SET (Abcam, ab181990) or IgG (Santa Cruz, sc-2025). The following primers were used for qRT-PCR of CD47-LU: CD47F: 5'-AAGAGAACTCCAGTGTTGCT-3'; CD47R: 5'-ACGGTAACACAGCTGTAAAACA-3'
The obtained CT values were first normalized to GAPDH and then the fraction of input mRNA was plotted.
Western blotting
HEK293 cells stably expressing sh3 HuR, sh4 HuR, sh1 SET, sh2 SET, sh2 Rac1, sh3 Rac1 or sh Co as well HEK293 cells transiently transfected with sh2 HuR, CD47-SU, CD47-LU, CD47-LU+N17Rac1, CD47-LU2Km, CD47-LUΔC or CD47-LUΔCL were lysed in Laemmli buffer (Sigma, S3401), boiled for seven minutes and then cooled on ice. Lysates were run on NuPAGE® Novex 4–12% Bis-Tris Gel (Invitrogen, NP0322BOX) and transferred to PVDF membrane (Bio-rad, 162–0177). After blocking for 1 hour at RT in Odyssey Blocking Buffer (Li-Cor, 927–40000) the following primary antibodies were used: rabbit anti-HuR (Millipore, 07–1735), rabbit anti-SET (Abcam, ab181990), mouse anti-RAC1 (Cell signaling Technology, 8631S), mouse anti-ACTB (Sigma, A4700), rabbit anti-ACTB (Sigma, A2066), chicken anti-GFP (Abcam, ab13970), mouse anti-CD47 (Santa Cruz, sc-59079), mouse anti-CD44 (BD Bioscience, 561858), and rabbit anti-TSPAN13 (GeneTex, GTX52155). The antibodies were diluted in Odyssey Blocking Buffer containing 0.1% Tween 20 and the blots were incubated over night at 4°C. Following four washes in PBST (PBS+0.1% Tween 20) the blots were incubated for 1 hour at RT in Odyssey Blocking Buffer containing 0.1% Tween 20 and 0.01% SDS and the following secondary antibodies: donkey anti-mouse IRDye 700 (Rockland Immunochemicals, 610-730-002), donkey anti-rabbit IRDye 680 (Li-Cor Biosciences, 926–68073), donkey anti-rabbit IRDye 800 (Li-Cor Biosciences, 926–32213), donkey anti-mouse IRDye 800 (Li-Cor Biosciences, 926–32212) and rabbit anti-chicken IRDye 800 (Rockland Immunochemicals, 603-432-002). The blots were washed four times in PBST and then thoroughly soaked in PBS before imaging. Imaging was performed on an Odyssey CLx imaging system (Li-Cor). Quantification of Western blots was performed using Image J.
Co-Immunoprecipitation
CD47-SU, CD47-LU, CD47-LUΔC and CD47-LUΔCL were transfected into HEK293 cells and the cells were lysed in ice cold RIPA buffer [(25 mM Tris-HCl (pH=7.4), 150 mM NaCl, 1% NP-40, 1% Na-deoxycholate, 0.1% SDS, 1 mM EDTA, protease inhibitor cocktail (Roche, 04693124001)] for 5 minutes on ice. After the cells were spun down at 20,000 x g for 20 minutes the supernatant was pre-cleared as described above. The lysate was divided in two equal parts (a small portion was removed to be used as the input control). Anti-GFP (Invitrogen, A-6455) or IgG (Santa Cruz, sc-2025) was added to the lysates and a 1 hour rocking incubation at 4°C was performed, followed by addition of magnetic protein A beads (Millipore, LSKMAGA10) and another 1 hour rocking incubation at 4°C. Following seven washes in RIPA buffer the beads were then boiled in Laemmli buffer (Sigma, S3401) for seven minutes and then cooled on ice. Western blotting was carried out as described above. Chicken anti-GFP (Abcam, ab13970) antibody was used to confirm immunoprecipitation of GFP constructs and rabbit anti-SET (Abcam, ab181990) antibody was used to assess co-immunoprecipitation of SET protein.
Immunoprecipitation of RAC1-GTP
CD47-SU, CD47-LU and pcDNA 3.1 vector alone were transfected into HEK293 cells. The levels of RAC1-GTP were assessed using an Active Rac1 Detection Kit (Cell Signaling Technology, 8815) following the manufacturer’s protocol. Briefly, cells were lysed in ice cold lysis buffer and centrifuged at 16,000 x g for 15 minutes at 4°C. The supernatant was added to GST-PAK1-PBD and glutathione resin and incubated with rocking for 1 hour at 4°C (a small portion was removed to be used as the input control). The resin was washed three times with lysis buffer and then SDS sample buffer was added to elute the bound proteins. Western blotting was carried out as described above. Mouse anti-RAC1 (Cell signaling Technology, 8631S) antibody was used to detect RAC1-GTP as well as to assess total RAC1 in the samples.
Irradiation and cell survival assay
Jurkat, JinB8, and transfected JinB8 cells (24 hours post-transfection) were irradiated for a total of 0, 5, 10, 20 or 40 Gy using a Shepherd Mark-1 cesium irradiator. For JinB8 or Jurkat cells transfected with CD47-LU, CD47-SU or with sh2 CD47-LU the percentage of GFP+ cells was determined by FACS prior to irradiation. Three days after γ-irradiation, cells were stained with TO-PRO3 (Sloan Kettering Institute, Flow Cytometry Core Facility) in FACS buffer A (0.5% FBS in PBS) for 10 minutes at 4°C and analyzed using a BD FACSCalibur cell analyzer to evaluate cell survival. Percent survival was calculated as the TO-PRO3 negative cells divided by the total number of GFP+ cells. Shown are mean and standard deviation of three biological replicates.
Phagocytosis Assay
Human macrophages were obtained by differentiation of THP-1 cells with 25 ng/ml PMA (phorbol 12-myristate 13-acetate, Sigma) for 3 days. On day 3, Jurkat, JinB8, or transfected JinB8 cells were treated with 10 µg/ml Mitomycin C for 2.5 hours at 37°C and washed three times in media. Mitocycin C treatment halts cell division and allows for a more accurate assessment of the percentage of cells that are phagocytosed. For JinB8 cells transfected with CD47-LU or CD47-SU the percentage of GFP+ cells was determined by FACS prior to co-culture. The cells were either cultured alone or co-cultured with fully differentiated macrophages. After 3 days, cells were counted and the fraction of GFP+ cells was determined by FACS analysis. The fraction of surviving cells after co-culture with macrophages was normalized by the number of surviving cells without co-culture and is show as mean and standard deviation of three independent experiments. To demonstrate that the cells were phagocytosed, during the last 10 minutes of Mitomycin C treatment the cells were also labeled with CFSE (Carboxyfluorescein succinimidyl ester; Invitrogen). Washing following Mitomycin C and CFSE treatment was carried out in cold media according to the manufacturer’s protocol. After co-culture, CFSE uptake by macrophages was measured by FACS analysis to demonstrate that a decrease in the number of surviving cells is due to phagocytosis by macrophages.
Fraction of membrane proteins among HuR target genes
The list of HuR target genes was obtained from previous publications 7,9. The union of genes from both publications was analyzed using gene ontology analysis 39 and all genes with the tag “membrane” were considered membrane proteins. This number is consistent with the number of membrane proteins obtained in yeast 40. Fisher’s exact test was used to test for significance.
Statistical analysis
To test for significant differences between samples a two-sided t-test for independent samples was performed using SPSS.
Extended Data
Extended Data Figure 1. Expression of the long CD47 3'UTR isoform correlates with cell surface expression of CD47 protein.
(A) Fluorescence confocal microscopy of cells shown as in Fig. 1a. Representative images out of hundreds of cells are shown. Scale bars, 10 µm.
(B) FACS analysis of endogenous CD47 expression in cells shown in Fig. 1a and (a). Permeabilized cells show total CD47 expression (purple) and non-permeabilized cells show surface CD47 expression (blue). Representative histograms are shown (HEK293 cells, n = 10, U2OS, Jurkat cells, n=5, Caov-3, n=3). Unstained cells are shown in grey.
(C) Left, quantification of mean fluorescence intensity (MFI) values from (b). Right, fraction of surface and intracellular CD47 levels in cells lines from (b). Intracellular CD47 was calculated by subtracting CD47 surface values from total CD47 values.
(D) Northern blot of HEK293 cells stably expressing the indicated shRNAs and hybridized for CD47. The shRNAs against CD47-LU target only the long 3'UTR isoforms of CD47. The blot and corresponding RNA gel are shown as in Fig. 1c.
(E) Quantification of CD47 total mRNA and 3'UTR isoform levels in U2OS cells by qRT-PCR. _GAPDH_-normalized values after transfection of sh2 CD47-LU or sh Co are shown as the mean ± s.d., n = 3 biological replicates. The total amount of CD47 mRNA after transfection of sh Co was set to 1.
(F) FACS analysis of endogenous CD47 protein expression after stable expression of shRNAs against CD47-LU in HEK293 cells. Surface (top) and total (bottom) CD47 expression is shown. Representative histograms out of n = 3 experiments are shown. Unstained cells are shown in grey.
(G) Quantification of MFI values from (f) is displayed. Intracellular CD47 was calculated as in (b).
(H) Northern blot of HEK293 cells after transfection of indicated constructs and hybridized against CD47. Mutation of the proximal polyadenylation signal in CD47-LU abrogates production of short 3'UTR isoforms. Asterisk indicates cross-hybridization to ribosomal RNAs.
(I) Fluorescence confocal microscopy of endogenous CD47 and Calnexin protein in permeabilized U2OS cells. Calnexin partially co-localizes with CD47. A representative image out of hundreds of cells is shown. Scale bars, 10 µm.
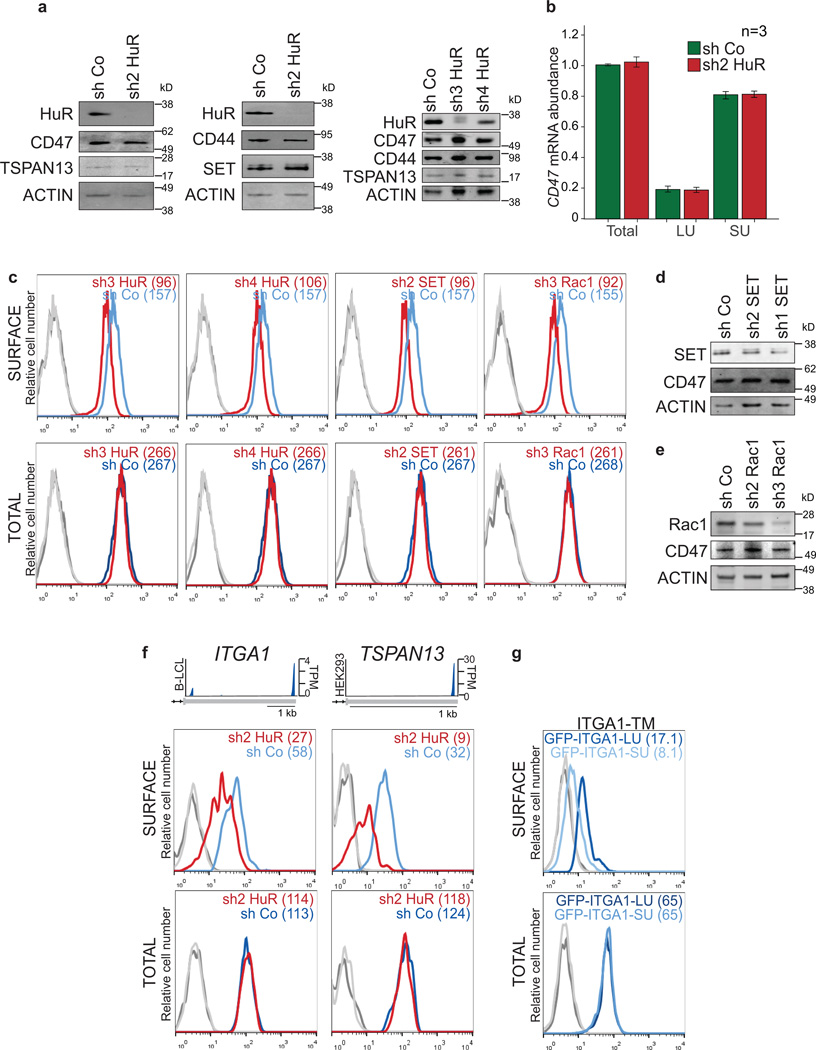
Extended Data Figure 2. UDPL depends on HuR, SET and Rac1 and mediates surface localization of membrane proteins.
(A) Western blot of HEK293 cells transiently transfected (left, middle) or stably expressing (right) sh Co or shRNAs against HuR. The blot shows reduced HuR protein expression after HuR KD, but no change in protein expression of CD47, TSPAN13, CD44 or SET. ACTIN was used as loading control.
(B) Quantification of CD47 total mRNA and 3'UTR isoform levels in HEK293 cells by qRT-PCR. _GAPDH_-normalized values after transfection of sh2 HuR or sh Co are shown. Shown is the mean ± s.d., n = 3 biological replicates. The total amount of CD47 mRNA after transfection of sh Co was set to 1.
(C) FACS analysis of HEK293 cells stably expressing the indicated shRNAs. Histograms are shown as in Fig. 2b. Representative histograms from n = 3 experiments are shown.
(D) Western blot of HEK293 cells stably expressing shRNAs against SET. Actin was used as loading control. The marker is shown in kD.
(E) As in (D), but HEK293 cells stably expressing shRNAs against RAC1 are shown.
(F) 3'-seq analysis shows 3'UTR isoform expression of ITGA1 in B-LCL and TSPAN13 in HEK293 cells shown as in Fig. 1b. FACS analysis of endogenous protein levels is shown as in Fig. 2c. Left panel shows ITGA1 expression in HeLa cells and right panel shows TSPAN13 expression in HEK293 cells. Representative histograms from n = 2 experiments are shown.
(G) FACS analysis of GFP after transfection of constructs containing a signal peptide and GFP fused to the TMD, C-terminus and either the long 3'UTR (dark blue line) or the short 3'UTR (light blue line) of ITGA1 in HEK293 cells. Representative histograms from n = 3 experiments are shown as in Fig. 2d.
Extended Data Figure 3. 3'UTR isoforms that encode proteins using UDPL contain uridine-rich elements.
Shown are the 3'UTR sequences of CD47, CD44, HuR-BS and HuR-BSΔ. Red, ApA signals. Blue, uridine-rich elements with the potential to be HuR-binding sites.
Extended Data Figure 4. 3'UTR isoforms that encode proteins using UDPL contain U-rich elements.
Shown are the 3'UTR sequences of ITGA1, TNFRSF13C and TSPAN13. Red, ApA signals. Blue, U-rich elements with the potential to be HuR-binding sites.
Extended Data Figure 5. Local recruitment of SET to the site of translation is required for UDPL.
(A) Western blot of cells used in Fig. 3b shows the amount of overexpression achieved by transfection of MS2-mC-SET or MS2-mC-HuR [constructs, see (b)]. Left, anti-SET detects endogenous expression of SET as well as overexpressed SET. Right, anti-HuR detects endogenous HuR and overexpressed HuR. Actin was used as loading control. Anti-HuR and anti-SET were used on the same blot. Actin as loading control was performed once. The marker is shown in kD. Asterisk indicates unspecific band. mC, mCherry.
(B) The top construct depicts GFP-TM-SU (Fig. 1e) and the bottom construct shows a fusion of MS2 coat protein (MS2), mC (red) and HuR or SET, respectively. Overexpression of HuR or SET compared with expression of MS2-mC alone does not change surface or total GFP expression, when co-transfected with GFP-TM-SU (without the addition of MS2-binding sites to the SU isoform) as shown by FACS analysis. Surface expression (top) and total expression (bottom) in HEK293 cells are shown. Values for MFI are shown in parentheses. Unstained cells are shown in grey. Representative histograms from n = 2 experiments are shown.
(C) FACS analysis of cells used in Fig. 3b. MS2-binding sites (MS2-BS, RNA stem loops) were added to GFP-TM-SU (and the proximal polyadenylation signal was mutated) to obtain GFP-TM-SU-MS2-BS. Transfection of MS2-mC-HuR (left, dark purple line) or MS2-mC-SET (right, dark purple line) increases surface GFP expression compared with transfection of MS2-mC (light purple line), when GFP-TM-SU-MS2-BS is co-transfected. Thus, tethering of HuR or SET to the short 3'UTR of GFP-TM localizes GFP to the cell surface without changing total GFP expression. Histograms are shown as in (b). Representative histograms from n = 5 experiments are shown.
(D) As in (c), but tethering was impaired by omission of the MS2 coat protein. Histograms are shown as in (b). Representative histograms from n = 2 experiments are shown.
Summary of the tethering experiment: To tether SET or HuR to the 3'UTR (which brings it close to the site of translation through the scaffold function of the 3'UTR), we added MS2-binding sites (MS2-BS) to GFP-TM-SU (c). MS2-binding sites are derived from the bacteriophage MS2 and form RNA stem loops. The capsid protein of MS2 (here, called MS2) specifically recognizes these MS2 stem loops. Constructs were generated containing MS2 fused to mC and then either HuR, SET or with no further coding sequence (Fig. 3c). Co-expression of these constructs with the construct containing the short UTR and MS2-binding sites results in recruitment of SET or HuR to the short 3'UTR of GFP-TM. The cells that express MS2 fused to only mC localize GFP to the endoplasmic reticulum, but constructs containing MS2 fusions to HuR or SET localize GFP primarily to the cell surface (Fig. 3b and Extended Data Fig. 5c). Omitting either the MS2 or MS2-binding sites from the experiment abrogates surface localization (Extended Data Fig. 5b, d).
Extended Data Figure 6. CD47 contains at least two SET-binding sites in its cytoplasmic domains.
(A) FACS analysis of surface GFP expression after transfection of GFP-TM-LU (dark blue line) and GFP-TM-LU constructs containing a single point mutation in the cytoplasmic C-terminus (light blue line), K290A (left), K297A (middle), K304A (right) in HEK293 cells. Partial destruction of a single SET-BS results in up to 37% reduction in GFP surface expression. Values for MFI are shown in parentheses. Unstained cells are shown in grey. Representative histograms from n = 5 experiments are shown.
(B) FACS analysis of GFP expression after transfection of GFP-TM-LU (dark blue line), GFP-TM-LU containing a mutation of the SET-binding sites in the C-terminus (K290A, K304A; 2Km; light blue line; left), containing a deletion of the C-terminus (ΔC; light blue line; middle), or destruction of both SET-BS (ΔC combined with K163A, K166A, K175A; ΔCL; light blue line, right). Surface (top) and total (bottom) expression is shown in HEK293 cells. Values for MFI are shown in parentheses. Unstained cells are shown in grey. Representative histograms from several experiments are shown (2Km, n = 3; ΔC, n = 10; ΔCL, n = 4).
Extended Data Figure 7. CD47 protein has different functions dependent on whether it was generated by the SU or LU isoform.
(A) Left, western blot of HEK293 cells after transfection of the indicated constructs shows GFP-CD47 expression using an anti-GFP antibody. Actin was used as loading control. Right, as in left panel after transfection of CD47-SU and CD47-LU into HEK293 (left) or JinB8 cells (right). GFP-CD47 expression was quantified after normalization with respect to Actin using Image J. Shown is the fold-change in GFP-CD47 expression of CD47-SU after setting CD47-LU to 1.
(B) The experiment is similar to Fig. 3b and Extended Data Fig. 5c, but here the constructs containing the full open reading frame of CD47 were used. FACS analysis of GFP expression after transfection of CD47-SU-MS2-BS. Co-transfection of MS2-mC-HuR (left, dark purple line) or MS2-mC-SET (right, dark purple line) increases surface GFP expression compared to co-transfection of MS2-mC (light purple line). Surface expression is shown in non-permeabilized HEK293 cells. Values for MFI are shown in parentheses. Representative histograms from n = 3 experiments are shown. Unstained cells are shown in grey.
(C) Left, FACS analysis of GFP after transfection of constructs containing a signal peptide and GFP fused to the open reading frame of BAFFR and either the long 3'UTR (BAFFR-LU, dark blue line) or the short 3'UTR (BAFFR-SU, light blue line) in HEK293 cells. Surface (top) and total (bottom) GFP expression is shown. Values for MFI are shown in parentheses. Representative histograms from n = 3 experiments are shown. Unstained cells are shown in grey. Right, as in left panel but for CD44.
(D) Table showing the fold increase in surface GFP expression mediated by the LU isoform compared with the SU isoform. Top row shows values of constructs without the ECD and bottom row shows values of constructs containing the full coding regions of the indicated proteins. The fold increase in surface GFP expression was calculated from MFI (LU) / MFI (SU). The contribution of the ECD domain for surface expression of BAFFR is 1.2-fold (3.8 / 3.1).
(E) FACS analysis of carboxyfluorescein succinimidyl ester (CFSE) uptake in macrophages. Macrophages were co-cultured without (grey) cells or with cells that were pre-treated with CFSE and expressed high or low amounts of surface CD47 (data not shown). The experiment shows that the macrophages phagocytose the cells depending on their CD47 surface expression levels. A representative histogram from n = 2 experiments is shown.
(F) The fraction of surviving cells (TO-PRO3 negative) as measured by FACS analysis at day 3 (d3) after increasing doses of γ-irradiation is shown for Jurkat, JinB8 (CD47−/−) and the GFP+ fraction after nucleofection of JinB8 cells with either CD47-SU or CD47-LU. The values were obtained from the same experiment as shown in Fig. 4e, but here the values were calculated using all GFP positive cells. Shown are the values for mean ± s.d., n = 3 biological replicates. Gy, Gray.
(G) The fraction of surviving cells (TO-PRO3 negative) as measured by FACS analysis at day 3 (d3) after increasing doses of γ-irradiation is shown for Jurkat, JinB8 (CD47−/−) and the GFP+ fraction after nucleofection of Jurkat cells with sh2 CD47-LU. Shown are the 20% of cells with the highest GFP expression (green). Shown are the values for mean ± s.d., n = 3 biological replicates. Gy, Gray.
Extended Data Figure 8. HuR, SET and RAC1 are widely and highly expressed.
(A) The mRNAs of proteins necessary for UDPL are ubiquitously and highly expressed across cell lines (left) and tissues (right). Shown are values for transcripts per million (TPM). The median abundance levels of all expressed genes in the data sets are shown as dashed lines. ELAVL1 encodes HuR. The data set from ref. 3 was analysed to obtain the TPM values.
(B) Here, “HuR targets” consist of the union of HuR targets identified previously7,9. Membrane proteins consist of all the proteins that contain the tag “membrane” using gene ontology analysis. The fraction of membrane proteins found is consistent with the fraction of membrane proteins found in yeast 40. Fisher’s exact test shows no enrichment or depletion of membrane proteins among the HuR targets.
Extended Data Figure 9. All tested UDPL candidates have potential SET-binding sites in their cytoplasmic domains.
Shown are the amino acid sequences of the TMDs and cytoplasmic domains of the membrane proteins studied. The TMDs are shown in green and the positively charged amino acids in the cytoplasmic domains, indicating potential SET-binding sites, are shown in red.
Acknowledgements
This work was funded by the Innovator Award of the Damon Runyon-Rachleff Cancer Foundation and the Island Outreach Foundation (DRR-24-13) and NIH grant U01-CA164190. We thank Neil Patel for help with cloning of the constructs and the members of the Mayr lab, specifically Shih-Han Lee and Eric Kallin as well as Nikolaus Rajewsky and Andrea Ventura for helpful discussions. We also thank Johanna Joyce, Cole Haynes, Alan Hall and Robert Benezra for critical reading of the manuscript. The N17RAC1 construct was kindly provided by Alan Hall and the JinB8 cells by Dr. Frazier and Dr. Roberts. We thank the Molecular Cytology Core Facility (Memorial Sloan Kettering Cancer Center) for help with the confocal microscopy (funded by P30 CA008748).
B.D.B. designed and performed the experiments and C.M. designed the study. B.D.B. and C.M. wrote the manuscript.
Footnotes
The authors declare no conflict of interests.
References
- 1.Sandberg R, Neilson JR, Sarma A, Sharp PA, Burge CB. Proliferating cells express mRNAs with shortened 3' untranslated regions and fewer microRNA target sites. Science. 2008;320:1643–1647. doi: 10.1126/science.1155390. [DOI] [PMC free article] [PubMed] [Google Scholar]
- 2.Mayr C, Bartel DP. Widespread shortening of 3'UTRs by alternative cleavage and polyadenylation activates oncogenes in cancer cells. Cell. 2009;138:673–684. doi: 10.1016/j.cell.2009.06.016. [DOI] [PMC free article] [PubMed] [Google Scholar]
- 3.Lianoglou S, Garg V, Yang JL, Leslie CS, Mayr C. Ubiquitously transcribed genes use alternative polyadenylation to achieve tissue-specific expression. Genes Dev. 2013;27:2380–2396. doi: 10.1101/gad.229328.113. [DOI] [PMC free article] [PubMed] [Google Scholar]
- 4.Brennan CM, Gallouzi IE, Steitz JA. Protein ligands to HuR modulate its interaction with target mRNAs in vivo. The Journal of cell biology. 2000;151:1–14. doi: 10.1083/jcb.151.1.1. [DOI] [PMC free article] [PubMed] [Google Scholar]
- 5.ten Klooster JP, Leeuwen I, Scheres N, Anthony EC, Hordijk PL. Rac1-induced cell migration requires membrane recruitment of the nuclear oncogene SET. EMBO J. 2007;26:336–345. doi: 10.1038/sj.emboj.7601518. [DOI] [PMC free article] [PubMed] [Google Scholar]
- 6.Kishore S, et al. A quantitative analysis of CLIP methods for identifying binding sites of RNA-binding proteins. Nat Methods. 2011;8:559–564. doi: 10.1038/nmeth.1608. [DOI] [PubMed] [Google Scholar]
- 7.Lebedeva S, et al. Transcriptome-wide analysis of regulatory interactions of the RNA-binding protein HuR. Mol Cell. 2011;43:340–352. doi: 10.1016/j.molcel.2011.06.008. [DOI] [PubMed] [Google Scholar]
- 8.Mukherjee N, et al. Integrative regulatory mapping indicates that the RNA-binding protein HuR couples pre-mRNA processing and mRNA stability. Mol Cell. 2011;43:327–339. doi: 10.1016/j.molcel.2011.06.007. [DOI] [PMC free article] [PubMed] [Google Scholar]
- 9.Uren PJ, et al. Genomic analyses of the RNA-binding protein Hu antigen R (HuR) identify a complex network of target genes and novel characteristics of its binding sites. J Biol Chem. 2011;286:37063–37066. doi: 10.1074/jbc.C111.266882. [DOI] [PMC free article] [PubMed] [Google Scholar]
- 10.An JJ, et al. Distinct role of long 3' UTR BDNF mRNA in spine morphology and synaptic plasticity in hippocampal neurons. Cell. 2008;134:175–187. doi: 10.1016/j.cell.2008.05.045. [DOI] [PMC free article] [PubMed] [Google Scholar]
- 11.Oldenborg PA, et al. Role of CD47 as a marker of self on red blood cells. Science. 2000;288:2051–2054. doi: 10.1126/science.288.5473.2051. [DOI] [PubMed] [Google Scholar]
- 12.Jaiswal S, et al. CD47 is upregulated on circulating hematopoietic stem cells and leukemia cells to avoid phagocytosis. Cell. 2009;138:271–285. doi: 10.1016/j.cell.2009.05.046. [DOI] [PMC free article] [PubMed] [Google Scholar]
- 13.Fan XC, Steitz JA. Overexpression of HuR, a nuclear-cytoplasmic shuttling protein, increases the in vivo stability of ARE-containing mRNAs. EMBO J. 1998;17:3448–3460. doi: 10.1093/emboj/17.12.3448. [DOI] [PMC free article] [PubMed] [Google Scholar]
- 14.Mazan-Mamczarz K, et al. RNA-binding protein HuR enhances p53 translation in response to ultraviolet light irradiation. Proc Natl Acad Sci U S A. 2003;100:8354–8359. doi: 10.1073/pnas.1432104100. [DOI] [PMC free article] [PubMed] [Google Scholar]
- 15.Seo SB, et al. Regulation of histone acetylation and transcription by INHAT, a human cellular complex containing the set oncoprotein. Cell. 2001;104:119–130. doi: 10.1016/s0092-8674(01)00196-9. [DOI] [PubMed] [Google Scholar]
- 16.Fan Z, Beresford PJ, Oh DY, Zhang D, Lieberman J. Tumor suppressor NM23-H1 is a granzyme A-activated DNase during CTL-mediated apoptosis, and the nucleosome assembly protein SET is its inhibitor. Cell. 2003;112:659–672. doi: 10.1016/s0092-8674(03)00150-8. [DOI] [PubMed] [Google Scholar]
- 17.Miller JD, Wilhelm H, Gierasch L, Gilmore R, Walter P. GTP binding and hydrolysis by the signal recognition particle during initiation of protein translocation. Nature. 1993;366:351–354. doi: 10.1038/366351a0. [DOI] [PubMed] [Google Scholar]
- 18.Schneider R, Bannister AJ, Weise C, Kouzarides T. Direct binding of INHAT to H3 tails disrupted by modifications. J Biol Chem. 2004;279:23859–23862. doi: 10.1074/jbc.C400151200. [DOI] [PubMed] [Google Scholar]
- 19.Zerangue N, Schwappach B, Jan YN, Jan LY. A new ER trafficking signal regulates the subunit stoichiometry of plasma membrane K(ATP) channels. Neuron. 1999;22:537–548. doi: 10.1016/s0896-6273(00)80708-4. [DOI] [PubMed] [Google Scholar]
- 20.Walmsley MJ, et al. Critical roles for Rac1 and Rac2 GTPases in B cell development and signaling. Science. 2003;302:459–462. doi: 10.1126/science.1089709. [DOI] [PubMed] [Google Scholar]
- 21.Reinhold MI, Green JM, Lindberg FP, Ticchioni M, Brown EJ. Cell spreading distinguishes the mechanism of augmentation of T cell activation by integrin-associated protein/CD47 and CD28. International immunology. 1999;11:707–718. doi: 10.1093/intimm/11.5.707. [DOI] [PubMed] [Google Scholar]
- 22.Lamy L, et al. CD47 and the 19 kDa interacting protein-3 (BNIP3) in T cell apoptosis. J Biol Chem. 2003;278:23915–23921. doi: 10.1074/jbc.M301869200. [DOI] [PubMed] [Google Scholar]
- 23.Lindberg FP, et al. Decreased resistance to bacterial infection and granulocyte defects in IAP-deficient mice. Science. 1996;274:795–798. doi: 10.1126/science.274.5288.795. [DOI] [PubMed] [Google Scholar]
- 24.Isenberg JS, et al. Thrombospondin-1 and CD47 limit cell and tissue survival of radiation injury. The American journal of pathology. 2008;173:1100–1112. doi: 10.2353/ajpath.2008.080237. [DOI] [PMC free article] [PubMed] [Google Scholar]
- 25.Soto-Pantoja DR, Isenberg JS, Roberts DD. Therapeutic Targeting of CD47 to Modulate Tissue Responses to Ischemia and Radiation. Journal of genetic syndrome & gene therapy. 2011;2 doi: 10.4172/2157-7412.1000105. [DOI] [PMC free article] [PubMed] [Google Scholar]
- 26.Frazier WA, Isenberg JS, Kaur S, Roberts DD. UCSD Nature Molecule Pages. 2010 [Google Scholar]
- 27.Avet C, et al. SET protein interacts with intracellular domains of the gonadotropin-releasing hormone receptor and differentially regulates receptor signaling to cAMP and calcium in gonadotrope cells. J Biol Chem. 2013;288:2641–2654. doi: 10.1074/jbc.M112.388876. [DOI] [PMC free article] [PubMed] [Google Scholar]
- 28.Nilsson J, Persson B, von Heijne G. Comparative analysis of amino acid distributions in integral membrane proteins from 107 genomes. Proteins. 2005;60:606–616. doi: 10.1002/prot.20583. [DOI] [PubMed] [Google Scholar]
- 29.Lau AG, et al. Distinct 3'UTRs differentially regulate activity-dependent translation of brain-derived neurotrophic factor (BDNF) Proc Natl Acad Sci U S A. 2010;107:15945–15950. doi: 10.1073/pnas.1002929107. [DOI] [PMC free article] [PubMed] [Google Scholar]
- 30.Yoon JH, et al. Scaffold function of long non-coding RNA HOTAIR in protein ubiquitination. Nature communications. 2013;4:2939. doi: 10.1038/ncomms3939. [DOI] [PMC free article] [PubMed] [Google Scholar]
Supplementary References
- 31.Neviani P, et al. The tumor suppressor PP2A is functionally inactivated in blast crisis CML through the inhibitory activity of the BCR/ABL-regulated SET protein. Cancer Cell. 2005;8:355–368. doi: 10.1016/j.ccr.2005.10.015. [DOI] [PubMed] [Google Scholar]
- 32.Nho RS, et al. PTEN regulates fibroblast elimination during collagen matrix contraction. J Biol Chem. 2006;281:33291–33301. doi: 10.1074/jbc.M606450200. [DOI] [PubMed] [Google Scholar]
- 33.Reinhold MI, et al. In vivo expression of alternatively spliced forms of integrin-associated protein (CD47) Journal of cell science. 1995;108(Pt 11):3419–3425. doi: 10.1242/jcs.108.11.3419. [DOI] [PubMed] [Google Scholar]
- 34.Slobodin B, Gerst JE. A novel mRNA affinity purification technique for the identification of interacting proteins and transcripts in ribonucleoprotein complexes. RNA. 2010;16:2277–2290. doi: 10.1261/rna.2091710. [DOI] [PMC free article] [PubMed] [Google Scholar]
- 35.Bertrand E, et al. Localization of ASH1 mRNA particles in living yeast. Mol Cell. 1998;2:437–445. doi: 10.1016/s1097-2765(00)80143-4. [DOI] [PubMed] [Google Scholar]
- 36.Ridley AJ, Paterson HF, Johnston CL, Diekmann D, Hall A. The small GTP-binding protein rac regulates growth factor-induced membrane ruffling. Cell. 1992;70:401–410. doi: 10.1016/0092-8674(92)90164-8. [DOI] [PubMed] [Google Scholar]
- 37.Niranjanakumari S, Lasda E, Brazas R, Garcia-Blanco MA. Reversible cross-linking combined with immunoprecipitation to study RNA-protein interactions in vivo. Methods. 2002;26:182–190. doi: 10.1016/S1046-2023(02)00021-X. [DOI] [PubMed] [Google Scholar]
- 38.Mili S, Steitz JA. Evidence for reassociation of RNA-binding proteins after cell lysis: implications for the interpretation of immunoprecipitation analyses. RNA. 2004;10:1692–1694. doi: 10.1261/rna.7151404. [DOI] [PMC free article] [PubMed] [Google Scholar]
- 39.Huang da W, Sherman BT, Lempicki RA. Systematic and integrative analysis of large gene lists using DAVID bioinformatics resources. Nature protocols. 2009;4:44–57. doi: 10.1038/nprot.2008.211. [DOI] [PubMed] [Google Scholar]
- 40.Stagljar I, Fields S. Analysis of membrane protein interactions using yeast-based technologies. Trends in biochemical sciences. 2002;27:559–563. doi: 10.1016/s0968-0004(02)02197-7. [DOI] [PubMed] [Google Scholar]
