A spatial model predicts that dispersal and cell turnover limit intratumour heterogeneity (original) (raw)
. Author manuscript; available in PMC: 2016 Mar 8.
Published in final edited form as: Nature. 2015 Aug 26;525(7568):261–264. doi: 10.1038/nature14971
Abstract
Most cancers in humans are large, measuring centimetres in diameter, and composed of many billions of cells1. An equivalent mass of normal cells would be highly heterogeneous as a result of the mutations that occur during each cell division. What is remarkable about cancers is that virtually every neoplastic cell within a large tumour often contains the same core set of genetic alterations, with heterogeneity confined to mutations that emerge late during tumour growth2–5. How such alterations expand within the spatially constrained three-dimensional architecture of a tumour, and come to dominate a large, pre-existing lesion, has been unclear. Here we describe a model for tumour evolution that shows how short-range dispersal and cell turnover can account for rapid cell mixing inside the tumour. We show that even a small selective advantage of a single cell within a large tumour allows the descendants of that cell to replace the precursor mass in a clinically relevant time frame. We also demonstrate that the same mechanisms can be responsible for the rapid onset of resistance to chemotherapy. Our model not only provides insights into spatial and temporal aspects of tumour growth, but also suggests that targeting short-range cellular migratory activity could have marked effects on tumour growth rates.
Tumour growth is initiated when a single cell acquires genetic or epigenetic alterations that change the net growth rate of the cell (birth minus death), and enable its progeny to outgrow surrounding cells. As these small lesions grow, the cells acquire additional alterations that cause them to multiply even faster and to change their metabolism to survive better the harsh conditions and nutrient deprivation. This progression eventually leads to a malignant tumour that can invade surrounding tissues and spread to other organs. Typical solid tumours contain about 30–70 clonal amino-acid-changing mutations that have accumulated during this multi-stage progression1. Most of these mutations are believed to be passengers that do not affect growth, and only ∼5–10% are drivers that provide cells with a small selective growth advantage. Nevertheless, a major fraction of the mutations, particularly the drivers, are present in 30–100% of neoplastic cells in the primary tumour, as well as in metastatic lesions derived from it2,5.
Most attempts at explaining the genetic make-up of tumours assume well-mixed populations of cells and do not incorporate spatial constraints6–10. Several models of the genetic evolution of expanding tumours have been developed in the past11–14, but they assume either very few mutations11,12 or one- or two-dimensional growth13,14. Conversely, models that incorporate spatial limitations have been developed to help to understand processes such as tumour metabolism15, angiogenesis16,17 and cell migration12, but these models ignore genetics. Here, we formulate a model that combines spatial growth and genetic evolution, and use the model to describe the growth of primary tumours and metastases, as well as the development of resistance to therapeutic agents.
We first model the expansion of a metastatic lesion derived from a cancer cell that has escaped its primary site (for example, breast or colorectal epithelium) and travelled through the circulation until it lodged at a distant site (for example, lung or liver). The cell initiating the metastatic lesion is assumed to have all the driver gene mutations needed to expand. Motivated by histopathological images (Fig. 1a), we model the lesion as a conglomerate of ‘balls’ of cells (see Methods and Extended Data Fig. 1). Cells occupy sites in a regular three-dimensional lattice (Extended Data Fig. 2a, b). Cells replicate stochastically with rates proportional to the number of surrounding empty sites (non-neoplastic cells or extracellular matrix), hence replication is faster at the edge of the tumour. This is supported by experimental data (Fig. 1b–d and Extended Data Table 1). A cell with no cancer cell neighbours replicates at the maximal rate of b = ln(2) = 0.69 days−1, in which b denotes the initial birth rate, equivalent to 24 h cell-doubling time, and a cell that is completely surrounded by other cancer cells does not replicate. Cells can also mutate, but we assume all mutations are passengers (they do not confer fitness advantages). After replication, a cell moves with a small probability (M) to a nearby place close to the surface of the lesion and creates a new lesion. This ‘sprouting’ of initial lesions could be due to short-range migration after an epithelial-to-mesenchymal transition18 and consecutive reversion to a non-motile phenotype. Alternatively, it could be the result of another process such as angiogenesis (Methods), through which the tumour gains better access to nutrients. The same model governs the evolution of larger metastatic lesions that have already developed extensive vasculature. Cells die with a death rate (d) independent of the number of neighbours, and are replaced by empty sites (non-neoplastic cells within the local tumour environment).
Figure 1. Structure of solid neoplasms.
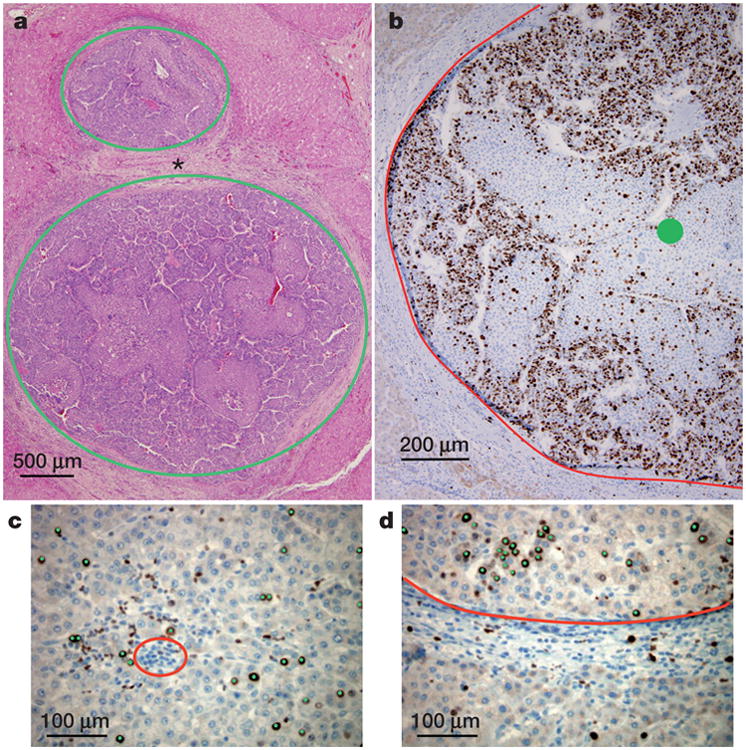
a, Hepatocellular carcinoma composed of balls of cells (circled in green) separated by non-neoplastic tissue (asterisk). b, Adjacent section of the bottom tumour in a immunolabelled with the proliferation marker Ki67. The edge of the tumour is delineated in red; the centre is marked with a green circle. Proliferation is decreased in the centre when compared to the edge of the neoplasm. c, d, Higher magnification of the centre (c) and the edge (d) with each proliferating neoplastic cell marked by a green dot. The blue nuclei without green dots are non-proliferating. The red circle in c demonstrates an example of cells (inflammatory cells) that were not included in the count of neoplastic cells. The neoplastic tissue in d is above the red line; non-neoplastic (normal liver) is below the red line. Comparison of c with d shows that proliferation of neoplastic cells is decreased in the centre as compared to the edge of the lesion (quantified in Extended Data Table 1).
If there is little dispersal (M ≈ 0), the shape of the tumour becomes roughly spherical as it grows to a large size (Fig. 2a and Supplementary Video 2). However, even a very small amount of dispersal markedly affects the predicted shape. For _M_>0, the tumour forms a conglomerate of ‘balls’ (Fig. 2b, Extented Data Fig. 2c and Supplementary Video 3), much like those observed in actual metastatic lesions, with the balls separated by islands of non-neoplastic stromal cells mixed with extracellular matrix. In addition to this remarkable change in topology, dispersal strongly affects the growth rate and doubling time of the tumour. Although the size (N) of the tumour increases with time (T) from initiation as ∼_T_3 without dispersal (Extended Data Fig. 3a, b), it grows much faster (∼exp(const × T) for large T) when _M_>0 (Fig. 2c). This also remains true for long-range dispersal in which M affects the probability of escape from the primary tumour into the circulation to create new lesions in distant organs (metastasis). Using plausible estimates for the rates of cell birth, death and dispersal probability, we calculate that it takes 8 years for a lesion to grow from one cell to one billion cells in the absence of dispersal (M = 0), but less than 2 years with dispersal (Fig. 2c). The latter estimate is consistent with experimentally determined rates of metastasis growth as well as clinical experience, while the conventional model (without dispersal) is not.
Figure 2. Short-range dispersal affects size, shape and growth rate of tumours.
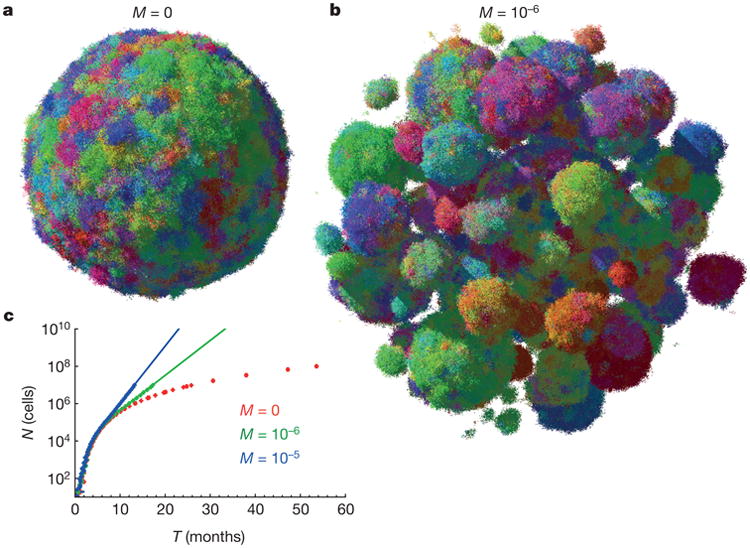
a, b, A spherical lesion in the absence of dispersal (M = 0) (a) and a conglomerate of lesions (b), each initiated by a cell that has migrated from a previous lesion, for low but non-zero migration (M = 10−6). Colours reflect the degree of genetic similarity; cells with similar colours have similar genetic alterations. The death rate is d = 0.8_b_, which corresponds to a net growth rate of 0.2_b_ = 0.14 days−1, and N = 107 cells. c, Dispersal (M = 0) causes the tumour to grow faster in time. Each point = 100 samples, error bars (too small to be visible) are s.e.m. Continuous lines (extrapolation) are 6,000 × 100.43_T_ (green), 1,000 × 100.7_T_ (blue).
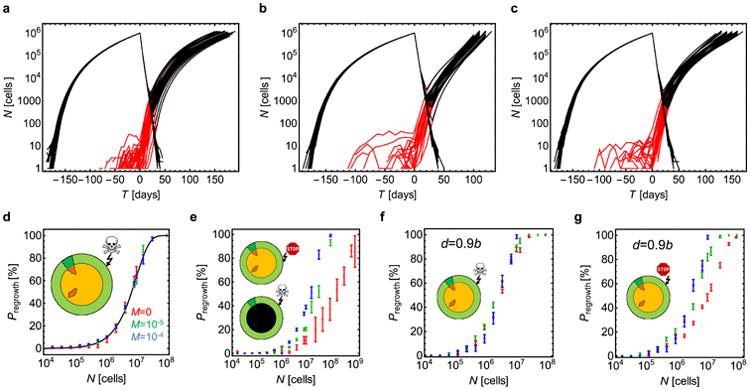
Non-spatial models point to the size of a tumour as a crucial determinant of chemotherapeutic drug resistance19–21. To determine whether a spatial model would similarly predict this dependency in a clinically relevant time frame, we calculated tumour regrowth probabilities after targeted therapies. We assume that the cell that initiates the lesion is susceptible to treatment, otherwise the treatment would have no effect on the mass, and that the probability of a resistant mutation is 10−7 (Methods); only one such mutation is needed for a regrowth.
Figure 3a shows snapshots from a simulation (Supplementary Video 1) performed before and after the administration of a typical targeted therapy at time T = 0. At first, the size of the lesion (∼3 mm at T = 0) rapidly decreases, but 1 month later resistant clones begin to proliferate and form tumours of microscopic size. Such resistant sub-clones are predicted to be nearly always present in lesions of sizes that can be visualized by clinical imaging techniques21,22. By 6 months after treatment, the lesions have regrown to their original size. The evolution of resistance is a stochastic process—some lesions shrink to zero and some regrow (Extended Data Fig. 4a). Figure 3b, c shows the probability of regrowth versus the time from the initiation of the lesion to the onset of treatment upon varying net growth rates b_–_d and dispersal probabilities. Regardless of growth rate, the capacity to migrate makes it more likely that regrowth will occur sooner, particularly for more aggressive cancers, that is, those which have higher net growth rates (Fig. 3b). This conclusion is in line with recent theoretical work on evolving populations of migrating cells23. If resistant mutations additionally increase the dispersal probability before or during treatment, regrowth is faster (Extended Data Fig. 4b, c).
Figure 3. Treatment success rates depend on the net growth rate of tumours.
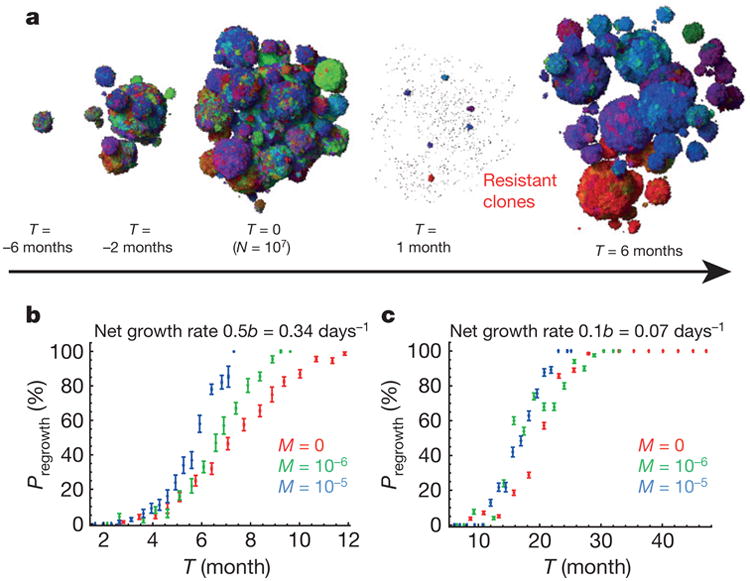
a, Time snapshots before and during therapy (M = 10−6). Resistant subpopulations that cause the tumour to regrow after treatment can be seen at T = 1 month. b, c, Probability of tumour regrowth (_P_regrowth) as a function of time after treatment initiation, for different dispersal probabilities (M) and net growth rates of the resistant cells. A higher net growth rate (b) leads to a high regrowth probability, so that 50% of tumours regrow 6 months after treatment is initiated when M = 10−5. c, Tumours with lower net growth rates require >20 months to achieve the same probability of regrowth. Number of samples = 1 to 800 per point (282 on average). Error bars are s.e.m. See Methods for details.
Having shown that the predictions of the spatial model are consistent with metastatic lesion growth and regrowth times, we turn to primary tumours. In contrast to metastatic lesions, here the situation is considerably more complex because the tumour cells are continually acquiring new driver gene mutations that can endow them with fitness advantages over adjacent cells within the same tumour. Our model of a primary tumour assumes that it is initiated via a single driver gene mutation that provides a selective growth advantage over normal neighbouring cells. Each subsequent driver gene mutation reduces the death rate as d = b(1–s)k, in which k is the number of driver mutations in the cell (k ≥ 1), and s is the average fitness advantage per driver. Almost identical results are obtained if driver gene mutations increase cell birth rather than decrease cell death, or affect both cell birth and cell death (Extended Data Fig. 5b); the most important parameter is the fitness gain, s, conferred by each driver mutation.
Figure 4a shows that in the absence of any new driver mutations (as for a perfectly normal cell growing in utero), clonal subpopulations would be restricted to small, localized areas. Each of these areas has at least one new genetic alteration, but none of them confers a fitness advantage (they are ‘passengers’). In an early tumour, in which the centre cell contains the initiating driver gene mutation, the same structure wouldbe observed—as long as nonew driver gene mutations have yet appeared. The occurrence of a new driver gene mutation, however, markedly alters the spatial distribution of cells. In particular, the heterogeneity observed in normal cells (Fig. 4a) is substantially reduced (Fig. 4b and Supplementary Video 5). The degree of heterogeneity can be quantified by calculating the number of genetic alterations (passengers plus drivers) shared between two cells separated by various distances (Fig. 4d–f). The genetic diversity is markedly decreased (Fig. 4e), even with relatively small fitness advantages (s = 1%). This also has implications for the number of genetic alterations that will be present in a macroscopic fraction (for example, >50%) of all cells. Figure 4f shows that this number is many times larger for s = 1% than s = 0%. Furthermore, our model predicts that virtually all cells within a large tumour will have at least one new driver gene mutation after 5 years of growth (Extended Data Fig. 5a). The faster the clonal expansion occurs (the larger s is), the smaller the number of passenger mutations (Extended Data Fig. 5d, e). Our results are also robust to changes to the model (Methods and Extended Data Figs 5 and 6). We stress that an important prerequisite for limiting heterogeneity is cell turnover in the tumour, because in the spatial setting cells with driver mutations can ‘percolate’ through the tumour only if they replace other cells. In the absence of cell turnover, tumours are much more heterogeneous (Extended Data Fig. 6d).
Figure 4. Genetic diversity is strongly reduced by the emergence of driver mutations.
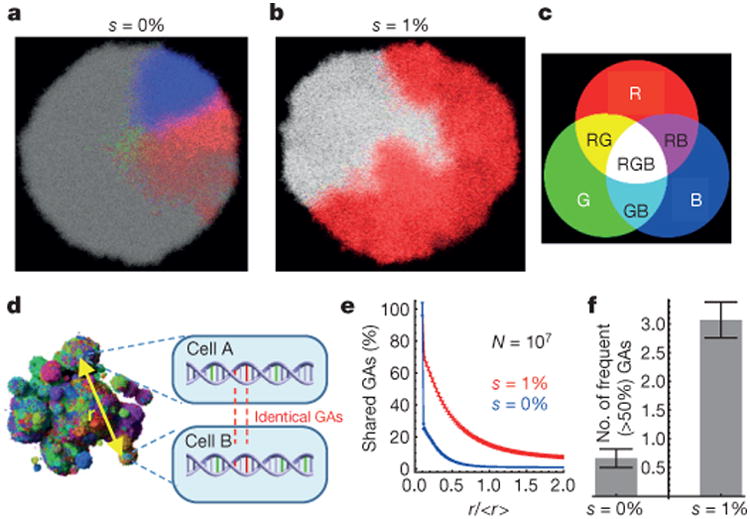
a –f, For all, M = 0 and the initial net growth rate = 0.007 days−1 (d = 0.99_b_). The three most abundant genetic alterations (GAs) have been colour-coded using red (R), green (G) and blue (B) (c). Each section is 80 cells thick. Combinations of the three basic colours correspond to cells having two or three of these genetic alterations. a, No drivers—separated, conical sectors emerge in different parts of the lesion, each corresponding to a different clone. b, Drivers with selective advantage s = 1% lead to clonal expansions and many cells have all three genetic alterations (white area). d, Genetic diversity can be determined quantitatively by randomly sampling pairs of cells separated by distance r and counting the number of shared genetic alterations. e, The number of shared genetic alterations versus the normalized distance r/<_r_> decreases much more slowly for the case with (red) than without (blue) driver mutations. f, The total number of genetic alterations present in at least 50% of all cells is much larger for s = 1% than for s = 0%. Number of samples = 50 per data point. Error bars are s.e.m.
In summary, our model accounts for many facts observed clinically and experimentally. Our results are robust and many assumptions can be relaxed without qualitatively affecting the outcome (Methods and Supplementary Information). Although tumour cell migration has historically been viewed as a feature of cancer associated with late events in tumorigenesis, such as invasion through basement membranes or vascular walls, this classical view of migration pertains to the ability of cancer cells to migrate over large distances24. Instead, our analysis reveals that even small amounts of localized cellular movement are able to markedly reshape a tumour. Moreover, we predict that the rate of tumour growth can be substantially altered by a change in dispersal rate of the cancer cells, even in the absence of any changes in doubling times or net growth rates of the cells within the tumour. Some of our predictions could be experimentally tested using new cell labelling techniques25,26. Our results could also greatly inform the interpretation of mutations in genes whose main functions seem to be related to the cytoskeleton or to cell adhesion rather than to cell birth, death, or differentiation27,28. For example, cells that have lost the expression of E-cadherin (a cell adhesion protein) are more migratory than normal cells with intact E-cadherin expression29, and loss of E-cadherin in pancreatic cancer has been associated with poorer prognosis30, in line with our predictions.
Methods
No statistical methods were used to predetermine sample size. Experiments were not randomized and investigators were not blinded to allocation during experiments and outcome assessment.
Spatial model for tumour evolution
Tumour modelling has a long tradition31. Many models of spatially expanding tumours were proposed in the past12–14,16,32–42, but they either assume very few32,34–37,39,41,43–47 or no new mutations at all12,15,38,48,49, or one- or two-dimensional growth12,13,32,33,50–52. On the other hand, well-mixed models with several mutations6,8,53,54 do not often include space, and computational models aimed at being more biologically realistic15,55–61 require too much computing resources (time and memory) to simulate realistically large tumours (_N_≈109 cells). Our model builds on the Eden lattice model62 and combines spatial growth and accumulation of multiple mutations. Since we focus on the interplay of genetics, spatial expansion and short-range dispersal of cells, for simplicity we do not explicitly model metabolism14, tissue mechanics, spatial heterogeneity of tissues, different types of cells present or angiogenesis16.
A tumour is made of non-overlapping balls (microlesions) of cells. Tumour cells occupy sites of a regular 3D square lattice (Moore neighbourhood, 26 neighbours). Empty lattice sites are assumed to be either normal cells or filled with extracellular matrix and are not modelled explicitly. Each cell in the model is described by its position and a list of genetic alterations that have occurred since the initial neo-plastic cell, and the information about whether a given mutation is a passenger, driver, or resistance-carrying mutation. A passenger mutation does not affect the net growth rate whereas a driver mutation increases it by disrupting tight regulation of cellular divisions and shifts the balance towards increased proliferation or decreased apoptosis. The changes can also be epigenetic and we do not distinguish between different types of alterations. We assume that each genetic alteration occurs only once (‘infinite allele model’63). The average numbers of all genetic alterations, driver and resistant genetic alterations produced in a single replication event are denoted by γ, _γ_d, and _γ_r, respectively. When a cell replicates, each of the daughter cells receives n new genetic alterations of each type (n being generally different in both cells) drawn at random from the Poisson probability distribution:
| P(n) =e−γx/2(γx/2)nn! | (1) |
|---|
in which x denotes the type of genetic alteration.
In model A shown in Figs 2–4, replication occurs stochastically, with rate proportional to the number of empty sites surrounding the replicating cell, and death occurs with constant rate depending only on the number of drivers. We also simulated other scenarios (models B, C and D, see below). Driver mutations increase the net growth rate (the difference between proliferation and death) either by increasing the birth rate or decreasing the death rate by a constant factor 1+s, in which _s_>0.
Dispersal is modelled by moving an offspring cell to a nearby position where it starts a new microlesion (Extended Data Fig. 1a). Microlesions repel each other; a ‘shoving’ algorithm64,65 (Extended Data Fig. 1b) ensures they do not merge.
Code availability
The computer code (available at http://www2.ph.ed.ac.uk/∼bwaclaw/cancer-code) can handle up to 1 × 10⁹ cells, which corresponds to tumours that are clinically meaningful and can be observed by conventional medical imaging (diameter >1 cm). The algorithm is discussed in details in the Supplementary Information. It is not an exact kinetic Monte Carlo algorithm because such an algorithm would be too slow to simulate large tumours. A comparison with kinetic Monte Carlo for smaller tumours (Supplementary Information) shows that both algorithms produce consistent results.
Model parameters
The initial birth rate b = ln(2) ≈ 0.69 days−1, which corresponds to a 24 h minimum doubling time. The initial death rate d = 0…0.995_b_ depends on the aggressiveness of the tumour (larger values = less aggressive lesion). In simulations of targeted therapy, we assume that, before treatment, b = 0.69 days−1 and d = 0.5_b_ = 0.35 days−1, whereas during treatment b = 0.35 days−1 and d = 0.69 days−1, that is, birth and death rates swap places. This rather arbitrary choice leads to the regrowth time of about 6 months, which agrees well with clinical evidence. Mutation probabilities are γ = 0.02, _γ_d = 4 × 10⁻⁵, _γ_r = 1 × 10⁻⁷, in line with experimental evidence and theoretical work8,66–68. Since there are no reliable data on the dispersal probability M, we have explored a range of values between M = 1 × 10⁻⁷ and 1 × 10⁻². All parameters are summarized in Extended Data Fig. 1c, see also further discussion in Supplementary Information.
Validity of the assumptions of the model
Our model is deliberately oversimplified. However, many of the assumptions we make can be experimentally justified or shown not to qualitatively affect the model.
Three-dimensional regular lattice of cells
The 3D Moore neighbourhood was chosen because it is computationally fast and introduces relatively fewer artefacts related to lattice symmetries. Real tissues are much less regular and the number of nearest neighbours is different69. However, recent simulations of similar models of bacterial colonies70,71 show that the structure of the lattice (or the lack thereof in off-lattice models) has a marginal effect on genetic heterogeneity.
Asynchronous cell division
Division times of related cells remain correlated for a few generations. However, stochastic cell division implemented in our model is a good approximation for a large mass of cells and is much less computationally expensive than modelling a full cell cycle.
Replication faster at the boundary than in the interior
Several studies have described a higher proliferation rate at the leading edge of tumours, and this has been associated with a more aggressive clinical course72. To estimate the range of values of death rate d for our model, we used the proliferation marker Ki67. Representative formalin-fixed, paraffin-embedded tissue blocks were selected from four small chromophobe renal cell carcinomas and six small hepatocellular carcinomas by the pathologist (M.E.P.). A section of each block was immunolabelled for Ki67 using the Ventana Benchmark XT system. Around 8–12 images, depending on the size of the lesion, were acquired from each tumour. Fields were chosen at random from the leading edge and the middle of the tumour and were not necessarily ‘hot spots’ of proliferative activity. Using an ImageJ macro, each Ki67-positive tumour nucleus was labelled green by the pathologist, and each Ki67-negative tumour nucleus was labelled red. Other cell types (endothelium, fibroblasts and inflammatory cells) were not labelled. The proliferation rate was then calculated using previously described methods73. Statistical significance of the results was determined using a Kolmogorov–Smirnov two-sample test (significance level 0.05). The study was approved by the Institutional Review Board of the Johns Hopkins University School of Medicine. In all ten tumours, the proliferation rate at the leading edge of the tumour was greater than that at the centre by a factor of 1.25 to 6 (Extended Data Table 1). Comparing the density of proliferating cells to our model gives d_≈0.5_b (range: d = 0.17_b_…0.8_b_), which is what we assume in the simulations of aggressive lesions.
Equal fitness of all cells in metastatic lesions
We assume that cells in a meta-static lesion are already very fit since they contain multiple drivers. Indeed, studies of primary tumours and their matched metastases usually fail to find driver mutations present in the metastases that were not present in the primary lesions2,74, although there are notable exceptions, see, for example, refs 75 and 76. Experimental evidence in microbes77 and (to a lesser extent) in eukaryotes78 suggests that fitness gains due to individual mutations are largest at the beginning of an evolutionary process and that the effects of later mutations are much smaller. It remains to be seen how well these results apply to late genetic alterations in cancer79 but if true, new drivers occurring in the lesion are unlikely to spread through the population before the lesion reaches a clinically relevant size.
Dispersal
In our model, cells detach from the lesion and attach again at a different location in the tissue. This can be viewed either as cells migrating from one place to another one, or as a more generic mechanism that allows tumour cells to get better access to nutrients by dispersing within the tissue, hence providing a growth advantage over cells that did not disperse. Some mechanisms that do not involve active motion (that is, cells becoming motile) are discussed below.
Migration
Cancer cells are known to undergo epithelial-to-mesenchymal transition, the origin of which is thought to be epigenetic18. This involves a cell becoming motile and moving some distance. If the cell finds the right environment, it can switch back to the non-motile phenotype and start a new lesion. Motility can be enhanced by tissue fluidization due to replication and death80. Instead of modelling the entire cycle (epithelial–mesenchymal–epithelial), we only model the final outcome (a cell has moved some distance).
Tumour buds
Many tumours exhibit focally invasive cell clusters, also known as tumour buds. Their proliferation rate is less than that of cells in the main tumour81. We propose that tumour buds contain cells that have not yet completed epithelial-to-mesenchymal transition and therefore they proliferate slower.
Single versus cluster migration
Ref. 82 found that circulating cancer cells can travel in clusters of 2–50 cells, and that such clusters can initiate metastatic foci. They report that approximately one-half of the metastatic foci they examined were initiated by single circulating cancer cells, and that circulating cancer cell clusters initiated the other half. The authors also note that the cells forming a cluster are probably neighbouring cancer cells from the primary tumour. This means that the genetic make-up of cells within a newly established lesion will be very similar, regardless of its origin (single cell versus a small cluster of cells). Therefore, the ability to travel in clusters should not affect the genetic heterogeneity or regrowth probability as compared to single-cell dispersal from our model.
Angiogenesis
We do not explicitly model angiogenesis for two reasons. First, most genetic alterations that can either change the growth rate or be detected experimentally must occur at early stages of tumour growth as explained before. Hence, the genetic make-up of the tumour is determined primarily by what happens before angiogenesis. Second, local dispersal from the model mimics tumour cells interspersing with the vascularized tissue and getting better access to nutrients, which is one of the outcomes of angiogenesis.
Biomechanics of tumours
Growth is affected by the mechanical properties of cells and the extracellular matrix. We do not explicitly include biomechanics (see, however, below), in contrast to more realistic models83,84, as this would not allow us to simulate lesions larger than about 1 × 10⁶ cells. Instead, we take experimentally determined values for birth and death rates, values that are affected by biomechanics, as the parameters of our model.
Isolated balls of cells
In our simulations, balls of cells are thought to be separated by normal, vascularized tissue which delivers nutrients to the tumour. The environment of each ball is the same, and there are no interactions between the balls other than mechanical repulsion. This represents a convenient mathematical contrivance and qualitatively recapitulates what is observed in stained sections of actual tumours (Fig. 1a). We investigated under which circumstances the balls of cancer cells would mechanically repel each other; see Extended Data Fig. 7 for a graphical summary of the results. We simulated a biomechanical, off-lattice model of normal tissue composed of ‘ducts’ lined with epithelial cells and separated by stroma (Supplementary Information, section 8). Mechanical interactions between cells were modelled using an approach similar to that described previously59,60,85, with model parameters taken from refs 59, 60, 85–88. We assumed cancer cells to be of epithelial origin, as are most cancers89. Cancer cells that invaded different areas of epithelium grew into balls that remained separated by thin slices of stroma (Supplementary Videos 8–11). This ‘encapsulation’ of tumour microlesions was possible owing to the supportive nature of stroma that is able to mechanically resist expansion of balls of cancer cells. Encapsulation is essential if the balls are to repel each other. If the tissue is ‘fluidized’ by random replication and death, the balls quickly merge (Supplementary Video 12). Another important factor are differences in mechanical properties of tumour and normal cells90; it is known that differences in cellular adhesion and stiffness promote segregation of different types of cells91,92.
In reality, microlesions within the primary tumour are less symmetric and some of them are better described as ‘protrusions’ bulging out from the main tumour tissue, owing to biomechanical instabilities; see, for example, refs 93, 94. However, stroma may still provide enough spatial separation, and the capillary network of blood vessels—either due to tumour angiogenesis or preexisting in the invaded tissue—may provide enough nutrients to the lesions so that our assumption of independently growing balls of cells remains valid. Therefore, we believe that modelling the tumour as a collection of non- or weakly-interacting microlesions is essentially correct. We also note that the existence of isolated balls is not necessary to explain our qualitative results: reduced heterogeneity and increased growth in the presence of migration. Supplementary Video 13 shows that even if the tissue is homogeneous and highly dynamical and there are no isolated balls of cells, migration leads to a considerable speedup of growth as compared to the case with no migration (Supplementary Video 14).
Tumour geometry and heterogeneity in the absence of driver mutations
Supplementary Videos 2 and 3 illustrate the process of growth of a tumour with maximally N = 107 cells, for M = 0 and M = 10−6, respectively, and for d = 0.5. Extended Data Fig. 2 shows snapshots from a single simulation for M = 0, _N_∼103, and d = 0 (no death, Extended Data Fig. 2a) and d = 0.9 (Extended Data Fig. 2b). In the latter case, cells are separated by empty sites (normal cells/extracellular matrix). Extended Data Fig. 2c shows that the tumour is almost spherically symmetric for M = 0. The symmetry is lost for small but non-zero M, and restored for larger M when the balls become smaller and their number increases. Extended Data Fig. 2c also shows that metastatic tumours contain many clonal sectors with passenger mutations. Extended Data Fig. 8a shows that the fraction G(r) of genetic alterations that are the same in two randomly sampled cells (Fig. 4) separated by distance r quickly decreases with r, indicating increased genetic heterogeneity owing to passenger mutations.
Targeted therapy of metastatic lesions
Models of cancer treatment21,95–100 often assume either no spatial structure or do not model the emergence of resistance. We assume that the cell that initiated the lesion was sensitive to treatment but its progeny may become resistant. Before the therapy commences, all cells have the same birth and death rates, but after the treatment resistant cells continue to proliferate with the same rate, whereas susceptible cells are assigned different rates as described above. Resistant cells can emerge before and during the therapy. The death rate of sensitive cells during treatment is greater than the birth rate, or the tumours would not be sensitive to the drug. For example, in Fig. 3 treatment increases the death rate and decreases the growth rate of susceptible cells, the growth rate of resistant cells after therapy is identical to that of the sensitive cells before treatment, d = 0.5_b_ in the absence of treatment, M = 10−6, and treatment begins when the tumour has N = 107 cells.
Note that our model assumes the drug is uniformly distributed in the tumour96; it is known that drug gradients can speed up the onset of resistance101.
Supplementary Video 1 and Extended Data Fig. 4a show that, since the process of resistance acquisition is stochastic, some tumours regrow after an initial regression, and some do not. If only resistant cells can migrate, regrowth is faster (Extended Data Fig. 4b, c). Extended Data Fig. 4d–g shows regrowth probabilities _P_regrowth for different treatment scenarios not mentioned in the main text, depending on whether the drug is cytostatic (_b_treatment = 0) or cytocidal (_d_treatment = b), and whether d = 0 or _d_>0 before treatment. In Extended Data Fig. 4d, cells replicate and die only on the surface, and the core is ‘quiescent’—cells are still alive there but cannot replicate unless outer layers are removed by treatment (Supplementary Videos 6 and 7). _P_regrowth does not depend on the dispersal probability M at all, and is close to 100% for N = 108 cells, a size that is larger than for _d_>0 (Extended Data Fig. 4f). It can be shown that P_regrowth = 1–exp(−_γrN). Extended Data Fig. 4e is for the cytostatic drug (_b_treatment = _d_treatment = 0); this is also equivalent to the cytocidal drug if the tumour has a necrotic core (cells are dead but still occupy physical volume). In this case, P_regrowth increases with M because more resistant cells are on the surface for larger M (cells can replicate only on the surface in this scenario). Extended Data Fig. 4f, g shows models with cell death present even in the absence of treatment (d = 0.9_b) but occurring only at the surface, unlike in Fig. 3 where cells also die inside the tumour. Death increases _P_regrowth owing to a larger number of cellular division necessary to obtain the same size, and hence more opportunities to mutate.
Relaxing the assumptions of the model
Figure 4 shows that even a small fitness advantage substantially reduces genetic diversity through the process of clonal expansion, see also Supplementary Videos 4 and 5. We now demonstrate that this also applies to modified versions of the model, proving its robustness.
Exact values of M and s has no qualitative effect
Extended Data Fig. 8b, e shows that the average number of shared genetic alterations is larger in the presence of drivers also in the case of non-zero dispersal (_M_>0), and its numerical value is almost the same as for M = 0 (Fig. 4). Extended Data Fig. 8c, f shows that as long as _s_>0 and regardless of its exact value, driver mutations reduce genetic diversity in the tumour compared to the case s = 0. Extended Data Fig. 5a–c shows how many driver mutations are expected to be present in a randomly chosen cell from a tumour that is T years old. Neither dispersal nor the way drivers affect growth (via birth or death rate) has a significant effect on the number of drivers per cell (Extended Data Fig. 5b, c). A small discrepancy visible in Extended Data Fig. 5b is caused by a slightly asymmetric way death and birth is treated in our model, see the Supplementary Information.
Model B
Cells replicate with constant rate if there is at least one empty neighbour. In the absence of drivers, genetic alterations are distributed evenly throughout the lesion (Extended Data Fig. 6b) but they often occur independently and the number of frequent genetic alterations is low (Extended Data Fig. 6e). Drivers cause clonal expansion as in model A.
Model C
Cells replicate regardless of whether there are empty sites surrounding them or not. When a cell replicates, it pushes away other cells towards the surface (Supplementary Information). Extended Data Fig. 6c, e shows that this again leads to clonal expansion which decreases diversity.
Model D
Replication/death occurs only on the surface and the core of the tumour is static. Extended Data Fig. 6d shows that driver mutations cannot spread to the other side of the lesion and conical clonal sectors can be seen even for _s_>0. The number of frequent genetic alterations is the same for s = 0 and s = 1%, indicating that genetic heterogeneity is not lowered by clonal expansion. This demonstrates that cell turnover inside the tumour is very important for reducing heterogeneity. To obtain the same (low) heterogeneity as for models a–c, the probability of driver mutations must be much larger in model D (Extended Data Fig. 6f).
Drivers affecting M
We investigated three scenarios in which drivers affect (1) only the dispersal probability _M_→(1+q)M, in which q_>0 is the ‘migration fitness advantage’ (no change in b, d), (2) both M and d, that is, (d, M)→ (d(1–_s),(1+q)M) with s, _q_>0, (3) either M or d, with probability 1/2. Extended Data Fig. 3c shows that growth is unaffected in cases (1, 3) compared to the neutral case. For (2) the tumour growth rate increases significantly when the tumour is larger than N = 1 × 10⁶ cells. This shows that migration increases the overall fitness advantage, in line with ref. 102, which shows that fixation probability is determined by the product of the exponential growth rate and diffusion constant (motility) of organisms.
Six-site (von Neumann) neighbourhood
We simulated a model in which each cell has only six neighbours (von Neumann neighbourhood) instead of 26 (Moore neighbourhood). Extended Data Fig. 9 compares models A and C for the two neighbourhoods and show that there is only a small quantitative difference in the growth curves for modelA (model C is unaffected), but that the shape of the ball of cells deviates more from the spherical one for the six-site neighbourhood, see also section 7 in the Supplementary Information.
Extended Data
Extended Data Figure 1. Details of the model.

a, A sketch showing how dispersal is implemented: (1) A ball of cells of radius Ri, in which the centre is at Xi, is composed of tumour cells and normal cells (blue and empty squares in the zoomed-in rectangle (2)). A cell at position xi with respect to the centre of the ball attempts to replicate (3). If replication is successful, the cell migrates with probability M and creates a new microlesion (4). The position Xj of this new ball of cells is determined as the endpoint of the vector that starts at Xi and has direction xi and length Ri. b, Overlap reduction between the balls of cells. When a growing ball begins to overlap with another ball (red), they are both moved apart along the line connecting their centres of mass (green line) by as much as necessary to reduce the overlap to zero. The process is repeated for all overlapping balls as many times as needed until there is no overlap. c, Summary of all parameters used in the model. If, for a given parameter, many different values have been used in different plots, a range of values used is shown. Birth and death rates can also depend on the number of driver mutations, see Methods. Asterisk, parameter estimated from other quantities available in the literature.
Extended Data Figure 2. Simulation snapshots.
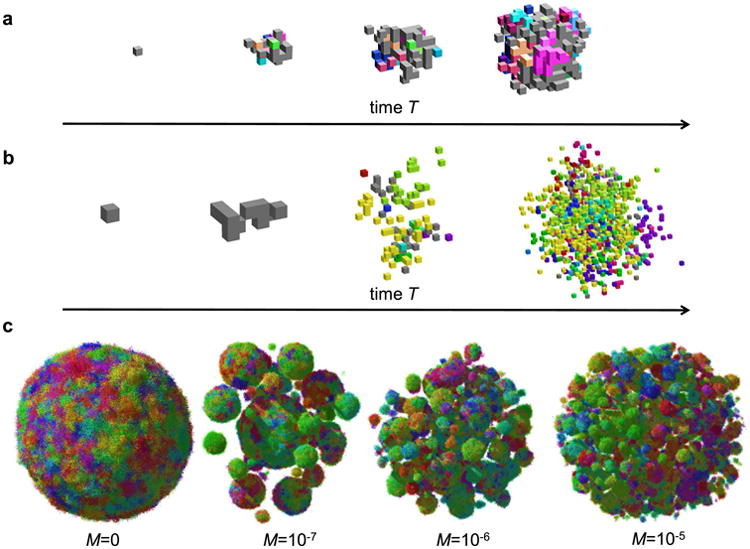
a, b, A few snapshots of tumour growth for no dispersal, and d = 0 (a) and d = 0.9_b_ (b). To visualize clonal sectors, cells have been colour-coded by making the colour a heritable trait and changing each of its RGB components by a small random fraction whenever a cell mutates. The initial cell is grey. Empty space (white) are non-cancer cells mixed with extracellular matrix. Note that images are not to scale. c, Tumour shapes for N = 1 × 10⁷, d = 0.9_b_, and different dispersal probability M. Images not to scale; the tumour for M = 1 × 10⁻⁵ is larger than the one for M = 0.
Extended Data Figure 3. Tumour size as a function of time.

a, Growth of a tumour without dispersal (M = 0), for d = 0.8_b_. For large times (T), the number of cells grows approximately as const × _T_3. The tumour reaches size N = 1 × 10⁹ cells (horizontal line) after about 100 months (8 years) of growth. b, The same data are plotted in the linear scale, with N replaced by ‘linear extension’ N_1/3. c, Tumour size versus time when drivers affect the dispersal probability. In all cases, d = 0.9_b, and (1, black) drivers increase the dispersal rate tenfold (q = 9) but have no effect on the net growth rate; (2, red) drivers increase both the net growth rate (s = 10%) and M; (3, green) drivers either (with probability 1/2) increase M tenfold (q = 9) or increase the net growth rate by s = 10%; (4, blue) drivers increase only the net growth rate by s = 10%; and (5, black dashed line) neutral case with M = 1 × 10⁻⁷, which is indistinguishable from (1). In all cases (1–3) the initial dispersal probability M = 1 × 10⁻⁷. Points represent average value over 40–100 simulations per data point, error bars are s.e.m.
Extended Data Figure 4. Simulation of targeted therapy.
a–c, The total number of cells in the tumour (black) and the number or resistant cells (red) versus time, during growth (T < 0) and treatment (T_ > 0), for ∼100 independent simulations, for d = 0.5_b for T<0. Therapy begins when _N_ = 1 × 10⁶ cells. After treatment, many tumours die out (N decreases to zero) but those with resistant cells will regrow sooner or later. a**, M = 0 for all cells at all times. b, M = 0 for all cells for T<0 and _M_ = 10−4 for resistant cells for _T_>0. c, M = 0 for non-resistant and M = 10−5 for resistant cells at all times. In all three cases, _P_regrowth is very similar: 36±5% (mean 6 s.e.m.) (a), 25±4% (b), and 27 ± 6% for (c). d–g**, Regrowth probability for four treatment scenarios not discussed in the main text. Data points correspond to three dispersal probabilities: M = 0 (red), M = 1 × 10⁻⁵ (green), and M = 1 × 10⁻⁴ (blue). The probability is plotted as a function of tumour size N just before the therapy commences. d, Before treatment, cells replicate only on the surface. Cells in the core are quiescent and do not replicate. Therapy kills cells on the surface and cells in the core resume proliferation when liberated by treatment. e, As in d, but drug is cytostatic and does not kill cells but inhibits their growth. The results for _P_regrowth are identical if the drug is cytotoxic and the tumour has a necrotic core (cells die inside the tumour and cannot replicate even if the surface is removed). f, Before treatment, cells replicate and die on the surface. The core is quiescent. Therapy kills cells on the surface (cytotoxic drug). g, As in f, but therapy only inhibits growth (cytostatic drug). In all cases (d–g) error bars represent s.e.m. from 8–1,000 simulations per point.
Extended Data Figure 5. Accumulation of driver and passenger genetic alterations.

a–c, The number of drivers per cell in the primary tumour plotted as a function of time (10–100 simulations per point, error bars denote s.e.m.). a, M = 0 and three different driver selective advantages. For s = 1%, cells accumulate on average one driver mutation within 5 years. The time can be significantly lower for very strong drivers (s >1%). b, The rate at which drivers accumulate depends mainly on their selective advantage and not on whether they affect death or birth rate. c, Dispersal does not affect the rate of driver accumulation. d, e, The number of passenger mutations (PMs) per cell versus the number of driver mutations per cell. More passenger mutations are present for smaller driver selective advantage (d), and this is independent of the dispersal probability M(e) in the regime of small M. Data points correspond to independent simulations.
Extended Data Figure 6. Genetic diversity in a single lesion for different models.
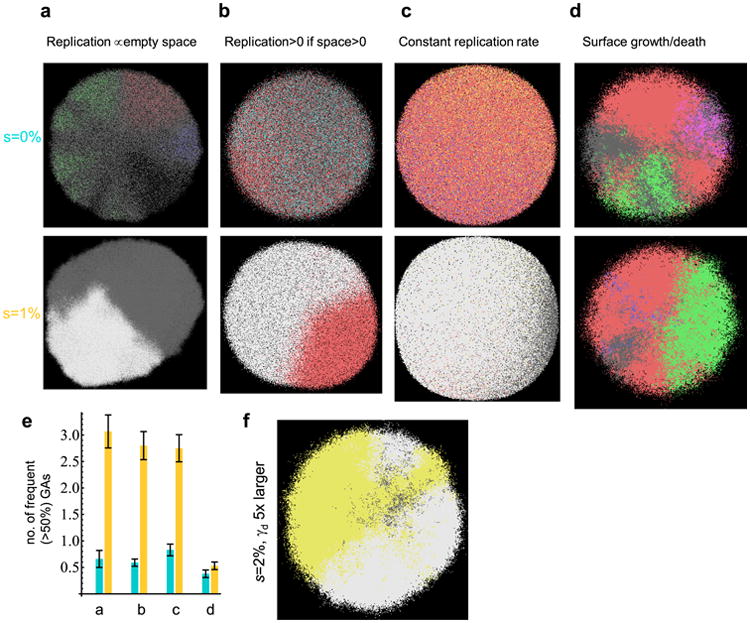
a–d, Representative simulation snapshots, with genetic alterations colour-coded asin Fig. 4. Top: s = 0, bottom: s = 1%. a, Model A from the main text in which cells replicate with rates proportional to the number of empty nearby sites. b, Model B, the replication rate is constant and non-zero if there is at least one empty site nearby, and zero otherwise. c, Model C, cells replicate at a constant rate and push away other cells to make space for their progeny. d, Model D, cells replicate/die only on the surface, the interior of the tumour (‘necrotic core’) is static. In all cases, N = 1 × 10⁷, d = 0.99_b_. e, Number of genetic alterations present in at least 50% of cells for identical parameters as in a–d. In all cases except surface growth (d), drivers increase genetic homogeneity, as measured by the number of most frequent genetic alterations. Results averaged over 50–100 simulations, error bars denote s.e.m. f, Model D, with _γ_d = 2 × 10⁻⁴ instead of 4 × 10⁻⁵, that is, drivers occur five times more often. In this case, driver mutations arise earlier than in d, and the tumour becomes more homogeneous.
Extended Data Figure 7. The off-lattice model.
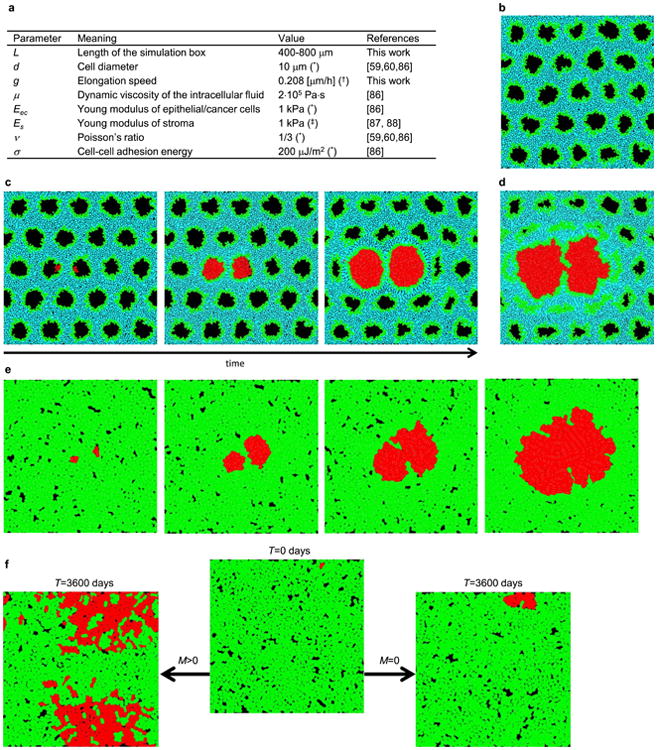
a, Summary of all parameters used in the model. Asterisk, typical value, varies between different types of tissues; dagger symbol, equivalent to 24 h minimal doubling time; double dagger symbol, based on the assumption that macroscopic elastic properties of tissues such as liver, pancreases or mammary glands are primarily determined by the elastic properties of stroma. b, Simulation snapshot of a normal tissue before the invasion of cancer cells. c, Two balls of cancer cells in two nearby ducts repel each other as they grow as a consequence of mechanical forces exerted on each other. d, The balls coalesce if growth is able to break the separating extracellular matrix. e, If the balls are not encapsulated, they quickly merge. f, Isolated balls of cells are not required to speed up growth; migration (left) can cause the tumour to expand much faster even if individual microlesions merge together, as opposed to the case with no migration (right).
Extended Data Figure 8. Genetic diversity quantified.

a, Tumours are much more genetically heterogeneous in the absence of driver mutations (s = 0) (see Fig. 4). The plot shows the fraction G(r) of genetic alterations (GAs) shared between the cells as function of their separation (distance r) in the tumour. The fraction quickly decreases with increasing r. The distance in the figure is normalized by the average distance <_r_> between any two cells in the tumour. For a spherical tumour, <_r_> is approximately equal to half of the tumour diameter. b, Fraction of shared genetic alterations for s = 1% and s = 0%, N = 1 × 10⁷, and M = 1 × 10⁻⁷. In the presence of drivers, G(r) decays slower, indicating more homogeneous tumours. c, The exact value of the selective advantage of driver mutations is not important (all curves G(r) look the same, except for s = 0) as long as _s_>0. d–f, Number of genetic alterations present in at least 50% of cells for identical parameters as in a–c, correspondingly. Drivers substantially increase the level of genetic homogeneity. In all panels the results have been averaged over 30–100 simulations, with error bars as s.e.m.
Extended Data Figure 9. Growth curves for the 26-nearest neighbours (26_n_, red curves) and the 6-nearest neighbours (6_n_, green curves) models.
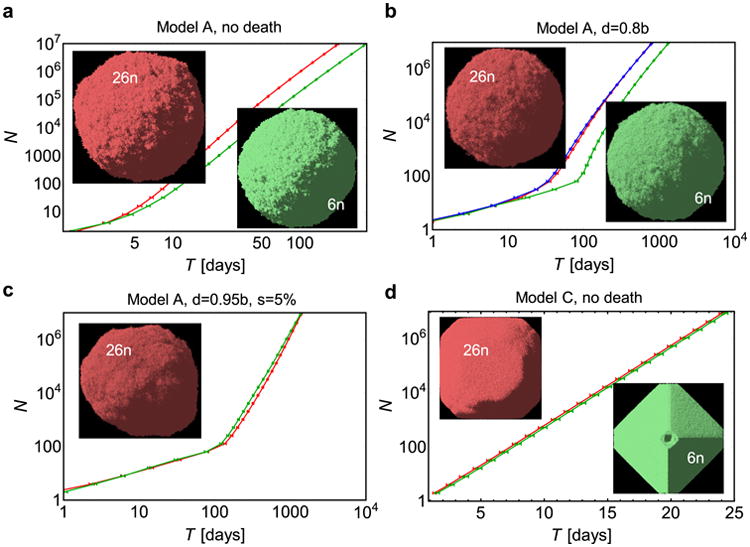
a, Model A (as in the main text), no death. The tumour grows about twice as slow in the 6n model. Pictures show tumour snapshots for both models; there is no visible difference in the shape. b, Model A, death d = 0.8_b_. The additional blue curve is for the 6_n_ model, with modified replication probability to account for missing neighbours as explained in the Supplementary Information. c, Model A, with death d = 0.95_b_, and drivers s = 5%. There is very little difference in the growth curves between the 6n and 26_n_ models. A small asymmetry in the shape is caused by faster-growing cells with driver mutations. d, Model C (exponential growth). Growth is the same in both 6_n_ and 26_n_ models, but the shape is more aspheric for the 6_n_ model. This is probably caused by shifting cells along the coordinate axes and not along the shortest path to the surface when making space for new cells. All plots show the mean (average over 50–100 simulations) and s.e.m.
Extended Data Table 1. Experimental results for the percentage of proliferating cells in the centre versus the edge of solid tumours.
| Edge | Center | Ratio center:edge | p-value | ||||||
|---|---|---|---|---|---|---|---|---|---|
| Case | Tumor type | Images | KI % | Total no. of cells | Images | KI % | Total no. of cells | ||
| 1 | Chromophobe RCC | 8 | 3.46 | 1013 | 3 | 1.11 | 2561 | 0.32 | 0.05 |
| 2 | Chromophobe RCC | 5 | 3.07 | 508 | 3 | 1.05 | 938 | 0.34 | 0.28 |
| 3 | Chromophobe RCC | 5 | 2.63 | 524 | 3 | 0.44 | 697 | 0.17 | 0.03 |
| 4 | Chromophobe RCC | 7 | 1.58 | 581 | 2 | 0.53 | 958 | 0.34 | 0.17 |
| 5 | HCC | 7 | 17.14 | 892 | 2 | 9.74 | 1637 | 0.57 | 0.05 |
| 6 | HCC | 7 | 51.71 | 1079 | 4 | 32.84 | 2562 | 0.64 | 0.03 |
| 7 | HCC | 6 | 47.37 | 435 | 3 | 19.97 | 1397 | 0.42 | 0.09 |
| 8 | HCC | 7 | 19.02 | 895 | 4 | 13.78 | 1191 | 0.72 | 0.35 |
| 9 | HCC | 6 | 15.09 | 1074 | 3 | 11.98 | 1094 | 0.79 | 0.33 |
| 10 | HCC | 9 | 29.84 | 1305 | 2 | 20.87 | 2457 | 0.70 | 0.22 |
| Summary | |||||||||
| 1-4 | Chromophobe RCC | 25 | 2.69 | --- | 11 | 0.81 | --- | 0.30 | 0.00002 |
| 5-10 | HCC | 42 | 30.0 | --- | 18 | 19.1 | --- | 0.64 | 0.007 |
Supplementary Material
suppl file
Acknowledgments
Support from The John Templeton Foundation is gratefully acknowledged. B.W. was supported by the Leverhulme Trust Early-Career Fellowship, and the Royal Society of Edinburgh Personal Research Fellowship. I.B. was supported by Foundational Questions in Evolutionary Biology Grant RFP-12-17. M.E.P., R.H.H. and B.V. acknowledge support from The Virginia and D.K. Ludwig Fund for Cancer Research, The Lustgarten Foundation for Pancreatic Cancer Research, The Sol Goldman Center for Pancreatic Cancer Research, and NIH grants CA43460 and CA62924.
Footnotes
Author Information: The authors declare no competing financial interests. Readers are welcome to comment on the online version of the paper.
Supplementary Information is available in the online version of the paper.
Author Contributions: B.W., M.A.N., I.B. and B.V. designed the study. B.W. wrote the computer programs and made simulations. B.W., I.B. and M.A.N. made analytic calculations. M.E.P. and R.H.H. carried out experimental work. All authors discussed the results. The manuscript was written primarily by B.W., M.A.N., I.B. and B.V., with contributions from M.E.P. and R.H.H.
Online Content Methods, along with any additional Extended Data display items and Source Data, are available in the online version of the paper; references unique to these sections appear only in the online paper.
References
- 1.Vogelstein B, et al. Cancer genome landscapes. Science. 2013;339:1546–1558. doi: 10.1126/science.1235122. [DOI] [PMC free article] [PubMed] [Google Scholar]
- 2.Yachida S, et al. Distant metastasis occurs late during the genetic evolution of pancreatic cancer. Nature. 2010;467:1114–1117. doi: 10.1038/nature09515. [DOI] [PMC free article] [PubMed] [Google Scholar]
- 3.Sottoriva A, et al. Intratumor heterogeneity in human glioblastoma reflects cancer evolutionary dynamics. Proc Natl Acad Sci USA. 2013;110:4009–4014. doi: 10.1073/pnas.1219747110. [DOI] [PMC free article] [PubMed] [Google Scholar]
- 4.Navin N, et al. Tumour evolution inferred by single-cell sequencing. Nature. 2011;472:90–94. doi: 10.1038/nature09807. [DOI] [PMC free article] [PubMed] [Google Scholar]
- 5.Gerlinger M, et al. Intratumor heterogeneity and branched evolution revealed by multiregion sequencing. N Engl J Med. 2012;366:883–892. doi: 10.1056/NEJMoa1113205. [DOI] [PMC free article] [PubMed] [Google Scholar]
- 6.Gatenby RA, Vincent TL. An evolutionary model of carcinogenesis. Cancer Res. 2003;63:6212–6220. [PubMed] [Google Scholar]
- 7.Johnston MD, Edwards CM, Bodmer WF, Maini PK, Chapman SJ. Mathematical modeling of cell population dynamics in the colonic crypt and in colorectal cancer. Proc Natl Acad Sci USA. 2007;104:4008–4013. doi: 10.1073/pnas.0611179104. [DOI] [PMC free article] [PubMed] [Google Scholar]
- 8.Bozic I, et al. Accumulation of driver and passenger mutations during tumor progression. Proc Natl Acad Sci USA. 2010;107:18545–18550. doi: 10.1073/pnas.1010978107. [DOI] [PMC free article] [PubMed] [Google Scholar]
- 9.Beerenwinkel N, et al. Genetic progression and the waiting time to cancer. PLOS Comput Biol. 2007;3:e225. doi: 10.1371/journal.pcbi.0030225. [DOI] [PMC free article] [PubMed] [Google Scholar]
- 10.Durrett R, Moseley S. Evolution of resistance and progression to disease during clonal expansion of cancer. Theor Popul Biol. 2010;77:42–48. doi: 10.1016/j.tpb.2009.10.008. [DOI] [PubMed] [Google Scholar]
- 11.González-Garcia I, Sole RV, Costa J. Metapopulation dynamics and spatial heterogeneity in cancer. Proc Natl Acad Sci USA. 2002;99:13085–13089. doi: 10.1073/pnas.202139299. [DOI] [PMC free article] [PubMed] [Google Scholar]
- 12.Thalhauser CJ, Lowengrub JS, Stupack D, Komarova NL. Selection in spatial stochastic models of cancer: migration as a key modulator of fitness. Biol Direct. 2010;5:21. doi: 10.1186/1745-6150-5-21. [DOI] [PMC free article] [PubMed] [Google Scholar]
- 13.Martens EA, Kostadinov R, Maley CC, Hallatschek O. Spatial structure increases the waiting time for cancer. New J Phys. 2011;13:115014. doi: 10.1088/1367-2630/13/11/115014. [DOI] [PMC free article] [PubMed] [Google Scholar]
- 14.Anderson ARA, Weaver AM, Cummings PT, Quaranta V. Tumor morphology and phenotypic evolution driven by selective pressure from the microenvironment. Cell. 2006;127:905–915. doi: 10.1016/j.cell.2006.09.042. [DOI] [PubMed] [Google Scholar]
- 15.Kim Y, Magdalena AS, Othmer HG. A hybrid model for tumor spheroid growth in vitro I:theoretical development and early results. Math Models Methods Appl Sci. 2007;17:1773–1798. [Google Scholar]
- 16.McDougall SR, Anderson AR, Chaplain MA. Mathematical modeling of dynamic adaptive tumour-induced angiogenesis: clinical implications and therapeutic targeting strategies. J Theor Biol. 2006;241:564–589. doi: 10.1016/j.jtbi.2005.12.022. [DOI] [PubMed] [Google Scholar]
- 17.Hawkins-Daarud A, Rockne RC, Anderson ARA, Swanson KR. Modeling tumor-associated edema in gliomas during anti-angiogenic therapy and its impact on imageable tumor. Front Oncol. 2013;3:66. doi: 10.3389/fonc.2013.00066. [DOI] [PMC free article] [PubMed] [Google Scholar]
- 18.McDonald OG, Wu H, Timp W, Doi A, Feinberg AP. Genome-scale epigenetic reprogramming during epithelial-to-mesenchymal transition. Nature Struct Mol Biol. 2011;18:867–874. doi: 10.1038/nsmb.2084. [DOI] [PMC free article] [PubMed] [Google Scholar]
- 19.Komarova NL, Wodarz D. Drug resistance in cancer: principles of emergence and prevention. Proc Natl Acad Sci USA. 2005;102:9714–9719. doi: 10.1073/pnas.0501870102. [DOI] [PMC free article] [PubMed] [Google Scholar]
- 20.Bozic I, Allen B, Nowak MA. Dynamics of targeted cancer therapy. Trends Mol Med. 2012;18:311–316. doi: 10.1016/j.molmed.2012.04.006. [DOI] [PMC free article] [PubMed] [Google Scholar]
- 21.Bozic I, Nowak MA. Timing and heterogeneity of mutations associated with drug resistance in metastatic cancers. Proc Natl Acad Sci USA. 2014;111:15964–15968. doi: 10.1073/pnas.1412075111. [DOI] [PMC free article] [PubMed] [Google Scholar]
- 22.Turke AB, et al. Preexistence and clonal selection of MET amplification in EGFR mutant NSCLC. Cancer Cell. 2010;17:77–88. doi: 10.1016/j.ccr.2009.11.022. [DOI] [PMC free article] [PubMed] [Google Scholar]
- 23.Komarova NL. Spatial interactions and cooperation can change the speed of evolution of complex phenotypes. Proc Natl Acad Sci USA. 2014;111:10789–10795. doi: 10.1073/pnas.1400828111. [DOI] [PMC free article] [PubMed] [Google Scholar]
- 24.Talmadge JE, Fidler IJ. AACR Centennial Series: the biology of cancer metastasis: historical perspective. Cancer Res. 2010;70:5649–5669. doi: 10.1158/0008-5472.CAN-10-1040. [DOI] [PMC free article] [PubMed] [Google Scholar]
- 25.Alcolea MP, et al. Differentiation imbalance in single oesophageal progenitor cells causes clonal immortalization and field change. Nature Cell Biol. 2014;16:615–622. doi: 10.1038/ncb2963. [DOI] [PMC free article] [PubMed] [Google Scholar]
- 26.Weber K, et al. RGB marking facilitates multicolor clonal cell tracking. Nature Med. 2011;17:504–509. doi: 10.1038/nm.2338. [DOI] [PubMed] [Google Scholar]
- 27.Bordeleau F, Alcoser TA, Reinhart-King CA. Physical biology in cancer. 5. The rocky road of metastasis: the role of cytoskeletal mechanics in cell migratory response to 3D matrix topography. Am J Physiol CellPhysiol. 2014;306:C110–C120. doi: 10.1152/ajpcell.00283.2013. [DOI] [PMC free article] [PubMed] [Google Scholar]
- 28.Lawson CD, Burridge K. The on-off relationship of Rho and Rac during integrin-mediated adhesion and cell migration. Small GTPases. 2014;5:e27958. doi: 10.4161/sgtp.27958. [DOI] [PMC free article] [PubMed] [Google Scholar]
- 29.Gall TMH, Frampton AE. Gene of the month: E-cadherin (CDH1) J Clin Pathol. 2013;66:928–932. doi: 10.1136/jclinpath-2013-201768. [DOI] [PubMed] [Google Scholar]
- 30.Winter JM, et al. Absence of E-cadherin expression distinguishes noncohesive from cohesive pancreatic cancer. Clin Cancer Res. 2008;14:412–418. doi: 10.1158/1078-0432.CCR-07-0487. [DOI] [PMC free article] [PubMed] [Google Scholar]
- 31.Rodriguez-Brenes IA, Komarova NL, Wodarz D. Tumor growth dynamics: insights into somatic evolutionary processes. Trends Ecol Evol. 2013;28:597–604. doi: 10.1016/j.tree.2013.05.020. [DOI] [PubMed] [Google Scholar]
- 32.Anderson ARA. A hybrid mathematical model of solid tumour invasion: the importance of cell adhesion. Math Med Biol. 2005;22:163–186. doi: 10.1093/imammb/dqi005. [DOI] [PubMed] [Google Scholar]
- 33.Komarova NL. Spatial stochastic models for cancer initiation and progression. Bull Math Biol. 2006;68:1573–1599. doi: 10.1007/s11538-005-9046-8. [DOI] [PubMed] [Google Scholar]
- 34.Lavrentovich MO, Nelson DR. Survival probabilities at spherical frontiers. Theor Popul Biol. 2015;102:26–39. doi: 10.1016/j.tpb.2015.03.002. [DOI] [PubMed] [Google Scholar]
- 35.Komarova NL. Spatial stochastic models of cancer: fitness, migration, invasion. Math Biosci Eng. 2013;10:761–775. doi: 10.3934/mbe.2013.10.761. [DOI] [PubMed] [Google Scholar]
- 36.Manem VSK, Kohandel M, Komarova NL, Sivaloganathan S. Spatial invasion dynamics on random and unstructured meshes: implications for heterogeneous tumor populations. J Theor Biol. 2014;349:66–73. doi: 10.1016/j.jtbi.2014.01.009. [DOI] [PMC free article] [PubMed] [Google Scholar]
- 37.Durrett R, Foo J, Leder K. Spatial Moran models, II: cancer initiation in spatially structured tissue. J Math Biol. 2015 doi: 10.1007/s00285-015-0912-1. http://dx.doi.org/10.1007/s00285-015-0912-1. [DOI] [PMC free article] [PubMed]
- 38.Gerlee P, Nelander S. The impact of phenotypic switching on glioblastoma growth and invasion. PLOS Comput Biol. 2012;8:e1002556. doi: 10.1371/journal.pcbi.1002556. [DOI] [PMC free article] [PubMed] [Google Scholar]
- 39.González-García I, Solé RV, Costa J. Metapopulation dynamics and spatial heterogeneity in cancer. Proc Natl Acad Sci USA. 2002;99:13085–13089. doi: 10.1073/pnas.202139299. [DOI] [PMC free article] [PubMed] [Google Scholar]
- 40.Sehyo CC, et al. Model for in vivo progression of tumors based on co-evolving cell population and vasculature. Sci Rep. 2011;1:31. doi: 10.1038/srep00031. [DOI] [PMC free article] [PubMed] [Google Scholar]
- 41.Torquato S. Toward an Ising model of cancer and beyond. Phys Biol. 2011;8:015017. doi: 10.1088/1478-3975/8/1/015017. [DOI] [PMC free article] [PubMed] [Google Scholar]
- 42.Reiter JG, Bozic I, Allen B, Chatterjee K, Nowak MA. The effect of one additional driver mutation on tumor progression. Evol Appl. 2013;6:34–45. doi: 10.1111/eva.12020. [DOI] [PMC free article] [PubMed] [Google Scholar]
- 43.Kansal AR, Torquato S, Harsh GR, Chiocca EA, Deisboeck TS. Simulated brain tumor growth dynamics using a three-dimensional cellular automaton. J Theor Biol. 2000;203:367–382. doi: 10.1006/jtbi.2000.2000. [DOI] [PubMed] [Google Scholar]
- 44.Kansal AR, Torquato S, Chiocca EA, Deisboeck TS. Emergence of a subpopulation in a computational model of tumor growth. J Theor Biol. 2000;207:431–441. doi: 10.1006/jtbi.2000.2186. [DOI] [PubMed] [Google Scholar]
- 45.Antal T, Krapivsky PL, Nowak MA. Spatial evolution of tumors with successive driver mutations. Phys Rev E. 2015;92:022705. doi: 10.1103/PhysRevE.92.022705. [DOI] [PubMed] [Google Scholar]
- 46.Enderling H, Hlatky L, Hahnfeldt P. Migration rules: tumours are conglomerates of self-metastases. Br J Cancer. 2009;100:1917–1925. doi: 10.1038/sj.bjc.6605071. [DOI] [PMC free article] [PubMed] [Google Scholar]
- 47.Sottoriva A, et al. Cancer stem cell tumor model reveals invasive morphology and increased phenotypical heterogeneity. Cancer Res. 2010;70:46–56. doi: 10.1158/0008-5472.CAN-09-3663. [DOI] [PubMed] [Google Scholar]
- 48.Schaller G, Meyer-Hermann M. Multicellular tumor spheroid in an off-lattice voronoi-delaunay cell model. Phys Rev E. 2005;71:051910. doi: 10.1103/PhysRevE.71.051910. [DOI] [PubMed] [Google Scholar]
- 49.Radszuweit M, Block M, Hengstler JG, Schöll E, Drasdo D. Comparing the growth kinetics of cell populations in two and three dimensions. Phys Rev E. 2009;79:051907. doi: 10.1103/PhysRevE.79.051907. [DOI] [PubMed] [Google Scholar]
- 50.Moglia B, Guisoni N, Albano EV. Interfacial properties in a discrete model for tumor growth. Phys Rev E. 2013;87:032713. [Google Scholar]
- 51.Foo J, Leder K, Ryser M. Multifocality and recurrence risk: a quantitative model of field cancerization. J Theor Biol. 2014;355:170–184. doi: 10.1016/j.jtbi.2014.02.042. [DOI] [PMC free article] [PubMed] [Google Scholar]
- 52.Poleszczuk J, Hahnfeldt P, Enderling H. Evolution and phenotypic selection of cancer stem cells. PLOS Comput Biol. 2015;11:e1004025. doi: 10.1371/journal.pcbi.1004025. [DOI] [PMC free article] [PubMed] [Google Scholar]
- 53.Durrett R, Schmidt D, Schweinsberg J. A waiting time problem arising from the study of multi-stage carcinogenesis. Ann Appl Probab. 2009;19:676–718. [Google Scholar]
- 54.Spencer SL, Berryman MJ, García JA, Abbott D. An ordinary differential equation model for the multistep transformation to cancer. J Theor Biol. 2004;231:515–524. doi: 10.1016/j.jtbi.2004.07.006. [DOI] [PubMed] [Google Scholar]
- 55.Kim Y, Othmer HG. A hybrid model of tumor–stromal interactions in breast cancer. Bull Math Biol. 2013;75:1304–1350. doi: 10.1007/s11538-012-9787-0. [DOI] [PMC free article] [PubMed] [Google Scholar]
- 56.Ramis-Conde I, Chaplain MAJ, Anderson ARA, Drasdo D. Multi-scale modelling of cancer cell intravasation: the role of cadherins in metastasis. Phys Biol. 2009;6:016008. doi: 10.1088/1478-3975/6/1/016008. [DOI] [PubMed] [Google Scholar]
- 57.Swanson KR, et al. Quantifying the role of angiogenesis in malignant progression of gliomas: in silico modeling integrates imaging and histology. Cancer Res. 2011;71:7366–7375. doi: 10.1158/0008-5472.CAN-11-1399. [DOI] [PMC free article] [PubMed] [Google Scholar]
- 58.Taloni A, et al. Mechanical properties of growing melanocytic nevi and the progression to melanoma. PLoS ONE. 2014;9:e94229. doi: 10.1371/journal.pone.0094229. [DOI] [PMC free article] [PubMed] [Google Scholar]
- 59.Drasdo D, Höhme S. A single-cell-based model of tumor growth in vitro: monolayers and spheroids. Phys Biol. 2005;2:133. doi: 10.1088/1478-3975/2/3/001. [DOI] [PubMed] [Google Scholar]
- 60.Drasdo D, Hoehme S, Block M. On the role of physics in the growth and pattern formation of multi-cellular systems: what can we learn from individual-cell based models? J Stat Phys. 2007;128:287–345. [Google Scholar]
- 61.Jiang Y, Pjesivac-Grbovic J, Cantrell C, Freyer JP. A multiscale model for avascular tumor growth. Biophys J. 2005;89:3884–3894. doi: 10.1529/biophysj.105.060640. [DOI] [PMC free article] [PubMed] [Google Scholar]
- 62.Eden M. In: A Two-Dimensional Growth Process. Family F, Vicsek T, editors. World Scientific; 1961. pp. 265–283. [Google Scholar]
- 63.Hartl DL, Clark AG. Principles of Population Genetics. Sinauer Associates; 1997. [Google Scholar]
- 64.Kreft JU, Booth G, Wimpenny JWT. BacSim, a simulator for individual-based modelling of bacterial colony growth. Microbiology. 1998;144:3275–3287. doi: 10.1099/00221287-144-12-3275. [DOI] [PubMed] [Google Scholar]
- 65.Lardon LA, et al. iDynoMiCS: Next-generation individual-based modelling of biofilms. Environ Microbiol. 2011;13:2416–2434. doi: 10.1111/j.1462-2920.2011.02414.x. [DOI] [PubMed] [Google Scholar]
- 66.Jones S, et al. Comparative lesion sequencing provides insights into tumor evolution. Proc Natl Acad Sci USA. 2008;105:4283–4288. doi: 10.1073/pnas.0712345105. [DOI] [PMC free article] [PubMed] [Google Scholar]
- 67.Wang TL, et al. Prevalence of somatic alterations in the colorectal cancer cell genome. Proc Natl Acad Sci USA. 2002;99:3076–3080. doi: 10.1073/pnas.261714699. [DOI] [PMC free article] [PubMed] [Google Scholar]
- 68.Diaz LA, Jr, et al. The molecular evolution of acquired resistance to targeted EGFR blockade in colorectal cancers. Nature. 2012;486:537–540. doi: 10.1038/nature11219. [DOI] [PMC free article] [PubMed] [Google Scholar]
- 69.Honda H, Morita T, Tanabe A. Establishment of epidermal cell columns in mammalian skin: computer simulation. J Theor Biol. 1979;81:745–759. doi: 10.1016/0022-5193(79)90279-0. [DOI] [PubMed] [Google Scholar]
- 70.Ali A, Somfai E, Grosskinsky S. Reproduction-time statistics and segregation patterns in growing populations. Phys Rev E. 2012;85:021923. doi: 10.1103/PhysRevE.85.021923. [DOI] [PubMed] [Google Scholar]
- 71.Korolev KS, Xavier JB, Nelson DR, Foster KR. Data from: a quantitative test of population genetics using spatio-genetic patterns in bacterial colonies. Dryad Digital Repository. 2011 doi: 10.1086/661897. http://dx.doi.org/10.5061/dryad.3147q. [DOI] [PMC free article] [PubMed]
- 72.Gong P, Wang Y, Liu G, Zhang J, Wang Z. New insight into Ki67 expression at the invasive front in breast cancer. PLoS ONE. 2013;8:e54912. doi: 10.1371/journal.pone.0054912. [DOI] [PMC free article] [PubMed] [Google Scholar]
- 73.Ellison TA, et al. A single institution's 26-year experience with nonfunctional pancreatic neuroendocrine tumors: a validation of current staging systems and a new prognostic nomogram. Ann Surg. 2014;259:204–212. doi: 10.1097/SLA.0b013e31828f3174. [DOI] [PMC free article] [PubMed] [Google Scholar]
- 74.Jones S, et al. Comparative lesion sequencing provides insights into tumor evolution. Proc Natl Acad Sci USA. 2008;105:4283–4288. doi: 10.1073/pnas.0712345105. [DOI] [PMC free article] [PubMed] [Google Scholar]
- 75.Lindstrom LS, et al. Clinically used breast cancer markers such as estrogen receptor, progesterone receptor, and human epidermal growth factor receptor 2 are unstable throughout tumor progression. J Clin Oncol. 2012;30:2601–2608. doi: 10.1200/JCO.2011.37.2482. [DOI] [PubMed] [Google Scholar]
- 76.Voss MH, et al. Tumor genetic analyses of patients with metastatic renal cell carcinoma and extended benefit from mTOR inhibitor therapy. Clin Cancer Res. 2014;20:1955–1964. doi: 10.1158/1078-0432.CCR-13-2345. [DOI] [PMC free article] [PubMed] [Google Scholar]
- 77.Wiser MJ, Ribeck N, Lenski RE. Long-term dynamics of adaptation in asexual populations. Science. 2013;342:1364–1367. doi: 10.1126/science.1243357. [DOI] [PubMed] [Google Scholar]
- 78.White TC. Increased mRNA Levels of ERG16, CDR, and MDR1 correlate with increases in azole resistance in Candida albicans isolates from a patient infected with human immunodeficiency virus. Antimicrob Agents Chemother. 1997;41:1482–1487. doi: 10.1128/aac.41.7.1482. [DOI] [PMC free article] [PubMed] [Google Scholar]
- 79.McGranahan N, et al. Clonal status of actionable driver events and the timing of mutational processes in cancer evolution. Sci Transl Med. 2015;7:283. doi: 10.1126/scitranslmed.aaa1408. [DOI] [PMC free article] [PubMed] [Google Scholar]
- 80.Ranft J, et al. Fluidization of tissues by cell division and apoptosis. Proc Natl Acad Sci USA. 2010;107:20863–20868. doi: 10.1073/pnas.1011086107. [DOI] [PMC free article] [PubMed] [Google Scholar]
- 81.LeBleu VS, et al. PGC-1α mediates mitochondrial biogenesis and oxidative phosphorylation in cancer cells to promote metastasis. Nature Cell Biol. 2014;16:992–1003. doi: 10.1038/ncb3039. [DOI] [PMC free article] [PubMed] [Google Scholar]
- 82.Aceto N, et al. Circulating tumor cell clusters are oligoclonal precursors of breast cancer metastasis. Cell. 2014;158:1110–1122. doi: 10.1016/j.cell.2014.07.013. [DOI] [PMC free article] [PubMed] [Google Scholar]
- 83.Sciumé G, et al. A multiphase model for three-dimensional tumor growth. New J Phys. 2013;15:015005. doi: 10.1088/1367-2630/15/1/015005. [DOI] [PMC free article] [PubMed] [Google Scholar]
- 84.Charras G, Sahai E. Physical influences of the extracellular environment on cell migration. Nature Rev Mol Cell Biol. 2014;15:813–824. doi: 10.1038/nrm3897. [DOI] [PubMed] [Google Scholar]
- 85.Jiao Y, Torquato S. Diversity of dynamics and morphologies of invasive solid tumors. AIP Advances. 2012;2:011003. doi: 10.1063/1.3697959. [DOI] [PMC free article] [PubMed] [Google Scholar]
- 86.Galle J, Loeffler M, Drasdo D. Modeling the effect of deregulated proliferation and apoptosis on the growth dynamics of epithelial cell populations in vitro. Biophys J. 2005;88:62–75. doi: 10.1529/biophysj.104.041459. [DOI] [PMC free article] [PubMed] [Google Scholar]
- 87.Chen EJ, Novakofski J, Jenkins WK, O'Brien WD., Jr Young's modulus measurements of soft tissues with application to elasticity imaging Ultrasonics, ferroelectrics, and frequency control. IEEE Transactions. 1996;43:191–194. [Google Scholar]
- 88.Samani A, Bishop J, Luginbuhl C, Plewes DB. Measuring the elastic modulus of ex vivo small tissue samples. Phys Med Biol. 2003;48:2183. doi: 10.1088/0031-9155/48/14/310. [DOI] [PubMed] [Google Scholar]
- 89.Weinberg RA. The Biology of Cancer. Garland Science; 2007. [Google Scholar]
- 90.Lekka M, et al. Elasticity of normal and cancerous human bladder cells studied by scanning force microscopy. Eur Biophys J. 1999;28:312–316. doi: 10.1007/s002490050213. [DOI] [PubMed] [Google Scholar]
- 91.Gonzalez-Rodriguez D, Guevorkian K, Douezan S, Brochard-Wyart F. Soft matter models of developing tissues and tumors. Science. 2012;338:910–917. doi: 10.1126/science.1226418. [DOI] [PubMed] [Google Scholar]
- 92.Stirbat TV, et al. Fine tuning of tissues' viscosity and surface tension through contractility suggests a new role for α-catenin. PLoS ONE. 2013;8:e52554. doi: 10.1371/journal.pone.0052554. [DOI] [PMC free article] [PubMed] [Google Scholar]
- 93.Drasdo D. Buckling instabilities of one-layered growing tissues. Phys Rev Lett. 2000;84:4244–4247. doi: 10.1103/PhysRevLett.84.4244. [DOI] [PubMed] [Google Scholar]
- 94.Basan M, Joanny JF, Prost J, Risler T. Undulation instability of epithelial tissues. Phys Rev Lett. 2011;106:158101. doi: 10.1103/PhysRevLett.106.158101. [DOI] [PubMed] [Google Scholar]
- 95.Bozic I, et al. Evolutionary dynamics of cancer in response to targeted combination therapy. Elife. 2013;2:e00747. doi: 10.7554/eLife.00747. [DOI] [PMC free article] [PubMed] [Google Scholar]
- 96.Stylianopoulos T, Jain RK. Combining two strategies to improve perfusion and drug delivery in solid tumors. Proc Natl Acad Sci USA. 2013;110:18632–18637. doi: 10.1073/pnas.1318415110. [DOI] [PMC free article] [PubMed] [Google Scholar]
- 97.Foo J, Michor F. Evolution of acquired resistance to anti-cancer therapy. J Theor Biol. 2014;355:10–20. doi: 10.1016/j.jtbi.2014.02.025. [DOI] [PMC free article] [PubMed] [Google Scholar]
- 98.Goldie JH, Coldman AJ. The genetic origin of drug resistance in neoplasms: implications for systemic therapy. Cancer Res. 1984;44:3643–3653. [PubMed] [Google Scholar]
- 99.Coldman AJ, Goldie JH. A stochastic model for the origin and treatment of tumors containing drug-resistant cells. Bull Math Biol. 1986;48:279–292. doi: 10.1007/BF02459682. [DOI] [PubMed] [Google Scholar]
- 100.Coldman AJ, Goldie JH. A model for the resistance of tumor cells to cancer chemotherapeutic agents. Math Biosci. 1983;65:291–307. [Google Scholar]
- 101.Greulich P, Waclaw B, Allen RJ. Mutational pathway determines whether drug gradients accelerate evolution of drug-resistant cells. Phys Rev Lett. 2012;109:088101. doi: 10.1103/PhysRevLett.109.088101. [DOI] [PubMed] [Google Scholar]
- 102.Korolev KS, et al. Selective sweeps in growing microbial colonies. Phys Biol. 2012;9:026008. doi: 10.1088/1478-3975/9/2/026008. [DOI] [PMC free article] [PubMed] [Google Scholar]
Associated Data
This section collects any data citations, data availability statements, or supplementary materials included in this article.
Supplementary Materials
suppl file