Multiplex Single Cell Profiling of Chromatin Accessibility by Combinatorial Cellular Indexing (original) (raw)
. Author manuscript; available in PMC: 2016 Apr 19.
Published in final edited form as: Science. 2015 May 7;348(6237):910–914. doi: 10.1126/science.aab1601
Abstract
Technical advances have enabled the collection of genome and transcriptome datasets with single-cell resolution. However, single-cell characterization of the epigenome has remained challenging. Furthermore, because cells must be physically separated prior to biochemical processing, conventional single-cell preparatory methods scale linearly. We applied combinatorial cellular indexing to measure chromatin accessibility in thousands of single cells per assay, circumventing the need for compartmentalization of individual cells. We report chromatin accessibility profiles from over 15,000 single cells and use these data to cluster cells on the basis of chromatin accessibility landscapes. We identify modules of coordinately regulated chromatin accessibility at the level of single cells both between and within cell types, with a scalable method that may accelerate progress towards a human cell atlas.
Chromatin state is dynamically regulated in a cell type-specific manner (1, 2). To identify active regulatory regions, sequencing of DNase I digestion products (DNase-seq (3)) and ‘assay for transposase-accessible chromatin using sequencing’ (ATAC-seq (4)) measure the degree to which specific regions of chromatin are accessible to regulatory factors. However, these assays measure an average of the chromatin states within a population of cells, masking heterogeneity between and within cell types.
Single-cell methods for genome sequence (5), transcriptomes (6–10), DNA methylation (11) and chromosome conformation (12) have been reported. However, we presently lack technologies for genome-wide, single-cell characterization of chromatin state. Furthermore, a limitation of most such methods is that single cells are individually compartmentalized, and the nucleic acid content of each cell biochemically processed within its own reaction volume (13–16). Processing of large numbers of cells in this way can be expensive and labor intensive, and it is difficult to work with single cells, small volumes, and low nucleic acid inputs.
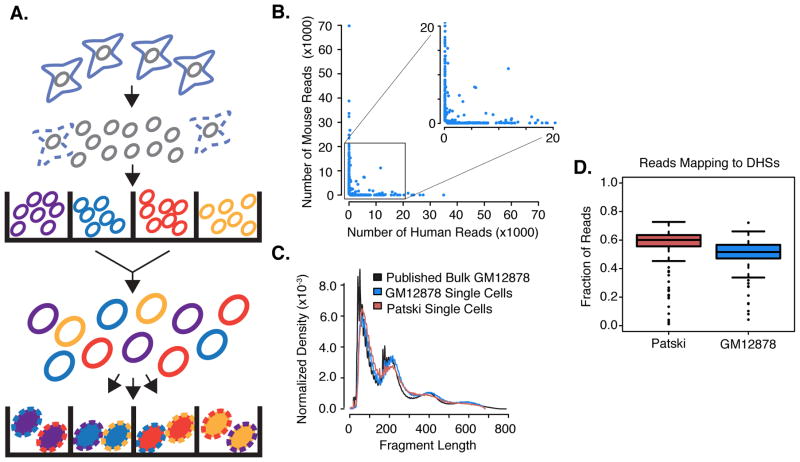
We recently used combinatorial indexing of genomic DNA fragments for haplotype resolution or de novo assembly (17, 18). Here, we adapt the concept of combinatorial indexing to intact nuclei, to acquire data from thousands of single cells without requiring their individualized processing (Fig. 1A). First, we molecularly barcode populations of nuclei in each of many wells. We then pool, dilute and redistribute intact nuclei to a second set of wells, introduce a second barcode and complete library construction. Because the overwhelming majority of nuclei pass through a unique combination of wells, they are ‘compartmentalized’ by the unique barcode combination that they receive. The rate of “collisions”, i.e. nuclei coincidentally receiving the same combination of indexes, can be tuned by adjusting how many nuclei are distributed to the second set of wells (Fig. S1; (19)).
Fig. 1. Schematic of combinatorial cellular indexing and validation for measuring single-cell chromatin accessibility.
(A) Nuclei are isolated and molecularly tagged in bulk with barcoded Tn5 transposases in wells (labels A–D). Nuclei are then pooled and a limited number redistributed into a second set of wells. A second barcode (labels 1–4) is introduced during PCR. (B) Scatterplot of number of reads mapping uniquely to human or mouse genome for individual barcode combinations. (C) Fragment size distribution for single-cell ATAC-seq vs. published bulk ATAC-seq (4). (D) Boxplot of the fraction of reads mapping to ENCODE-defined DHSs for individual Patski and GM12878 cells.
We sought to integrate combinatorial cellular indexing and ATAC-seq to measure chromatin accessibility in large numbers of single cells. In ATAC-seq, permeabilized nuclei are exposed to transposase loaded with sequencing adapters (‘tagmentation’; (4, 20)). In the context of chromatin, the transposase preferentially inserts adapters into nucleosome-free regions. These ‘open’ regions are generally sites of regulatory activity, and correlate with DNase I hypersensitive sites (DHSs).
In the integrated method, we molecularly tag nuclei in 96 wells with barcoded transposase complexes (Fig. 1A; (17–19)). We then pool, dilute, and redistribute 15–25 nuclei to each of 96 wells of a second plate using a cell sorter. After lysing nuclei, a second barcode is introduced during PCR with indexed primers complementary to the transposase-introduced adapters. Finally, all PCR products are pooled and sequenced, with the expectation that most sequence reads bearing the same combination of barcodes will be derived from a single cell (estimated collision rate of ~11% for experiments described here; Fig. S1).
As an initial test, we mixed equal numbers of nuclei from human (GM12878) and mouse (Patski (21)) cell lines, performed combinatorial cellular indexing and sequenced the resulting library. Although mappable reads were observed for most of the 9,216 (96×96) possible barcode combinations, we used a conservative cutoff of 500 reads per cell (19) retaining 533 barcode combinations for further analysis (Fig. S2A; range: 502–69,847 reads per barcode combination; median: 2,503). A high PCR duplication rate (~73% of mappable, non-mitochondrial reads) confirmed that the library had been sequenced to saturation. We estimate that we recovered 13–55% of the molecular complexity that we could expect to recover based on complexity estimates for bulk, 500 cell ATAC-seq experiments (4, 19).
If each barcode combination represents either a mouse or human nucleus, then its corresponding reads should map overwhelmingly to either the mouse or human genome. Indeed, we observe that ~93% of 533 barcode combinations had >90% of their reads mapping to mouse (n=290) or human (n=207) (Fig. 1B). These data retain signals of chromatin accessibility in relation to nucleosome hindrance of insertion events (Fig. 1C). 52% of reads from mouse and 50% of reads from human single cells overlapped reference DNase I hypersensitive site (DHS) maps (ENCODE (19, 22)) for these cell lines (20-fold and 34-fold enrichments, respectively; Fig. 1D, Table S1).
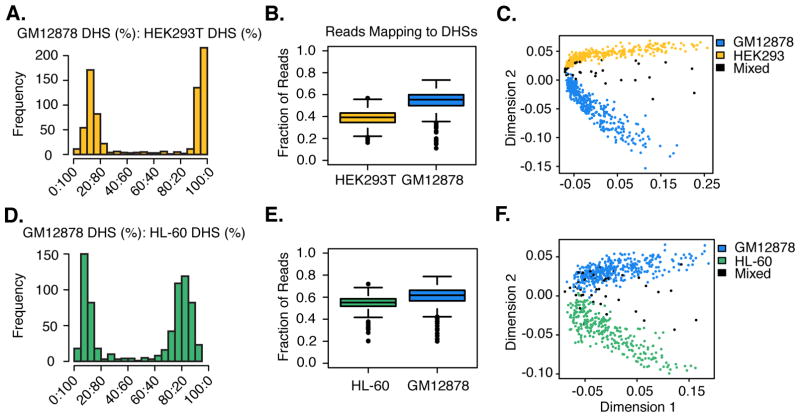
We next sought to distinguish single cells from the same species. We mixed pairs of cell lines (HEK293T or HL-60 vs. GM12878), performed combinatorial cellular indexing and sequenced the resulting libraries to saturation (65% duplicate rate). For the mixture of HEK293T and GM12878, we recovered 748 cells with ≥500 reads (Fig. S2B; range: 502–28,712 reads; median: 1,685 reads). Focusing on reads mapping to previously defined cell-type exclusive DHS sites (Fig. S3A; (19, 22)), we observe a bimodal distribution, with nearly all cells assignable to one of the two cell types (~95% of 748; defined by ≥70% of reads mapping to cell-type specific DHSs corresponding to one cell type or the other; Fig. 2A). The fraction of reads mapping to reference DHSs in single cells was again strongly enriched (41% (14-fold enrichment) for HEK293T and 52% (18-fold enrichment) for GM12878; Fig. 2B, Table S1). ~57% of 181,379 distinct sites from the reference DHS maps were observed in at least one cell. Some fraction of these may be spurious overlaps, but this provides an upper bound on the number of DHSs for which we recovered usage information. Individual cells ranged in coverage of this DHS map from 29 to 5,890 sites (Fig. S4; median: 429 sites).
Fig. 2. Single-cell ATAC-seq deconvolutes human cell type mixtures.
(A–C): GM12878/HEK293T nuclei. (D–F): GM12878/HL-60 nuclei. (A & D) Histograms of proportions of reads mapping to cell-type specific DHSs that correspond to one cell type or the other. (B & E) Boxplots of the overall fraction of reads mapping to ENCODE-defined DHSs for individual cells. (C & F) Multidimensional scaling of single-cell ATAC-seq data using pairwise Jaccard distances between cells based on DHS usage. Cell type assignments based on proportions shown in A & D.
For the mixture of HL-60 and GM12878, we recovered 700 cells (Fig. S2C; range: 500–21,887 reads; median: 1,390 reads; 64% duplicate rate). Although both are representative of the hematopoietic lineage, 94% of cells were assignable based on the same criteria used for HEK293T/GM12878 (Fig. 2D, Fig. S3B). The fraction of reads mapping to reference DHSs was again strongly enriched (55% (16-fold enrichment) for HL-60 and 59% (18-fold enrichment) for GM12878) (Fig. 2E, Table S1). ~46% of 230,632 distinct sites from the reference DHS maps were observed in at least one cell, with individual cells ranging in coverage from 72 to 4,687 sites (Fig. S4; median: 442 sites).
We next examined whether single cells within a heterogeneous mixture could be clustered in an unsupervised manner. Importantly, at the level of single cells, chromatin accessibility is a nearly binary phenomenon (~2 genome equivalents per cell), in contrast with the dynamic range of mRNA transcripts within single cells. Thus, we reasoned that we would require observations across each of many single cells in order to generate quantitative estimates for accessibility of a particular site in a particular cell type, within a heterogeneous population.
For each cell-type mixture, we defined the union of ENCODE DHSs (analogous to how RNA-seq transcript quantification relies on a catalog of transcript models; (19)), and created a binary matrix where DHS sites were scored as “used” or “unused” in each cell. We then calculated Jaccard distances between pairs of cells on the basis of the degree of shared DHS usage. Applying multidimensional scaling to these distances, the first dimension was strongly correlated with read the depth of each cell (Fig. S5; Spearman’s rho of ~0.95), while the second dimension separated cells consistently with our crude cell-type assignments (Fig. 2C, F). The extent of discrimination between cell types is proportional to read depth, but even with relatively few reads, individual cells can be clustered on the basis of shared DHS usage alone. To evaluate whether our data provided reproducible and quantitative estimates of the accessibility of DHSs, we used GM12878-assigned cells from all three experiments described above as biological replicates. For each experiment, we summed the number of cells “using” each site and compared these counts between replicates (Spearman’s rho’s of 0.64–0.69, or 0.54–0.62 when restricting to sites observed in ≥5 cells in each replicate), and also compared them with bulk ATAC-seq measurements from 500 GM12878 cells (Fig. S6; Spearman’s rho’s of 0.61–0.7; (4)). This positive correlation shows that sites that are more sensitive in bulk experiments are also more commonly observed in single cells. Furthermore, these correlations are not far from the range of 0.64 to 0.72 for replicate bulk measurements from the 500 cell ATAC-seq libraries.
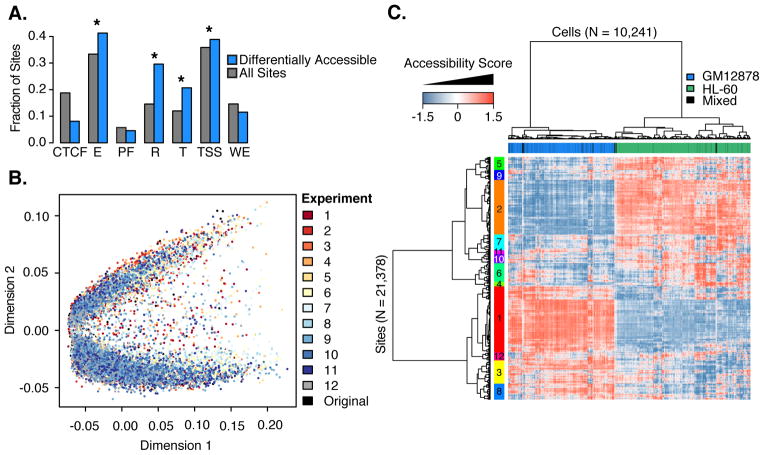
To identify individual DHSs with significant differences in accessibility between different cell types (based on single-cell data from the GM12878/HL-60 mixture), we performed likelihood ratio tests within the framework of a generalized linear model. We identified 1,666 sites (out of 52,479 DHSs tested (19)) that were differentially accessible at an FDR of 0.05. Interestingly, only about half of these sites are cell-type exclusive in the reference DHS maps (381 GM12878-exclusive and 472 HL-60-exclusive); differentially accessible DHSs are marginally enriched for GM12878-specific sites (hypergeometric P-value = 0.04) and strikingly enriched for HL-60 sites (P-value = 2.2×10⁻¹⁵). They are also larger (1184bp vs. 580bp median; Wilcoxon rank sum P-value = 3.4×10−247), observed in more cells (10 cells vs. 3 cells median; Wilcoxon rank sum P-value ≈ 0), and enriched for “enhancer” (hypergeometric P-value = 4.3×10⁻¹²), “repressed” (P-value = 1.5×10−57), “transcribed” (P-value = 7.4×10⁻²⁵) and “transcription start site” (P-value = 5.1×10⁻³) annotations in GM12878, relative to sites not identified as differentially accessible (Fig. 3A; (19)).
Fig. 3. Single-cell ATAC-seq identifies functionally relevant differences in accessibility between cell types.
(A) Bar plot for relative fraction of DHSs overlapping each chromatin state (HL-60 vs. GM12878). Gray bars show frequencies for all sites tested. Blue bars show frequencies for differentially accessible sites. CTCF=CTCF enriched element; E=Predicted enhancer; PF=Predicted promoter flanking region; R=Predicted repressed; T=Predicted transcribed; TSS=Predicted promoter region; WE=Predicted weak enhancer. *=significant difference in proportions. Values do not add to 1 because sites can overlap multiple chromatin states. (B) Multidimensional scaling of chromatin accessibility data for 14,533 cells (GM12878/HL-60 mixtures from 13 experiments on 4 dates). (C) Heatmap of hypersensitive site usage for 10,241 cells (columns) at 21,378 DHSs (rows) (GM12878/HL-60 mixtures). Colors indicate accessibility of sites after latent semantic indexing. Top color bar is coded by cell-type assignments (green=HL-60; blue=GM12878; black=unassigned). Left color bar indicates modules formed by clustering DHSs.
We next linked differentially accessible sites defined from single cells to the genes they potentially regulate (2), and compared these to genes differentially expressed between GM12878 and HL-60 (19). Of 8,268 genes linked to ≥1 DHS and expressed in both cell types, 4,095 were differentially expressed and 2,211 were linked to ≥1 differentially accessible DHS (FDR 0.05). Although the DHS-gene linkages are imperfect, we observe a significant overlap of differentially expressed and differentially accessible genes (1,162 genes overlap; hypergeometric P-value = 4.8×10⁻⁴). The genes linked to DHSs identified as differentially accessible are enriched for lymphoid and myeloid lineage annotations, e.g. “cytokine signaling” and “antigen processing” (Figs. S7–8).
To optimize combinatorial cellular indexing, we tested twelve conditions on three days, always with GM12878/HL-60 mixtures. We collected as many as nearly 1,500 cells in a single experiment and we improved the median read depth to >3,000 per cell in some experiments (Figs. S9–11). We merged chromatin accessibility maps for 14,533 single cells (all GM12878/HL-60) and conducted multidimensional scaling. Although the actual mixture proportion varied between experiments, the clustering of the two cell types was highly robust to experimental condition (Fig. 3B). With this full complement of cells, ~96% of 230,632 potential sites in our DHS reference map are observed in at least one cell (individual cells covering between 4 and 12,333 sites (median: 664 sites); Fig. S4).
We used latent semantic indexing to reduce the dimensionality of this matrix (after filtering out low coverage cells and rarely used sites (19)), yielding a heatmap of chromatin accessibility for 10,241 cells at 21,378 DHSs (Fig. 3C, Fig. S12). This resulted in two large clades corresponding to the two cell types, while also identifying the subset of sites underlying that separation. Additionally, we observe a number of smaller modules of DHSs that exhibit coordinately regulated chromatin accessibility. Linking these sites again to the genes they potentially regulate (2), the major modules are enriched for gene ontology terms consistent with the two cell types (e.g., “osteoclast differentiation” for a module more open in HL-60) (Figs. 3C, S13–14).
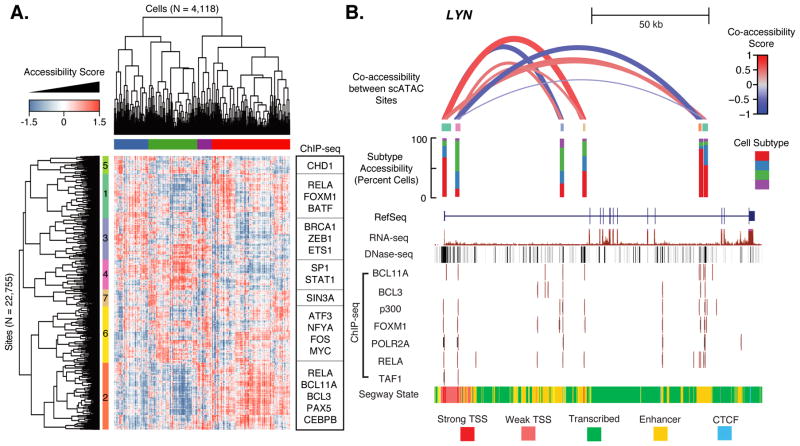
To evaluate cell-to-cell variation within a cell type, we took the subset of cells classified as GM12878 and repeated latent semantic indexing (19), yielding a heatmap of chromatin accessibility for 4,118 cells at 22,755 DHSs. Hierarchical clustering identified four major subgroups of single cells and seven modules of coordinately regulated chromatin accessibility (Fig. 4A). These modules of DHSs are enriched for binding by particular transcription factors (hypergeometric FDR 0.10, Fig. S15), in some cases quite strongly, and are linked to genes associated with immune response, cell cycle regulation and other processes (Fig. S16–17). Importantly, although we included samples from experiments conducted on different days, the cell subtypes do not cluster by experiment (Fig. S18–19) and the enrichments for transcription factor binding within subtype-defining modules is apparent even with subsets of the data (Fig. S20–21). Sites in modules 1 and 2 are highly enriched for binding by transcription factors such as NF-kB and other factors downstream of the B-cell receptor (19). The four GM12878 subtypes appear principally defined by the activation status of these two modules, suggesting that variability across the cells is driven by NF-kB activity. These results indicate that even within an apparently homogeneous cell type, we are able to identify subsets of cells with differences in their regulatory landscape related to cell cycle and possibly environmental signals. Focusing on individual loci within GM12878, we observe sets of regulatory sites that exhibit patterns of coordinated regulation (e.g. LYN, encoding a tyrosine kinase involved in B cell signaling; Fig. 4B), although reproducibility of these patterns across biological replicates was modest (Fig. S22). Given the sparsity of the data, identifying pairs of co-accessible DNA elements within individual loci is statistically challenging and merits further development.
Fig. 4. Single-cell ATAC-seq identifies GM12878 subtypes.
(A) Heatmap of chromatin accessibility measures after latent semantic indexing of DHS usage shows GM12878 cells cluster into subpopulations. Modules of coordinately accessible chromatin accessibility are significantly enriched for binding of selected transcription factors (TFs) (examples on right). (B) Detailed depiction of LYN locus. Top shows “co-accessibility scores” between the transcription start sites and four putative enhancers in the region, which are Pearson correlation values of LSI accessibility scores between cells, for six DHSs present in this region. Height and thickness of each loop indicates the strength of correlation (red=positive; blue=negative). Middle shows in which subtypes (defined in top bar of (A)) these elements are most often accessible. Bottom shows ENCODE data for this region from UCSC browser, including transcript model, DHS peaks, ChIP-seq binding profiles for several TFs, and predicted chromatin state.
We report chromatin accessibility maps for >15,000 single cells. Our combinatorial cellular indexing scheme could feasibly be scaled to collect data from ~17,280 cells per experiment by using 384×384 barcoding and sorting 100 nuclei per well (assuming similar cell recovery and collision rates (Fig. S1; (19)). Particularly as large-scale efforts to build a human cell atlas are contemplated (23), it is worth noting that because DNA is at uniform copy number, single-cell chromatin accessibility mapping may require far fewer reads per single cell in order to define cell types, relative to single-cell RNA-seq. As such, this method’s simplicity and scalability may accelerate the characterization of complex tissues containing myriad cell types as well as dynamic processes such as differentiation.
Supplementary Material
Supplementary Material
Table S2
Acknowledgments
We thank the Trapnell and Shendure labs, particularly R. Hause, C. Lee, V. Ramani, R. Qiu, Z. Duan and J. Kitzman, for helpful discussions; D. Prunkard, J. Fredrickson and L. Gitari in the Rabinovitch Lab for their exceptional assistance in flow sorting; and C. Disteche for the Patski cell line. This work was funded by an NIH Director’s Pioneer Award (1DP1HG007811 to J.S.) and a grant from the Paul G. Allen Family Foundation (J.S.). C.T. is supported in part by the Damon Runyon Cancer Research Foundation (DFS-#10-14). All sequencing data are available from the NIH/NCBI Gene Expression Omnibus (accession number GSE67446). L.C., K.L.G. and F.J.S. declare competing financial interests in the form of stock ownership and paid employment by Illumina, Inc. One or more embodiments of one or more patents and patent applications filed by Illumina may encompass the methods, reagents, and the data disclosed in this manuscript.
Footnotes
Materials and Methods
References and Notes
- 1.Stergachis AB, et al. Cell. 2013;154:888–903. doi: 10.1016/j.cell.2013.07.020. [DOI] [PMC free article] [PubMed] [Google Scholar]
- 2.Thurman RE, et al. Nature. 2012;489:75–82. doi: 10.1038/nature11232. [DOI] [PMC free article] [PubMed] [Google Scholar]
- 3.Boyle AP, et al. Cell. 2008;132:311–22. doi: 10.1016/j.cell.2007.12.014. [DOI] [PMC free article] [PubMed] [Google Scholar]
- 4.Buenrostro JD, Giresi PG, Zaba LC, Chang HY, Greenleaf WJ. Nat Methods. 2013;10:1213–8. doi: 10.1038/nmeth.2688. [DOI] [PMC free article] [PubMed] [Google Scholar]
- 5.Navin N, et al. Nature. 2011;472:90–4. doi: 10.1038/nature09807. [DOI] [PMC free article] [PubMed] [Google Scholar]
- 6.Wu AR, et al. Nat Methods. 2014;11:41–6. doi: 10.1038/nmeth.2694. [DOI] [PMC free article] [PubMed] [Google Scholar]
- 7.Jaitin DA, et al. Science. 2014;343:776–9. doi: 10.1126/science.1247651. [DOI] [PMC free article] [PubMed] [Google Scholar]
- 8.Deng Q, Ramsköld D, Reinius B, Sandberg R. Science. 2014;343:193–6. doi: 10.1126/science.1245316. [DOI] [PubMed] [Google Scholar]
- 9.Shalek AK, et al. Nature. 2013;498:236–40. doi: 10.1038/nature12172. [DOI] [PMC free article] [PubMed] [Google Scholar]
- 10.Trapnell C, et al. Nat Biotechnol. 2014;32:381–6. doi: 10.1038/nbt.2859. [DOI] [PMC free article] [PubMed] [Google Scholar]
- 11.Smallwood SA, et al. Nat Methods. 2014;11:817–820. doi: 10.1038/nmeth.3035. [DOI] [PMC free article] [PubMed] [Google Scholar]
- 12.Nagano T, et al. Nature. 2013;502:59–64. doi: 10.1038/nature12593. [DOI] [PMC free article] [PubMed] [Google Scholar]
- 13.Gole J, et al. Nat Biotechnol. 2013;31:1126–32. doi: 10.1038/nbt.2720. [DOI] [PMC free article] [PubMed] [Google Scholar]
- 14.Fan HC, Fu GK, Fodor SPA. Science (80-) 2015;347:1258367–1258367. doi: 10.1126/science.1258367. [DOI] [PubMed] [Google Scholar]
- 15.Saliba AE, Westermann AJ, Gorski SA, Vogel J. Nucleic Acids Res. 2014;42:8845–8860. doi: 10.1093/nar/gku555. [DOI] [PMC free article] [PubMed] [Google Scholar]
- 16.Pan X. Single Cell Biol. 2014;3:106. doi: 10.4172/2168-9431.1000106. [DOI] [PMC free article] [PubMed] [Google Scholar]
- 17.Adey A, et al. Genome Res. 2014;24:2041–2049. doi: 10.1101/gr.178319.114. [DOI] [PMC free article] [PubMed] [Google Scholar]
- 18.Amini S, et al. Nat Genet. 2014;46:1343–9. doi: 10.1038/ng.3119. [DOI] [PMC free article] [PubMed] [Google Scholar]
- 19.Materials and methods are available as supplementary materials on Science Online.
- 20.Adey A, et al. Genome Biol. 2010;11:R119. doi: 10.1186/gb-2010-11-12-r119. [DOI] [PMC free article] [PubMed] [Google Scholar]
- 21.Yang F, Babak T, Shendure J, Disteche CM. Genome Res. 2010;20:614–22. doi: 10.1101/gr.103200.109. [DOI] [PMC free article] [PubMed] [Google Scholar]
- 22.The ENCODE Project Consortium. Nature. 2012;489:57–74. [Google Scholar]
- 23.http://www.genome.gov/Multimedia/Slides/GSPFuture2014/10_Regev.pdf.
- 24.Bolger AM, Lohse M, Usadel B. Bioinformatics. 2014;30:2114–2120. doi: 10.1093/bioinformatics/btu170. [DOI] [PMC free article] [PubMed] [Google Scholar]
- 25.Li H, Durbin R. Bioinformatics. 2009;25:1754–60. doi: 10.1093/bioinformatics/btp324. [DOI] [PMC free article] [PubMed] [Google Scholar]
- 26.Kim D, et al. Genome Biol. 2013;14:R36. doi: 10.1186/gb-2013-14-4-r36. [DOI] [PMC free article] [PubMed] [Google Scholar]
- 27.Trapnell C, et al. Nat Biotechnol. 2013;31:46–53. doi: 10.1038/nbt.2450. [DOI] [PMC free article] [PubMed] [Google Scholar]
- 28.Von Mises R. Rev la Fac des Sci l’Université d’Istanbul N.S. 1939;4:145–163. [Google Scholar]
- 29.John S, et al. Nat Genet. 2011;43:264–8. doi: 10.1038/ng.759. [DOI] [PMC free article] [PubMed] [Google Scholar]
- 30.Quinlan AR, Hall IM. Bioinformatics. 2010;26:841–2. doi: 10.1093/bioinformatics/btq033. [DOI] [PMC free article] [PubMed] [Google Scholar]
- 31.Boyle AP, Guinney J, Crawford GE, Furey TS. Bioinformatics. 2008;24:2537–8. doi: 10.1093/bioinformatics/btn480. [DOI] [PMC free article] [PubMed] [Google Scholar]
- 32.Yee TW, Wild CJ. J R Stat Soc Ser B. 1996;58:481–493. [Google Scholar]
- 33.Benjamini Y, Hochberg Y. J R Stat Soc Ser B. 1995;57:289–300. [Google Scholar]
- 34.Hoffman MM, et al. Nucleic Acids Res. 2013;41:827–41. doi: 10.1093/nar/gks1284. [DOI] [PMC free article] [PubMed] [Google Scholar]
- 35.Väremo L, Nielsen J, Nookaew I. Nucleic Acids Res. 2013;41:4378–91. doi: 10.1093/nar/gkt111. [DOI] [PMC free article] [PubMed] [Google Scholar]
- 36.Kanehisa M, Goto S. Nucleic Acids Res. 2000;28:27–30. doi: 10.1093/nar/28.1.27. [DOI] [PMC free article] [PubMed] [Google Scholar]
- 37.Kanehisa M, et al. Nucleic Acids Res. 2014;42:D199–205. doi: 10.1093/nar/gkt1076. [DOI] [PMC free article] [PubMed] [Google Scholar]
- 38.Croft D, et al. Nucleic Acids Res. 2014;42:D472–7. doi: 10.1093/nar/gkt1102. [DOI] [PMC free article] [PubMed] [Google Scholar]
- 39.Milacic M, et al. Cancers (Basel) 2012;4:1180–211. doi: 10.3390/cancers4041180. [DOI] [PMC free article] [PubMed] [Google Scholar]
Associated Data
This section collects any data citations, data availability statements, or supplementary materials included in this article.
Supplementary Materials
Supplementary Material
Table S2


