The dynamic N1-methyladenosine methylome in eukaryotic messenger RNA (original) (raw)
. Author manuscript; available in PMC: 2016 Apr 23.
Published in final edited form as: Nature. 2016 Feb 10;530(7591):441–446. doi: 10.1038/nature16998
Abstract
Gene expression can be regulated post-transcriptionally through dynamic and reversible RNA modifications. A recent noteworthy example is _N_6-methyladenosine (m6A), which affects messenger RNA (mRNA) localization, stability, translation and splicing. Here we report on a new mRNA modification, _N_1-methyladenosine (m1A), that occurs on thousands of different gene transcripts in eukaryotic cells, from yeast to mammals, at an estimated average transcript stoichiometry of 20% in humans. Employing newly developed sequencing approaches, we show that m1A is enriched around the start codon upstream of the first splice site: it preferentially decorates more structured regions around canonical and alternative translation initiation sites, is dynamic in response to physiological conditions, and correlates positively with protein production. These unique features are highly conserved in mouse and human cells, strongly indicating a functional role for m1A in promoting translation of methylated mRNA.
Four decades after it was first observed as an abundant constituent of the eukaryotic transcriptome, m6A has only recently been revealed to broadly affect mRNA metabolism1,2. Consequently, a broader notion has emerged that dynamic chemical modifications of mRNA, now also encompassing pseudouridine (Ψ)3–5 and 5-methylcytosine6,7, have vital roles in post-transcriptional gene regulation. With the epitranscriptome, as these modifications are now known, RNA joins both DNA and proteins in being subject to dynamic and reversible chemical control8,9. Unlike the latter two, however, the functions of RNA chemical adducts are only now being determined. It is likely that the complement of mRNA modifications, at present much smaller than that found on transfer RNA (tRNA) and ribosomal RNA (rRNA)10, is far from complete.
Transcriptome-wide mapping of m1A
m1A was identified in total RNA from several species decades ago11,12. It was later characterized in tRNA13 and rRNA14 where it has a major influence on structure and function, owing to the presence of both a methyl adduct and a positive charge under physiological conditions15. Since m1A can rearrange to m6A under alkaline conditions (Dimroth rearrangement)16, its signature in mRNA might be erased by the purification and measurement process, simultaneously introducing noise in m6A measurements (Fig. 1a and Extended Data Fig. 1a), as earlier attempts to survey mRNA base modifications acknowledged17. To determine whether m1A is present in mRNA and to quantify it, we performed quantitative mass spectrometry (LC-MS/MS) of pure mRNA preparations under controlled conditions (Supplementary Note 1, Extended Data Fig. 1b–d) and obtained m1A/A molar ratios in several human and mouse cell lines and tissues, both normal and cancerous. Our results unequivocally show that m1A is present in pure mammalian mRNA, at m1A/A ratios ranging from approximately 0.015% to 0.054% in cell lines and up to 0.16% in tissues (Figs 1b, 5d and Extended Data Fig. 1e). Metabolic labelling of cells with deuterated methionine (d3-Met) results in detection of d3-m1A in mRNA, suggesting that _S_-adenosyl-methionine (SAM) is the methyl donor (Extended Data Fig. 1f). Although these ratios are smaller than the m6A/A and Ψ/U ratios in the same samples (Fig. 1b), the absolute and fractional levels of m1A in mRNA (see stoichiometry below) are sufficiently high to exhibit potential regulatory functions of selectively methylated transcripts.
Figure 1. Development of m1A-seq to map a newly identified constituent of mammalian mRNA.

a, Chemical structures of m1A and m1A is in blue. b, LC-MS/MS quantitation of m1A, m6A and Ψ in human and mouse mRNA isolated from the indicated cell types. The level of each modified nucleoside is indicated as a percentage of the unmodified one. Mean values ± s.e.m. are shown, n = 3. MEFs, mouse embryonic fibroblasts; mESC, mouse embryonic stem cells; M3 KO, Mettl3 knockout. c, Schematic outline of m1A-seq. RNA is fragmented and subjected to immunoprecipitation using anti-m1A antibody. Eluted RNA fragments are converted to cDNA and sequenced, or treated to induce partial m1A-to-m6A rearrangement before cDNA synthesis. m1A causes both reverse transcription stops and read-throughs accompanied by mismatches, to produce typical peaks with a central trough and an adenosine with increased mismatch rate (left). Partial rearrangement of m1A to m6A attenuates the effect (right). m1A is in red, m6A is in grey; mismatch rate is illustrated as the ratio between A (red) and T (black). d, Detection of the known m1A 1322 site (yellow) in human 28S rRNA validates m1A-seq (black curve). High fold-change in mismatch rate (before and after m1A-to-m6A rearrangement in immunoprecipitation, blue lines) independently identifies m1A 1322 with single-nucleotide resolution. e, Mismatch rates in m1A 1322 increase after immunoprecipitation and decrease upon rearrangement.
Figure 5. m1A in mRNA is a dynamic modification that responds to changing physiological and stress conditions, and varies between tissues.

a, LC-MS/MS quantification of m1A (left, grey) and m6A (right, black) in mRNA of untreated and glucose-starved (upper panels) or heat shock-treated (lower panels) HepG2 cells, presented as percentage of unmodified A. Mean values ± s.e.m. are shown, n = 3, **P ≤0.01, not significant (NS) P >0.05, unpaired _t_-test. b, Venn diagrams of differential and shared m1A peaks in untreated and glucose-starved (left upper panel) or heat shock-treated (left lower panel) HepG2 cells. The overall change in the number of identified m1A peaks is presented as per cent of untreated (right upper and lower panels). c, Representative plots of differentially methylated transcripts in untreated and glucose starved (upper panel) or heat-shock-treated (lower panel) HepG2 cells. Plot format as in Fig. 2a. Yellow boxes frame differential peaks. d, LC-MS/MS quantification of m1A in the indicated wt/wt and ob/ob mouse tissues, presented as percentage of unmodified A. Mean values ± s.e.m. are shown, n = 3, *P ≤ 0.05, NS, P > 0.05, one-way ANOVA.
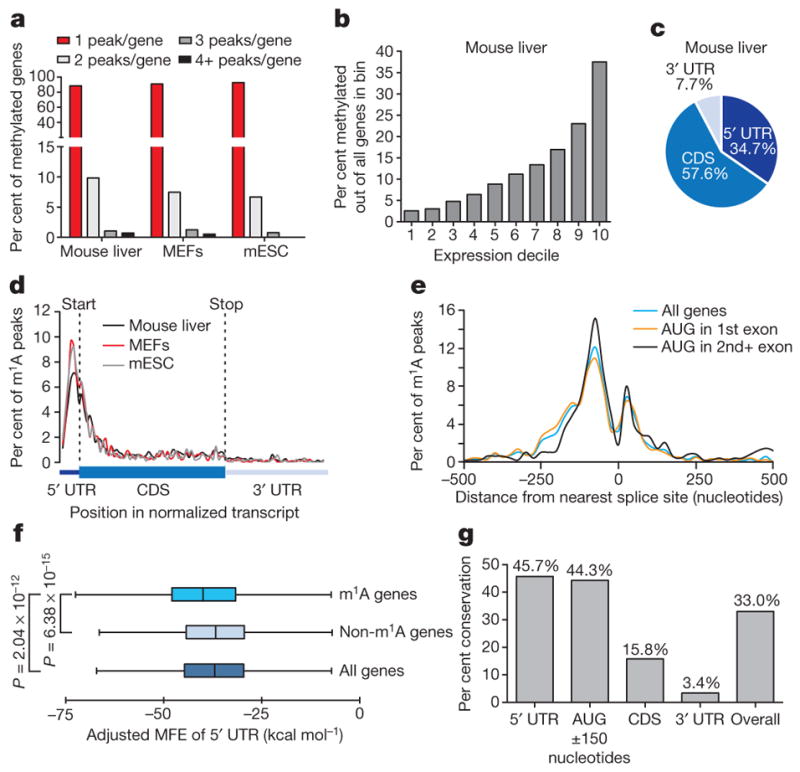
We adapted an antibody-based approach, methylated RNA immunoprecipitation sequencing (MeRIP-seq), termed here m1A-seq, for transcriptome-wide localization of m1A sites and coupled it to an orthogonal chemical method based on Dimroth rearrangement to obtain high-resolution m1A maps (Supplementary Notes 2, 3; Fig. 1c–e and Extended Data Fig. 1g–m). We applied m1A-seq to polyA+ RNA from HeLa cells in two replicates and determined the methylated positions (m1A peaks) using the MACS peak-calling algorithm18. We identified 7,154 peaks (fold change (FC) ≥ 2, false discovery rate (FDR) ≤ 5%) in 4,151 coding and 63 non-coding adequately expressed (that is, above the 1st quartile of expressed genes) gene transcripts that occurred in both replicates (Fig. 2a, Supplementary Tables 1, 4). On average, each methylated gene carries 1.4 peaks, with most of these genes (over 70%) methylated only once (Fig. 2b). In a conservative estimate, 35% of adequately expressed genes are methylated, attesting to the breadth of the phenomenon. Of note, non-coding genes are significantly underrepresented among methylated genes (P = 1 × 10−140, hypergeometric test). Methylated genes constitute a progressively larger fraction of genes as expression increases (Fig. 2c), and are significantly enriched in several gene ontology terms related to translation and RNA processing (Extended Data Fig. 2a, b).
Figure 2. m1A is associated with translation initiation sites (TISs) in the human transcriptome.

a, Representative plot of a methylated transcript. Normalized sequence coverage of immunoprecipitation (m1A IP, red) and input (blue) are indicated above the gene architecture in UCSC format. Thin black boxes represent the 5′ and 3′ untranslated regions (UTRs), thick black boxes represent the coding sequences (CDS) and thin lines represent introns. b, The percentage of methylated genes that carry 1, 2, 3 or 4+ peaks per gene in the indicated human cell types. Most methylated genes carry only one m1A peak. c, The percentage of methylated genes in HeLa cells increases with expression level. d, Pie charts presenting the fraction of m1A peaks in each of three non-overlapping transcript segments (5′ UTR, CDS and 3′ UTR) in the indicated human cell types. e, Stoichiometry (fraction) of methylated transcripts in genes that carry one m1A peak in HepG2 mRNA. Plotted is the number of genes sorted by percentage of methylated transcripts. Dashed lines define the stoichiometry interquartile range (17–23%). f, Metagene profiles of m1A peak distribution along a normalized transcript composed of three rescaled non-overlapping segments illustrated below, in the indicated human cell types. m1A peaks cluster around the AUG start codon. For comparison, the distribution of m6A peaks in HepG2 is superimposed. g, Metagene profiles of m1A peak distribution in a non-normalized window centred on the first splice site. Peaks are sorted by the exon containing the AUG codon in that gene.
As most methylated transcripts harbour a single m1A, methylation stoichiometry can be estimated based on the change in transcript levels following immunodepletion. We used microarrays to determine relative transcript abundance in HepG2 RNA before and after depletion m6A. Methyl groups (-CH3) are in red and the positive charge (+) on with anti-m1A antibody, and found that the average methylation level in single m1A-containing genes is ~20% (Fig. 2e, Extended Data Fig. 2c, Supplementary Table 7). The presence of m1A in a substantial fraction of mRNA transcripts suggests a potentially sizeable effect on mRNA metabolism.
m1A associates with translation initiation sites and the first splice site
We found that m1A peaks appear in all segments of transcripts—5′ untranslated region (UTR), coding sequence (CDS) and 3′ UTR—but are markedly under-represented in the latter (~fivefold depletion relative to chance, P < 1 × 10−200, hypergeometric test, Fig. 2d). m1A-seq of two additional cell lines in replicates, HepG2 and HEK293, produced similar distribution patterns (Fig. 2b, d, Extended Data Fig. 2d–g and Supplementary Tables 1, 4). We noted that while input sequence reads have a typical distribution along transcripts, m1A immunoprecipitation reads pile up towards their 5′ ends (Extended Data Fig. 3a). To investigate this further, metagene profiles were generated in which gene segments were rescaled proportionally so that all segments of one kind appear to have the same length. This revealed that m1A clusters sharply around the start codon to produce a remarkably similar profile in the three human cell lines (Fig. 2f). Over 50% of the peaks reside within a stretch of 300 nucleotides centred on the start codon (Extended Data Fig. 3b–g).
Ribosome profiling19, and a recently modified version that captures initiating 80S ribosomes20,21, have uncovered a surprising variety of alternative translation initiation sites (TISs). We examined our data sets from this perspective and found that methylated transcripts have, on average, more alternative TISs than non-methylated ones (1.98 versus 1.59 in HeLa; 2.37 versus 1.69 in HEK293), and that the number of m1A sites per transcript positively correlates with the number of alternative TISs per transcript (Extended Data Fig. 4a–c). Furthermore, transcripts with upstream TISs are more likely to be methylated within the 5′ UTR, whereas transcripts with downstream TISs tend to be methylated within the CDS (Extended Data Fig. 4d, e). The distances of alternative TISs and respective m1A peaks from the annotated start codon are well correlated, particularly those of upstream TISs and 5′ UTR m1A peaks, suggesting that m1A is associated with alternative TISs as well (Extended Data Fig. 4f–h). In summary, m1A in human mRNA seems to be associated with a subset of TISs, both canonical and alternative, in all three cell lines examined.
To gain a deeper understanding of the underlying transcript attribute or processing event that potentially guides m1A deposition to create the observed distribution, we binned methylated transcripts based on the exon that harbours the start codon and plotted the distribution of m1A relative to the start codon. We observed an intriguing dissociation: when the start codon is in the 2nd or 3rd exons, m1A tends to occur closer to the transcription start site (TSS) compared to when the start codon is in the 1st exon (Extended Data Fig. 3h). Whereas 5′ UTRs of transcripts with a start codon in downstream exons are on average longer (323 versus 189 nucleotides), their first splicing event tends to occur closer to the TSS (204 versus 359 nucleotides), mirroring m1A behaviour. Therefore, we plotted the distribution of m1A relative to the TSS in bins based on the length of the 1st exon and observed that m1A moves away from the TSS as the length of the first exon increases (Extended Data Fig. 3i). These observations suggest that neither the TSS nor the start codon ‘anchors’ m1A, but rather the first splice site does. We substantiated this by plotting m1A relative to the nearest splice site (which is also the first splice site for 85% of m1A peaks) and observed convergence of m1A distribution in all start codon bins mostly upstream of the splice site, engendering the hypothesis that the first splicing reaction somehow guides m1A deposition (Fig. 2g, Extended Data Fig. 3j). Analysis based on the smaller high- resolution m1A trough data set recapitulated all the salient features of the methylome (Extended Data Fig. 3k–q, Supplementary Note 3 and Supplementary Table 6).
Conserved features of methylated transcripts
We next sought to identify sequence patterns that may define or associate with m1A peak locations. GC content, a key determinant of RNA structure, is unusually high in m1A peak areas that appear in all three transcript segments (Extended Data Fig. 5a). Several motif detection algorithms showed enrichment of GC-rich sequences with variable adenosine content, yet did not identify any specific motif per se (other than the ‘AUG’ itself which is expected to appear in peaks centred on the start codon) (Extended Data Fig. 5b). This suggests that a combination of sequence and structure features may specify methylation positions, perhaps similar to the case of m1A deposition in tRNA22,23. We were able to identify and score single-nucleotide m1A positions based on the change in mismatch rates between (1) untreated and alkaline-treated (m1A-to-m6A rearranged) immunoprecipitation sequence reads and between (2) input and immunoprecipitation (Supplementary Table 5). A sequence frequency logo of identified positions (Fig. 3a) and representative individual sequences (Extended Data Fig. 5c) demonstrate that m1A sites are embedded in GC-rich environments. Using the m1A trough data set we also identified a GA-rich motif that was present in 10–15% of the cases (Extended Data Fig. 3r).
Figure 3. m1A occurs in GC-rich sequence contexts and in genes with structured 5′ UTRs.
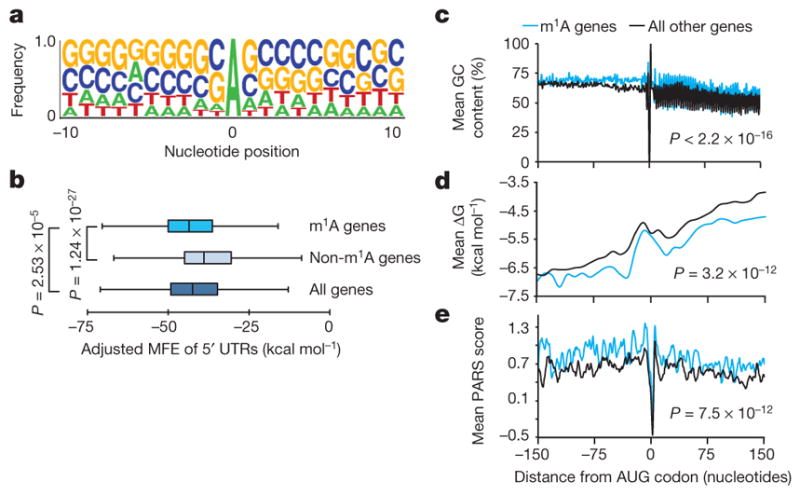
a, Sequence frequency logo for a set of 192 adenosines in peak areas that have a higher mismatch rate in immunoprecipitation relative to input (FC ≥ 6) in HepG2 demonstrates the GC-rich context of m1A. b, Length-adjusted minimum free energy (aMFE) for 5′ UTRs of methylated, unmethylated and all genes. Box limits represent 25th percentile, median and 75th percentile, whiskers represent 2.5 and 97.5 percentiles. P values are indicated, _t_-test. Analysis was based on human common peaks (see Methods). c–e, A sliding window of mean GC content (c), ΔG (d) and PARS scores (e) in a ±150-nucleotide window centred on the AUG start codon of methylated genes compared to all the rest, in HepG2 cells. P values are indicated; Kolmogorov–Smirnov test, _t_-test and Kolmogorov–Smirnov test, respectively.
Attributes of the 5′ UTR such as length, GC content, and associated minimum free energy (MFE), are known to affect the efficiency of translation initiation24. 5′ UTRs of methylated transcripts differ significantly from those of non-methylated ones in that their GC content is higher (median of 71% compared to 63.9%) (Extended Data Fig. 5d) and their length-adjusted MFE (aMFE) is lower (median of −43.5 kcal mol−1 compared to −38.4 kcal mol−1) (Fig. 3b, Extended Data Fig. 5e). We employed a sliding window approach to further characterize the continuous structural landscape of the AUG window (±150 nucleotides) in terms of GC content, MFE and experimental parallel analysis of RNA structure (PARS) score (Fig. 3c–e, Extended Data Fig. 5f, g). Both the experimental and calculated parameters agree that m1A decorates highly structured AUG windows.
Evolutionary conservation and dynamics
Evolutionary conservation typically indicates a common fundamental biological function. We show above that m1A is present in murine mRNA at comparable levels to those in human (Fig. 1b). Therefore, m1A-seq was applied to RNA of mouse liver, mouse embryonic fibroblasts (MEFs) and mouse embryonic stem cells (mESC) (Supplementary Tables 2, 4). A previously unreported single m1A position in mouse 28S rRNA was identified in an orthologous location to the known m1A position in human 28S rRNA (Extended Data Fig. 6a–c). The mouse m1A methylome closely resembles that of human: approximately 15% of adequately expressed genes are methylated, the majority of which carry a single m1A (Fig. 4a), and the percentage of methylated genes increases with expression level (Fig. 4b). m1A in mouse mRNA is non-randomly distributed along transcripts with dense clustering around translation initiation sites, mirroring the profile in human (Fig. 4c–d, Extended Data Fig. 6d–l), including the association with the nearest splice site (Fig. 4e, Extended Data Fig. 6m). Similarly, m1A sites reside within a GC-rich context (Extended Data Fig. 7a, b), and the 5′ UTRs of methylated transcripts have a higher GC content and a lower aMFE than those of all other (unmethylated) transcripts (Fig. 4f and Extended Data Fig. 7c–f).
Figure 4. m1A methylome conservation between human and mouse.
a, The percentage of methylated genes that carry 1, 2, 3 or 4+ peaks per gene in the indicated mouse cell types. Most genes carry only one m1A peak. b, The percentage of methylated genes in mouse liver cells increases with expression level. c, Pie chart presenting the fraction of m1A peaks in each of three non-overlapping transcript segments (5′ UTR, CDS and 3′ UTR) in mouse liver. d, Metagene profiles of m1A peak distribution along a normalized transcript composed of three rescaled non-overlapping segments illustrated below, in the indicated mouse cell types. m1A peaks cluster around the AUG start codon. e, Metagene profiles of mouse m1A peak distribution in a non-normalized window centred on the nearest splice site. Peaks are sorted by the exon containing the AUG codon in that gene. f, Length-adjusted minimum free energy (aMFE) for 5′ UTRs of methylated, unmethylated and all genes in mouse liver. Box limits and whiskers are as indicated in Fig. 3b. P values are indicated, _t_-test. g, Human–mouse m1A conservation expressed as per cent of orthologous positions with shared m1A peaks according to their location in the transcript.
We systematically assessed the extent of m1A peak conservation between human and mouse and found that it extends to the gene level: out of 1,338 identified mouse liver m1A peaks that could be mapped to adequately expressed, orthologous positions in human HepG2 cells, 441 had an m1A peak at the orthologous position, representing 33% overall conservation (P <1.3×10−310, Mann–Whitney U test) (Fig. 4g, Extended Data Fig. 7g). The 5′ UTR and a 300-nucleotide window centred on the AUG codon exhibit the highest degree of conservation with 44–46% conserved peaks, compared to 3–16% in other gene segments (Fig. 4g).
We applied m1A-seq to RNA of Saccharomyces cerevisiae and Schizosaccharomyces pombe to further examine this mark in simple eukaryotes, and found it to be present in their mRNA transcriptomes, albeit without the characteristic mammalian pattern (Extended Data Fig. 8a–g, Supplementary Tables 3, 4). Importantly, upon transfer to a nitrogen-source deficient medium the S. pombe methylome exhibited noticeable changes in the identity of methylated transcripts (some transcripts gained m1A while others lost it), providing an example of how physiological conditions dynamically shape m1A (Extended Data Fig. 8h, i). These results further demonstrate the conservation of m1A as a mark in eukaryotic mRNA, although the distribution pattern and functions in lower eukaryotes could be different from mammals, as also observed for m6A25,26.
Next, using quantitative LC-MS/MS we surveyed a range of physiological perturbations that could alter the total m1A level in mRNA of mammalian cells. We found that glucose or amino acid starvation reduced m1A level by approximately threefold and twofold, respectively, as early as 4 h; that heat shock increased m1A level by approximately 1.5-fold at 4 h; and that serum starvation resulted in only a modest change within the same time frame (Fig. 5a, Extended Data Fig. 9a, b). Of note, m6A levels measured in parallel do not change, or change slightly in the opposite direction, suggesting that the response is m1A-specific (Fig. 5a). m1A-seq performed after 4 h of glucose starvation or heat shock uncovered a more complex picture: while the overall number of m1A peaks decreased (by 17%) and increased (by 23%), respectively, mirroring the LC-MS/MS measurement, still some individual positions behaved in the opposite direction (Fig. 5b, c; Extended Data Fig. 9c, d).
The m1A levels across various tissues obtained from a single mouse also showed significant variability, with kidney and brain possessing the highest m1A level (about threefold higher than that measured in liver, for example) (Fig. 5d). A comparison between tissues from lean (wt/wt) and obese mice (ob/ob) revealed that brains of the former contain 75% more m1A (Fig. 5d). In sum, m1A in mRNA is a dynamic modification in response to certain stress conditions and potentially physiological signalling, and its level varies between different tissues.
SAM-dependent methyltransferases that install m1A on tRNA and rRNA are known in eukaryotes23,27. These or related homologues could mediate mRNA m1A methylation. FTO, the first RNA demethylase to be discovered, belongs to the AlkB family of proteins, and catalyses oxidative demethylation of m6A in mRNA28. Other members of the AlkB family are known to perform oxidative demethylation of m1A and m3C lesions in DNA/RNA. In particular, ALKBH3 was shown to have a strong preference for single stranded DNA/RNA, and to demethylate m1A in tRNA and mRNA in vitro29,30. In line with previous biochemical observations, overexpression of wild-type ALKBH3, but not of an inactive mutant, reduced m1A levels in mRNA (Extended Data Fig. 9e). These results suggest that ALKBH3 and its homologues are likely candidates that could reverse m1A in mRNA and contribute to its dynamic regulation.
m1A correlates with elevated translation
Structure and sequence features of the 5′ UTR and both sides of the start codon affect the scanning process and thereby the efficiency of translation initiation and early elongation31,32. We show here that m1A is a widespread and conserved post-transcriptional modification that is associated with TISs in thousands of mammalian transcripts characterized by structured 5′ UTRs. The precise localization of m1A in an area of obvious regulatory importance, coupled with its ability to restructure RNA in other cases (such as tRNA33) and to affect RNA–protein interactions, points to possible involvement in translation initiation.
We used published ribosome profiling and proteomic data sets, obtained from the same cell lines and tissues used for m1A profiling, to assess possible effects of m1A on translation (see Methods). The translation efficiency19 (TE) and ribosome release score34 (RRS) of genes with a single m1A peak in the start codon window compared to genes devoid of m1A altogether are significantly higher (~1.2–1.4, on average) in both human and mouse cells (Extended Data Fig. 10). Furthermore, correlation of m1A with protein levels normalized to mRNA abundance reveals a similar trend: in all cell types examined, methylated genes tend to have higher protein levels than non-methylated genes (Fig. 6a–f). The average fold-change in protein levels between methylated and non-methylated genes in all cell types—and across all gene expression bins—is ~1.7. Considering that the average fraction of methylated transcripts is ~20%, the isolated true effect of m1A could be even higher. The contribution of m1A remains significant even after accounting for multiple covariates that are known to affect translation (ANCOVA, Supplementary Table 8).
Figure 6. m1A around the start codon correlates with higher protein levels.
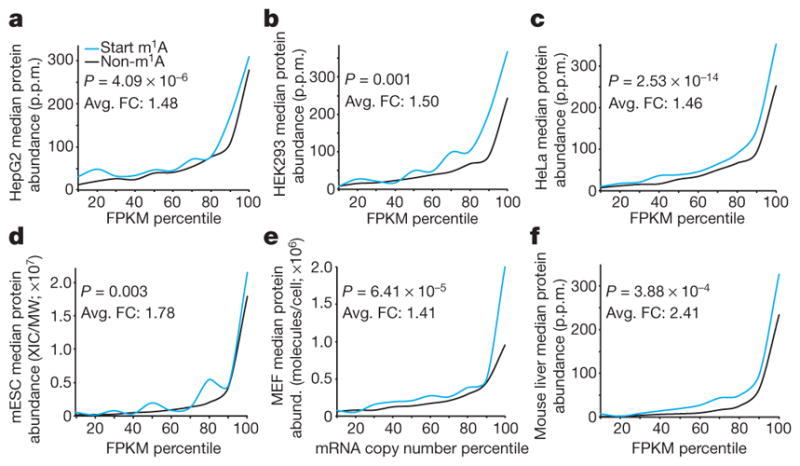
a–f, Genes methylated in a 300-nucleotide window centred on the start codon have higher protein levels than all other genes with similar RNA expression levels in HepG2 (a), HEK293 (b), HeLa (c), mESC (d), MEFs (e) and mouse liver (f). ANOVA m1A P values against log2 protein levels and the average fold-change (Avg. FC) of median protein levels across all gene expression bins (Start m1A/Non-m1A) are indicated. FPKM, fragments per kilobase of transcript per million mapped reads.
Discussion
_N_1-methylation on RNA adenosine occurs at the Watson–Crick interface and is expected to affect RNA base pairing35. In addition to an added methyl group, this modification also endows the modified adenosine with a positive charge under physiological conditions (Fig. 1a), which could markedly alter RNA structure and protein–RNA interactions. The impact of m1A on the structure and function of tRNA is well documented, where a single m1A can be essential for correct functional folding of a tRNA molecule33. A single charge difference has been shown to induce ~100–1,000-fold affinity difference of protein–DNA interactions36. We show here that m1A is a modification occurring on thousands of mRNA transcripts in several human and mouse cell types, as well as on hundreds of transcripts in two yeast species. Applying m1A-seq, a method relying on immunoprecipitation of m1A-containing RNA fragments, we found a striking enrichment of m1A around the start codon in human and mouse mRNA. Taking advantage of the Dimroth rearrangement, which converts m1A (mutation prone in reverse transcription) to m6A (low mutation rate in reverse transcription37) with alkaline treatment, we confirmed the accumulation of m1A around the start codon at high resolution.
Transcriptome-wide mapping of m1A revealed unique features of its distribution that strongly indicate functional roles: (1) m1A resides close to both canonical and alternative TISs found mostly upstream of the first splice site; (2) m1A is present in highly structured regions around the start codon; (3) m1A positively correlates with translation efficiency and protein level; (4) the distribution pattern and m1A peaks are highly conserved in all mouse and human cell types examined; and (5) m1A is dynamic in response to certain stress, and potentially physiological, signals, and its level varies across mouse tissues. Together, these attributes suggest a positive and dynamic role for m1A in translation initiation in mammalian cells. The importance of RNA structure in translation initiation is well appreciated38. A positively charged m1A may alter the secondary/tertiary structure of mRNA around TISs by blocking Watson–Crick base pairing or introducing charge–charge interactions. Alternatively, potential binding proteins may specifically recognize m1A and facilitate translation initiation of methylated transcripts in a way analogous to the role of the m6A reader YTHDF1 in translation enhancement39. Either way, it is tempting to speculate that m1A can modulate the strength of a particular translation initiation site, thereby affecting the balance between alternative and canonical initiation sites.
In contrast to m6A, which is enriched around the stop codon and in the 3′ UTR1,2, m1A preferentially associates with the start codon region in mammalian mRNA. These two marks could complement each other in controlling mRNA metabolism and translation. A single m6A modification usually induces ~10-fold change in either duplex stability or protein–RNA affinity, as would be expected by the presence of an extra methyl group40,41. The propensity of m6A to cluster at 3′ UTRs also enables a wider range of dynamic tuning than a single m6A site could offer1,2. The unique chemical properties of m1A, with both a positive charge and a methyl group, potentially allow each individual modified site to have a stronger effect than m6A in terms of RNA structure or protein–RNA interaction.
The discovery of this new mRNA mark that positively correlates with translation adds an exciting new dimension to post-transcriptional gene expression regulation mediated through mRNA modifications. While our paper was in proof, we were alerted to a study by Chengqi Yi and colleagues reporting similar findings on the m1A methylome in a human cell line42.
METHODS
Cells and tissues
Human HeLa (cervical adenocarcinoma), HepG2 (hepatocellular carcinoma) and HEK293 (embryonic kidney) cell lines (ATCC) and primary mouse embryonic fibroblasts (MEFs) (C57BL/6, ATCC) were maintained in DMEM (Thermo Fisher Scientific) containing 25 mM glucose, 4 mM -glutamine, supplemented with 100 U ml−1 penicillin, 100 μg ml−1 streptomycin and 10% FBS. Mouse embryonic stem cells (mESCs) were maintained in FBS-free N2B27-based media, as previously described43. Cells were routinely checked for mycoplasma contamination. Mouse tissues were obtained from wild-type and ob/ob C57BL/6 mice. For metabolic labelling, methionine-devoid DMEM was supplemented with L-methionine-(methyl-d3) (Sigma-Aldrich).
Cell treatments
HepG2 cells were maintained as described above and subjected to the following growth conditions: (1) heat shock (43 °C for 4 h); (2) glucose starvation (glucose-depleted medium for 4 h); (3) amino acid starvation (amino acid-depleted medium, with or without 200 μM _S_-adenosyl-methionine (SAM) supplementation, for 4 h); and (4) serum starvation (serum-depleted medium for 4 h), following which they were immediately harvested in Cell Lysis Solution (5 Prime).
Yeast strains and growth conditions
Wild-type (BY4741) S. cerevisiae cells were grown vegetatively in YPD medium to mid-log phase and harvested. Wild-type heterothallic (Sp1) S. pombe cells were grown vegetatively in YES medium to mid-log phase and harvested. For induction of sporulation/arrest, Sp1 cells were washed and transferred to Edinburgh Minimal Medium lacking NH4Cl (EMM-N) for 4 h and harvested.
RNA purification
Total RNA from cells in culture and mouse tissues was purified using PerfectPure RNA Cultured Cell Kit (5 Prime) and PerfectPure RNA Tissue Kit (5 Prime), respectively, and DNase-treated. Enrichment of polyadenylated RNA (polyA + RNA) from total RNA was carried out using one round of GenElute mRNA Miniprep Kit (Sigma-Aldrich). Ribo-Zero Gold rRNA Removal Kit (Illumina) was used to deplete rRNA from polyA+ RNA before LC-MS/MS.
Dot blot assays
RNA Oligonucleotides were synthesized in-house with either m1A, m6A or A at a single internal position (5′-AC(m1A/m6A/A)UG-3′), spotted onto a nylon membrane (GE Healthcare) in decreasing amounts (1,000, 200, 40 and 8 pmol) and UV-crosslinked. Membranes were blocked with 5% non-fat dry milk in 1 × PBST (blocking buffer) for 1 h at 25 °C, and incubated overnight with either mouse anti-m1A antibody (1 μg ml−1, MBL) or rabbit anti-m6A antibody (1 μg ml−1, Synaptic Systems) in 1 × PBST at 4 °C. Following extensive washing with 1 × PBST, membranes were incubated with either HRP-conjugated goat anti-mouse IgG or anti-rabbit IgG antibody (1:2,500, Thermo Fisher Scientific) in blocking buffer for 1 h at 25 °C. Membranes were washed in 1 ×PBST, developed with ECL substrate (Thermo Fisher Scientific) and imaged with FluorChem imager (Protein Simple) or X-ray film. Competitive dot blots were performed on separate membranes spotted with 75 pmol of the m1A-containing oligonucleotide by co-incubation of anti-m1A antibody with increasing concentrations of either m1A or m6A competitor mononucleoside (0, 1, 2 and 4 μM).
m1A detection and quantitation
Purified RNA (see ‘RNA purification’ section above) was subjected to liquid chromatography-tandem mass spectrometry (LC-MS/MS) for detection and accurate quantitation of m1A, essentially as previously described44. 200–400 ng of purified RNA was digested by P1 nuclease (Wako, 2 U) in 40 μl of buffer containing 25 mM NaCl and 2.5 mM ZnCl2 for 2 h at 37 °C. Subsequently, 5 units (1 μl) of Antarctic Phosphatase (New England Biolabs) and 1 × Antarctic Phosphatase reaction buffer were added and the sample was incubated for another 2 h at 37 °C. The sample was then filtered (0.22 μm, Millipore) and injected into a C18 reverse phase column coupled on-line to Agilent 6410 QQQ triple-quadrupole LC mass spectrometer in positive electrospray ionization mode. Quantitation was performed based on nucleoside-to-base ion transitions (268-to-136 for A; 282-to-150 for m6A and m1A (retention times of 2.5 and 0.9 min, respectively); 285-to-153 for d3-m1A and d3-m6A; 245-to-179 for Ψ; 245-to-113 for U) using standard curves of pure nucleosides and stable isotope-labelled internal standards (d3-m1A and d3-m6A), as previously described45–47.
Synthesis of stable isotope-labelled internal standards
d3-m1A was synthesized following a previously described procedure for the synthesis of m1A48, replacing CH3I with CD3I. d3-m6A was synthesized following a previously described procedure for the synthesis of m6A49,50, replacing CH3NH2 with CD3NH2.
m1A-seq
Mapping of m1A in total or mRNA was performed using m1A-seq, which is based on the previously described m6A-seq protocol51 with the following modifications: RNA fragmentation was performed using RNA Fragmentation Reagents (Thermo Fisher Scientific) for 15 min at 70 °C to minimize m1A-to-m6A rearrangement followed by column purification (RNA Clean & Concentrator, Zymo). Anti-m1A antibody (MBL) was pre-coupled to Protein G Dynabeads (Thermo Fisher Scientific) and used to immunoprecipitate methylated RNA fragments for 3 h at 4 °C. Fragment elution was carried out by either digestion with Proteinase K (Sigma-Aldrich; 5 units in 5 mM Tris pH 7.5, 1 mM EDTA and 0.25% SDS for 1.5 h at 37 °C) followed by TRIzol (Thermo Fisher Scientific) extraction of the supernatant and ethanol precipitation, or by competitive elution using m1A mono-nucleoside (Santa Cruz Biotechnology), as in m6A-seq. Induced m1A-to-m6A rearrangement was achieved by incubating the input and immunoprecipitation fragments in an alkaline buffer (50 mM Na2CO3, 2 mM EDTA, pH 10.4) for 1 h at 50 °C or 60 °C followed by column purification (RNA Clean & Concentrator, Zymo) (Extended Data Fig. 1m). Immunoprecipitated RNA fragments and comparable amounts of input were subjected to first-strand cDNA synthesis using the NEBNext Ultra RNA Library Prep Kit for Illumina (New England Biolabs). Sequencing was carried out on Illumina HiSeq2500 according to the manufacturer’s instructions, using 10 pM template per sample for cluster generation, TruSeq SR Cluster kit v3 (Illumina), TruSeq SBS Kit v3-HS (Illumina) and TruSeq Multiplex Sequencing primer kit (Illumina). Summary of read numbers for each replicate can be found in Supplementary Table 4.
Validation of m1A-seq
Reads were aligned to the 28S ribosomal RNA sequences of human (RefSeq NR_003287.2), mouse (RefSeq NR_003279/NCBI X00525) and S. cerevisiae (SGD RDN25-2, ID: S000006485.) using Bowtie252 with local alignment option (--local). Enrichment was calculated as the coverage ratio of immunoprecipitation to input. Mismatch rate was assessed using mpileup tool of the SAMtools software package (version 0.1.18)53 for calling variants over the entire 28S transcript. The frequency of non-adenosine bases at each adenosine position and the coverage of each base in the transcript were reported.
RNA expression level
Reads per kilobase of transcript per million mapped reads (RPKM) expression levels of RefSeq genes were calculated using HTseq-count54 and R package edgeR55. Fragments per kilobase of transcript per million mapped reads (FPKM) values were calculated by the CUFFLINKS tool (version 2.2.1)56. Only genes whose expression level was above the first quartile were considered adequately expressed and used for downstream analyses. Adequately expressed genes (RPKM) were divided into 10 expression bins for correlation with methylation and the fraction of methylated genes in each bin was calculated.
Peak calling
Adaptors and low quality bases were trimmed from raw sequencing reads using cutadapt57. Reads were aligned to the relevant genome (human-hg19, mouse-mm10, _S. pombe_-ASM294v2.29, and _S. cerevisiae_-S288C with UTR data downloaded from http://genie.weizmann.ac.il/pubs/PARS10/pars10_catalogs.html) using Tophat2 (version 2.0.12)58. Peaks enriched in immunoprecipitation over input experiments were identified using MACS2 (version 2.1.0.20140616)18. MACS2-identified peaks were intersected with a database of exons of the relevant genome (RefSeq annotation). Peaks were allocated to the feature containing the segment with which they share the largest overlap. Peaks falling in intergenic sequences or having an overlap shorter than 50 nucleotides were excluded from further analyses. For each cell type only peaks identified (FC ≥ 2 or FC ≥4, as indicated, FDR ≤ 0.05) in replicates were considered. Common human peaks were defined as peaks independently identified in both HeLa and HepG2 RNA. Negative peaks were identified by switching the immunoprecipitation and input samples.
Coverage analysis
The coverage of unique reads at each nucleotide position at the transcriptomic level, in immunoprecipitation and input reads, was calculated and reported. Only transcripts in which at least one nucleotide exceeded a minimum depth of 10 reads in immunoprecipitation were used in further analysis for reduction of background noise. For whole-transcript coverage plots, each transcript was divided into 100 bins of equal length, and the median coverage for each bin across all transcripts was calculated.
m1A stoichiometry
HepG2 mRNA was subjected to immunoprecipitation with anti-m1A antibody in 2 biological replicates. Input and immunodepleted (unbound sup) RNA samples (75 ng each) were hybridized to PrimeView human gene expression microarrays (Affymetrix) and expression levels were determined. Genes expressed below the first quartile (as determined by mRNA-seq, see above) were set as the minimal intensity limit (blank), and only genes with intensities above this threshold were considered. To correct for technical loss of RNA during the different steps of the procedure, the average ratio of sup/input intensity was calculated for never-methylated genes (considering only genes that were unmethylated in all m1A-seq experiments) and used for ratio correction of methylated genes carrying one m1A peak. Fractional methylation level per gene was calculated as 1 – (corrected sup/input ratio).
Identification of m1A-induced mismatches in m1A peaks
Identification of sequence variants in m1A peaks due to misincorporation at the m1A position during reverse transcription was carried out by determining the base composition at each position within peak regions using bam-readcount (https://github.com/genome/bam-readcount). Identified adenosine positions (according to the encoding DNA strand) were then filtered to exclude known genomic polymorphism sites (dbSNP version 141) and identified A-to-I editing sites (Radar database). Variants were considered if the mismatch rate was greater than 0.1 and the overall coverage was greater than 20 reads. For HepG2 samples the fold enrichment of mismatch rate in untreated over rearranged sequence reads was calculated.
Trough identification
To identify points of lower coverage inside peak areas, we converted the bam files of the immunoprecipitation libraries to BigWig files and subjected them to PeakSplitter59 with options of –valley 0.65 and –cutoff 30. The trough was identified as the minimal point ±10 nucleotides, between the summits of identified sub-peaks. Only troughs reoccurring in 3 biological repeats were considered.
Bidirectional conversion of genomic and transcriptomic coordinates
Genomic coordinates of all 5′ UTRs, CDS and 3′ UTRs of RefSeq transcripts were downloaded from the University of California, Santa Cruz genome browser (UCSC) table browser in BED format (hg19 and mm10 for human and mouse, respectively). Transcripts with IDs corresponding to more than one genomic location were discarded, as were transcripts of non-coding genes. Custom, in-house, awk and perl scripts were then used to convert transcriptomic coordinates to genomic coordinates and vice versa.
Definition of peak middle point
MACS2-generated genomic m1A peak coordinates were converted to transcriptomic coordinates. Neighbouring peaks (at a distance of up to 10 nucleotides) on the same transcript were merged using mergeBed from the BEDTools package60. This allowed the unification of peaks overlapping more than one exon that were divided by MACS2 due to the presence of introns in genomic coordinates. The middle of the resulting transcriptomic peak was defined as peak middle and referred to as m1A peak position in further analyses.
Metagene profiling
The relative position of each peak’s middle point was located in the corresponding transcript segment (5′ UTR, CDS or 3′ UTR). Each segment was assigned a value corresponding to its average length fraction out of the overall transcript length. The corresponding relative peak position was then deduced within each segment and plotted along a normalized metagene profile with respect to the TSS, AUG start codon and stop codon positions. The distribution of m1A peaks with respect to the canonical AUG start codon, TSS, first and nearest splice sites, and stop codon was also drawn in actual nucleotide distances.
Sliding window analysis of AUG start codon window
Structural features of a 300-nucleotide window centred on the AUG start codon were compared between methylated and non-methylated RefSeq genes. GC content was calculated as the average percent in a sliding window of 3 nucleotides. Local free energy (ΔG) was calculated in a 30-nucleotide consecutive jumping window (in steps of 10 nucleotides) using the RNAfold tool in the ViennaRNA package61 with default parameter settings.
Minimum free energy (MFE) calculation
The 5′ UTR sequence of the predominant isoform of each gene (the highest expressed isoform in the input sample) was used to calculate GC content, MFE, length-adjusted MFE (aMFE) and MFE density (MFEden) using the ViennaRNA package61 and as previously described62.
PARS-seq and PARS scores calculations
Parallel analysis of RNA structure (PARS) was performed as previously described63 on HepG2 polyA+ RNA. Reads were mapped to the human transcriptome (UCSC known canonical genes) using Bowtie252 with local alignment option (--local). Only uniquely aligned reads were used for analysis. Read start positions were counted for each base in the transcrip-tome, as the read start is +1 to the nuclease cleavage site and therefore informative regarding local RNA 2D structure64. Only reads with more than 5 consecutive bases matching the transcript at the start of the read were counted. Read counts were normalized to the respective library size. PARS-scores were then calculated based on the following equation:
PARS-score(i,j)=log2(V1′ij/S1′ij)
V1′ij and S1′ij are the normalized read-start counts at base (i) in transcript (j) for V1 or S1, respectively.
PARS scores at the region around the start-codon (±150 nucleotides from the AUG) were averaged and used for a metagene analysis.
Motif search
To search for a motif, 101-nucleotide sequences in the AUG start codon window, centred on m1A peaks in HeLa and mouse liver, were used. Compatible background sequences were used to prevent skewing of the results due to over-representation of known motifs in the region of the start codon, such as Kozak sequences and the AUG. The findMotifs program from the HOMER package65 was then run using the settings -rna -len 6,7,8,9,10 –noweight. The same peak areas were used with MEME66 for de novo motif enrichment analysis, with the settings -dna -minw 6 -maxw 10 -evt 0.01 -maxsize 1,000,000. A similar analysis was performed on m1A peaks falling in the CDS with background sequences randomly generated from non-methylated exons. 199 sequences of 20 nucleotides, surrounding the mutations identified above, were used to create a frequency plot of the nucleotides surrounding the mutation sites using WebLogo67.
Comparison of m6A and m1A profiles
m1A and m6A peaks1,42,68 were intersected using BEDTools60. Similarity between sets was also evaluated by comparing the metagene profiles of the two modifications.
TIS correlation
TISs data was downloaded from http://www.ncbi.nlm.nih.gov/sra?term=SRA160745 (ref. 21) and genomic locations were converted to transcriptomic locations (as described above). For each alternative TIS, the closest m1A peak was identified and the distance of both from the canonical AUG start codon was calculated. Correlation of alternative TISs with the number of m1A peaks per gene was carried out by dividing the genes containing alterative TISs to bins according to the number of peaks per gene.
Gene ontology (GO) enrichment
Methylated gene RefSeq IDs were uploaded to DAVID Bioinformatics Resources (http://david.abcc.ncifcrf.gov) and functional enrichment analysis was performed using all adequately expressed genes as background. Resulting enriched GO terms were restricted to fold enrichment ≥1.5, Bonferroni corrected P ≤0.005.
Human–mouse conservation
m1A mouse liver peaks were converted to the homologous coordinates in the human hg19 genome, using the LiftOver tool of the UCSC genome browser69. To assess the significance of these results we chose at random an equal number of 200 bp sized areas from within mouse genes that have a human orthologue. The areas were chosen from all gene segments in the same proportion as observed in the original data set. Randomly chosen areas were similarly converted and intersected with HepG2 m1A peaks. To calculate the statistical significance the randomization was repeated 1,000 times and Mann–Whitney U test was used.
ALKBH3 overexpression
Plasmids encoding wild-type and mutant (D193A) FLAG-tagged human ALKBH3 were transfected into 293 Freestyle cells using polyethylenimine (PEI; Polysciences, Inc.) at a ratio of 3 μl PEI per 1 μg plasmid DNA. After 24 h, cells were pelleted and washed once with cold PBS before being lysed in Cell Lysis Solution (5 Prime). mRNA was purified and digested for LC-MS/MS analysis as described in the ‘RNA purification’ and ‘m1A detection and quantitation’ sections above.
Translation efficiency (TE) and ribosome release score (RRS)
Sequencing data was downloaded: for HEK293, mouse liver and MEFs - SRA16074521, http://www.ncbi.nlm.nih.gov/sra?term=SRA160745; for mESCs - GSE3083919, http://www.ncbi.nlm.nih.gov/geo/query/acc.cgi?acc=GSE30839. Reads were aligned and FPKM values were calculated (see above). For TE calculation, the Ribo-Seq FPKM of the most highly expressed transcript of each gene was divided by the mRNA-Seq FPKM of the same transcript. Only transcripts with FPKM and Ribo-Seq FPKM above first quartile were considered. TE data for mESCs was downloaded as-is from the original paper19. TE and RRS for HeLa were calculated using our published data44. RRS values were calculated using mRNA-Seq and Ribo-Seq reads as described previously34,42.
Protein abundance
All protein abundance data analysed in this study was downloaded from the MOPED database (Multi-Omics Profiling Expression Data, https://www.proteinspire.org): HeLa, HepG2, HEK293 (Experiment ID: Geiger_MCP_2012)70, and mouse liver (Experiment ID: Baylor_mouse_liver_profiling), or from Supplementary Data (mESCs71 and MEFs72, corrected as described73). For all cell types, excluding mESCs, we used the normalized abundances as provided. For mESCs, raw intensities were divided by each leading protein molecular weight. Protein abundance data was then log2 transformed and subjected to an analysis of variance (ANOVA) with mRNA expression (FPKM) percentile bins for start m1A and non-m1A genes. For MEFs, the published mRNA expression data was used along with the corresponding protein abundance. Genes with mRNA expression below the lowest expressed gene containing m1A or with FPKM < 0.2 were discarded.
Analysis of covariance (ANCOVA)
ANCOVA was calculated for genes methylated at the AUG start codon window (start m1A) versus unmethylated genes (non-m1A) as a fixed factor against log2 protein abundances, while cleaning the contribution of the following covariates: log2 mRNA expression, TIS Kozak score74, MFE calculated by RNAfold and divided by 5′ UTR length, G-quadruplex motif in 5′ UTR75,76, 5′ TOP motif in 5′ UTR from UTRdb (http://utrdb.ba.itb.cnr.it/), number of conserved miR sites (PCT score < 0) from TargetScan77, and number of u/dTISs and u/dAUGs in human and mouse form QTI-seq21. The remaining factors, % GC Content in 5′ UTR, length of 5′ and 3′ UTRs, and number of exons in 5′ and 3′ UTRs were downloaded and calculated from the UCSC genome browser (hg19 and mm10). We considered the most expressed RefSeq genes in our data for unique transcript-associated parameters and gene symbols for general features. Variables were examined for linearity with protein output and for normal distribution. Log transformations were employed where appropriate. Tolerance was kept above 0.2 for all variables.
Extended Data
Extended Data Figure 1. Experimental conditions for detection, quantitation and sequencing of m1A in mRNA.

a, Schematic illustration of m1A-to-m6A rearrangement (Dimroth rearrangement) under alkaline conditions at elevated temperatures. b, mRNA purification scheme before LC-MS/MS m1A quantitation (left). Corresponding RNA electrophoresis profiles obtained by Agilent 2100 Bioanalyzer (middle and right). c, Monitoring m1A-to-m6A rearrangement levels during sample preparation for LC-MS/MS. Synthetic 5-nucleotide long RNA oligonucleotides containing m1A (upper panel) or m6A (lower panel) were digested to mononucleotides, dephosphorylated (see methods) and analysed by HPLC-UV. Only minimal (<10%) m1A-to-m6A rearrangement was observed (arrow). d, Standard curves for m1A and deuterium-labelled m1A (d3-m1A) demonstrate very similar detection sensitivity in LC-MS/MS. Mean values ± s.e.m. are shown, n = 3. e, The change in m1A/A and m6A/A molar ratios (%) during the purification scheme outlined in b. Mean values ± s.e.m. are shown, n = 3. f, LC-MS/MS of mRNA isolated from HepG2 cells labelled with deuterated methionine (d3-Met) for 24 h detects d3-m1A, suggesting _S_-adenosyl-methionine (SAM) is the methyl donor. Mean values ± s.e.m. are shown, n = 3. g, Dot blots demonstrating high anti-m1A antibody specificity. Increasing amounts (indicated above the top blot) of synthetic RNA oligonucleotides containing m1A, m6A or unmodified A residues were spotted onto a membrane and probed with either anti-m1A or anti-m6A antibodies. Anti-m1A antibody detects m1A and does not exhibit cross-reactivity with m6A or A (upper blot); anti-m6A antibody demonstrates low, yet detectable, cross-reactivity with both m1A and A (lower blot). For blot source data, see Supplementary Fig. 1. h, Competitive dot blots were performed on separate membranes spotted with 75 pmol of synthetic m1A-containing RNA oligonucleotide. Whereas increasing concentrations of free m1A mononucleoside progressively attenuate anti-m1A binding, increasing concentrations of free m6A mononucleoside do not. For blot source data, see Supplementary Fig. 1. i, Quantitative LC-MS/MS demonstrates m1A enrichment—and m6A depletion—following immunoprecipitation (IP) with anti-m1A antibody compared to total RNA input. Mean values ± s.e.m. are shown, n = 3. j, Monitoring m1A-to-m6A rearrangement levels under different RNA fragmentation conditions for use in m1A-seq. Pure m1A mononucleoside in 1×fragmentation buffer (see Methods) was subjected to the conditions specified to the right of the chromatograms and directly analysed by injection to HPLC-UV for rearrangement to m6A. k, Comparison of competitive m1A elution and Proteinase K elution of immunoprecipitated m1A-containing RNA fragments from anti-m1A-coupled magnetic beads shows that the two elution modes are equivalent. l, Identification of the known m1A site in position 1322 of human 28S rRNA validates the accuracy of m1A-seq and the use of peak middle points as a close approximation for m1A sites. Partial m1A-to-m6A rearrangement increases the coverage around this site. m, Conditions for induced m1A-to-m6A rearrangement of RNA oligonucleotides that maintain RNA integrity for use in m1A-seq. A synthetic 5-nucleotide long RNA oligonucleotide of the sequence 5′-AC(m1A)UG-3′ was subjected to various base/heating conditions (indicated to the right of the chromatograms) and directly analysed by injection to HPLC-UV for rearrangement to 5′-AC(m6A)UG-3′. Incubation at pH 10.4, 60 °C for 1 h results in rearrangement to m6A in 40% of oligonucleotides; longer incubation times result in increased rates of rearrangement. Chromatograms of untreated RNA oligonucleotides appear above and mark the expected retention times.
Extended Data Figure 2. Characterization of human m1A-methylated genes.

a, Gene ontology (GO) analysis of methylated HeLa genes relative to all adequately expressed genes (above the 1st quartile) reveals enrichment of biological processes related to translation and RNA metabolism. Fold-enrichment and P values are indicated for each category. b, GO analysis of molecular functions reveals enrichment of structural constituents of the ribosome. Scheme based on an illustration obtained from DAVID bioinformatics website of the KEGG human ribosome pathway. Red stars indicate methylated genes in the pathway. Colouring of the boxes and ribosome constituents is according to KEGG pathway maps showing interacting proteins and hyperlinks to gene entries that can be reached through http://www.genome.jp/kegg-bin/show_pathway?hsa03010. c, The average fraction of methylated transcripts (stoichiometry) increases with gene expression level. r and P values are indicated, Pearson correlation. d, Pie chart presenting the fraction of m1A peaks in each of three non-overlapping transcript segments (5′ UTR, CDS and 3′ UTR) in HEK293 cells. e–g, The fraction of methylated genes increases with gene expression levels in HepG2 (e), HEK293 (f) and common human peaks (see Methods) (g).
Extended Data Figure 3. Metagene analyses of human m1A peaks.

a, Metagene profiles demonstrating sequence coverage along a normalized gene transcript. Sequence reads of m1A immunoprecipitation and input in HeLa cells are indicated in blue and orange, respectively. b–d, Metagene profiles of m1A peak distribution in a non-normalized window centred on the AUG start codon (b), extending downstream from the transcription start site (TSS) (c) and centred on the stop codon (d), in the indicated human cell types. e, Metagene profiles comparing the distribution of m1A peaks (blue) to that of negative peaks (black) along a normalized transcript composed of three rescaled non-overlapping segments illustrated below, in HeLa cells. f, Table demonstrating m1A peak enrichment in growing windows centred on the AUG start codon in HeLa cells. Enrichment is calculated as number of peaks in the window divided by window size (nucleotides). g, Table summarizing the overlap between m6A and m1A peaks in HepG2, HEK293 and WT mESCs. m6A peaks are sourced from Dominissini et al.1, Linder et al.67 and Geula et al.42, respectively. m1A peaks are from the current study. h, i, Metagene profiles of m1A peak distribution in a non-normalized window centred on the AUG codon (h) and extending downstream from the TSS (i). Peaks are sorted by the exon containing the AUG codon and the length of the first exon, respectively. j, Metagene profiles of m1A peak distribution in a non-normalized window centered on the nearest splice site. Peaks are sorted by the exon containing the AUG codon in that gene. k, m1A-induced reverse transcription (RT) arrests produce typical m1A peaks characterized by a central region of reduced coverage with a local minimum (m1A trough) Examples are shown. l, m1A-to-m6A rearrangement results in a reduced number of identified m1A troughs. Higher rates of rearrangement further reduce the number of identified m1A troughs (right panel). Example is shown (left panel). m, Metagene profile of m1A trough distribution along a normalized transcript composed of three rescaled non-overlapping segments illustrated below, in HepG2 cells. n, Metagene profile of m1A trough distribution in a non-normalized window centred on the AUG start codon in HepG2 cells. o, Metagene profile of m1A trough distribution along a normalized transcript in HepG2 cells. p, Metagene profile of m1A trough distribution in a non-normalized window centred on the nearest splice site in HepG2 cells. q, Pie chart presenting the fraction of m1A troughs in each of three non-overlapping transcript segments (5′ UTR, CDS and 3′UTR) in HepG2 cells. r, MEME motifs identified in 100-nucleotide windows centred on m1A troughs that lie within the AUG start codon window (±150 nucleotides) in HepG2 cells.
Extended Data Figure 4. Correlation between m1A sites and TISs in human.

a, b, The mean number of alternative TISs in methylated (m1A) versus all other (unmethylated) genes in HeLa (a) and HEK293 (b) cells. Mean values ± s.e.m. are shown. P values are indicated, Mann–Whitney U test. c, The mean number of alternative TISs per gene as a function of the number of m1A peaks per gene in HeLa and HEK293 cells. Mean values ± s.e.m. are shown; r and P values are indicated, Pearson correlation; regression line is drawn. d, e, The percentage of genes with upstream (=5′ UTR) or downstream (=CDS) m1A sites out of all genes that have either downstream or upstream TISs, compared to the expected percentage in HeLa (d) and HEK293 (e) cells. P values are indicated, χ2 test. f–h, Scatter plots showing the correlation between the locations (log2) of alternative TISs and m1A peaks with respect to the canonical AUG start codon (0) in HeLa (f), HEK293 (g) and HepG2 (h) cells: left, upstream TISs (uTIS) and 5′ UTRs m1A peaks; right, downstream TISs (dTIS) and CDS m1A peaks. r and P values are indicated, _t_-test.
Extended Data Figure 5. Structure and sequence features of m1A sites in human mRNA.

a, m1A peaks have a significantly higher GC content compared to negative peaks in all three transcript segments: 5′ UTR, CDS and 3′ UTR. Box limits represent 25th percentile, median and 75th percentile, whiskers represent 2.5 and 97.5 percentiles, and dots indicate outliers. P = 1.5 ×10 −278, P = 8.2 ×10 −259 and P = 3.3 ×10 −271, respectively, _t_-test. b, Motifs identified in 400-nucleotide windows centred on the canonical AUG start codon in genes with m1A peaks in this window (upper table), or around m1A peaks located in the CDS, outside the AUG start codon window (lower table). c, Examples of adenosines around m1A peak middles with increased mismatch rates. Fold-enrichment values are the ratios of mismatch rates in untreated relative to rearranged samples. The top ten highest fold enrichment samples are shown. d, e, GC content (d) and minimum free energy density (MFEden) (e) of 5′ UTRs of methylated (m1A), unmethylated (Non-m1A) and all genes. Box limits represent 25th percentile, median and 75th percentile, whiskers represent 2.5 and 97.5 percentiles. P values are indicted, _t_-test. f, Mean GC content (upper panel), PARS score (middle panel) and free energy (ΔG, lower panel) in a 300-nucleotide window centred on the start codon of commonly methylated genes relative to non-methylated genes (see Methods). Error bars represent s.e.m. g, The PARS scores of methylated compared to all other genes in HepG2 cells in a 150-nucleotide window extending downstream from the TSS, calculated in 30-nucleotide sliding windows. Each plot represents data from an independent PARS experiment. Error bars represent s.d.
Extended Data Figure 6. Features of the mouse m1A methylome (part 1).

a, Detection of an m1A site at position 1135 of mouse 28S rRNA, in mouse liver m1A immunoprecipitation. A drop in sequence read coverage can be seen at the methylated position. b, Fold-enrichment (immunoprecipitation over input reads) identifies an m1A peak. c, High mismatch rate at the identified m1A 1135 in mouse 28S rRNA. d, Pie charts presenting the fraction of m1A peaks in each of three non-overlapping transcript segments (5′ UTR, CDS and 3′ UTR) in the indicated mouse cell types. e, Metagene profiles of m1A peak distribution in a non-normalized window centred on the AUG start codon in the indicated mouse cell types. f, Table showing m1A peak enrichment in growing windows centred on the AUG start codon in mouse liver. Enrichment is calculated as the number of peaks in the window divided by window size (nucleotides). g, h, Metagene profiles of m1A peak distribution in a non-normalized window extending downstream from the TSS (g) and centred on the stop codon (h) in the indicated mouse cell types. i, The mean number of alternative TISs in methylated (m1A) versus all other (unmethylated) genes in MEF cells. Mean values ± s.e.m. are shown; P value is indicated, Mann–Whitney U test. j, The percentage of genes with upstream (=5′ UTR) and downstream (=CDS) m1A sites out of all genes that have either downstream or upstream alternative TISs, compared to the expected percentage in MEF cells. P value is indicated, χ2 test. k, l, Scatter plots showing the correlation between the locations (log2) of upstream TISs (uTIS) and 5′ UTR m1A peaks relative to the canonical AUG start codon (0) in mouse liver (k) and MEF (l) cells. r and P values are indicated, _t_-test. m, Metagene profiles of mouse m1A peak distribution in a non-normalized window centred on the AUG codon. Peaks are sorted by the exon containing the AUG codon in that gene.
Extended Data Figure 7. Features of the mouse m1A methylome (part 2).

a, Mouse m1A peaks have a significantly higher GC content compared to negative peaks. Box limits represent 25th percentile, median and 75th percentile, whiskers represent 2.5 and 97.5 percentiles, and dots indicate outliers. P =4.4 ×10 −175, _t_-test. b, Motifs identified in 400-nucleotide windows centred on the canonical AUG start codon in genes with m1A peaks in this window in mouse liver. c, d, GC content (c) and MFEden (d) of 5′ UTRs of methylated (m1A), unmethylated (Non-m1A) and all genes. Box limits represent 25th percentile, median and 75th percentile, whiskers represent 2.5 and 97.5 percentiles. P values are indicted, _t_-test. e, f, A sliding window profile of mean GC content (e) and mean ΔG (f) in a 300-nucleotide window centred on the canonical AUG start codon in methylated (m1A) genes compared to all other genes in mouse liver. P values are indicated, Kolmogorov–Smirnov test and _t_-test. g, Representative plots of human-mouse orthologous genes with conserved m1A peaks. Plot format as in Fig. 2a.
Extended Data Figure 8. The yeast m1A methylome.

a, m1A-seq identifies the known m1A sites (645 and 2142) in S. cerevisiae 25S rRNA. A drop in sequence read coverage (indicated by purple dots) occurs around the methylated positions (indicated by dashed lines). b, Representative plots of methylated transcripts in S. cerevisiae. Plot format as in Fig. 2a. c, The percentage of methylated genes that carry 1, 2 or 3 m1A peaks per gene in S. cerevisiae. Out of 843 m1A peaks (FC ≥4, FDR ≤ 5%) in 778 genes, most (88.6%) are methylated only once. Unlike in mammals, m1A is distributed across the coding transcriptome without an apparent preferred location. d, m1A-seq identified the known m1A sites (670 and 2230) in S. pombe 25S rRNA. A drop in sequence read coverage (indicated by purple dots) occurs around the methylated positions (indicated by dashed lines). e, Representative plot of a methylated transcript in S. pombe. Plot format as in Fig. 2a. f, Pie charts presenting the fraction of m1A peaks in each of three non-overlapping transcript segments (5′ UTR, CDS and 3′ UTR) in S. pombe Sp1 strain under the indicated conditions. Under vegetative growth, we identified 706 m1A peaks (FC ≥4, FDR ≤ 5%) in 619 gene transcripts, most of which (90.4%) distributed along the CDS. Four hours after transfer to a nitrogen-source deficient ‘sporulation’ medium, 157 out of the vegetative state m1A peaks were no longer detected, and 297 new peaks appeared. Importantly, transcripts that harbour differential peaks were adequately expressed (above the 1st quartile) in both conditions. g, The percentage of methylated genes that carry 1, 2, or 3 +m 1 A peaks per gene in S. pombe Sp1 strain under the indicated conditions. h, Venn diagram representing differential and shared m1A peaks in S. pombe Sp1 strain under the indicated conditions. i, Representative plots of a differentially methylated transcript in S. pombe Sp1 strain under the indicated conditions. Yellow box, conserved peak; green box, differential peak.
Extended Data Figure 9. m1A in mRNA is a dynamic modification.

a, b, LC-MS/MS quantification of m1A in mRNA of untreated and amino acid (AA)-starved (a) or serum-starved (b) HepG2. Mean values ± s.e.m. are shown, n = 3, *P ≤ 0.05, ***P ≤ 0.001, unpaired _t_-test. c, d, Representative plots of differentially methylated transcripts in untreated and glucose-starved (c) or heat shock-treated (d) HepG2 cells. Plot formats as in Fig. 2a. e, LC-MS/MS quantification of m1A in mRNA of 293F cells overexpressing WT FLAG-ALKBH3 or an inactive mutant (D193A), presented as percentage of unmodified A. Mean values ±s.e.m. are shown, n = 3, *P ≤ 0.05, NS, P > 0.05, one-way ANOVA with Dunnet’s multiple comparison test.
Extended Data Figure 10. m1A around the start codon correlates with higher translation efficiency (TE).

a, Cumulative distribution of log2(TE) in genes methylated in a 300-nucleotide window centred on the start codon compared to all other genes, in the indicated human and mouse cell types. P values (_t_-test) and fold-changes (FC) of median TE values (Start m1A genes/All the rest) are indicated. b, Genes methylated in a 300-nucleotide window centred on the AUG start codon have a higher ribosome release score (RRS = TE[CDS]/TE[3 ′ UTR]) compared to all other genes in the indicated cell types. RRSs, which are ‘normalized’ to ribosomal drop-off in the 3′ UTR, are in line with TE scores. P values (Mann–Whitney U test) and fold-changes (FC) of median RRS values (Start m1A genes/All the rest) are indicated. c, Genes methylated in different start codon window sizes have higher TE compared to all other genes, in HeLa cells. When considering all m1A genes, including those methylated outside the start codon window, the effect is reduced. P values (_t_-test) and fold-changes (FC) of median TE values (Start m1A genes/All the rest) are indicated. Box limits represent 25th percentile, median and 75th percentile; whiskers extend from the limit to the highest and lowest value within 1.5 IQR (interquartile range).
Supplementary Material
1
Acknowledgments
The work was supported by the National Institutes of Health HG008688 and GM71440 grants to C.H., GM113194 grant to T.P. and C.H. and grants from the Flight Attendant Medical Research Institute (FAMRI), Israel Science Foundation (ISF grant no. 1667/12), Israeli Centers of Excellence (I-CORE) Program (ISF grants no. 41/11 and no. 1796/12), Ernest and Bonnie Beutler Research Program and Kahn Family Foundation to G.R. A part of this work was funded by the Chicago Biomedical Consortium with support from the Searle Funds at The Chicago Community Trust (to D.D. and C.H.). C.H. is an investigator of the Howard Hughes Medical Institute (HHMI). G.R. is a member of the Sagol Neuroscience Network and holds the Djerassi Chair for Oncology at the Sackler Faculty of Medicine, Tel-Aviv University, Israel. D.D. is supported by a Human Frontier Science Program (HFSP) long-term fellowship. S.N. is an HHMI Fellow of the Damon Runyon Cancer Research Foundation (DRG-2215-15), previously supported by a Yen post-doctoral fellowship in interdisciplinary research. Q.D. is supported by the National Institutes of Health grant HG006699. We wish to thank S. Farage-Barhom, K. Cesarkas and E. Glick-Saar for help with deep sequencing.
Footnotes
Online Content Methods, along with any additional Extended Data display items and Source Data, are available in the online version of the paper; references unique to these sections appear only in the online paper.
Supplementary Information is available in the online version of the paper.
Author Contributions D.D. and C.H. conceived the idea. D.D. designed the experiments and analyses, and developed the method. D.D., S.N., and S.M.-M. performed experiments. A.D.S. performed PARS structural mapping. V.H., Q.D., and G.Z. helped with experiments. Q.D. synthesized deuterated standards. D.D., S.M.-M., S.N., M.S.B.-H., E.P., N.K., M.S.-D., O.S., E.E., W.C.C. and D.H. performed analyses and interpreted findings. D.D., S.M.-M., S.N. and C.H. wrote the manuscript with input from M.S.B.-H., E.P., L.C.D., W.C.C., G.Z., T.P., N.A. and G.R.
Data have been deposited in the NCBI Gene Expression Omnibus (GEO) and are accessible through GEO series accession number GSE70485.
The authors declare no competing financial interests.
Readers are welcome to comment on the online version of the paper.
References
- 1.Dominissini D, et al. Topology of the human and mouse m6A RNA methylomes revealed by m6A-seq. Nature. 2012;485:201–206. doi: 10.1038/nature11112. [DOI] [PubMed] [Google Scholar]
- 2.Meyer KD, et al. Comprehensive analysis of mRNA methylation reveals enrichment in 3′ UTRs and near stop codons. Cell. 2012;149:1635–1646. doi: 10.1016/j.cell.2012.05.003. [DOI] [PMC free article] [PubMed] [Google Scholar]
- 3.Carlile TM, et al. Pseudouridine profiling reveals regulated mRNA pseudouridylation in yeast and human cells. Nature. 2014;515:143–146. doi: 10.1038/nature13802. [DOI] [PMC free article] [PubMed] [Google Scholar]
- 4.Schwartz S, et al. Transcriptome-wide mapping reveals widespread dynamic-regulated pseudouridylation of ncRNA and mRNA. Cell. 2014;159:148–162. doi: 10.1016/j.cell.2014.08.028. [DOI] [PMC free article] [PubMed] [Google Scholar]
- 5.Li X, et al. Chemical pulldown reveals dynamic pseudouridylation of the mammalian transcriptome. Nature Chem Biol. 2015;11:592–597. doi: 10.1038/nchembio.1836. [DOI] [PubMed] [Google Scholar]
- 6.Squires JE, et al. Widespread occurrence of 5-methylcytosine in human coding and non-coding RNA. Nucleic Acids Res. 2012;40:5023–5033. doi: 10.1093/nar/gks144. [DOI] [PMC free article] [PubMed] [Google Scholar]
- 7.Khoddami V, Cairns BR. Identification of direct targets and modified bases of RNA cytosine methyltransferases. Nature Biotechnol. 2013;31:458–464. doi: 10.1038/nbt.2566. [DOI] [PMC free article] [PubMed] [Google Scholar]
- 8.Fu Y, Dominissini D, Rechavi G, He C. Gene expression regulation mediated through reversible m6A RNA methylation. Nature Rev Genet. 2014;15:293–306. doi: 10.1038/nrg3724. [DOI] [PubMed] [Google Scholar]
- 9.Li S, Mason CE. The pivotal regulatory landscape of RNA modifications. Annu Rev Genomics Hum Genet. 2014;15:127–150. doi: 10.1146/annurev-genom-090413-025405. [DOI] [PubMed] [Google Scholar]
- 10.Machnicka MA, et al. MODOMICS: a database of RNA modification pathways—2013 update. Nucleic Acids Res. 2013;41:D262–D267. doi: 10.1093/nar/gks1007. [DOI] [PMC free article] [PubMed] [Google Scholar]
- 11.Dunn DB. The occurrence of 1-methyladenine in ribonucleic acid. Biochim Biophys Acta. 1961;46:198–200. doi: 10.1016/0006-3002(61)90668-0. [DOI] [PubMed] [Google Scholar]
- 12.Hall RH. Method for isolation of 2′-O-methylribonucleotides and N1-methyladenosine from ribonucleic acid. Biochim Biophys Acta. 1963;68:278–283. [Google Scholar]
- 13.El Yacoubi B, Bailly M, de Crécy-Lagard V. Biosynthesis and function of posttranscriptional modifications of transfer RNAs. Annu Rev Genet. 2012;46:69–95. doi: 10.1146/annurev-genet-110711-155641. [DOI] [PubMed] [Google Scholar]
- 14.Sharma S, Watzinger P, Kötter P, Entian KD. Identification of a novel methyltransferase, Bmt2, responsible for the N-1-methyl-adenosine base modification of 25S rRNA in Saccharomyces cerevisiae. Nucleic Acids Res. 2013;41:5428–5443. doi: 10.1093/nar/gkt195. [DOI] [PMC free article] [PubMed] [Google Scholar]
- 15.Anderson JT, Droogmans L. In: Fine-Tuning of RNA Functions by Modification and Editing. Grosjean H, editor. Vol. 12. 2005. pp. 121–139. [Google Scholar]
- 16.Macon JB, Wolfenden R. 1-Methyladenosine. Dimroth rearrangement and reversible reduction. Biochemistry. 1968;7:3453–3458. doi: 10.1021/bi00850a021. [DOI] [PubMed] [Google Scholar]
- 17.Desrosiers R, Friderici K, Rottman F. Identification of methylated nucleosides in messenger RNA from Novikoff hepatoma cells. Proc Natl Acad Sci USA. 1974;71:3971–3975. doi: 10.1073/pnas.71.10.3971. [DOI] [PMC free article] [PubMed] [Google Scholar]
- 18.Zhang Y, et al. Model-based analysis of ChIP-Seq (MACS) Genome Biol. 2008;9:R137. doi: 10.1186/gb-2008-9-9-r137. [DOI] [PMC free article] [PubMed] [Google Scholar]
- 19.Ingolia NT, Lareau LF, Weissman JS. Ribosome profiling of mouse embryonic stem cells reveals the complexity and dynamics of mammalian proteomes. Cell. 2011;147:789–802. doi: 10.1016/j.cell.2011.10.002. [DOI] [PMC free article] [PubMed] [Google Scholar]
- 20.Lee S, et al. Global mapping of translation initiation sites in mammalian cells at single-nucleotide resolution. Proc Natl Acad Sci USA. 2012;109:E2424–E2432. doi: 10.1073/pnas.1207846109. [DOI] [PMC free article] [PubMed] [Google Scholar]
- 21.Gao X, et al. Quantitative profiling of initiating ribosomes in vivo. Nature Methods. 2015;12:147–153. doi: 10.1038/nmeth.3208. [DOI] [PMC free article] [PubMed] [Google Scholar]
- 22.Takuma H, et al. Substrate tRNA recognition mechanism of eubacterial tRNA (m1A58) methyltransferase (TrmI) J Biol Chem. 2015;290:5912–5925. doi: 10.1074/jbc.M114.606038. [DOI] [PMC free article] [PubMed] [Google Scholar]
- 23.Ozanick S, Krecic A, Andersland J, Anderson JT. The bipartite structure of the tRNA m1A58 methyltransferase from S. cerevisiae is conserved in humans. RNA. 2005;11:1281–1290. doi: 10.1261/rna.5040605. [DOI] [PMC free article] [PubMed] [Google Scholar]
- 24.Kozak M. Regulation of translation via mRNA structure in prokaryotes and eukaryotes. Gene. 2005;361:13–37. doi: 10.1016/j.gene.2005.06.037. [DOI] [PubMed] [Google Scholar]
- 25.Clancy MJ, Shambaugh ME, Timpte CS, Bokar JA. Induction of sporulation in Saccharomyces cerevisiae leads to the formation of N6-methyladenosine in mRNA: a potential mechanism for the activity of the IME4 gene. Nucleic Acids Res. 2002;30:4509–4518. doi: 10.1093/nar/gkf573. [DOI] [PMC free article] [PubMed] [Google Scholar]
- 26.Schwartz S, et al. High-resolution mapping reveals a conserved, widespread, dynamic mRNA methylation program in yeast meiosis. Cell. 2013;155:1409–1421. doi: 10.1016/j.cell.2013.10.047. [DOI] [PMC free article] [PubMed] [Google Scholar]
- 27.Peifer C, et al. Yeast Rrp8p, a novel methyltransferase responsible for m1A 645 base modification of 25S rRNA. Nucleic Acids Res. 2013;41:1151–1163. doi: 10.1093/nar/gks1102. [DOI] [PMC free article] [PubMed] [Google Scholar]
- 28.Jia G, et al. N6-methyladenosine in nuclear RNA is a major substrate of the obesity-associated FTO. Nature Chem Biol. 2011;7:885–887. doi: 10.1038/nchembio.687. [DOI] [PMC free article] [PubMed] [Google Scholar]
- 29.Aas PA, et al. Human and bacterial oxidative demethylases repair alkylation damage in both RNA and DNA. Nature. 2003;421:859–863. doi: 10.1038/nature01363. [DOI] [PubMed] [Google Scholar]
- 30.Ougland R, et al. AlkB restores the biological function of mRNA and tRNA inactivated by chemical methylation. Mol Cell. 2004;16:107–116. doi: 10.1016/j.molcel.2004.09.002. [DOI] [PubMed] [Google Scholar]
- 31.Zur H, Tuller T. New universal rules of eukaryotic translation initiation fidelity. PLOS Comput Biol. 2013;9:e1003136. doi: 10.1371/journal.pcbi.1003136. [DOI] [PMC free article] [PubMed] [Google Scholar]
- 32.Parsyan A, et al. mRNA helicases: the tacticians of translational control. Nature Rev Mol Cell Biol. 2011;12:235–245. doi: 10.1038/nrm3083. [DOI] [PubMed] [Google Scholar]
- 33.Helm M, Giegé R, Florentz C. A Watson-Crick base-pair-disrupting methyl group (m1A9) is sufficient for cloverleaf folding of human mitochondrial tRNALys. Biochemistry. 1999;38:13338–13346. doi: 10.1021/bi991061g. [DOI] [PubMed] [Google Scholar]
- 34.Guttman M, Russell P, Ingolia NT, Weissman JS, Lander ES. Ribosome profiling provides evidence that large noncoding RNAs do not encode proteins. Cell. 2013;154:240–251. doi: 10.1016/j.cell.2013.06.009. [DOI] [PMC free article] [PubMed] [Google Scholar]
- 35.Lu L, Yi C, Jian X, Zheng G, He C. Structure determination of DNA methylation lesions N1-meA and N3-meC in duplex DNA using a cross-linked protein-DNA system. Nucleic Acids Res. 2010;38:4415–4425. doi: 10.1093/nar/gkq129. [DOI] [PMC free article] [PubMed] [Google Scholar]
- 36.He C, et al. A methylation-dependent electrostatic switch controls DNA repair and transcriptional activation by E. coli Ada. Mol Cell. 2005;20:117–129. doi: 10.1016/j.molcel.2005.08.013. [DOI] [PubMed] [Google Scholar]
- 37.Harcourt EM, Ehrenschwender T, Batista PJ, Chang HY, Kool ET. Identification of a selective polymerase enables detection of N6-methyladenosine in RNA. J Am Chem Soc. 2013;135:19079–19082. doi: 10.1021/ja4105792. [DOI] [PMC free article] [PubMed] [Google Scholar]
- 38.Sonenberg N, Hinnebusch AG. Regulation of translation initiation in eukaryotes: mechanisms and biological targets. Cell. 2009;136:731–745. doi: 10.1016/j.cell.2009.01.042. [DOI] [PMC free article] [PubMed] [Google Scholar]
- 39.Wang X, et al. N6-methyladenosine modulates messenger RNA translation efficiency. Cell. 2015;161:1388–1399. doi: 10.1016/j.cell.2015.05.014. [DOI] [PMC free article] [PubMed] [Google Scholar]
- 40.Kierzek E, Kierzek R. The thermodynamic stability of RNA duplexes and hairpins containing N6-alkyladenosines and 2-methylthio-N6-alkyladenosines. Nucleic Acids Res. 2003;31:4472–4480. doi: 10.1093/nar/gkg633. [DOI] [PMC free article] [PubMed] [Google Scholar]
- 41.Roost C, et al. Structure and thermodynamics of N6-methyladenosine in RNA: a spring-loaded base modification. J Am Chem Soc. 2015;137:2107–2115. doi: 10.1021/ja513080v. [DOI] [PMC free article] [PubMed] [Google Scholar]
- 42.Li X, et al. Transcriptome-wide mapping reveals reversible and dynamic N1-methyladenosine methylome. Nat Chem Biol. 2016 doi: 10.1038/nchembio.2040. http://dx.doi.org/10.1038/nchembio.2040. [DOI] [PubMed]
- 43.Geula S, et al. m6A mRNA methylation facilitates resolution of naïve pluripotency toward differentiation. Science. 2015;347:1002–1006. doi: 10.1126/science.1261417. [DOI] [PubMed] [Google Scholar]
- 44.Wang X, et al. N6-methyladenosine-dependent regulation of messenger RNA stability. Nature. 2014;505:117–120. doi: 10.1038/nature12730. [DOI] [PMC free article] [PubMed] [Google Scholar]
- 45.Hienzsch A, Deiml C, Reiter V, Carell T. Total synthesis of the hypermodified RNA bases wybutosine and hydroxywybutosine and their quantification together with other modified RNA bases in plant materials. Chemistry. 2013;19:4244–4248. doi: 10.1002/chem.201204209. [DOI] [PubMed] [Google Scholar]
- 46.Pearson D, et al. LC-MS based quantification of 2′-ribosylated nucleosides Ar(p) and Gr(p) in tRNA. Chem Commun (Camb ) 2011;47:5196–5198. doi: 10.1039/c1cc11011j. [DOI] [PubMed] [Google Scholar]
- 47.Hauenschild R, et al. The reverse transcription signature of N-1-methyladenosine in RNA-Seq is sequence dependent. Nucleic Acids Res. 2015;43:9950–9964. doi: 10.1093/nar/gkv895. [DOI] [PMC free article] [PubMed] [Google Scholar]
- 48.Jones JW, Robins RK. Purine Nucleosides. III. Methylation studies of certain naturally occurring purine nucleosides. J Am Chem Soc. 1963;85:193–201. [Google Scholar]
- 49.Dai Q, et al. Identification of recognition residues for ligation-based detection and quantitation of pseudouridine and N6-methyladenosine. Nucleic Acids Res. 2007;35:6322–6329. doi: 10.1093/nar/gkm657. [DOI] [PMC free article] [PubMed] [Google Scholar]
- 50.Hobartner C, et al. The synthesis of 2′-O-[(triisopropylsilyl)oxy] methyl (TOM) phosphoramidites of methylated ribonucleosides (m1G, m2G, m22G, m1I, m3U, m4C, m6A, m26A) for use in automated RNA solid-phase synthesis. Monatsh Chem. 2003;134:851–873. [Google Scholar]
- 51.Dominissini D, Moshitch-Moshkovitz S, Salmon-Divon M, Amariglio N, Rechavi G. Transcriptome-wide mapping of N6-methyladenosine by m6A-seq based on immunocapturing and massively parallel sequencing. Nature Protocols. 2013;8:176–189. doi: 10.1038/nprot.2012.148. [DOI] [PubMed] [Google Scholar]
- 52.Langmead B, Salzberg SL. Fast gapped-read alignment with Bowtie 2. Nature Methods. 2012;9:357–359. doi: 10.1038/nmeth.1923. [DOI] [PMC free article] [PubMed] [Google Scholar]
- 53.Li H, et al. The Sequence Alignment/Map format and SAMtools. Bioinformatics. 2009;25:2078–2079. doi: 10.1093/bioinformatics/btp352. [DOI] [PMC free article] [PubMed] [Google Scholar]
- 54.Anders S, Pyl PT, Huber W. HTSeq—a Python framework to work with high-throughput sequencing data. Bioinformatics. 2015;31:166–169. doi: 10.1093/bioinformatics/btu638. [DOI] [PMC free article] [PubMed] [Google Scholar]
- 55.Robinson MD, McCarthy DJ, Smyth GK. edgeR: a Bioconductor package for differential expression analysis of digital gene expression data. Bioinformatics. 2010;26:139–140. doi: 10.1093/bioinformatics/btp616. [DOI] [PMC free article] [PubMed] [Google Scholar]
- 56.Trapnell C, et al. Transcript assembly and quantification by RNA-Seq reveals unannotated transcripts and isoform switching during cell differentiation. Nature Biotechnol. 2010;28:511–515. doi: 10.1038/nbt.1621. [DOI] [PMC free article] [PubMed] [Google Scholar]
- 57.Martin M. Cutadapt removes adapter sequences from high-throughput sequencing reads. EMBnet journal. 2011;17:10–12. [Google Scholar]
- 58.Kim D, et al. TopHat2: accurate alignment of transcriptomes in the presence of insertions, deletions and gene fusions. Genome Biol. 2013;14:R36. doi: 10.1186/gb-2013-14-4-r36. [DOI] [PMC free article] [PubMed] [Google Scholar]
- 59.Salmon-Divon M, Dvinge H, Tammoja K, Bertone P. PeakAnalyzer: genome-wide annotation of chromatin binding and modification loci. BMC Bioinformatics. 2010;11:415. doi: 10.1186/1471-2105-11-415. [DOI] [PMC free article] [PubMed] [Google Scholar]
- 60.Quinlan AR, Hall IM. BEDTools: a flexible suite of utilities for comparing genomic features. Bioinformatics. 2010;26:841–842. doi: 10.1093/bioinformatics/btq033. [DOI] [PMC free article] [PubMed] [Google Scholar]
- 61.Lorenz R, et al. ViennaRNA Package 2.0. Algorithms Mol Biol. 2011;6:26. doi: 10.1186/1748-7188-6-26. [DOI] [PMC free article] [PubMed] [Google Scholar]
- 62.Trotta E. On the normalization of the minimum free energy of RNAs by sequence length. PLoS One. 2014;9:e113380. doi: 10.1371/journal.pone.0113380. [DOI] [PMC free article] [PubMed] [Google Scholar]
- 63.Wan Y, Qu K, Ouyang Z, Chang HY. Genome-wide mapping of RNA structure using nuclease digestion and high-throughput sequencing. Nature Protocols. 2013;8:849–869. doi: 10.1038/nprot.2013.045. [DOI] [PubMed] [Google Scholar]
- 64.Kertesz M, et al. Genome-wide measurement of RNA secondary structure in yeast. Nature. 2010;467:103–107. doi: 10.1038/nature09322. [DOI] [PMC free article] [PubMed] [Google Scholar]
- 65.Heinz S, et al. Simple combinations of lineage-determining transcription factors prime cis-regulatory elements required for macrophage and B cell identities. Mol Cell. 2010;38:576–589. doi: 10.1016/j.molcel.2010.05.004. [DOI] [PMC free article] [PubMed] [Google Scholar]
- 66.Bailey TL, Elkan C. Fitting a mixture model by expectation maximization to discover motifs in biopolymers. Proc Int Conf Intell Syst Mol Biol. 1994;2:28–36. [PubMed] [Google Scholar]
- 67.Crooks GE, Hon G, Chandonia JM, Brenner SE. WebLogo: a sequence logo generator. Genome Res. 2004;14:1188–1190. doi: 10.1101/gr.849004. [DOI] [PMC free article] [PubMed] [Google Scholar]
- 68.Linder B, et al. Single-nucleotide-resolution mapping of m6A and m6Am throughout the transcriptome. Nature Methods. 2015;12:767–772. doi: 10.1038/nmeth.3453. [DOI] [PMC free article] [PubMed] [Google Scholar]
- 69.Hinrichs AS, et al. The UCSC Genome Browser Database: update 2006. Nucleic Acids Res. 2006;34:D590–D598. doi: 10.1093/nar/gkj144. [DOI] [PMC free article] [PubMed] [Google Scholar]
- 70.Geiger T, Wehner A, Schaab C, Cox J, Mann M. Comparative proteomic analysis of eleven common cell lines reveals ubiquitous but varying expression of most proteins. Mol Cell Proteomics. 2012 doi: 10.1074/mcp.M111.014050. http://dx.doi.org/10.1074/mcp.M111.014050. [DOI] [PMC free article] [PubMed]
- 71.Graumann J, et al. Stable isotope labeling by amino acids in cell culture (SILAC) and proteome quantitation of mouse embryonic stem cells to a depth of 5,111 proteins. Mol Cell Proteomics. 2008;7:672–683. doi: 10.1074/mcp.M700460-MCP200. [DOI] [PubMed] [Google Scholar]
- 72.Schwanhäusser B, et al. Global quantification of mammalian gene expression control. Nature. 2011;473:337–342. doi: 10.1038/nature10098. [DOI] [PubMed] [Google Scholar]
- 73.Li JJ, Bickel PJ, Biggin MD. System wide analyses have underestimated protein abundances and the importance of transcription in mammals. PeerJ. 2014;2:e270. doi: 10.7717/peerj.270. [DOI] [PMC free article] [PubMed] [Google Scholar]
- 74.Noderer WL, et al. Quantitative analysis of mammalian translation initiation sites by FACS-seq. Mol Syst Biol. 2014;10:748. doi: 10.15252/msb.20145136. [DOI] [PMC free article] [PubMed] [Google Scholar]
- 75.Huppert JL, Bugaut A, Kumari S, Balasubramanian S. G-quadruplexes: the beginning and end of UTRs. Nucleic Acids Res. 2008;36:6260–6268. doi: 10.1093/nar/gkn511. [DOI] [PMC free article] [PubMed] [Google Scholar]
- 76.Beaudoin JD, Perreault JP. 5′-UTR G-quadruplex structures acting as translational repressors. Nucleic Acids Res. 2010;38:7022–7036. doi: 10.1093/nar/gkq557. [DOI] [PMC free article] [PubMed] [Google Scholar]
- 77.Lewis BP, Burge CB, Bartel DP. Conserved seed pairing, often flanked by adenosines, indicates that thousands of human genes are microRNA targets. Cell. 2005;120:15–20. doi: 10.1016/j.cell.2004.12.035. [DOI] [PubMed] [Google Scholar]
Associated Data
This section collects any data citations, data availability statements, or supplementary materials included in this article.
Supplementary Materials
1