Metabolic Maintenance of Cell Asymmetry following Division in Activated T Lymphocytes (original) (raw)
. Author manuscript; available in PMC: 2016 Oct 11.
Published in final edited form as: Nature. 2016 Apr 11;532(7599):389–393. doi: 10.1038/nature17442
Abstract
Asymmetric cell division (ACD)—the partitioning of cellular components in response to polarizing cues during mitosis—plays roles in differentiation and development1. ACD is important for the self-renewal of neuroblasts in C. elegans and fertilized zygotes in Drosophila, and participates in the development of mammalian nervous and digestive systems1. T lymphocytes, upon activation by antigen-presenting cells (APC), can undergo ACD, wherein the daughter cell proximal to the APC is more likely to differentiate into an effector-like T cell and the distal daughter more likely to differentiate into a memory-like T cell2. Upon activation and prior to cell division, expression of the transcription factor c-Myc drives metabolic reprogramming, necessary for the subsequent proliferative burst3. We found that during the first division of an activated T cell, c-Myc can sort asymmetrically. Asymmetric amino acid transporter distribution, amino acid content, and TORC1 function correlate with c-Myc expression, and both amino acids and TORC1 activity sustain the differences in c-Myc expression in one daughter over the other. Asymmetric c-Myc levels in daughter T cells affect proliferation, metabolism, and differentiation, and these effects are altered by experimental manipulation of TORC1 activity or Myc expression. Therefore, metabolic signaling pathways cooperate with transcription programs to maintain differential cell fates following asymmetric T cell division.
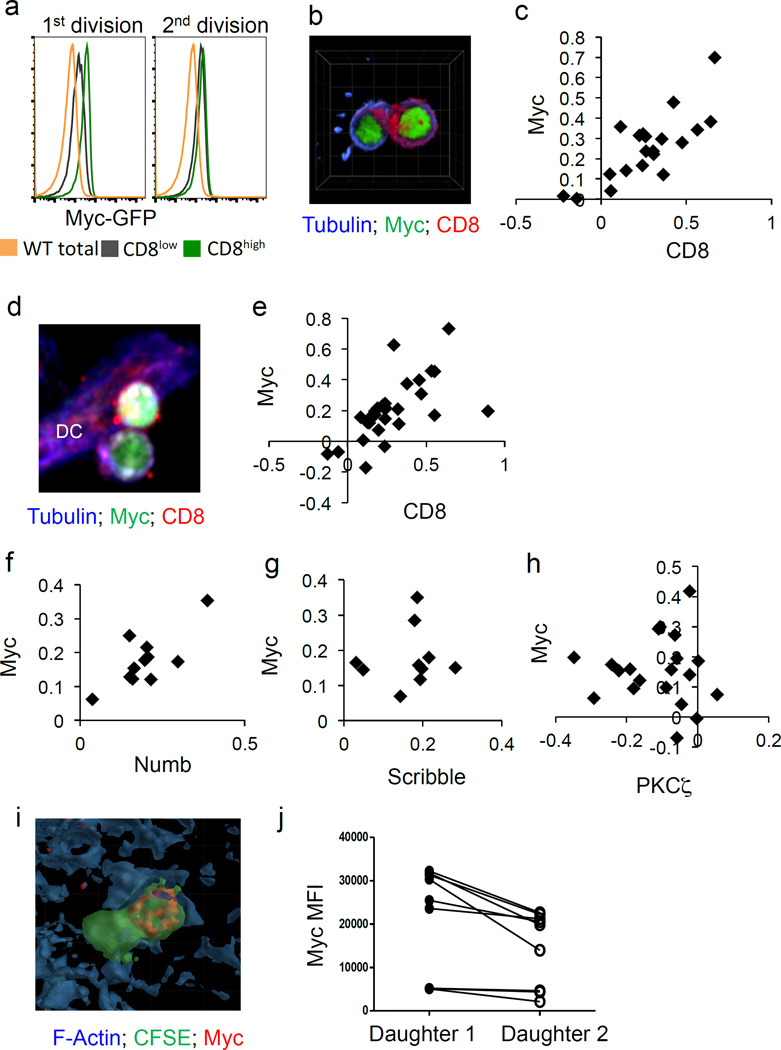
In order to visualize c-Myc levels in activated T cells, we isolated T cells from c-Myc-GFP fusion knock-in (c-Myc-GFP) mice4 and activated them in vitro with anti-CD3, anti-CD28, and ICAM2. As T cells completed the first division (indicated by dilution of cell trace violet), the c-Myc-GFP signal was brightest in cells that expressed higher levels of CD8, a marker of ACD2 (Fig. 1A and Ext. Fig. 1A). This difference between CD8high and CD8low cells dissipated in subsequent divisions, as did the difference in c-Myc (Fig. 1A and Ext. Fig. 1A). This asymmetric segregation of c-Myc was also assessed by confocal microscopy at 36 hours post activation. The largest numbers of first division T cells were recovered at this time point (Ext. Fig. 1B). Again, an asymmetric inheritance of c-Myc-GFP was consistently observed in daughter T cells that expressed higher levels of CD8 (Fig. 1B–C, Ext. Fig. 1C, and Supp. Videos 1–3).
Figure 1. C-Myc asymmetrically segregates to the proximal daughter in activated CD8 T lymphocytes.
(A) Mean fluorescent intensities (MFI) of c-Myc-GFP in negative (wt cells; gold histogram), CD8low (gray histogram), and CD8high (green histogram) cells in the first (left panel) and second (right panel) divisions. Representative of four independent experiments. (B) Representative image of conjoined daughter c-Myc-GFP CD8 T cells (antibody-coated plates) fixed and stained for beta tubulin (blue) and CD8 (red). (C) Quantification of asymmetry based on fluorescent intensities of CD8 (difference/total; x axis) and c-Myc-GFP (difference/total; y axis). 88.9% bright in same daughter (p=0.0004 Two-Tailed Binomial Test); r2=0.6159, p<0.0001 Linear Regression. Compiled from four independent experiments; each point represents a conjoined daughter pair. (D–E) Representative image and quantification of asymmetry of conjoined daughter OT-I cells co-cultured with BMDCs. 86.2% both bright in proximal daughter (_x_2=58.31, DF=3, p<0.0001 Chi-Square Goodness of Fit); r2=0.3939, p=0.0003; Linear Regression (F–H) Quantifications of asymmetry (difference/total) of ACD markers Numb 100% both bright in proximal daughter (_x_2=33, DF=3, p<0.0001 Chi-Square Goodness of Fit); r2=0.5738, p=0.0069 Linear Regression (F), Scribble 100% both bright in proximal daughter (_x_2=30, DF=3, p<0.0001 Chi-Square Goodness of Fit); r2=0.01436, p=0.7416; Linear Regression (G), and PKC zeta 85% PKC zeta bright in distal daughter, c-Myc bright in proximal daughter (_x_2=26.8, DF=3, p<0.0001 Chi-Square Goodness of Fit); r2=0.0009705, p=0.8963 Linear Regression (H). (I–J) Representative image and quantification of c-Myc fluorescence of dividing OT-I T cells in spleen sections of animals infected with Listeria-OVA, p=0.0077; Paired Student’s T. Compiled from two independent experiments
The first division of a T cell takes place on an APC, so we next determined whether c-Myc preferentially localizes to the proximal or distal daughter2. To this end, c-Myc-GFP, OT-I transgenic (OT-I Tg) T cells were activated with SIINFEKL-pulsed bone marrow-derived dendritic cells (BMDCs). By analyzing conjoined daughter cells via microscopy, we observed that c-Myc was asymmetrically inherited by the proximal, CD8high daughter cell (Fig. 1D–E; Supp. Videos 4–6; Ext. Fig. 1C). We then analyzed several markers of ACD1. As expected, Numb and Scribble were enriched in proximal daughters, along with c-Myc-GFP (Fig. 1 F–G), while PKCζ was enriched in distal daughters (Fig. 1H; Ext. Fig. 2).
When activated in vitro, c-Myc asymmetrically segregated in first division daughter cells in a substantial proportion of T cells (Ext. Fig. 1D). To determine whether this phenomenon also occurred in vivo, carboxyfluorescein succinimidyl ester (CFSE)-labeled OT-I T cells were transferred into congenic hosts. Recipients were then infected with _Listeria monocytogenes_-SIINFEKL. On day 3 post infection, confocal analysis of CFSE positive conjoined T cell pairs revealed that c-Myc staining was significantly higher in one T cell over the other; therefore the asymmetric assortment of c-Myc likely occurs in vivo in response to infection (Fig. 1I–J).
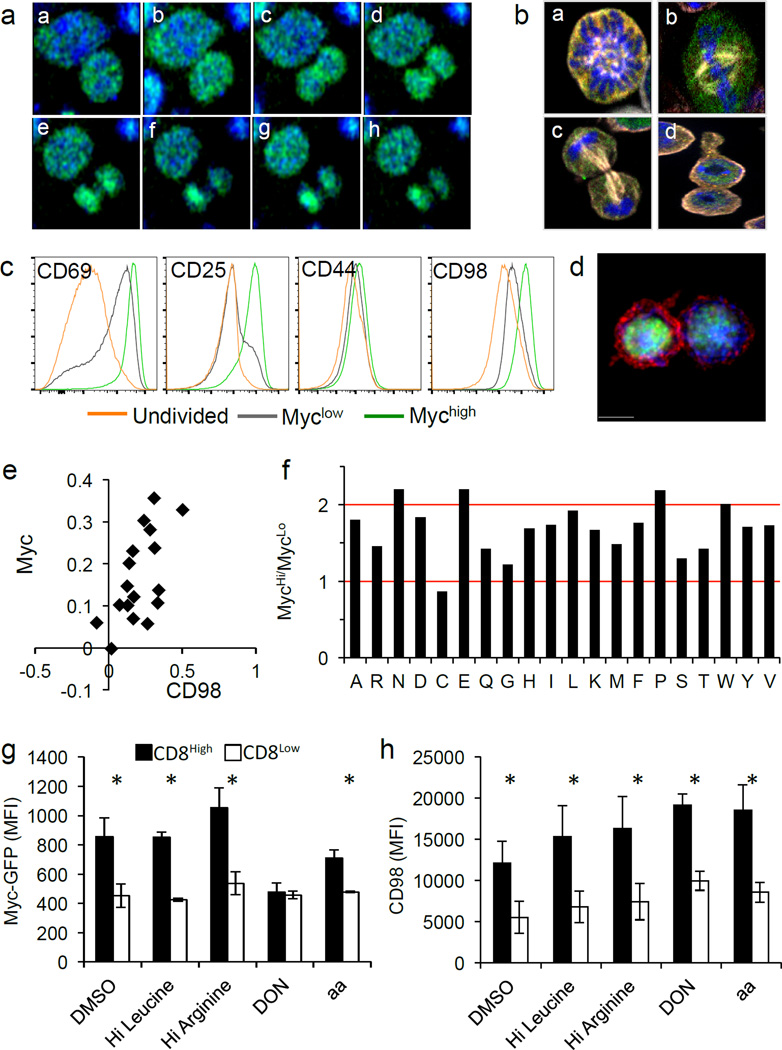
Real-time analysis of the GFP during mitosis revealed the signal was diffuse throughout the cell until after division. The signal then increased in one daughter cell, establishing an asymmetric distribution (Fig. 2A and Supp. Video 7). In fixed T cells, we observed the GFP signal was diffuse from prophase through anaphase, and only upon cytokinesis and re-formation of the nuclear envelope were c-Myc levels distinguishable in the daughter cells (Fig. 2B and Ext. Fig. 3). It is therefore likely that c-Myc is differentially regulated in the two daughters by asymmetrically inherited upstream signaling proteins, rather than itself being polarized.
Figure 2. Amino acid metabolism is necessary for the maintenance of c-Myc asymmetry in activated CD8 T cells.
(A) Time-lapse of dividing c-Myc-GFP OT-I cells co-cultured with BMDCs. 4 min. intervals (a–h). (B) Fixed T cells (antibody-coated plates) stained with Hoechst 33258 (blue) and anti-Beta Tubulin (white) to identify the stages of mitosis: prophase (a), metaphase (b), anaphase (c), telophase/cytokinesis (d). (C) MFI of indicated activation markers for activated, undivided T cells (gold) first division c-Myclow T cells (gray), or first division c-Mychigh T cells (green) (antibody-coated plates). Representative of four independent experiments. (D–E) Representative image and quantification of fluorescent intensity (difference/total) of CD98 (red) in T cells co-cultured with BMDCs. 88.2% both bright in proximal daughter (_x_2=36.41, DF=3, p<0.0001 Chi-Square Goodness of Fit); r2=0.3886, p=0.0075 Linear Regression (F) Ratio of amino acids in c-Mychigh versus c-Myclow first division CD8 T cells. Values normalized in terms of raw area counts. (G–H) MFI of c-Myc-GFP (G) or CD98 (H) in first division CD8high (shaded bars) and CD8low (open bars) (35 hours on antibody-coated plates) and indicated treatment for 45 minutes (amino acid starvation, four hours). Mean ± SD (n=3 mice/group). *p<0.05. Representative of two independent experiments.
To determine if differences in the levels of c-Myc following the first division are relevant to c-Myc function, we examined undivided and first-division T cells sorted into c-Mychigh and c-Myclow populations for expression of several metabolic genes that were previously found to be controlled by c-Myc3. We found similar differences in c-Myc-GFP influenced expression of most of these genes in both undivided and first-division cells (Ext. Fig. 4A–C). Therefore, the difference between c-Myclow and c-Mychigh upon ACD is relevant for expression of c-Myc target genes.
We assessed several activation markers on c-Mychigh and c-Myclow T cells before and after the first division. CD44 expression was comparable among all populations, and both c-Mychigh and c-Myclow populations exhibited increased expression of CD69 over undivided cells. While all activated cells also displayed increased CD25 and CD98, c-Mychigh T cells displayed elevated levels of both (Fig. 2C), as previously described for CD252. IL-2 can drive the expression of c-Myc5, but neither inhibition of IL-2 receptor signaling with janus kinase (JAK) inhibitors (Ext. Fig. 5A) nor increased IL-2 (Ext. Fig. 5B) influenced the asymmetric assortment of c-Myc in first-division T cells.
We then further examined the CD98 asymmetry. Microscopy confirmed that surface expression of CD98 was elevated on the proximal daughter T cell and correlated with c-Myc-GFP (Fig. 2D–E and Ext. Fig 5C–D). CD98 is a heterodimer composed of SLC3A2 and SLC7A5. Analyses of these components on undivided cells revealed that SLC3A2 protein is polarized to the region of the T cell near the contact site during activation, prior to cell division (Ext. Fig. 5E–F), which likely contributes to its asymmetry. Similarly, expression of the neutral amino acid transporter SLC1A5 was higher on c-Mychigh daughter T cells (Ext. Fig. 6A). In contrast, no difference in expression of the aspartate, glutamate transporter SLC1A3 was observed (Ext. Fig. 6B). Evaluation of metabolites revealed that levels of several but not all amino acids were at least 1.5× higher in first division c-Mychigh versus c-Myclow T cells (Fig. 2F). We therefore examined the effects of amino acid availability on the asymmetric expression of c-Myc. Although high leucine or glutamine had no effect on c-Myc expression in first division T cells, depletion of all amino acids greatly diminished c-Myc asymmetry (Fig. 2G). Asymmetric distribution of c-Myc-GFP was sensitive to transient inhibition of glutaminolysis by the glutamine analog DON (Fig. 2G). Expression levels of CD98 were unchanged in these conditions (Fig. 2H). Thus, amino acid availability as well as glutaminolysis appear to sustain high c-Myc levels following ACD.
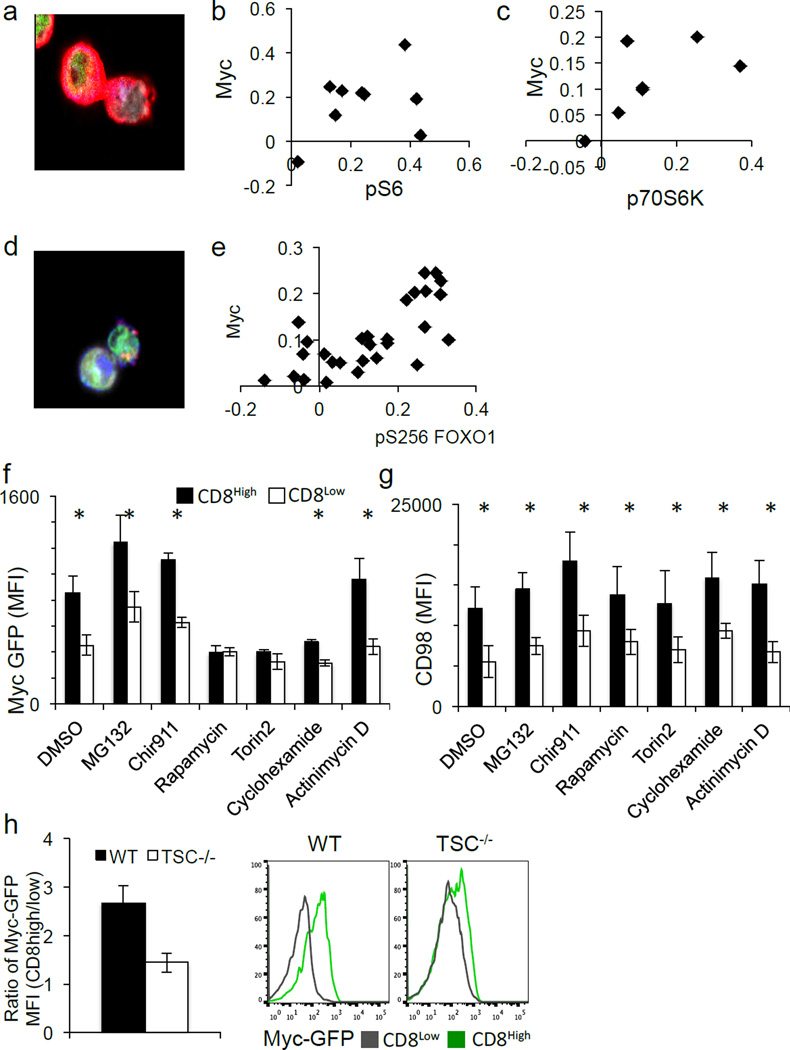
One consequence of amino acid availability is activation of the TORC1 complex, which glutaminolysis6,7 also activates. Both p-mTor distribution (Ext. Fig. 7A–B) and mTORC1 activity8, assessed by pS6 (Fig. 3A–B) or p70S6K (Fig. 3C), associated with c-Mychigh daughter T cells (Ext. Fig 8A–B). Reciprocally, inhibition of c-Myc expression by treatment with the inhibitor JQ1 resulted in reduced TORC1 signaling (Ext. Fig. 7C), indicating a positive feedback mechanism. Another indirect target, phosphorylated when mTORC1 is active, is the transcription factor FOXO19. FOXO1 is important for maintaining quiescence in T cells10 and negatively regulates c-Myc target genes in its non-phosphorylated form11. Phospho-FOXO1 also correlated with c-Myc-GFP (Fig. 3D–E) (Ext. Fig. 8E).
Figure 3. mTORC1 activity is required for the maintenance of c-Myc asymmetry in activated CD8 T cells.
(A–C) Representative image and quantification of asymmetry based on fluorescence intensity (difference/total) of pS6 (red) 88.9% both bright in proximal daughter (_x_2=19.89, DF=3, p=0.0002 Chi-Square Goodness of Fit); r2=0.1388, p=0.1388 Linear Regression (A–B) and p70S6K (red) 85.7% both bright in proximal daughter (_x_2=14.14, DF=3, p=0.0027 Chi-Square Goodness of Fit); r2=0.3526, p=0.1598 Linear Regression (C) in T cells co-cultured with BMDCs. (D–E) Representative image and quantification of asymmetry based on fluorescence intensity (difference/total) of pFOXO1 (pS256) (red) in CD8 T cells (antibody-coated plates). 75.8% both bright in same daughter (p=0.0081 Two-Tailed Binomial Test); r2=0.5153, p<0.0001 Linear Regression (F–G) MFI of first division c-Myc-GFP (F) or CD98 (G) in CD8high (shaded bars) and CD8low (open bars) after 35 hours activation on antibody-coated plates and the indicated agent for 45 minutes before flow cytometric analysis. *p<0.05 by Unpaired Student’s T test. (H) Cell-Trace Violet-labeled T cells from lymphoid tissues of CD4-Cre Negative- (WT) or CD4-Cre Positive- (TSC KO) TSCflox/flox animals 36 hrs following activation. The ratio of MFI of c-Myc-GFP in first division CD8high/CD8low T cells is plotted (left panel), and representative flow plots are depicted (right panel).
We then acutely inhibited TORC1 activity following the first division. Inhibition of TORC1 activity with either rapamycin or torin2 reduced c-Myc expression in CD8high T cells to that of CD8low cells (Fig. 3F) but did not influence CD98 asymmetry (Fig. 3G). To determine if elevation of TORC1 activity affects c-Myc asymmetry, CD4Cre, TSC1flox/flox mice, which exhibit hyperactive mTORC1 signaling12, were crossed to the c-Myc-GFP animals. Unlike those from wild type littermates, TSC1−/− CD8high and CD8low T cells in the first division were similarly high for c-Myc-GFP (Fig. 3H). Therefore, asymmetric TORC1 activity sustains the asymmetric assortment of c-Myc following T cell division.
Various signals determine when and how much c-Myc is expressed13. While phosphorylation of c-Myc by GSK3 promotes its proteasomal degradation14, GSK3 inhibition had no effect on c-Myc asymmetry (Figure 3F). Further, while acute inhibition of the proteasome with MG132 elevated c-Myc expression in both CD8high and CD8low daughter cells, asymmetry was unaffected. Strikingly, acute inhibition of translation by cyclohexamide attenuated c-Myc expression and asymmetry, while acute inhibition of transcription by actinomycin D had no effect (Fig. 3F). None of the short-term treatments tested had any effect on the expression or asymmetric distribution of CD98 (Fig. 3F). Therefore, it is likely that TORC1 activity regulates c-Myc levels at the level of translation, although a role for transcription over longer times could not be assessed. Consistently, we observed that mRNA for c-Myc and both components of CD98 (SLC3A2 and SLC7A5), and several other metabolic genes (which are c-Myc targets15) were enriched in first-division c-Mychigh T cells compared to c-Myclow T cells (Ext. Fig. 4A, C).
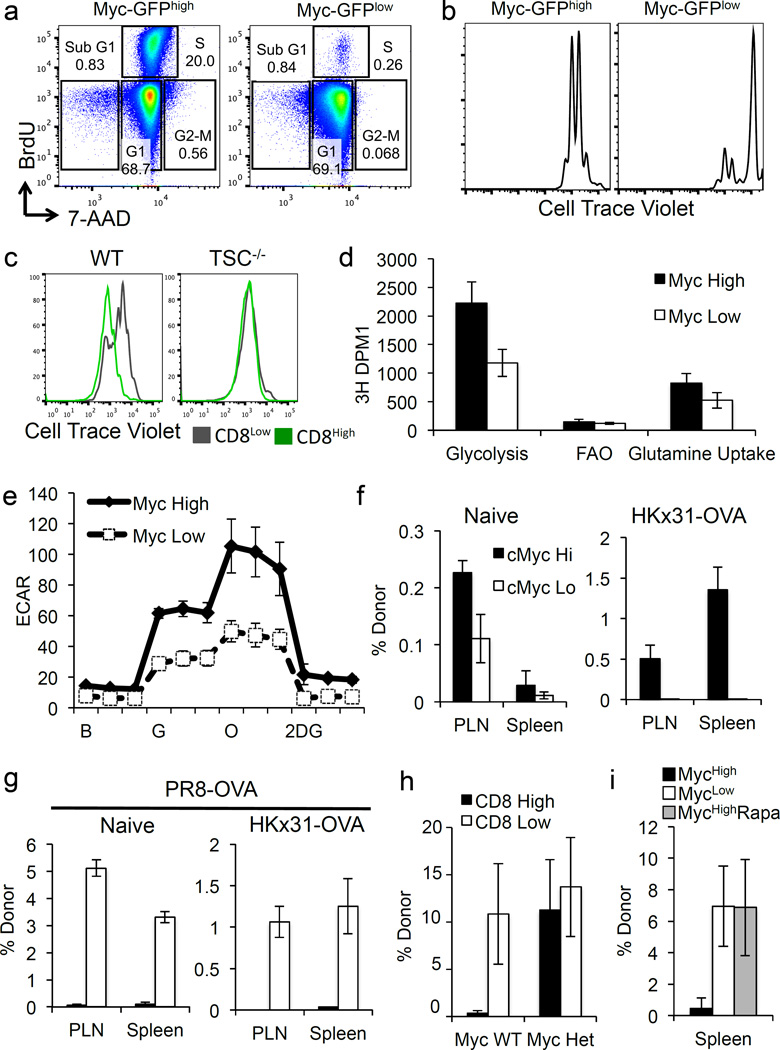
T cell proliferation depends on c-Myc8. We therefore examined if the relative differences in c-Myc levels in the first division influence subsequent proliferation. At 35 hours post-activation, cell trace violet-labeled, activated T cells were pulsed with BrdU for 1hr. The cell cycle status of c-Mychigh and c-Myclow T cells that had divided once was examined, and nearly ten times the frequencies of c-Mychigh T cells were cycling (S or G2/M phases) compared with c-Myclow T cells (Fig. 4A). Additionally, sorted c-Mychigh T cells proliferated much more rapidly than c-Myclow T cells (Fig. 4B, 4C) when placed back in culture for 48 hours. In contrast, sorted CD8high and CD8low first division TSC1-null T cells, which display similar c-Myc levels (Fig. 3H), showed equivalent proliferation (Fig. 4C).
Figure 4. T cell proliferation, metabolism, and fate are directed by differential expression of c-Myc protein.
(A) Representative flow plots for first division c-Myc-GFPhigh (left panel) and c-Myc-GFPlow (right panel) cells (antibody-coated plates + 1hr BrdU). (B) Cell Trace Violet dilution of antibody-activated, sorted first division c-Myc-GFPhigh and c-Myc-GFPlow T cells after culture for 38 more hours. (C) Populations in Figure 3H, sorted and cultured 48 more hrs; Cell Trace Violet dilutions of CD8high cells (green histograms) and CD8low cells (gray histograms) shown. (D) Sorted first division c-Myc-GFPhigh (shaded bars) and low (open bars) CD8 T cells were re-plated with [3-3H]-glucose, [9,10-3H]-palmitic acid, or [3H]-glutamine. Mean (± S.D.) D.P.M.I. of triplicates (n=3 mice/group). (E) ECAR of sorted first division c-Mychigh (shaded symbols) and c-Myclow (open symbols) T cells during exposure to indicated compounds. Mean ± S.D. for three replicates, pooled from two mice. Representative of three independent experiments (Ext. Data Fig. 10). (F–G) Frequency of donor cells two weeks post transfer of 5×10⁵ first division c-Myc-GFPhigh or low OT-I cells into naïve or infected recipients. (G). Frequencies of OT-I donor cells at 9d post challenge (PR8-SIINFEKL after 2 weeks rest), mean± S.D. (n=3 mice/group, representative of two independent experiments). (H) Frequencies of donor cells from either c-Myc WT (p=0.0059 Student’s T Test) or c-Myc+/− mice (p=0.4040 Student’s T Test) 9d after challenge (Mean ± S.D., n≥4 mice/group). (I) Frequencies of donor cells from recipients treated with PBS (p=0.0128 Student’s T Test) or rapamycin (p=0.9726 Student’s T Test) 9d after challenge (Mean ± S.D., n≥3 mice/group).
As c-Myc regulates metabolic reprogramming during T cell activation3, 16,17, we tested whether metabolic differences exist in first-division T cells expressing high or low levels of c-Myc. We found that c-Mychigh cells possessed diminished levels of glucose and glycolytic intermediates, but elevated levels of downstream metabolites (3-phosphoglycerate and phosphoenolpyruvate) and end products pyruvate and lactate, which may reflect enhanced glycolysis in c-Mychigh cells. Elevated levels of TCA cycle intermediates such as alpha-ketoglutarate, fumarate, and malate in c-Mychigh T cells may reflect enhanced glutaminolysis (Ext. Fig. 9). Additionally, pentose phosphate pathway (PPP) metabolites including 6-phosphogluconate and sedoheptulose 7-phosphate accumulated in Mychigh cells. We then examined the extracellular acidification rate (ECAR) in c-Mychigh and c-Myclow cells under conditions of glycolytic stress18, 19 and found that c-Mychigh T cells tended to be more glycolytic (Fig. 4E and Ext. Fig. 10A). Even during basal respiration with glucose, c-Mychigh T cells exhibited higher ECAR with no changes in oxygen consumption rate (OCR) (Ext. Fig. 10B). Similarly, metabolic flux assays tracking radiolabeled substrates revealed increased glycolysis and glutamine uptake in c-Mychigh T cells (Fig 4D). While it has been suggested that mitochondria sort asymmetrically20, we did not detect any differences in mitochondrial mass or DNA in Myclow versus Mychigh first-division T cells (Ext. Fig. 10C–D), but this does not exclude the possibility that “older” mitochondria may sort preferentially into one daughter20. However, we suggest that the differences in metabolism are the results of asymmetric distribution of amino acid transporters, TORC1 activity, and c-Myc.
We next explored functional consequences of the asymmetric distribution of c-Myc in vivo. First division T cells were sorted on c-Myc-GFP expression and transferred into separate, congenic recipients. Host mice were left naïve or infected with HKx31-SIINFEKL influenza. Two weeks later, a greater frequency of donor OT-I cells was recovered from the lymphoid organs of mice that had received c-Mychigh T cells (Fig. 4F). After another two weeks, recipient animals were challenged with a heterosubtypic virus (restricting responses to T cells) expressing SIINFEKL. Nine days later, an inverse pattern to pre-challenge results was observed, with increased frequencies of cells derived from the c-Myclow T cells (Fig. 4G). Thus, the asymmetric distribution of c-Myc in the first division was directly correlated with the eventual fate of these cells, with high levels of c-Myc conferring increased proliferation in the primary response and low levels of c-Myc conferring decreased proliferation in the primary response (but increased persistence and secondary response). Importantly, when T cells were WT or heterozygous for c-Myc (exhibiting reduced c-Myc expression), sorted CD8high and CD8low T cells from c-myc+/− T cells contributed equally well to the recall response, while WT CD8high T cells did not (Fig. 4H). In vivo inhibition of TORC1 in recipient animals with rapamycin also restored the ability of CD8high T cells to contribute to a secondary response (Fig. 4I), underscoring the relationship between TORC1 signaling and c-Myc expression in regulating cell fate. These findings corroborate studies that show distinct fates of T cell daughters that have undergone ACD, with the proximal and distal daughters displaying effector-like and memory-like gene expression and function21, but suggest that these fates remain amenable to regulation (e.g., of TORC1 or c-Myc). While the fates of asymmetrically divided T cells are distinct, we do not suggest this is necessarily the only source of memory T cell differentiation. Other studies have shown that memory cells have expressed proteins such as granzyme B and IFNγ22, 23,24, and are thus likely products of effector cells25, 26. Our data support a model in which T cells proceed through an activation phase, but asymmetric division results in a segregation of activating signals and amino acid transporters that result in divergent mTORC1 activity and c-Myc expression that ultimately make a daughter cell more or less likely to become terminally differentiated.
Our findings suggest that the interplay of amino acid transport and glutaminolysis, TORC1 activity, and c-Myc expression sustains the fates of T cells that have undergone ACD. C-Myc drives the expression of the amino acid transporters CD98 and SLC1A53, 27 and sustains TORC1 activity during early activation28. Conversely, amino acids and glutaminolysis sustain TORC1 activity, which sustains c-Myc translation7, 29, with possible effects on c-Myc through inhibition of FOXO111. During activation, some amino acid transporters sort asymmetrically, and a positive feedback arises, causing asymmetry in TORC1 activity and c-Myc expression, which is then sustained by c-Myc function (or lack thereof) in the daughters. Intriguingly, c-Myc was among the top candidates likely to drive divergence in gene expression between the daughters of first division in activated T cells21. Consistently, T cells lacking CD98 or treated with inhibitors of TORC130 display poor primary responses but generate memory T cells, while T cells lacking TSC1 (and elevated TORC1 activity)12 or lacking FOXO1, display robust primary responses but poor memory responses10. As c-Myc is also clearly consequential for oncogenesis, it is also possible that lymphomas of mature T cells might be influenced by ACD. A deeper understanding of asymmetric T cell division as it applies to TORC1 and c-Myc, may help illuminate these observations.
Methods
Animals
C-Myc-GFP fusion knock-in mice were generated and provided by Barry Sleckman (Huang et al., 2008). OT-I Tg (C57BL/6-Tg (TcraTcrb)1100Mjb/J) were acquired from The Jackson Laboratory (Bar Harbor, Maine), and TSC1 flox-flox (Tsc1tm1Djk/J) mice were a generous gift from Hongbo Chi (St. Jude Children’s Research Hospital). Mice heterozygous for c-Myc were generated from c-Myc flox mice, a gift from Fred Alt (Boston Children’s Hospital) (Supplemental Methods). All animal experiments were conducted with either male or female sex and aged-matched littermate controls (6–16 weeks old). Sample sizes were selected based on animal availability and experience with variation within the immune system. Experimental analyses were non-blinded. St. Jude Institutional Animal Care and Use Committee approved all procedures in accordance with the Guide for the Care and Use of Animals.
T Cell Stimulations
For polyclonal T cells, cells were isolated from the spleens and lymph nodes of c-Myc-GFP mice via mechanical passage through a Falcon 70 uM cell strainer (Thermo Fisher Scientific) and lysis of red blood cells in hypotonic solution. Single cell suspensions were enriched for T cells via CD45R (B220) microbeads and MACS separation (Miltenyi; Auburn, CA). Enriched cells were then stimulated on plate-bound anti-CD3 (1 ug/mL), anti-CD28 (1 ug/mL) (BioXCell West Lebanon, NH), and recombinant human CD54/ICAM (0.5ug/ml) produced in insect cells for 30–36 hrs1. OT-I Tg T cells were similarly isolated and enriched to ~96% purity and were either stimulated as above or overlain onto bone-marrow-derived dendritic cells previously pulsed with 100 nM of SIINFEKL peptide (60193-1, Anaspec Inc.; Freemont, CA) at 37°C for 1 hr. Co-cultures were incubated at 37°C for 36–40 hrs. In all stimulations for microscopy experiments, nocodazole (100 ng/mL) (Sigma-Aldrich) was added to culture for 4 hours and washed off before subsequent imaging. All T cells were cultured in RPMI 1640 (Gibco; Grand Island, NY) supplemented with 10% (v/v) heat-inactivated fetal bovine serum (FBS), 2mM L-glutamine, 0.05mM 2-mercaptoethanol, 100units/ml penicillin and 100µg/ml streptomycin at 37°C in 5% CO2.
T Cell Imaging
Antibodies against the following antigens were used: CD8 (13-0081-85; eBioscience), β-tubulin (T8328; Sigma-Aldrich), Numb (ab14140; Abcam), Scribble (ab154067; Abcam), PKCζ (IMG-90589-2; Imgenex), c-Myc (9402; Cell Signaling), pS6 (5364; Cell Signaling), p70S6K (9234; Cell Signaling), pmTOR (2974; Cell Signaling), pS256 FOXO1 (9461; Cell Signaling), CD98-PE (12-0981-81; eBiosciences), SLC1A5 (ARP42247_T100; AVIVA), and SLC1A3 (ABIN377559; antibodiesonline). Additionally, DAPI (D9542; Sigma-Aldrich) or Hoechst 33258 (H3569; Invitrogen) was used to identify nuclei.
Methodology for imaging of asymmetrically dividing T cells was adapted from Chang et al., 20072. T cell pairs undergoing cytokinesis were identified by dual nuclei and pronounced cytoplasmic cleft by brightfield. Pairs were then confirmed to be connected based on β-tubulin staining. Subsequently, the morphology of the other fluorescence channels was revealed. For quantification, the two nascent daughters were delineated via the pattern of tubulin fluorescence to define the border of each daughter cell. Using Slidebook imaging software, delineated regions were converted to masks, and mask statistics of the sum fluorescent intensity of the GFP channel (for c-Myc) and RFP channel (for indicated antigen) were analyzed using the following formulas: (difference in RFP fluorescence intensity in GFP high − low daughter)/(sum of RFP fluorescence intensity in GFP high and low daughter) for antibody-activated T cells and (difference in RFP fluorescence intensity in proximal daughter − distal daughter)/(sum of RFP fluorescence intensity in both daughters).
Flow Cytometry
Antibodies from eBiosciences included anti-CD8-APC-eFluor780 (47-0081), anti-CD44-APC (17-0441-81), anti-CD69-PERCPcy5.5 (45-0691), anti CD98-PE (12-0981-81; eBiosciences), and anti CD62L-PEcy7 (25-0621). Anti-CD4-BD605NC was acquired from BD Biosciences (San Jose, CA). Cells were stained for 20 minutes at 4°C in PBS, 5% BSA, 0.1% NaN3. Cell proliferation was assessed using Cell Trace Violet (C34557; Life Technologies) according to the manufacturer’s recommendations. Samples were acquired on a BD LSRII flow cytometer and analyzed with Treestar FlowJo software. Cell cycle analysis was performed using BD APC BrdU Flow kit per the manufacturer’s instructions (552598; BD Biosciences). Cells were sorted on a MoFlow (Beckman-Coulter) or Reflection (i-Cyt).
Compounds
Chemical inhibitors used included 1uM MG132 (S2619; Selleckchem), 1.3 uM Chir911, 1 uM Rapamycin (S1039, Selleckchem), 1uM Torin2 (S2817; Selleckchem), 1 ug/mL DON (D2141, Sigma-Aldrich), 1 ug/mL alpha keto-glutarate (K2000; Sigma-Aldrich), 0.1 mM actinomycin D (114666; Calbiochem), 100 ug/mL cyclohexamide (C7698; Sigma-Aldrich), 1uM 2DG (D6134; Sigma-Aldrich), and 1 or 5 uM JQ1 (A1910; Apexbio). Cytokines included recombinant murine IL-7 (5 ng/mL) (217-17; Peprotech), recombinant murine IL-2 (5 ng/mL) (212-12; Peprotech), and recombinant murine GMCSF for BMDC generation (1000 U/mL) (31503; Peprotech).
Metabolic Assays
Metabolic flux assays were performed as described in Wang, 2011. T cells were activated by 1 µg/ml plate-bound anti-CD3 and anti-CD28 plus ICAM for 36 hrs, and first division cells were sorted on c-Myc expression. Half a million cells per replicate were then plated with different labeled compounds over night. Glycolytic flux was determined by measuring the detritiation of [3-3H]-glucose, and fatty acid β-oxidation flux was determined by measuring the detritiation of [9,10-3H]-palmitic acid. Glutamine uptake was determined by measure the detritiation of [3H]-glutamine in lysed cells for 3 hrs.
Respiration was measured in intact T cells using the Seahorse XF24 analyzer (North Billerica, MA). Primary mouse T lymphocytes were either maintained in resting stage by 5ng/ml IL7 or activated by 1µg/ml plate-bound anti-CD3 and anti-CD28 plus ICAM. After 36 hrs, one million resting or active T cells were seeded in plates coated with Cell-Tak (354240; Corning). After 1 hr, the plate was loaded into the instrument to determine the oxygen consumption rate (OCR) and extracellular acidification rate (ECAR). For glycolytic stress tests, T cells sorted on c-Myc GFP were plated in glucose-free complete DMEM. During the course of the assay, cultures were injected with 10mM glucose (67021; Sigma-Aldrich), 1uM oligomycin (04876; Sigma-Aldrich), and 20mM 2DG.
Unbiased metabolomic profiling was performed by Metabolon, Inc (Durham, NC). Primary mouse T lymphocytes were either maintained in a resting state by 5ng/ml IL-7 or activated by 1µg/ml plate-bound anti-CD3 and anti-CD28 plus ICAM. At the end of culture, activated T cells in the first division were sorted on c-Myc expression, and 1.6 million T cells were spun down, washed once with cold PBS, and snap frozen in liquid nitrogen. All the samples were extracted and analyzed through UHPLC/MS/MS as described in supplemental methods and references.
Infections
For analysis of c-Myc asymmetry ex vivo, 5×10⁶ naïve, CFSE-labeled OT-I T cells were transferred i.v. into the tail vein of congenic wild type recipients. Twenty-four hours post transfer, recipients were infected i.v. with 5×10³ colony forming units of Listeria monocytogenes expressing SIINFEKL peptide. On day 3 post infection, spleens of recipient animals were collected and immediately flash frozen prior to cryosectioning. Unfixed sections were blocked in TBS containing 2% BSA and 0.05% Tween-20 prior to incubation with anti-c-Myc and AF405-labeled phalloidin overnight at 4°C. c-Myc was finally detected with Cy3-labeled secondary antibody, and sections were imaged using laser scanning confocal microscopy.
For analysis of the functional consequences of c-Myc asymmetry in vivo, Cell Trace Violet-labeled, naïve c-Myc-GFP, OT-I cells were activated on plate-bound anti-CD3/CD28/ICAM or SIINFEKL-pulsed BMDCs for 36 hrs (as described above). Cell Trace Violet dilution was used to identify T cells in the first division, which were then sorted on c-Myc-GFP fluorescence into high and low populations. 2.5×10⁵, 5×10⁵, or 7.5×10⁵ CD45.1/CD45.2 c-Myc-GFP high or low cells were transferred i.v. into CD45.1 recipients. Recipient animals were either left naïve, or infected with 106 EID50 HKx31 influenza expressing SIINFEKL peptide (Paul Thomas, St. Jude Children’s Research Hospital). Two weeks post transfer, spleens and lymph nodes from half of the animals were examined for the presence of donor cells as indicated by positive staining for the CD45.2 congenic marker. All remaining recipients were rested for an additional two weeks and then challenged with PR8 influenza expressing SIINFEKL peptide (Paul Thomas, St. Jude Children’s Research Hospital). Nine days after this challenge infection, spleens and lymph nodes were collected and analyzed for the presence of donor cells. For in vivo treatment with rapamycin, recipient mice received daily I.P. injections of rapamycin at 75 ug/kg30 from days 0–10 post infection.
Statistics
Indicated statistical analyses were performed using Graphpad Prizm software. Four different tests were employed: Chi square goodness of fit was used for imaging experiments with BMDCs, assuming 25% of data points expected in each graph quadrant (representative of four possible staining patterns for the two different proteins). Similarly, for imaging experiments with antibody-activated T cells, a two-tailed binomial test was employed with an expected even distribution (50%) of data points into two quadrants (representative of two possible staining patterns). Linear Regression was used on the imaging data to determine whether there was a correlation between the two proteins analyzed.
Unpaired Students T Test was used to test whether two means were significantly different from one another when the data are not linked. Paired Students T Test was used to analyze the fluorescence intensity in each daughter of a conjoined pair as in Fig. 1J.
Extended Data
Ext. Data Fig. 1. Characterization of c-Myc asymmetry.
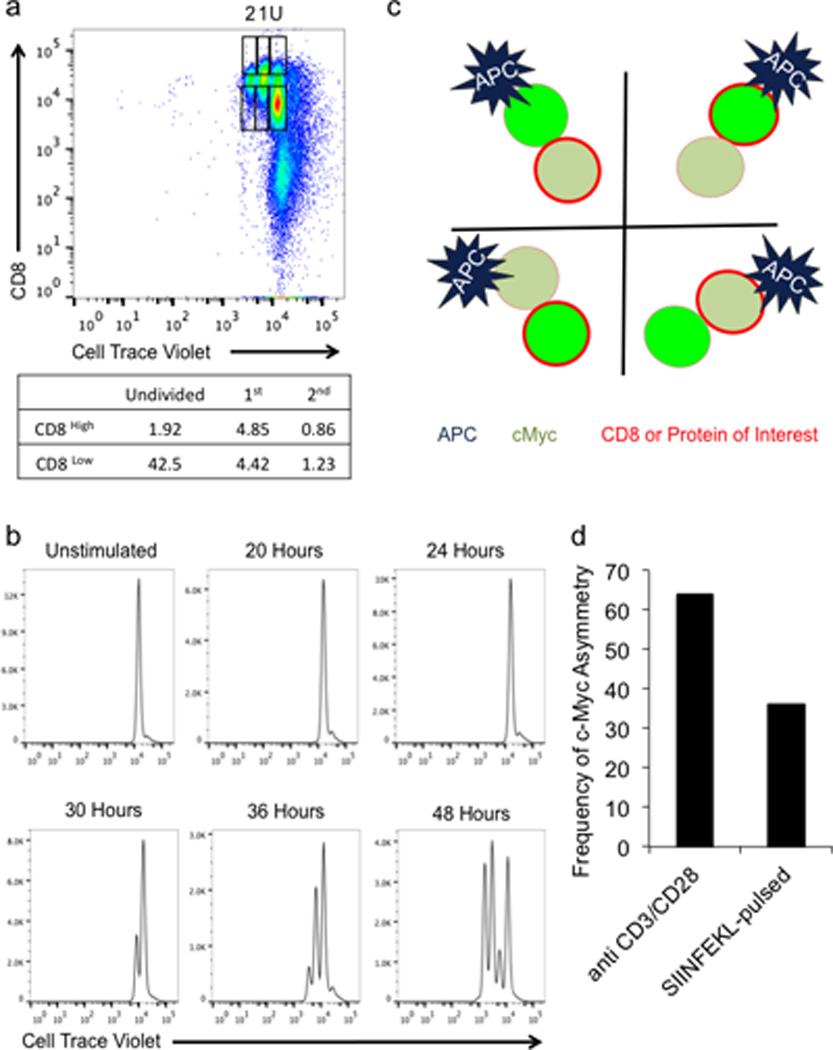
(A) Gating Strategy for CD8 high and low cells. Cell Trace Violet-labeled, naïve T cells were activated on anti-CD3, anti-CD28, and ICAM for 36 hours. CD8 high or low cells were identified as activated, undivided (U), first division (1), or second division (2) based on dilution of Cell Trace Violet. Frequencies of cells in each population are presented in table below. (B) Time course of Cell Trace Violet dilution in naïve, T cells activated on anti-CD3, anti-CD28, and ICAM for the indicated time points. (C) Schematic representation of staining patterns for interpretation of data represented in Figure 1C–H. Black lines indicate axes on graphs. (D) Frequencies of asymmetric cell division were determined by analyzing 92 conjoined daughters from cultures on anti-CD3, anti-CD28, and ICAM and 123 conjoined daughters from cultures with SIINFEKL-pulsed BMDCs. T cells were analyzed for c-Myc-GFP intensity in both daughters. Using 1.5 times brightness in one daughter versus the other as a cut off, each pair was assigned either asymmetric or not, and the frequency of asymmetric pairs is plotted.
Ext. Data Fig. 2. Representative confocal images and single stains for data in Figure 1.
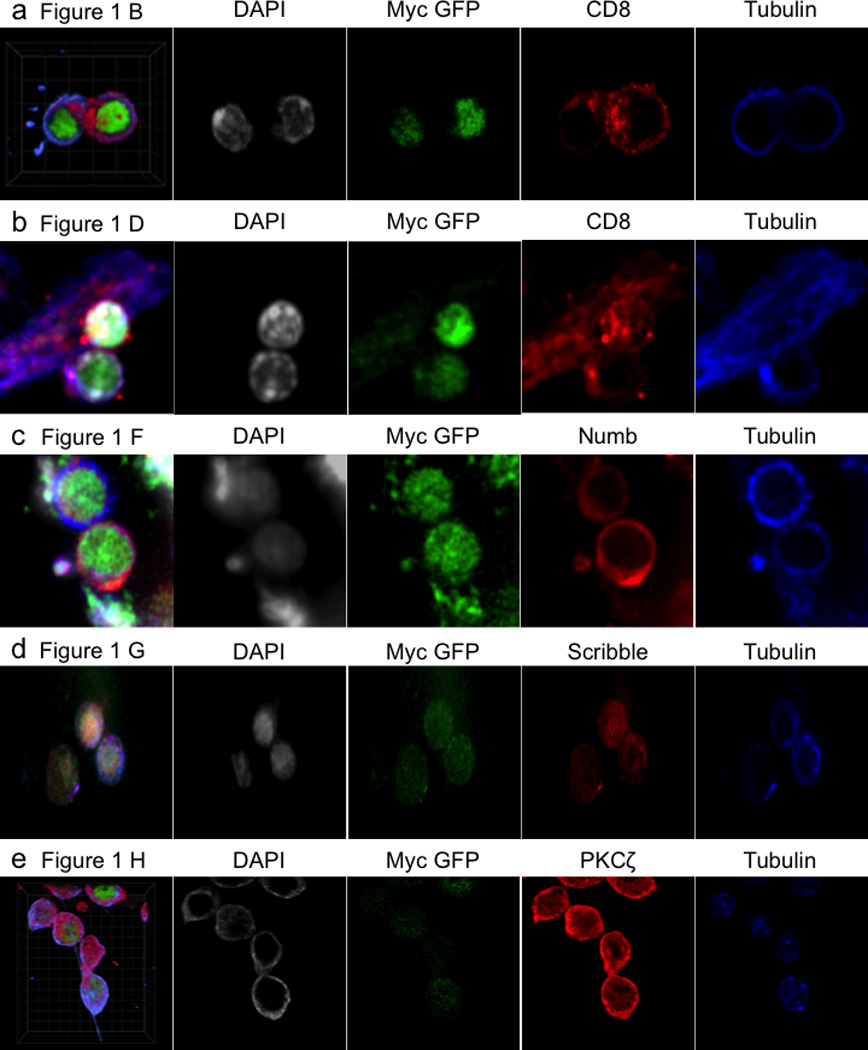
(A) Figure 1B–C, (B) Figure 1D–E, (C) Figure 1F, (D) Figure 1G, (E) Figure 1H.
Ext. Data Fig. 3. C-Myc Expression becomes asymmetric in late telophase.
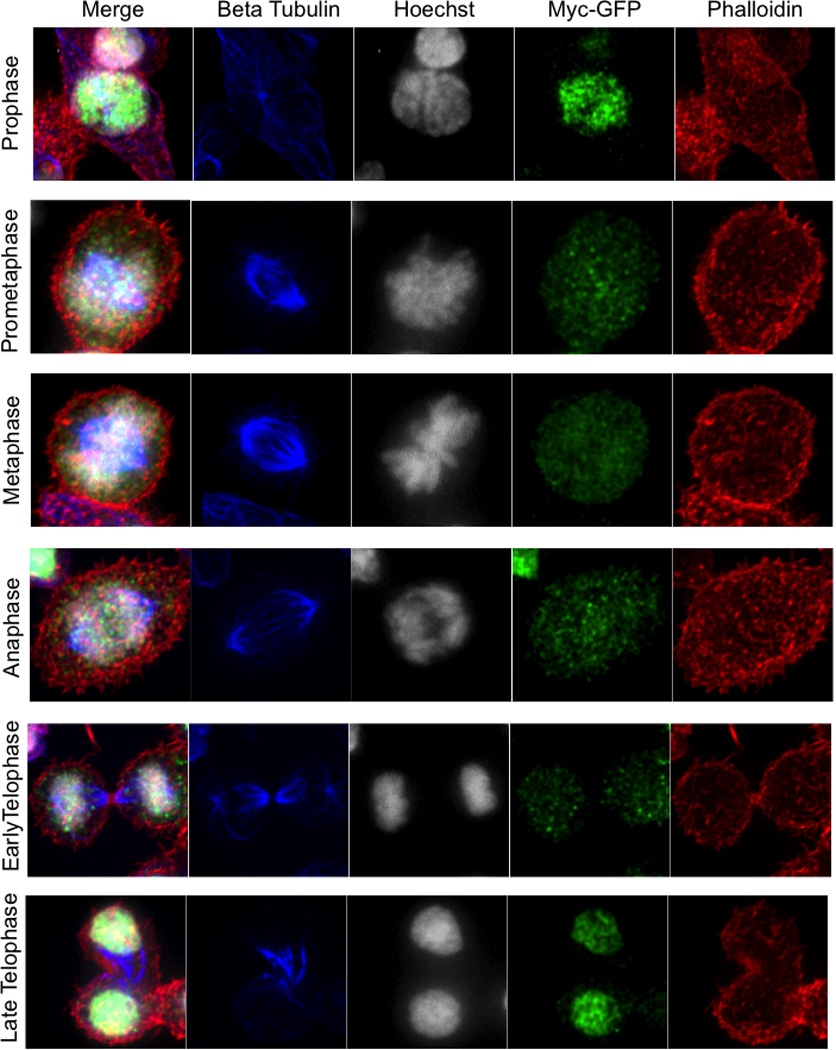
Overlay, Beta Tubulin (blue), Hoechst 33258 (gray), c-Myc-GFP (green), and phalloidin (red) for each mitotic phase indicated on the left as identified by chromatin and tubulin staining patterns.
Ext. Data Fig. 4. Asymmetric assortment of mRNA for c-Myc target genes in activated T cells.
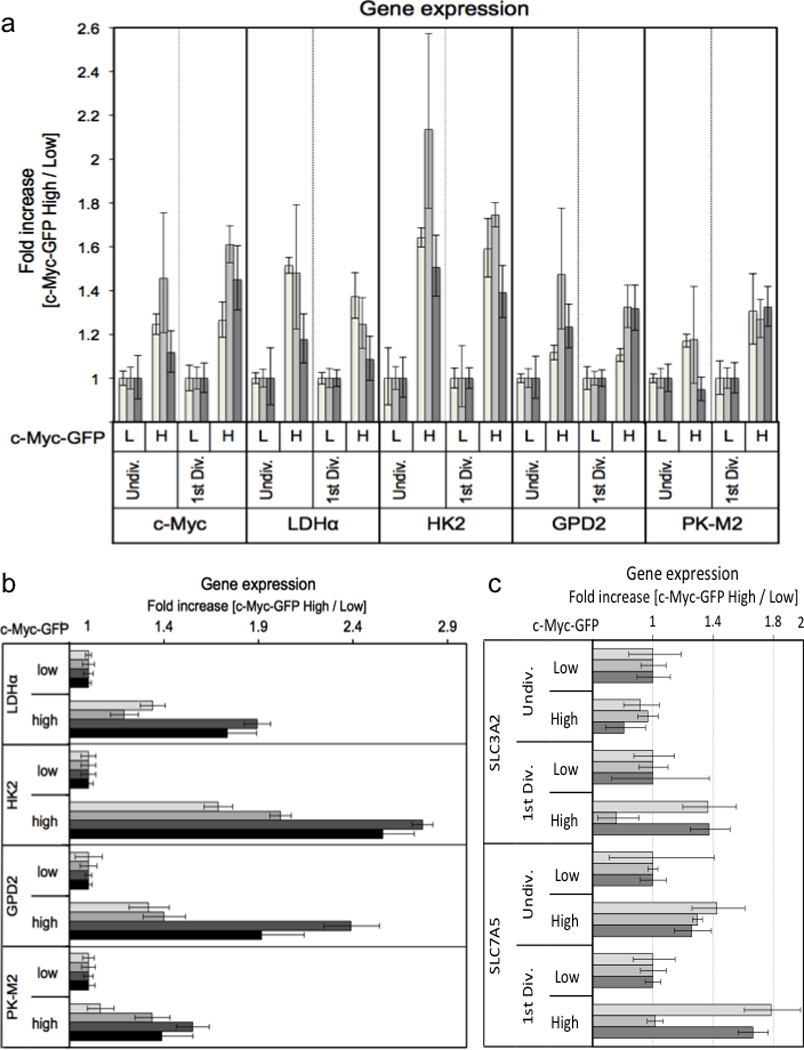
Cell Trace Violet labeled T cells were stimulated for 36 hours on anti-CD3, anti-CD28, and ICAM. First division (A and C) or undivided (A, B and C) c-Myc high (H) and low (L) T cells were sorted on c-Myc-GFP expression (panel B is undivided cells only), and RNA was extracted from each population using a Qiagen RNeasy kit according to the manufacturer’s instructions. Fold change in gene expression for the indicated primers is quantified using the 2−ΔΔCt method relative to β-2-microglobulin across three (A and C) or four (B) independent experiments.
Ext. Data Fig. 5. Cytokine signaling does not influence c-Myc asymmetry and asymmetric assortment of CD98.
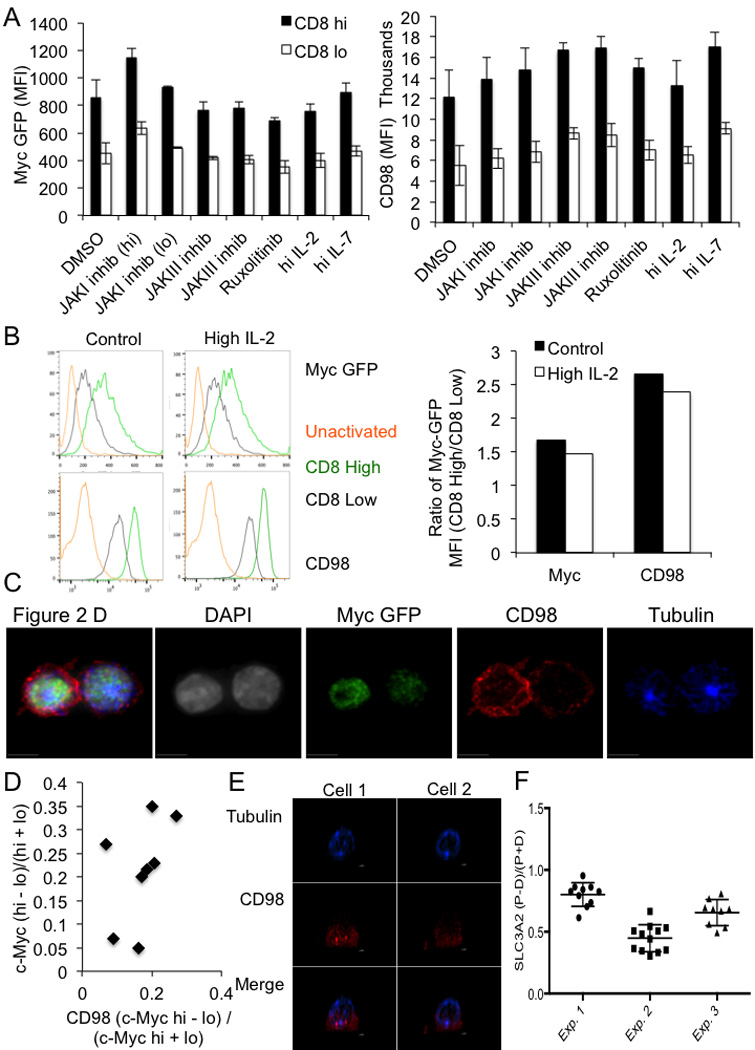
(A) Mean fluorescent intensity of c-Myc-GFP (left panel) or CD98 (right panel) in CD8high (shaded bars) and CD8low (open bars) in the first division after 35 hours of activation by anti-CD3, anti-CD8, and ICAM and the indicated treatment for 1 hour. All differences significant (p<0.05) by unpaired Student’s T Test. (B) Flow cytometric analysis of c-Myc GFP and CD98 in CD8high (Green histograms), CD8low (gray histograms), or IL-7 (5ng/mL)-rested unactivated (gold histograms) T cells in control conditions or activated in the presence of 10ng/mL IL-2 (0–36 hrs post activation). Representative flow plots are on the left, and quantification of the mean fluorescence intensities of c-Myc and CD98-APC are on the right. Experiment representative of three independent experiments. (C) Representative confocal image and single stain images for Figure 2D–E. OT-I T cells stimulated on SIINFEKL-pulsed BMDCs (D) Quantification of CD98 and c-Myc asymmetry in T cells stimulated on anti-CD3, anti-CD28, and ICAM for 36 hours. 100% both bright in same daughter (p=0.0039 Two-Tailed Binomial Test); r2=0.2304, p=0.2304 Linear Regression (E) Polarization of SLC3A2 in two representative confocal images in OT-I Tg T cells stimulated in #1.5 polymer coverslips (80426, ibidi) coated with CD3, CD28, and ICAM for 2h and fixed with 4% paraformaldehyde for 10 min. (F) Asymmetric index (Difference in RFP Intensity in proximal and distal sides of cell/Sum of RFP intensities in proximal and distal sides of cell) for SLC3A2 staining in activated, undivided CD8 T cells.
Ext. Data Fig. 6. Amino acid transporter SLC1A5, but not SLC1A3 asymmetrically assorts in activated T cells.
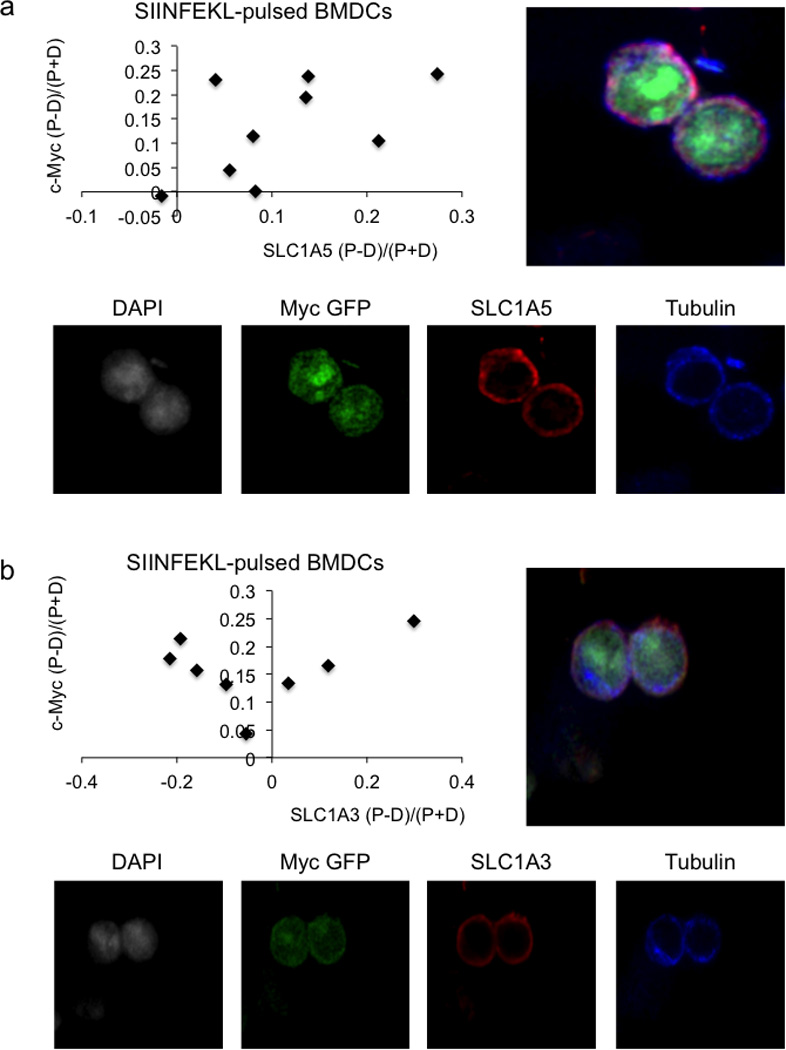
Representative confocal image, quantification, and single stain images for SLC1A5 88.9% both bright in proximal daughter (_x_2=19.89, DF=3, p=0.0002 Chi-Square Goodness of Fit Test); r2=0.2961, p=0.1299 Linear Regression (A) and SLC1A3 100% c-Myc bright in proximal daughter, 62.5% SLC1A3 bright in distal daughter (_x_2=9, DF=3, p=0.0293 Chi-Square Goodness of Fit Test); r2=0.07944, p=0.4989 Linear Regression (B) for OT-I CD8 T cells co-cultured with SIINFEKL-pulsed BMDCs for 36 hours.
Ext. Data Fig. 7. Regulation of phospho mTOR and TORC1 signaling by c-Myc.
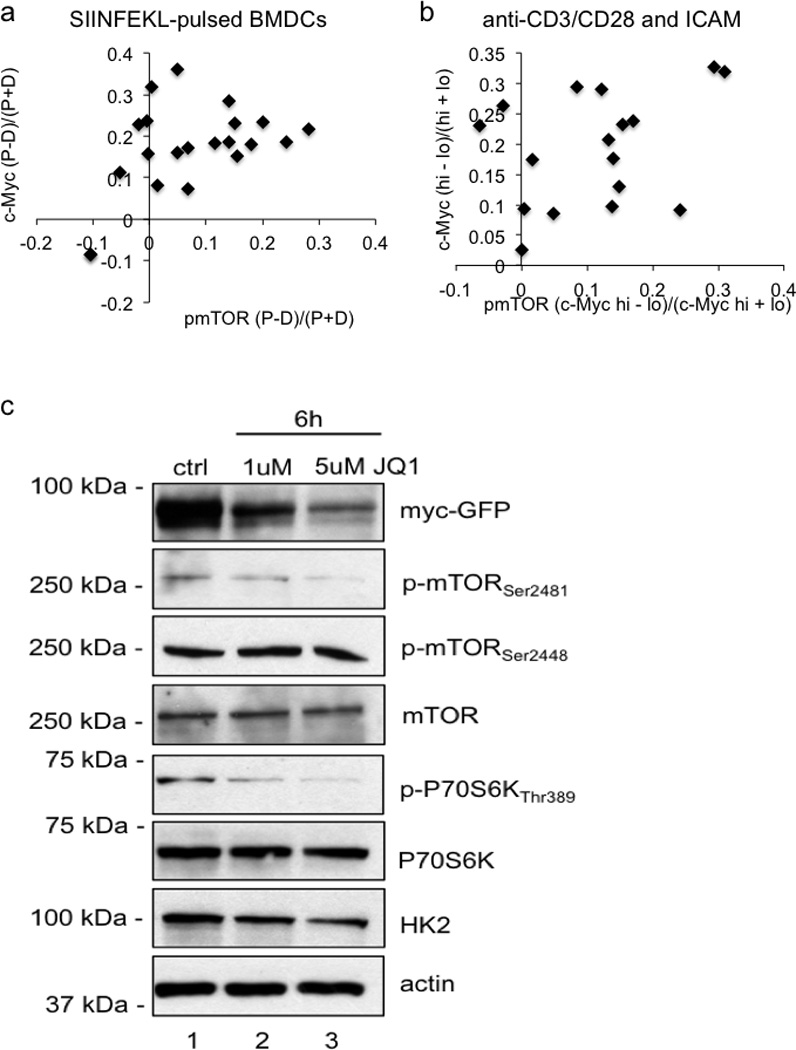
Quantification of p-mTOR staining and c-Myc-GFP for OT-I CD8 T cells co-cultured with SIINFEKL-pulsed BMDCs 80.9% both bright in proximal daughter (_x_2=25.67, DF=3, p<0.0001 Chi-Square Goodness of Fit Test); r2=0.2307, p=0.0275 Linear regression (A) or T cells stimulated for 36 hours on anti-CD3, anti-CD28, and ICAM 82.4% both bright in same daughter (p=0.0013 Two-Tailed Binomial Test); r2=0.1204, p=0.1725 Linear Regression (B). Asymmetry as assessed by fluorescence intensity is expressed as (proximal-distal)/total (A), or values from (Mychigh-Myclow)/total (B). (C) Western blot analysis of CD8 T cells activated on anti-CD3, anti-CD28, and ICAM for 6 hrs without treatment (ctrl) or with 1uM or 5uM JQ1. Data are representative of three independent experiments.
Ext. Data Fig. 8. Asymmetric assortment of mTORC1 activity with c-Myc-GFP.
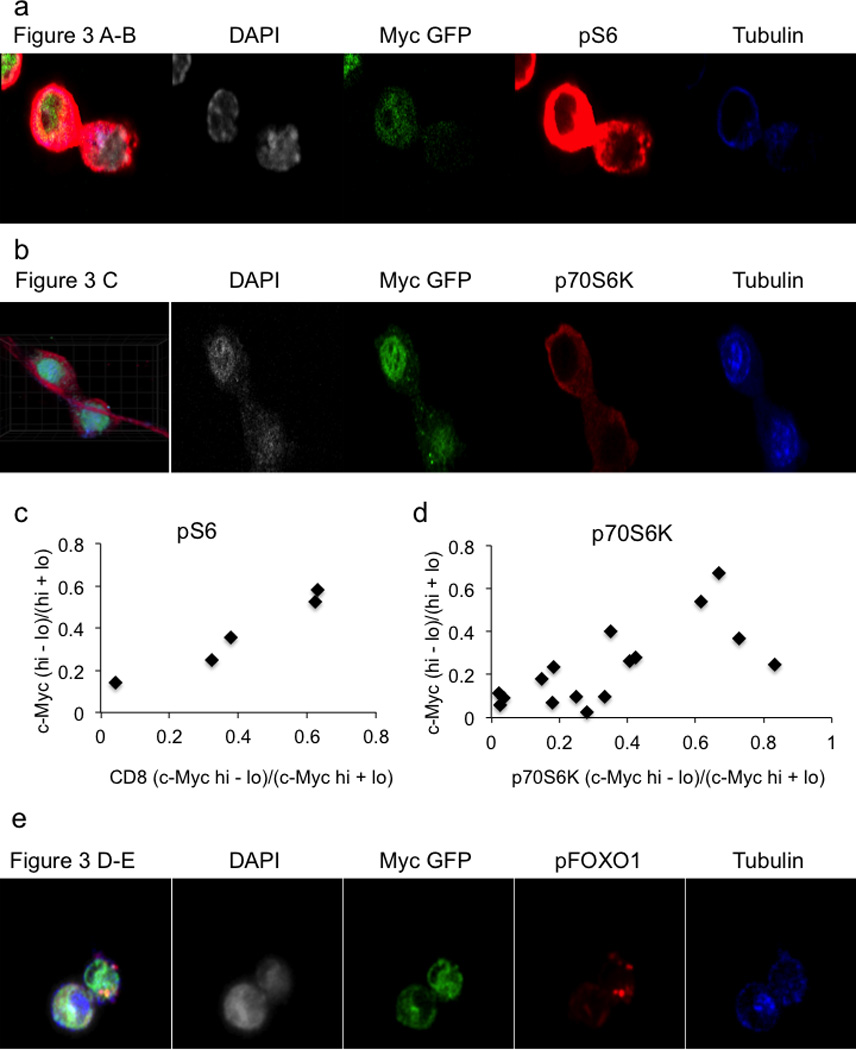
Representative confocal images for quantifications of c-Myc-GFP and pS6 staining corresponding to Figure 3A–B (A) or c-Myc-GFP and p70S6K corresponding to Figure 3C (B) in OT-I T cells co-culture with SIINFEKL pulsed BMDCs. Quantifications for c-Myc-GFP and pS6 100% both bright in same daughter (_x_2=19.89, DF=3, p=0.0002 Chi-Square Goodness of Fit Test); r2=0.9457, p=0.0055 Linear Regression (C) or p70S6K 100% both bright in same daughter (_x_2=14.14, DF=3, p=0.0027 Chi-Square Goodness of Fit Test); r2=0.4875, p=0.0026 Linear Regression (D) staining in T cells stimulated on anti-CD3, anti-CD28, and ICAM for 36 hours. (E) Representative confocal images for quantifications of c-Myc-GFP and pFOXO1 staining corresponding to Figure 3D–E. T cells stimulated on anti-CD3, anti-CD28, and ICAM for 36 hours.
Ext. Data Fig. 9. First division CD8high, c-Myc-GFP bright CD8 T cells are more glycolytic and exhibit more glutaminolysis and PPP than first division CD8low, c-Myc-GFP dim CD8 T cells but have decreased FAO.
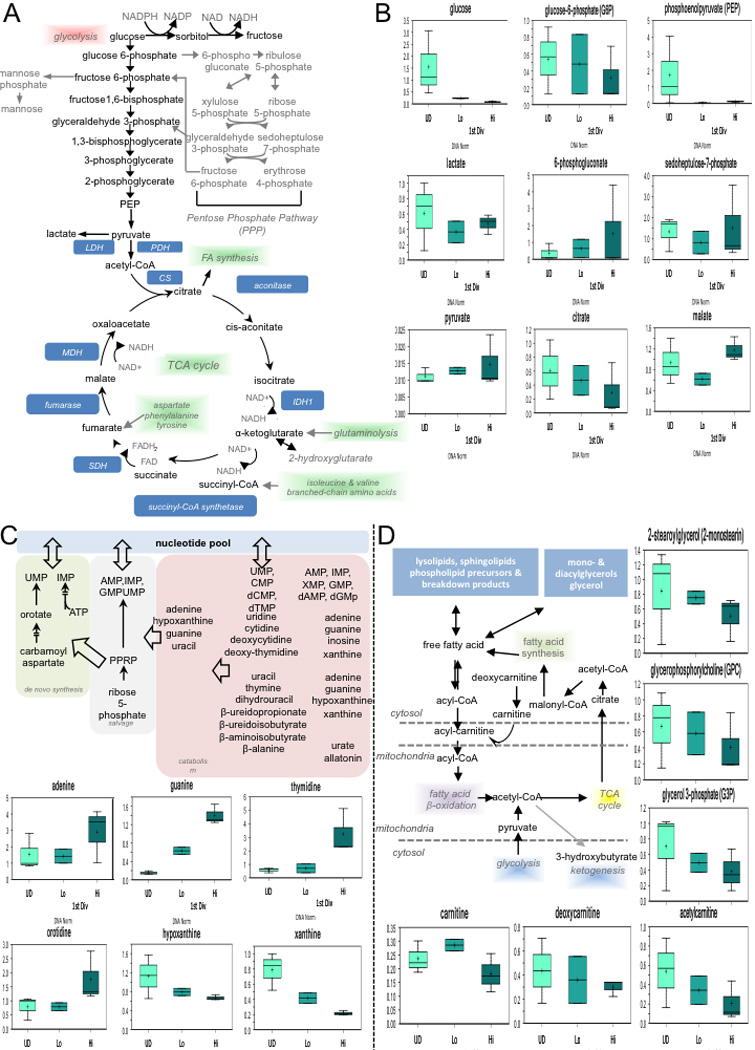
Primary mouse T lymphocytes were activated by 1µg/ml plate-bound anti-CD3 and anti-CD28 plus ICAM. At the end of culture, activated, undivided T cells were sorted, and T cells in the first division were sorted on c-Myc expression. 1.6 million T cells were spun down, washed once with cold PBS, and snap frozen in liquid nitrogen. All the samples were extracted and analyzed through UHPLC/MS/MS for unbiased metabolomic profiling performed by Metabolon, Inc (Durham, NC). Metabolic pathway schematic (A) was generated by Metabolon Inc, as were graphs (B) for select metabolites in pathway, representing data for DNA-normalized data. Metabolic pathway schematics and graphs were also generated by Metabolon Inc. for select metabolites in pathway, representing data for DNA-normalized data for nucelotide biosynthesis (A) and fatty acid oxidation (B).
Ext. Data Fig. 10. c-Mychigh CD8 T cells are more glycolytic than CD8low CD8 T cells without asymmetric distribution of mitochondria.
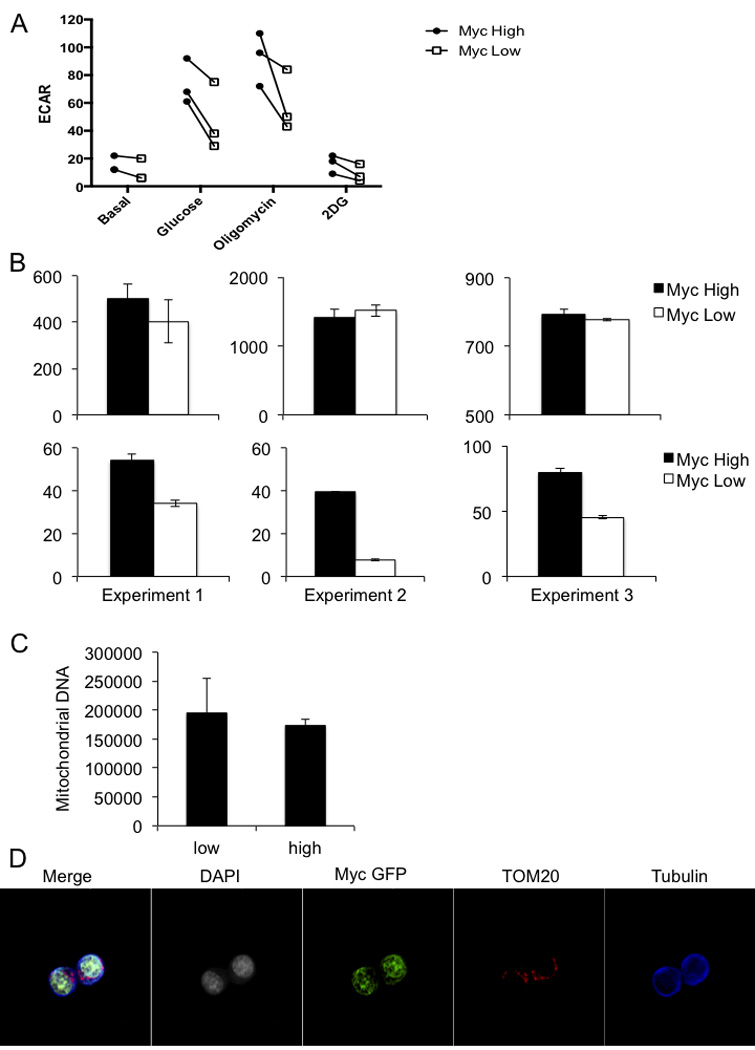
(A) The extracellular acidification rate (ECAR) for sorted c-Mychigh (shaded symbols) and c-Myclow (open symbols) T cells from the first division after 36 hours of activation by anti-CD3, anti-CD28, and ICAM as measured by a Seahorse Bioflux analyzer during exposure to the indicated compounds are represented. Values are paired across three independent experiments. (B) The oxygen consumption rate (OCR) (left hand panels) and ECAR (right hand panels) for basal respiration in complete RPMI with glucose of sorted c-Mychigh (shaded bars) and c-Myclow (open bars) CD8 T cells from the first division after 36 hours of activation by anti-CD3, anti-CD28, and ICAM as measured by a Seahorse Bioflux analyzer across three independent experiments. (C) Quantification of mitochondrial DNA in sorted first-division c-Myc low and high OT-I CD8 T cells activated on anti-CD3, anti-CD28 and ICAM for 36 hours. Mean and standard deviation are plotted for three technical replicates of n=2 mice/group. (D) Overlay and individual channel images of Beta Tubulin (blue), DAPI (gray), c-Myc-GFP (green), and TOM20 (red) of an OT-I CD8 T cell activated on anti-CD3, anti-CD28 and ICAM for 36 hours.
Supplementary Material
supp_info
video. Supplementary Videos.
3D reconstructions turned about the x-axis of volumetric representations of compiled images taken at 0.4 microns through fixed T cells stimulated on either plate-bound anti-CD3, anti-CD28, and ICAM (Videos 1–3) or OT-I T cells stimulated by SIINFEKL-pulsed BMDCs (Videos 4–6). Beta tubulin is pseudo-colored blue, c-Myc-GFP green, and CD8 red. Video 7 is the time-lapse compilation of images taken every 2 minutes of a dividing OT-I T cell after co-culture with SIINFEKL-pulsed BMDCs (Cell Trace Violet in Blue, c-Myc-GFP in Green). Tiles in Figure 2A were taken from every other still in this compilation.
Acknowledgments
We thank Richard Cross, Greig Lennon, and Parker Ingle for cell sorting, Paul Thomas for assistance with influenza infections, Hongbo Chi for help with Listeria infections, and Iwona Pawlikowska for help with statistical analyses. This work was supported by ALSAC and grants from the US National Institutes of Health.
Footnotes
Author Statements
K.C.V. conceived the project, designed and performed most experiments, interpreted results, and co-wrote the manuscript. C.G. guided imaging, performed live imaging experiments, and performed experiments with TSC1 flox/flox animals. S.M. provided technical assistance with Seahorse XF24 assays and helped with several in vivo studies. S.L. performed some imaging experiments with amino acid transports, performed experiments with high IL-2, and helped with several in vivo studies. M.M. K. performed and analyzed all gene expression analyses. R.W. provided intellectual contributions. D.R.G. conceived the project, supervised experimental designs, interpreted results, and co-wrote the manuscript.
References Cited
- 1.Pham K, Sacirbegovic F, Russell SM. Polarised cells, polarised views: Asymmetric cell division in hematopoietic cells. Frontiers in Immunology. 2014;5 doi: 10.3389/fimmu.2014.00026. [DOI] [PMC free article] [PubMed] [Google Scholar]
- 2.Chang JT, et al. Asymmetric T lymphocyte division in the initiation of adaptive immune responses. Science. 2007;315:1687–1691. doi: 10.1126/science.1139393. [DOI] [PubMed] [Google Scholar]
- 3.Wang R, et al. The transcription factor Myc controls metabolic reprogramming upon T lymphocyte activation. Immunity. 2011;35:871–882. doi: 10.1016/j.immuni.2011.09.021. [DOI] [PMC free article] [PubMed] [Google Scholar]
- 4.Huang CY, Bredemeyer AL, Walker LM, Bassing CH, Sleckman BP. Dynamic regulation of c-Myc proto-oncogene expression during lymphocyte development revealed by a GFP-c-Myc knock-in mouse. European journal of immunology. 2008;38:342–349. doi: 10.1002/eji.200737972. [DOI] [PubMed] [Google Scholar]
- 5.Colombetti S, Basso V, Mueller DL, Mondino A. Prolonged TCR/CD28 engagement drives IL-2-independent T cell clonal expansion through signaling mediated by the mammalian target of rapamycin. J Immunol. 2006;176:2730–2738. doi: 10.4049/jimmunol.176.5.2730. [DOI] [PubMed] [Google Scholar]
- 6.Sancak Y, et al. The Rag GTPases bind raptor and mediate amino acid signaling to mTORC1. Science. 2008;320:1496–1501. doi: 10.1126/science.1157535. [DOI] [PMC free article] [PubMed] [Google Scholar]
- 7.Grohmann U, Bronte V. Control of immune response by amino acid metabolism. Immunol Rev. 2010;236:243–264. doi: 10.1111/j.1600-065X.2010.00915.x. [DOI] [PubMed] [Google Scholar]
- 8.Choo AY, Yoon SO, Kim SG, Roux PP, Blenis J. Rapamycin differentially inhibits S6Ks and 4E-BP1 to mediate cell-type-specific repression of mRNA translation. Proc Natl Acad Sci U S A. 2008;105:17414–17419. doi: 10.1073/pnas.0809136105. [DOI] [PMC free article] [PubMed] [Google Scholar]
- 9.Hsu PP, et al. The mTOR-Regulated Phosphoproteome Reveals a Mechanism of mTORC1-Mediated Inhibition of Growth Factor Signaling. Science. 2011;332:1317–1322. doi: 10.1126/science.1199498. [DOI] [PMC free article] [PubMed] [Google Scholar]
- 10.Ouyang W, Beckett O, Flavell RA, Li MO. An essential role of the Forkhead-box transcription factor Foxo1 in control of T cell homeostasis and tolerance. Immunity. 2009;30:358–371. doi: 10.1016/j.immuni.2009.02.003. [DOI] [PMC free article] [PubMed] [Google Scholar]
- 11.Peck B, Ferber EC, Schulze A. Antagonism between FOXO and Myc regulates cellular powerhouse. Frontiers in Oncology. 2013;3 doi: 10.3389/fonc.2013.00096. [DOI] [PMC free article] [PubMed] [Google Scholar]
- 12.Yang K, Neale G, Green DR, He W, Chi H. The tumor suppressor Tsc1 enforces quiescence of naive T cells to promote immune homeostasis and function. Nat Immunol. 2011;12:888–897. doi: 10.1038/ni.2068. [DOI] [PMC free article] [PubMed] [Google Scholar]
- 13.Vervoorts J, Luscher-Firzlaff J, Luscher B. The ins and outs of MYC regulation by posttranslational mechanisms. J Biol Chem. 2006;281:34725–34729. doi: 10.1074/jbc.R600017200. [DOI] [PubMed] [Google Scholar]
- 14.Sears RC. The life cycle of C-myc: from synthesis to degradation. Cell cycle. 2004;3:1133–1137. [PubMed] [Google Scholar]
- 15.Wise DR, et al. Myc regulates a transcriptional program that stimulates mitochondrial glutaminolysis and leads to glutamine addiction. Proceedings of the National Academy of Sciences. 2008;105:18782–18787. doi: 10.1073/pnas.0810199105. [DOI] [PMC free article] [PubMed] [Google Scholar]
- 16.Wang R, Green DR. Metabolic checkpoints in activated T cells. Nat Immunol. 2012;13:907–915. doi: 10.1038/ni.2386. [DOI] [PubMed] [Google Scholar]
- 17.Marelli-Berg FM, Fu H, Mauro C. Molecular mechanisms of metabolic reprogramming in proliferating cells: implications for T-cell-mediated immunity. Immunology. 2012;136:363–369. doi: 10.1111/j.1365-2567.2012.03583.x. [DOI] [PMC free article] [PubMed] [Google Scholar]
- 18.van der Windt GJ, et al. Mitochondrial respiratory capacity is a critical regulator of CD8+ T cell memory development. Immunity. 2012;36:68–78. doi: 10.1016/j.immuni.2011.12.007. [DOI] [PMC free article] [PubMed] [Google Scholar]
- 19.van der Windt GJ, Pearce EL. Metabolic switching and fuel choice during T-cell differentiation and memory development. Immunol Rev. 2012;249:27–42. doi: 10.1111/j.1600-065X.2012.01150.x. [DOI] [PMC free article] [PubMed] [Google Scholar]
- 20.Katajisto P, et al. Stem cells. Asymmetric apportioning of aged mitochondria between daughter cells is required for stemness. Science. 2015;348:340–343. doi: 10.1126/science.1260384. [DOI] [PMC free article] [PubMed] [Google Scholar]
- 21.Arsenio J, et al. Early specification of CD8+ T lymphocyte fates during adaptive immunity revealed by single-cell gene-expression analyses. Nat Immunol. 2014;15:365–372. doi: 10.1038/ni.2842. [DOI] [PMC free article] [PubMed] [Google Scholar]
- 22.Stemberger C, et al. A single naive CD8+ T cell precursor can develop into diverse effector and memory subsets. Immunity. 2007;27:985–997. doi: 10.1016/j.immuni.2007.10.012. [DOI] [PubMed] [Google Scholar]
- 23.Schepers K, et al. Dissecting T cell lineage relationships by cellular barcoding. The Journal of experimental medicine. 2008;205:2309–2318. doi: 10.1084/jem.20072462. [DOI] [PMC free article] [PubMed] [Google Scholar]
- 24.Bannard O, Kraman M, Fearon DT. Secondary replicative function of CD8+ T cells that had developed an effector phenotype. Science. 2009;323:505–509. doi: 10.1126/science.1166831. [DOI] [PMC free article] [PubMed] [Google Scholar]
- 25.Harrington LE, Janowski KM, Oliver JR, Zajac AJ, Weaver CT. Memory CD4 T cells emerge from effector T-cell progenitors. Nature. 2008;452:356–360. doi: 10.1038/nature06672. [DOI] [PubMed] [Google Scholar]
- 26.Rohr JC, Gerlach C, Kok L, Schumacher TN. Single cell behavior in T cell differentiation. Trends in Immunology. 35:170–177. doi: 10.1016/j.it.2014.02.006. [DOI] [PubMed] [Google Scholar]
- 27.Dang CV, Le A, Gao P. MYC-induced cancer cell energy metabolism and therapeutic opportunities. Clinical cancer research : an official journal of the American Association for Cancer Research. 2009;15:6479–6483. doi: 10.1158/1078-0432.CCR-09-0889. [DOI] [PMC free article] [PubMed] [Google Scholar]
- 28.Gao P, et al. c-Myc suppression of miR-23a/b enhances mitochondrial glutaminase expression and glutamine metabolism. Nature. 2009;458:762–765. doi: 10.1038/nature07823. [DOI] [PMC free article] [PubMed] [Google Scholar]
- 29.Liu J, Levens D. Making myc. Current topics in microbiology and immunology. 2006;302:1–32. doi: 10.1007/3-540-32952-8_1. [DOI] [PubMed] [Google Scholar]
- 30.Araki K, et al. mTOR regulates memory CD8 T-cell differentiation. Nature. 2009;460:108–112. doi: 10.1038/nature08155. [DOI] [PMC free article] [PubMed] [Google Scholar]
Associated Data
This section collects any data citations, data availability statements, or supplementary materials included in this article.
Supplementary Materials
supp_info
video. Supplementary Videos.
3D reconstructions turned about the x-axis of volumetric representations of compiled images taken at 0.4 microns through fixed T cells stimulated on either plate-bound anti-CD3, anti-CD28, and ICAM (Videos 1–3) or OT-I T cells stimulated by SIINFEKL-pulsed BMDCs (Videos 4–6). Beta tubulin is pseudo-colored blue, c-Myc-GFP green, and CD8 red. Video 7 is the time-lapse compilation of images taken every 2 minutes of a dividing OT-I T cell after co-culture with SIINFEKL-pulsed BMDCs (Cell Trace Violet in Blue, c-Myc-GFP in Green). Tiles in Figure 2A were taken from every other still in this compilation.
