Agonist-mediated activation of STING induces apoptosis in malignant B cells (original) (raw)
. Author manuscript; available in PMC: 2017 Apr 15.
Abstract
Endoplasmic reticulum (ER) stress responses through the IRE-1/XBP-1 pathway are required for the function of STING (TMEM173), an ER-resident transmembrane protein critical for cytoplasmic DNA sensing, interferon production and cancer control. Here we show that the IRE-1/XBP-1 pathway functions downstream of STING and that STING agonists selectively trigger mitochondria-mediated apoptosis in normal and malignant B cells. Upon stimulation, STING was degraded less efficiently in B cells, implying that prolonged activation of STING can lead to apoptosis. Transient activation of the IRE-1/XBP-1 pathway partially protected agonist-stimulated malignant B cells from undergoing apoptosis. In Eμ-TCL1 mice with chronic lymphocytic leukemia, injection of the STING agonist 3′3′-cGAMP induced apoptosis and tumor regression. Similarly efficacious effects were elicited by 3′3′-cGAMP injection in syngeneic or immunodeficient mice grafted with multiple myeloma. Thus, in addition to their established ability to boost anti-tumoral immune responses, STING agonists can also directly eradicate malignant B cells.
Keywords: B cell cancer, endoplasmic reticulum, IRE-1, STING, XBP-1
Introduction
In mammalian cells, the presence of double-stranded DNA in the cytoplasm is a danger signal of infections or cell anomalies. These bacterial, viral or self DNA can be recognized by a cytoplasmic DNA sensor, cyclic GMP-AMP synthase (cGAS). Upon binding to DNA, cGAS generates 2′3′-cGAMP as an endogenous ligand to activate the stimulator of interferon gene (STING) (1–5). Bacteria-produced cyclic dinucleotides, c-di-AMP, c-di-GMP and 3′3′-cGAMP, as well as the unnatural 2′2′-cGAMP can also bind to and activate STING (5–9). Different from Toll-like receptors (TLRs) which are found either on the cell surface or in the endosomes, STING is an endoplasmic reticulum (ER)-resident protein (10,11). Activation of STING by its agonists can lead to the exit of STING from the ER into the secretory pathway (i.e., the Golgi apparatus and vesicles), in which the phosphorylation of STING occurs, leading to the phosphorylation of interferon regulatory factor 3 (IRF3) to allow for the production of type I interferons (IFNα and IFNβ) to stimulate the immune system and restore health (10–13). The agonist-bound STING is eventually destructed in the endosomes.
Since STING is a critical mediator for the production of interferons, agonists of mouse STING like c-di-GMP and c-di-AMP have been proposed as adjuvants to elicit potent immune response (14–16). In addition, 2′3′-cGAMP was shown to aid in radiation-based cancer therapy (17). DMXAA (5,6-dimethylxanthenone-4-acetic acid) is a potent chemical compound which can shrink solid tumors in mice by disrupting tumor vasculature and boosting the immune system by producing cytokines (18–20). CMA (10-carboxymethyl-9-acridanone) is an anti-viral compound that can induce type I interferons (21,22). Both DMXAA and CMA were recently co-crystallized with STING (9,23,24). However, it is unclear whether these STING-binding cyclic dinucleotides and chemical compounds (DMXAA and CMA) can directly exert cytotoxicity in tumor cells. The potency of cyclic dinucleotides, DMXAA and CMA in activating STING to produce type I interferons has also not been compared side by side using intact cells.
The lumen of the ER contains chaperone proteins such as HSP70-like GRP78/BiP, HSP90-like GRP94, protein disulfide isomerase (PDI), and lectin-binding calreticulin and calnexin to facilitate the folding, assembly and quality control of integral membrane proteins and secretory proteins. The ER is also equipped with sensor molecules that have the capability in activating the ER stress response upon stress conditions (25,26). One of these sensor molecules is IRE-1. IRE-1 is an ER resident transmembrane protein that contains an ER stress sensor domain facing the lumen of the ER, and this luminal domain is linked to its cytoplasmic kinase/RNase domain by a transmembrane domain. Upon activation, IRE-1 undergoes oligomerization and autophosphorylation to assemble a functional RNase that specifically splices 26 nucleotides from the mature XBP-1 mRNA in mammalian cells (27–30). Such an excision followed by the subsequent ligation of the mRNA leads to a reading frame shift in translation, and the spliced XBP-1 mRNA encodes a larger 54-kDa transcription factor, XBP-1s, in mammalian cells (29). XBP-1s is responsible for upregulating the synthesis of lipids and chaperones, contributing to the restoration of a homeostatic ER (31–33). Stimulations of B cells with the TLR4 ligand (lipopolysaccharides, LPS) or TLR9 ligand (CpG) activate the IRE-1/XBP-1 pathway to support B cell growth and differentiation, as evidenced by robust B cell proliferation and antibody production (34–36). The lack of IRE-1 or XBP-1 blocks the antibody-producing function of B cells (34–37). Although STING−/− mice have been shown to be incapable of mounting antibody responses after immunization with a DNA vaccine encoding ovalbumin (13), the response of B cells to STING agonists is still unknown. In addition, it is unclear whether STING interacts with other ER-resident proteins and plays a role in responding to stresses in the ER.
Materials and Methods
Mice
The XBP-1f/f, CD19Cre/XBP-1f/f, Eμ-TCL1, KaLwRij and the immunodeficient NSG mice were maintained at our animal facility strictly following the guidelines provided by the Wistar Institute Committee on Animal Care.
Purification of mouse B cells and Eμ-TCL1 CLL cells
Splenocytes were obtained from mice by mashing the spleens through cell strainers followed by RBC lysis (Qiagen). Mouse B cells and Eμ-TCL1 CLL cells were purified from mouse spleens by negative selection using CD43 (Ly48) and Pan-B magnetic beads (Miltenyi Biotech), respectively, according to the manufacturer’s instructions.
Flow cytometric analysis
Peripheral blood mononuclear cells (PBMCs) were blocked for 30 minutes using FBS. Cell surface staining was achieved by incubating cells at 4°C for 30 minutes with the following anti-mouse antibodies: CD3 (145-2C11; Biolegend), IgM (e-Bioscience), B220 (RA3-6B2; BD Pharmingen), CD5 (53-7.3; eBioscience), CD138 (281-2; Biolegend), CD19 (1D3; BD Pharmingen), CD4 (RM4-5; Biolegend) and CD8α (53-6.7; Biolegend). Viability staining was accomplished using DAPI exclusion during acquisition. Apoptotic cells were detected by Annexin V-PE/DAPI staining (BD Pharmingen). Acquisition of B, T and CLL cell populations was performed on a LSRII cytometer (BD Biosciences) harboring a custom configuration for the Wistar Institute. Cytometry data was analyzed using FlowJo software version 7.6.1 (Tree Star Inc.).
Antibodies and reagents
Polyhistidine-tagged mouse IRE-1 (a.a. 21–445) and mouse STING (a.a. 139–379) proteins were expressed and purified from BL21(DE3) bacterial cells by Ni-NTA affinity column chromatography (Qiagen) followed by size exclusion column chromatography (GE Healthcare). Polyclonal antibodies against mouse IRE-1 or mouse STING were generated in rabbits, and affinity-purified against recombinant proteins. Antibodies to phospho-IRF3 (Cell Signaling), IRF3 (Cell Signaling), phospho-STAT1 Y701 (Cell Signaling), IRE-1 (Cell Signaling), XBP-1 (Cell Signaling), GRP94 (Stressgen), calnexin (Stressgen), caspase 9 (Cell Signaling), cleaved caspase 9 (Cell Signaling), caspase 3 (Cell Signaling), cleaved caspase 3 (Cell Signaling), caspase 7 (Cell Signaling), cleaved caspase 7 (Cell Signaling), PARP (Cell Signaling), MCL1 (Cell Signaling), AIP1 (Cell Signaling) cleaved PARP (Cell Signaling), p97 (Fitzgerald) and actin (Sigma) were obtained commercially. Polyclonal antibodies against BiP/GRP78, PDI and class I MHC molecules were generated in rabbits. LPS (Sigma), 9-Oxo-10(9H)-acridineacetic acid (10-carboxymethyl-9-acridanone, CMA) (Sigma), 5,6-dimethylxanthenone-4-acetic acid (DMXAA) (Sigma), dithiothreitol (DTT) (Sigma), brefeldin A (BFA) (Cell Signaling), recombinant IFNβ (Biolegend), CpG-1826 oligodeoxynucleotides (TIB-Molbiol), tunicamycin (Enzo Life Sciences), thapsigargin (Enzo Life Sciences), MG-132 (Enzo Life Sciences), 2′2′-cGAMP (InvivoGen), 2′3′-cGAMP (InvivoGen), c-di-UMP (InvivoGen), poly(I:C) (InvivoGen), IL2 (Biolegend), IL4 (Biolegend) and CD40L (Thermo Fisher) were purchased commercially. Subtilase cytotoxin (SubAB) was provided by Dr. James C. Paton at the University of Adelaide. We developed and synthesized the IRE-1 RNase inhibitor, B-I09 (38). 3′3′-cGAMP were chemically synthesized in house according to the known synthetic route (1,39,40).
Cell culture
Mouse B cells, Eμ-TCL1 CLL cells, A20 B-cell lymphoma cells (ATCC) and 5TGM1 multiple myeloma cells (kindly provided by Dr. Lori A. Hazlehurst) were cultured in the RPMI 1640 media (Gibco) supplemented with 10% heat-inactivated fetal bovine serum (FBS), 2 mM L-glutamine, 100 U/ml penicillin G sodium, 100 μg/ml streptomycin sulfate, 1 mM sodium pyruvate, 0.1 mM non-essential amino acids, and 0.1 mM β-mercaptoethanol (β-ME). 5TGM1 cells were tested for the secretion of immunoglobulin and the surface expression of plasma cell marker, CD138, every 6 months. Mouse embryonic fibroblasts (MEFs), IRE-1−/− MEFs, XBP-1−/− MEFs, B16 melanoma (ATCC), Hepa 1–6 hepatoma (ATCC), LL/2 Lewis lung carcinoma (ATCC) were cultured in Dulbecco’s Modified Eagle’s Medium (Gibco) with the same supplemental nutrients. All our cell lines are negative for mycoplasma contamination.
Deletion of the STING gene in 5TGM1 and A20 cells with zinc finger nucleases (ZFN) and establishment of STING-null 5TGM1 and A20 cells
ZFN mRNA reagents specific to mouse STING (TMEM173) were designed, assembled and tested for functionality using CompoZr® fluorescent protein (FP)-linked ZFN technology (Sigma-Aldrich, CSTZFN). The ZFN target sequence (cut site in lowercase) is: GGCCTGGTCATACTACATtgggtaCTTGCGGTTGATCTT. One million of A20 or 5TGM1 cells were combined with ZFNs and Nucleofector Solution V (Lonza, VACA-1003) and nucleofected using the Amaxa Nucleofector I device (Lonza) with program L-013. The nucleofected cells were allowed to recover for 48 h. FP-expressing cells were collected in a pool via FACS and a portion was used for genomic DNA purification. STING (TMEM173) was amplified with JumpStart™ REDTaq® ReadyMix™ Reaction Mix (Sigma-Aldrich, P0982) with the primer pair FWD 5′-CAAGAGAAGGGCTTTGGACA-3′ and REV 5′-GCTCCTGCCTCAAAGATCAC-3′ using the thermal cycle program: 95°C for 5 min; 35 cycles: 95°C for 30 sec, 60°C for 30 sec, 72°C for 45 sec; 72°C for 5 min; and 4°C hold. The resulting PCR product was denatured, re-annealed, and digested using Surveyor® Mutation Detection Kit (IDT, 706025) according to manufacturer instructions. Digested heteroduplexed DNA was resolved on a 10% TBE gel to verify the cleavage of the 326 bp product into 181 bp and 145 bp fragments (see Supplementary Fig. 5). 5TGM1 STING-ZFN and A20 STING-ZFN cells were cloned via limited dilution and cultured in the RPMI 1640 media (Gibco) with supplements described above.
Mass Spectrometry
Protein bands were stained with Coomassie Brilliant Blue G-250, excised, reduced, alkylated, and digested with trypsin (Promega). Reverse phase liquid chromatography tandem mass spectrometry (LC-MS/MS) analysis was performed by the Wistar Proteomics Facility using a Q Exactive HF mass spectrometer (Thermo Scientific) coupled with a Nano-ACQUITY UPLC system (Waters). Eluted peptides were analyzed by the mass spectrometer set to repetitively scan m/z from 400 to 2000 in positive ion mode. The full MS scan was collected at 70,000 resolution followed by data-dependent MS/MS scans at 17,500 resolution on the 20 most abundant ions exceeding a minimum threshold of 10,000. Peptide match was set as preferred, exclude isotopes option and charge-state screening were enabled to reject singly and unassigned charged ions. MS data were analyzed with MaxQuant 1.5.2.8 (Ref: PMID 19029910). MS/MS spectra were searched against the mouse UniProt protein database using full tryptic specificity with up to two missed cleavages, static carboxamidomethylation of Cys, and variable oxidation of Met, protein N-terminal acetylation and phosphorylation on Ser, Thr and Tyr. Modified peptides were required to have a minimum score of 40. Consensus identification lists were generated with false discovery rates of 1% at protein, peptide and site levels. MS/MS assignment of phosphorylated peptides were manually inspected and peaks were labeling using pLabel (pfind.ict.ac.cn).
Protein isolation, immunoprecipitation, dephosphorylation and immunoblotting
Cells were lysed in RIPA buffer (10 mM Tris-HCl, pH 7.4; 150 mM NaCl; 1% NP-40; 0.5% sodium deoxycholate; 0.1% SDS; 1 mM EDTA) supplemented with protease inhibitors (Roche) and phosphatase inhibitors. Protein concentrations were determined by BCA assays (Pierce). In some experiments, target proteins were immunoprecipitated with antibodies together with Protein G-agarose beads (Sigma), and bead-bound proteins were dephosphorylated using calf intestinal alkaline phosphatase (CIP, New England Biolabs) or lambda protein phosphatase (λPPase, New England Biolabs). Samples were boiled in SDS-PAGE sample buffer (62.5 mM Tris-HCl, pH 6.8; 2% SDS; 10% glycerol; 0.1% bromophenol blue) with β-ME and analyzed by SDS-PAGE. Proteins were transferred to nitrocellulose membranes, blocked in 5% non-fat milk (wt/vol in PBS), and immunoblotted with indicated primary antibodies and appropriate horseradish peroxidase-conjugated secondary antibodies. Immunoblots were developed using Western Lighting Chemiluminescence Reagent (Perkin-Elmer).
Pulse chase experiments, immunoprecipitation and protein deglycosylation
Cells were starved in methionine- and cysteine-free media containing dialyzed serum for 1 h, then pulse-labeled with 250 μCi/ml [35S]-methionine and [35S]-cysteine (Perkin-Elmer) for indicated times. After labeling, cells were incubated in the chase medium containing unlabeled methionine (2.5 mM) and cysteine (0.5 mM). In some experiments, 3′3′-cGAMP was added in the chase medium. At the end of each chase interval, cells were lysed in RIPA buffer containing protease inhibitors. Pre-cleared lysates were incubated with an anti-mouse STING or anti-class I MHC antibody, together with Protein G-agarose beads. Bead-bound proteins were eluted using glycoprotein denaturing buffer (0.5% SDS, 40 mM DTT) or reducing Laemmli SDS-PAGE sample buffer. Enzymatic deglycosylation of proteins was achieved by denaturation of the immunoprecipitates in glycoprotein denaturing buffer at 95°C for 10 min, followed by addition of sodium citrate (pH 5.5) to a final concentration of 50 mM, and incubated with Endo H (New England Biolabs) at 37°C for 3 h. Alternatively, sodium phosphate (pH 7.5) and NP-40 were added to the denatured cell lysates to a final concentration of 50 mM and 1%, respectively, and the mixture was incubated with PNGase F (New England Biolabs) at 37°C for 3 h. Protein samples were then analyzed by SDS-PAGE and visualized by autoradiography. Densitometric quantification of radioactivity was performed on a PhosphorImager (Fujifilm BAS-2500) using Image Reader BAS-2500 V1.8 software (Fujifilm) and Multi Gauge V2.2 (Fujifilm) software for analysis.
Reverse transcription and polymerase chain reaction (PCR)
Total RNA was isolated using TRIzol reagent (Invitrogen). Complementary DNA was synthesized from RNA using Superscript II reverse transcriptase (Invitrogen). The following sets of primers were used together with Platinum Taq DNA polymerase (Invitrogen) in PCR to detect the expression of mouse IFNα (CCA CAG GAT CAC TGT GTA CCT GAG A and CTG ATC ACC TCC CAG GCA CAG); mouse IFNβ (CAT CAA CTA TAA GCA GCT CCA and TTC AAG TGG AGA GCA GTT GAG) and mouse GAPDH (CTC ATG ACC ACA GTC CAT GC and CAC ATT GGG GGT AGG AAC AC).
Immunofluorescence staining and confocal microscopy
2 × 10⁴ ~ 5 × 10⁴ 5TGM1 or 5TGM1 STING-ZFN cells were seeded on a coverglass, treated with 3′3′-cGAMP for indicated times, spun down onto the coverglass (1,200 rpm; 10 minutes), fixed in the fixation solution (acetone : methanol = 4 : 6) at −20 °C for 15 minutes, and air-dried. Cells were rehydrated with PBS, blocked in 3% BSA (in PBS), and incubated with rabbit anti-STING and mouse anti-Man2A1 (Mannosidase II; Biolegend) primary antibodies and subsequently with Alexa 488-conjugated goat anti-rabbit (Invitrogen Molecular Probes) and Alexa 594-conjugated goat anti-mouse (Life Technologies) secondary antibodies. The coverglass was mounted on a glass slide and cells were observed using a Leica TCS SP5 II confocal microscope.
Cell proliferation XTT assays
Appropriate numbers of cells were suspended in phenol red-free culture media, seeded in 96-well cell culture plates, and treated with STING agonists, TLR ligands or other chemical compounds. Every 24 hours after the treatment, cells were spun down and proliferation was assessed by XTT assays (Roche) according to the manufacturer’s instructions. Briefly, 50 μl XTT labeling reagent, 1 μl electron-coupling reagent and 100 μl phenol red-free culture media were combined and applied to each well of the 96-well plates. Cells were then incubated for 4 h in a CO2 incubator to allow for the yellow tetrazolium salt XTT to be cleaved by mitochondrial dehydrogenases of metabolic active cells to form the orange formazan dye, which can be quantified at 492 nm using a BioTek Synergy H1 MicroPlate Reader.
In vivo treatment of mice with 3′3′-cGAMP
The peripheral blood of Eμ-TCL1 mice was collected by submandibular bleeding. Eμ-TCL1 Mice with high CLL burden were identified by measuring lymphocyte numbers using a HemaTrue Hematology Analyzer (HESKA) and examining the percentage of CLL cells in PBMCs. These mice received intraperitoneal injections with 3′3′-cGAMP (10 mg/kg) dissolved in 20% DMSO in PBS on Days 1, 2, 3, 4, 5, 8, 9, 10, 11, 12, 15, 16, 17, 18 and 19. Lymphocyte numbers in their peripheral blood were measured on Days 7, 14 and 21. KaLwRij mice were intravenously injected with 5 × 10⁶ 5TGM1 or 5TGM1 STING-ZFN multiple myeloma cells on D0; intraperitoneally injected with 3′3′-cGAMP (10 mg/kg) on Days 3, 4, 5, 6, 7, 10, 11, 12, 13, 14, 17, 18, 19, 20 and 21; and monitored for survival. Immunodeficient NSG mice were subcutaneously injected with 5 × 10⁶ 5TGM1 multiple myeloma cells on D0; intraperitoneally injected with 3′3′-cGAMP (10 mg/kg) on Days 1, 2, 3, 4, 5, 8, 9, 10, 11, 12, 15, 16, 17, 18 and 19; and monitored for the size of tumor and weight at the indicated times.
Statistics
The Kaplan-Meier analysis was used to evaluate mouse survival data. A _p_-value of less than 0.05 was considered significant.
Study approval
All experiments involving the use of mice were performed following protocols approved by the Institutional Animal Care and Use Committee (IACUC) at the Wistar Institute.
Results
IRE-1 associates with STING
To investigate the interacting proteins of IRE-1, we generated several rabbit polyclonal antibodies against the luminal domain of IRE-1 (a.a. 21~445). Affinity-purified IRE-1 antibodies were used to immunoprecipitate IRE-1 together with its interaction partners in lipopolysaccharide (LPS)-stimulated wild-type mouse B cells. The immunoprecipitated protein complex was analyzed on an SDS-PAGE gel. A prominent ~35 kDa protein band co-immunoprecipitated with IRE-1 was excised from the gel (Supplementary Fig. 1A). After in-gel proteolytic digestion, the samples were subjected to peptide sequencing with LC-MS/MS. STING was identified as an associated protein of IRE-1 (Supplementary Fig. 1B). We generated rabbit polyclonal antibodies against the cytoplasmic domain of mouse STING (a.a. 139–379). To confirm that IRE-1 interacts with STING, we performed immunoprecipitations using anti-IRE-1 or anti-STING antibodies in IRE-1−/− MEFs (mouse embryonic fibroblasts), 5TGM1 cells (mouse multiple myeloma line expressing high levels of IRE-1), and A20 cells (mouse B cell lymphoma line expressing low levels of IRE-1). Proteins immunoprecipitated with the anti-IRE-1 antibody were immunoblotted with anti-IRE-1 or anti-STING antibodies (Fig. 1, A and B), and those immunoprecipitated with the anti-STING antibody were also immunoblotted with anti-STING or anti-IRE-1 antibodies (Fig. 1, C–D). The association of IRE-1 and STING was preserved not only in 1% NP-40 buffer but also in stringent RIPA buffer containing 0.1% SDS, 0.5% sodium deoxycholate, and 1% NP-40.
Figure 1. IRE-1 associates with STING, and 3′3′-cGAMP is a potent agonist of STING.
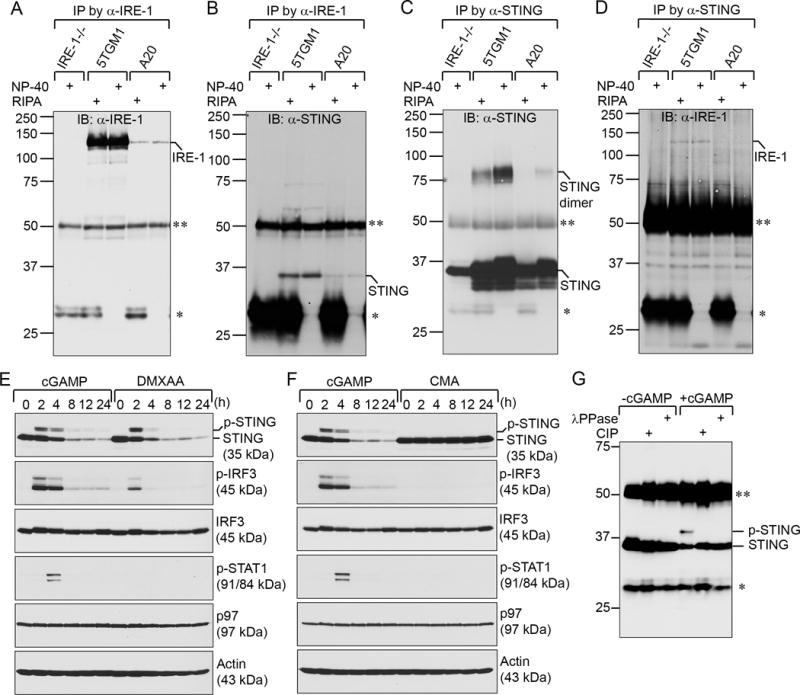
IRE-1 −/− MEFs, 5TGM1 cells, and A20 cells were lysed in RIPA buffer or lysis buffer containing 1% NP-40. Immunoprecipitations were performed with anti-IRE-1 (A–B) or anti-STING (C–D) antibodies. Proteins immunoprecipitated with anti-IRE-1 were immunoblotted with an anti-IRE-1 (A) or anti-STING (B) antibody. Proteins immunoprecipitated with anti-STING antibodies were immunoblotted with an anti-STING (C) or anti-IRE-1 (D) antibody. (E–F) 3′3′-cGAMP activates STING more efficiently than DMXAA (E) and CMA (F). WT MEFs were treated with 20 μM 3′3′-cGAMP, 20 μM DMXAA, or 20 μM CMA for indicated times and lysed for analysis of indicated proteins by immunoblots. AAA ATPase (p97) and actin serve as loading controls. (G) WT MEFs were untreated or treated with 20 μM 3′3′-cGAMP for 4 h. Cell lysates were immunoprecipitated by an anti-STING antibody. Bead-bound immunoprecipitated proteins were further treated with calf intestinal phosphatase (CIP) or λ protein phosphatase (λ PPase) for 3 h, and immunoblotted with an anti-STING antibody. Data in this figure are representative of three independent experiments. **: immunoglobulin heavy chain; *: immunoglobulin light chain.
3′3′-cGAMP is a potent STING agonist
Purine-containing cyclic dinucleotides 2′2′-cGAMP, 3′3′-cGAMP and 2′3′-cGAMP with distinct phosphodiester linkages can bind to STING; however, c-di-UMP contains a smaller pyrimidine base and does not bind to STING (Supplementary Fig. 2, A–D; (8,9)). DMXAA and CMA are chemical compounds that bind to mouse but not human STING (Supplementary Fig. 2, E–F; (9,23,24,41,42)). We chemically synthesized 3′3′-cGAMP in large quantities to support our studies, and its identity and purity are demonstrated by nuclear magnetic resonance and reversed-phase high-performance liquid chromatography, respectively (Supplementary Fig. 3). We treated MEFs with 3′3′-cGAMP, DMXAA and CMA, and determined the capability of these compounds in activating phosphorylation of IRF3, which leads to the production of type I interferons (IFNα and IFNβ) and the subsequent phosphorylation of STAT1 as a result of interferon-α/β receptor (IFNAR) activation by IFNα and IFNβ in an autocrine fashion (Fig. 1, E–F). We found that in intact cells, 3′3′-cGAMP is more efficient than DMXAA in activating STING, as judged by phosphorylation of STING, IRF3 and STAT1 (Fig. 1E). The phosphorylation of STING was confirmed by treatments of immunoprecipitated STING with calf intestinal phosphatase (CIP) or λ protein phosphatase (λPPase) and disappearance of the phosphorylated STING protein band (Fig. 1G). Activation of STING by 3′3′-cGAMP or DMXAA also causes STING to degrade (Fig. 1, E–F). Although CMA was shown to bind to STING in a protein crystal structure (23), it does not activate STING in cells (Fig. 1F). Mouse STING contains only one potential N-linked glycosylation site (N41) in its luminal domain. We hypothesized that the binding of 3′3′-cGAMP in the cytoplasmic domain of STING may cause STING to expose this site for glycosylation. No N-linked glycosylation was detected in our deglycosylation experiments using endo-H or PNGase F (Supplementary Fig. 4).
The IRE-1/XBP-1 pathway is required for normal STING function
To assess whether IRE-1 is required for activation of STING, we treated wild-type and IRE-1−/− MEFs with 3′3′-cGAMP for 0, 2, 4, 8, 12, or 24 h, and detected a significantly delayed and weaker phosphorylation of STING and IRF3 in IRE-1−/− MEFs (Fig. 2A). Correspondingly, the production of IFNα and IFNβ decreased significantly (Fig. 2, B–C), leading to inefficient phosphorylation of STAT1 in IRE-1−/− MEFs (Fig. 2A). Upon 3′3′-cGAMP stimulation, STING undergoes phosphorylation and degradation (Figs. 1, E–F and 2A). Thus, we measured the half-life of STING in 3′3-cGAMP-treated cells by pulse chase experiments (Fig. 2D). STING in 3′3′-cGAMP-stimulated wild-type MEFs has a half-life of approximately 5 h, but it acquires an approximately 10-h half-life in 3′3′-cGAMP-stimulated IRE-1−/− MEFs (Fig. 2D), suggesting association with IRE-1 is critical for STING function and degradation. We examined XBP-1, a transcription factor regulated by the RNase activity of IRE-1. 3′3′-cGAMP-induced phosphorylation of STING, IRF3 and STAT1 as well as IFNβ production were similarly compromised in XBP-1−/− MEFs (Fig. 2, E–F). STING is synthesized in lesser quantity in XBP-1−/− MEFs, and is rapidly degraded upon stimulations with 3′3′-cGAMP (Fig. 2E). When wild-type and XBP-1−/− MEFs were treated with 3′3′-cGAMP for 24 h and continued to culture in fresh media for another 48 h, XBP-1−/− MEFs was unable to restore the expression levels of STING (Fig. 2G). Despite the significant reduction of 3′3′-cGAMP-induced activation of STING in IRE-1−/− and XBP-1−/− MEFs, 3′3′-cGAMP does not impact the growth of these cells as well as wild-type MEFs (Fig. 2, H–I).
Figure 2. The IRE-1/XBP-1 pathway is critical for normal STING function.
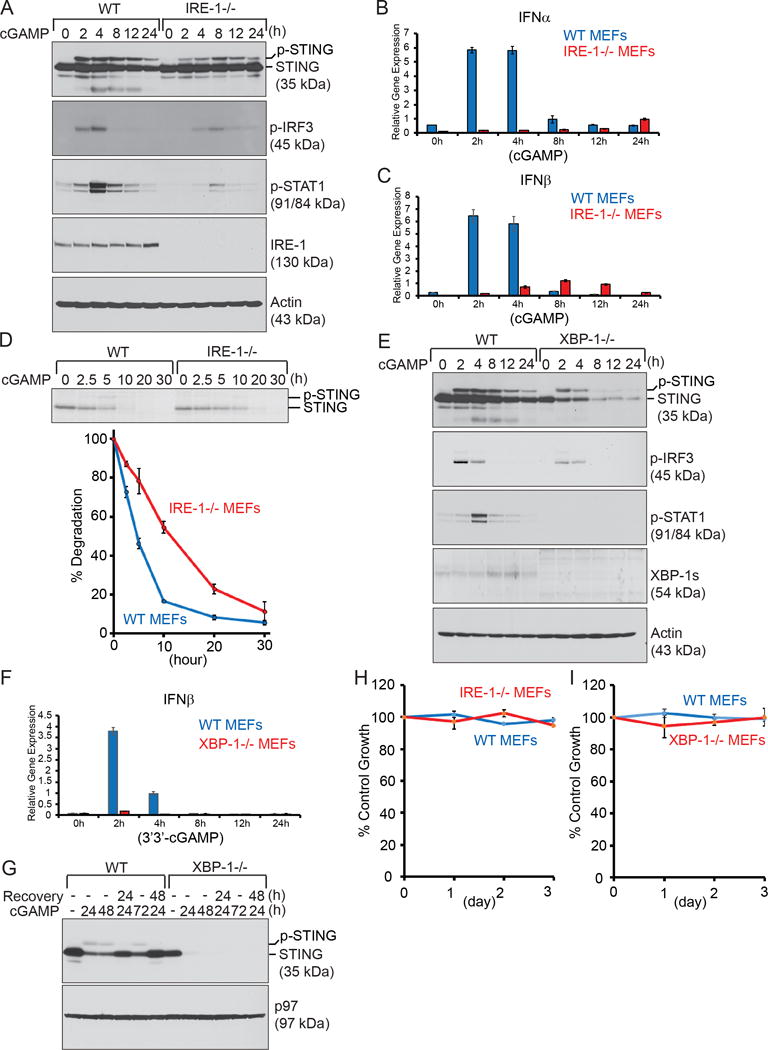
(A) WT and IRE-1−/− MEFs were treated with 20 μM 3′3′-cGAMP for indicated times and then lysed for analysis of indicated proteins by immunoblots. Data are representative of three independent experiments. (B–C) WT and IRE-1−/− MEFs were treated with 20 μM 3′3′-cGAMP for indicated times, and lysed for purification of total RNA and synthesis of cDNA. The mRNA expression levels of IFNα and IFNβ were measured by real-time quantitative PCR (RT-qPCR), performed in triplicate for each sample (n=3). Data from WT and IRE-1−/− MEFs were normalized to GAPDH (as 1) and shown as mean ± SD. Data are representative of three independent experiments. (D) WT and IRE-1−/− MEFs were radiolabeled for 4 h and chased for indicated times in the presence of 20 μM 3′3′-cGAMP. Lysates were immunoprecipitated with an anti-STING antibody, and analyzed by SDS-PAGE and autoradiography. The signal of STING was quantified by densitometry. This experiment was repeated for 3 times with similar results. (E) WT and XBP-1−/− MEFs were treated with 20 μM 3′3′-cGAMP for indicated times and lysed for analysis of indicated proteins by immunoblots. Data are representative of three independent experiments. (F) WT and XBP-1−/− MEFs treated with 20 μM 3′3′-cGAMP for indicated times were analyzed for the expression of IFNβ by RT-qPCR. Data are representative of three independent experiments. (G) WT and XBP-1−/− MEFs were treated with 20 μM 3′3′-cGAMP for 24, 48 or 72 h; some cells were treated with 20 μM 3′3′-cGAMP for 24 h, washed with fresh media twice, and incubated in fresh media for additional 24 or 48 h. Cells were lysed for analysis of indicated proteins by immunoblots. Results are representative of three independent experiments. (H–I) WT and IRE-1−/−MEFs (H) or WT and XBP-1−/− MEFs (I) were untreated or treated with 3′3′-cGAMP (20 μM) for a course of 3 days, and subjected to XTT assays at the end of each day. Percentages of growth were determined by comparing treated groups with untreated control groups. Each data point derived from four independent groups receiving exactly the same treatment was plotted as mean ± SD. Results are representative of three independent experiments.
B cells respond to STING agonists by undergoing mitochondria-mediated apoptosis
To recapitulate compromised STING activation in XBP-1KO B cells, we treated naïve B cells purified from XBP-1f/f and CD19Cre/XBP-1f/f mice with 3′3′-cGAMP. Contrary to our results from MEFs, STING in XBP-1WT and XBP-1KO B cells does not undergo degradation upon stimulations by 3′3′-cGAMP (Fig. 3A). B cells initiate rapid apoptosis shortly after 3′3′-cGAMP stimulations, as judged by cleavage of a caspase substrate, PARP (Fig. 3A). 3′3′-cGAMP but not c-di-UMP induces cytotoxicity in B cells in a dose-dependent fashion (Fig. 3B), suggesting that cytotoxicity is a result of STING binding (also see below). LPS and CpG can induce B cell proliferation and differentiation by engaging Toll-like receptor (TLR) 4 and TLR9, respectively (Fig. 3C). We investigated whether STING agonists have an impact on LPS- or CpG-induced cell growth. 2′2′-, 2′3′-, and 3′3′-cGAMP may have different binding affinities to STING (5,9). Co-incubation of 2′2′-cGAMP, 2′3′-cGAMP or 3′3′-cGAMP retards LPS- or CpG-induced B cell proliferation (Fig. 3, D–E). To examine the impact of STING agonists on antibody-secreting plasma cells, we first incubated purified naïve B cells in LPS or CpG for 48 h to trigger their differentiation into plasmablasts, and subsequently treated these cells with 3′3′-cGAMP in a dose-dependent (Fig. 3F) and time-dependent (Fig. 3, G–H) manner. Similarly, 3′3′-cGAMP does not induce the degradation of STING in these plasmablasts, but it triggers mitochondria-dependent apoptosis as evidenced by the cleavage of caspase 9, caspase 3, caspase 7 and PARP (Fig. 3, F–H). Treatment of plasmablasts with 3′3′-cGAMP for 24 h turns almost all plasmablasts into Annexin V+/DAPI+ apoptotic cells (Fig. 3I). 3′3′-cGAMP also potently suppresses IL4- and CD40L-induced B cell growth (Fig. 3J).
Figure 3. STING agonists induce mitochondria-initiated apoptosis in B cells.
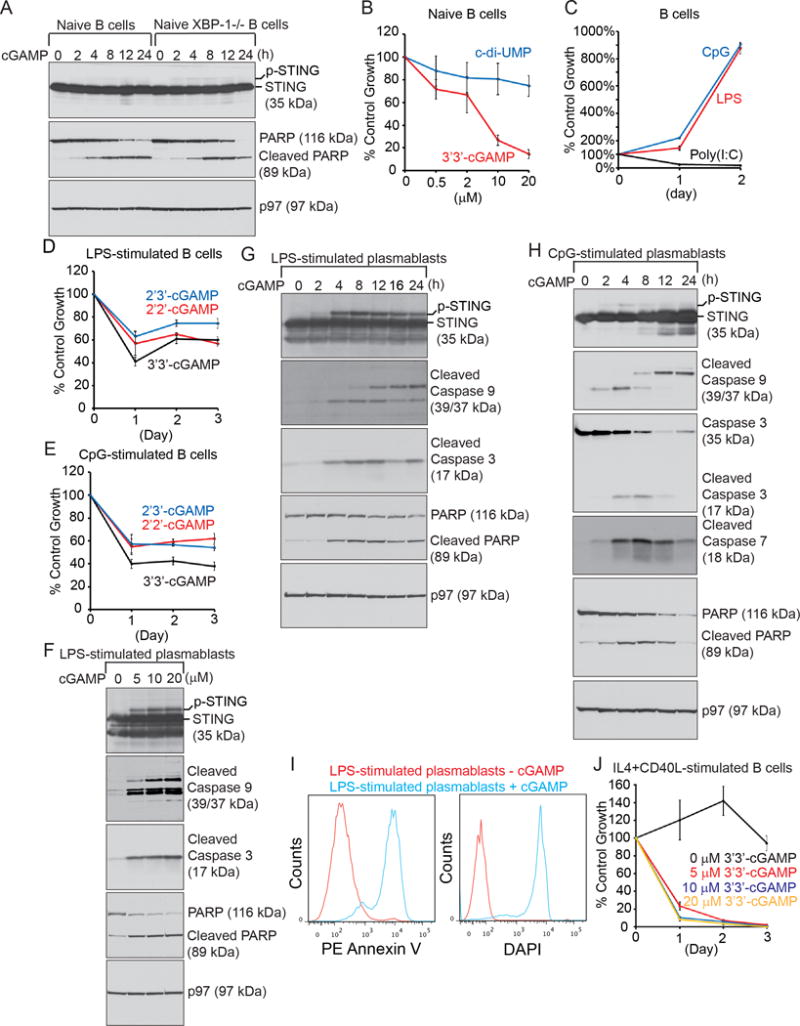
(A) Freshly purified B cells from XBP-1WT and XBP-1KO spleens were treated with 20 μM 3′3′-cGAMP, and lysed for analysis by immunoblots for indicated proteins. Results shown in each immunoblot are representative of three independent experiments. For each experiment, naïve XBP-1WT and XBP-1KO B cells were purified and pooled from at least two mouse spleens. (B) Naïve B cells purified from mouse spleens were untreated or treated with c-di-UMP or 3′3′-cGAMP at indicated concentrations for 24 h, and subjected to XTT assays. Percentages of growth were determined by comparing treated with untreated groups. Each data point derived from four independent groups receiving exactly the same treatment was plotted as mean ± SD. Data are representative of three independent experiments. (C) Naïve B cells were cultured in the presence of LPS (20 μg/ml), CpG-1826 (0.5 μM) or poly(I;C) (10 μg/ml) for 2 days. At the end of each day, cells were subjected to XTT assays. Percentages of growth were determined by comparing colorimetric reading on Day 1 and Day 2 with that on Day 0. Each data point derived from four independent groups receiving the same treatment was plotted as mean ± SD. Results shown are representative of three independent experiments. (D–E) Naïve B cells were cultured for 3 days in the presence of LPS (20 μg/ml) alone or LPS plus 15 μM 2′2′-cGAMP, 2′3′-cGAMP or 3′3′-cGAMP (D). Similarly, naïve B cells were cultured in the presence of CpG-1826 (0.5 μM) alone or CpG-1826 plus three types of cGAMP (15 μM) (E). At the end of each day, cells were subjected to XTT assays. Percentages of growth were determined by comparing cells treated with LPS plus cGAMP (or CpG-1826 plus cGAMP) with those treated with LPS (or CpG-1826) alone. Each data point derived from four independent groups receiving the same treatment was plotted as mean ± SD. Data are representative of three independent experiments. (F) Naïve B cells were stimulated for 2 days in the presence of LPS to allow for differentiation into plasmablasts. Plasmablasts were subsequently treated with indicated concentrations of 3′3′-cGAMP in the presence of LPS for additional 12 h, and lysed for analysis of indicated proteins by immunoblots. Data are representative of three independent experiments. (G–H) Naïve B cells were stimulated for 2 days in the presence of LPS (G) or CpG-1826 (H) to allow for differentiation into plasmablasts, which were subsequently treated with 15 μM 3′3′-cGAMP in the presence of LPS or CpG-1826 for indicated times. Lysates were analyzed for indicated proteins by immunoblots. Data are representative of three independent experiments. (I) B cells stimulated with LPS for 2 days were untreated or treated with 15 μM 3′3′-cGAMP for additional 24 h, stained with Annexin V-PE and DAPI, and analyzed by flow cytofluorometry. Data are representative of three independent experiments. (J) Naïve B cells were cultured in the presence of IL4 (100 ng/ml) plus CD40L (50 ng/ml) together with 3′3′-cGAMP at indicated concentrations for 3 days. At the end of each day, cells were subjected to XTT assays. Percentages of growth were determined by comparing colorimetric reading on each day with that on Day 0. Each data point derived from four independent groups receiving the same treatment was plotted as mean ± SD. Results shown are representative of three independent experiments.
STING agonists are cytotoxic to B cell leukemia, lymphoma and multiple myeloma
Because STING agonists induced apoptosis in primary B cells and plasmablasts, we investigated whether these agonists would also be cytotoxic to primary B-cell chronic lymphocytic leukemia freshly purified from Eμ-TCL1 mice (38,43,44), A20 B-cell lymphoma and 5TGM1 multiple myeloma. We treated these malignant B cells with 3′3′-cGAMP and c-di-UMP. 3′3′-cGAMP but not c-di-UMP was able to induce apoptosis in malignant B cells (Fig. 4, A–B). When 5TGM1 multiple myeloma cells were treated with increasing concentrations of 3′3′-cGAMP for 12 h, we clearly detected a dose-dependent activation of mitochondria-mediated apoptosis, as shown by the decreased expression of MCL1 and increased cleavage of caspase 9, caspase 3 and PARP (Fig. 4C). Increased apoptosis of 5TGM1 cells is associated with the increased degradation of IRE-1 and XBP-1 in a dose-dependent manner (Fig. 4C). In time-course experiments where 5TGM1 cells were treated with 3′3′-cGAMP, we observed time-dependent activation of mitochondria-mediated apoptosis, accompanied by the time-dependent decreased expression of IRE-1 and increased expression of AIP1, an IRE-1-associated proapoptotic protein (45) (Fig. 4D).
Figure 4. STING agonists induce mitochondria-initiated apoptosis in B cell malignancies.
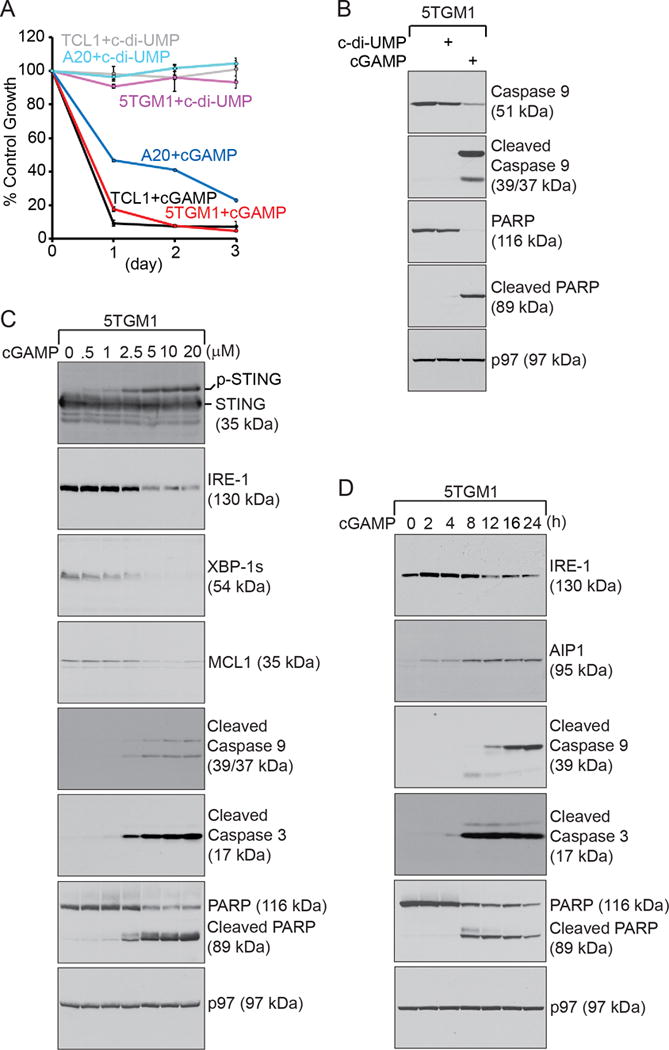
(A) Eμ-TCL1 CLL, A20 B-cell lymphoma, and 5TGM1 multiple myeloma cells were untreated or treated with c-di-UMP (15 μM) or 3′3′-cGAMP (15 μM) for 3 days, and subjected to XTT assays at the end of each day. Percentages of growth were determined by comparing treated with untreated groups. Each data point derived from four independent groups receiving exactly the same treatment was plotted as mean ± SD. Results are representative of three independent experiments. (B) 5TGM1 cells were cultured for 24 h in the presence of 15 μM c-di-UMP or 3′3′-cGAMP, and lysed for analysis of indicated proteins by immunoblots. (C) 5TGM1 cells were cultured for 12 h in the presence of 3′3′-cGAMP at indicated concentrations, and lysed for analysis of indicated proteins by immunoblots. (D) 5TGM1 cells were cultured in the presence of 15 μM 3′3′-cGAMP for indicated times, and lysed for analysis of indicated proteins by immunoblots. Data shown in immunoblots in this figure are representative of three independent experiments.
STING agonists induce apoptosis in malignant B cells through binding to STING
To test whether 3′3′-cGAMP-induced apoptosis in malignant B cells is through binding to STING, we designed specific zinc finger nucleases to disrupt the mouse STING gene in A20 and 5TGM1 cell lines (see Materials and Methods; Supplementary Fig. 5). Our ZFN design incorporates a GFP reporter to facilitate enrichment of STING-ZFN-positive cells after Nucleofection by FACS. By limited dilution cloning, we established STING-null A20 (A20 STING-ZFN) and 5TGM1 (5TGM1 STING-ZFN) clones (Fig. 5A). We treated 5TGM1 STING-ZFN and A20 STING-ZFN cells with increasing concentration of 3′3′-cGAMP for a course of 72 h. Both STING-ZFN cell lines resist to 3′3′-cGAMP-induced apoptosis (Fig. 5, B–C; Supplementary Fig. 6).
Figure 5. STING-null malignant B cells are resistant to 3′3′-cGAMP-induced apoptosis, possibly resulted from the slow degradation and aggregations of STING.
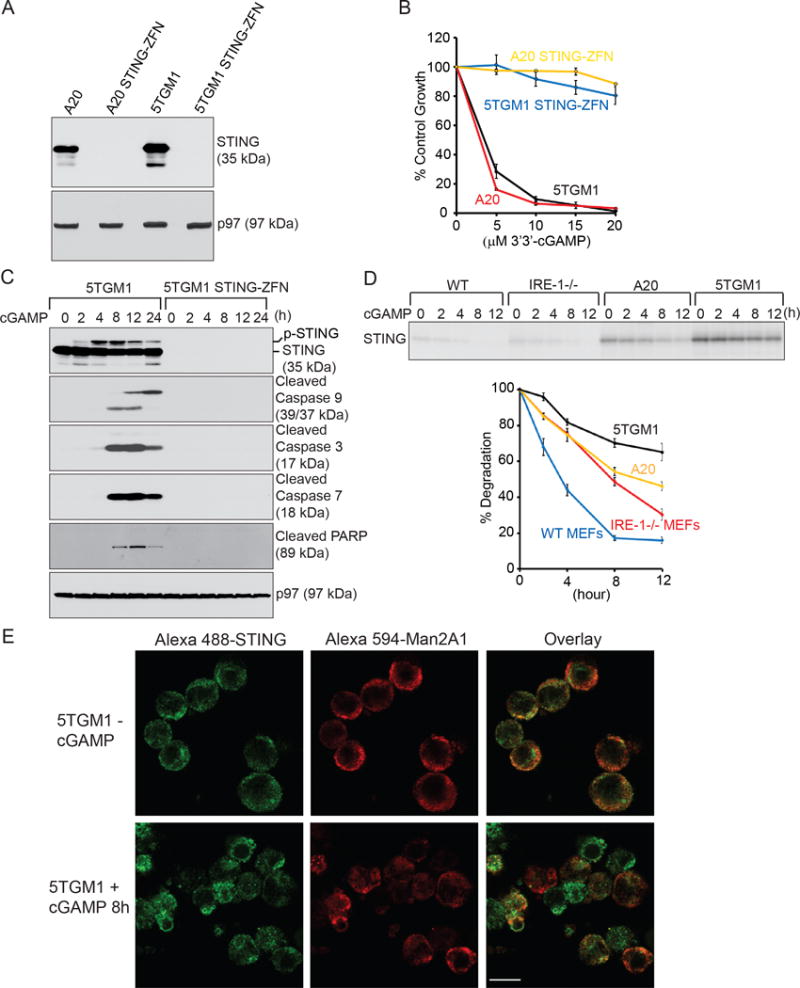
(A) A20, A20 STING-ZFN, 5TGM1 and 5TGM1 STING-ZFN cells were lysed for analysis of the expression of STING and p97 by immunoblots. Data are representative of three independent experiments. (B) A20, A20 STING-ZFN, 5TGM1 and 5TGM1 STING-ZFN cells were untreated or treated for 72 h with 3′3′-cGAMP at indicated concentrations, and subjected to XTT assays. Percentages of growth were determined by comparing treated with untreated groups. Each data point derived from four independent groups receiving exactly the same treatment was plotted as mean ± SD. Results are representative of three independent experiments. (C) 5TGM1 and 5TGM1 STING-ZFN cells were treated with 20 μM 3′3′-cGAMP for indicated times and lysed for analysis of indicated proteins by immunoblots. Data are representative of three independent experiments. (D) Wild-type MEFs, IRE-1−/− MEFs, A20 lymphoma and 5TGM1 myeloma cells were radiolabeled for 12 h, and chased for indicated times in the presence of 20 μM 3′3′-cGAMP. Lysates of equal radioactive counts from each sample were immunoprecipitated with an anti-STING antibody, and analyzed by SDS-PAGE and autoradiography. The signal of STING was quantified by densitometry, and data were plotted. This experiment was repeated for 3 times with similar results. (E) 5TGM1 cells were untreated or treated with 20 μM 3′3′-cGAMP for 8h, co-immunostained with anti-STING and anti-Man2A1 antibodies, and analyzed by confocal microscopy. Scale bar: 10 μm.
STING does not degrade efficiently in malignant B cells, but undergoes phosphorylation and forms aggregates upon stimulations with 3′3′-cGAMP
To illustrate the difference between MEFs and malignant B cells in the degradation of STING upon 3′3′-cGAMP stimulations, we performed pulse chase experiments using wild-type MEFs, IRE-1−/− MEFs, A20 and 5TGM1 cells, and immunoprecipitated STING using anti-STING antibodies. When compared with wild-type and IRE-1−/− MEFs, A20 and 5TGM1 cells synthesize more STING and are less efficient in degrading it upon 3′3′-cGAMP stimulations (Fig. 5D). To compare the phosphorylation status of STING upon 3′3′-cGAMP stimulations, we chemically crosslinked anti-mouse STING antibodies to protein G-Sepharose beads by dimethyl pimelimidate (DMP), used these beads to immunoprecipitate STING from un-stimulated and 3′3′-cGAMP-stimulated wild-type MEFs and 5TGM1 cells, and analyze the immunoprecipitates by LC-MS/MS after tryptic digestion. By extracted ion chromatograms (XIC) analyses, we detected in two independent experiments that S357 and S365 of STING were phosphorylated in 3′3′-cGAMP-treated 5TGM1 samples, and that S365 of STING was phosphorylated in 3′3′-cGAMP-treated MEFs (Supplementary Fig. 7, A–B). We did not detect phosphorylation of STING in untreated samples, or obtain evidence showing that S357 of STING was phosphorylated in 3′3′-cGAMP-treated MEFs. To investigate the intracellular localization of STING in malignant B cells after stimulations with 3′3′-cGAMP, we demonstrated that our affinity-purified anti-mouse STING antibody is suitable for immunofluorescence staining because the immunofluorescence signal of STING was observed only in wild-type 5TGM1 but not 5TGM1 STING-ZFN cells (Supplementary Fig. 8). STING forms aggregates in 3′3′-cGAMP-stimulated 5TGM1 cells undergoing rapid apoptosis (Fig. 5E, 5C and 4D). These aggregates colocalized with alpha-mannosidase II (Man2A1) in the ER and Golgi apparatus (Fig. 5E).
The production of type I interferons is not responsible for 3′3′-cGAMP-induced apoptosis in malignant B cells
While 5TGM1 STING-ZFN and A20 STING-ZFN cells do not produce IFNα and IFNβ in response to 3′3′-cGAMP stimulations, both STING-proficient 5TGM1 and A20 cells can produce IFNα and IFNβ in the first few hours of 3′3′-cGAMP stimulations before they succumb to death (Fig. 6, A–D). To examine whether type I interferons can account for 3′3′-cGAMP-induced apoptosis, we treated 5TGM1 and A20 cells with increasing concentrations of recombinant IFNβ for 24 h. Even at the non-physiologically high concentration of 200 ng/mL, the 24-h IFNβ treatment accounts for approximately 30% growth inhibition (Fig. 6E) but not apoptosis, as confirmed by no evidence of caspase 9, caspase 3 and PARP cleavage (Fig. 6F). This does not account for more than 50% apoptosis in A20 cells and 80% apoptosis in 5TGM1 cells after treatments with 3′3′-cGAMP for 24 h (Fig. 4A).
Figure 6. The IRE-1/XBP-1 pathway but not type I interferon is responsible for 3′3′-cGAMP-induced apoptosis; STING agonists do not inhibit the growth of melanoma, hepatoma, and Lewis lung cancer cells.
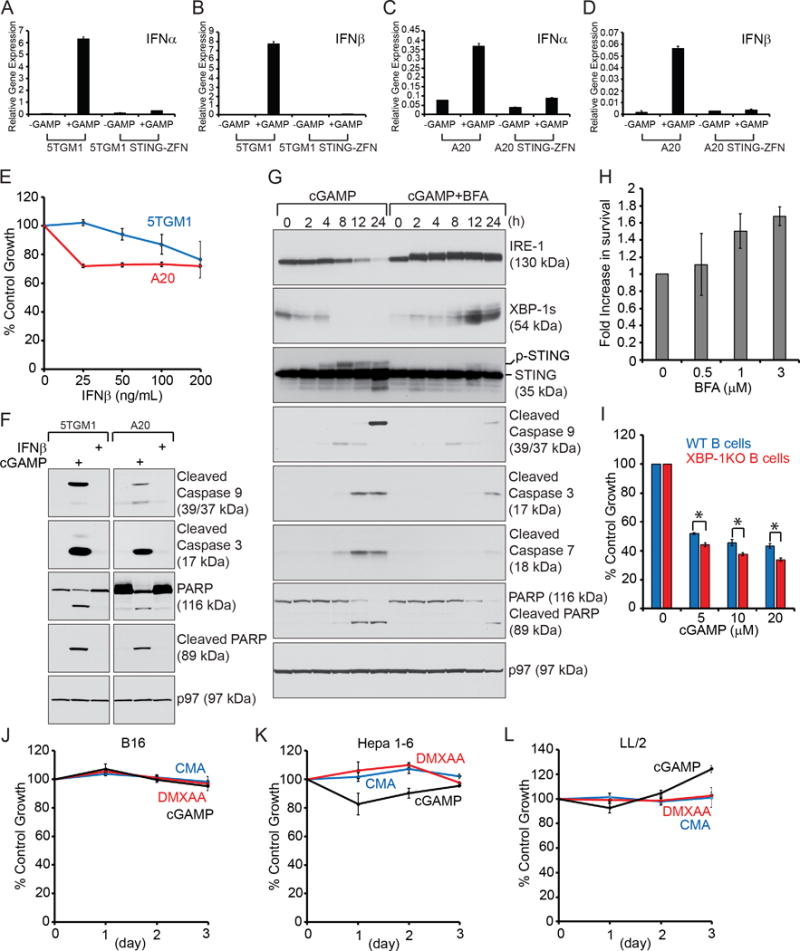
(A–D) 5TGM1 and 5TGM1 STING-ZFN cells (A–B) or A20 and A20 STING-ZFN cells (C–D) were untreated or treated with 20 μM 3′3′-cGAMP for 4 h. Cells were lysed for RNA extraction and analyzed by RT-qPCR for the expression of IFNα and IFNβ. Data were normalized to GAPDH and shown as mean ± SD. Data are representative of three independent experiments. (E) 5TGM1 and A20 cells were untreated or treated with IFNβ of indicated concentrations for 24 h, and subjected to XTT assays. Percentages of growth were determined by comparing treated with untreated groups. Each data point derived from four independent groups receiving exactly the same treatment was plotted as mean ± SD. Data are representative of three independent experiments. (F) 5TGM1 and A20 cells were treated with 20 μM 3′3′-cGAMP or 100 ng/mL IFNβ for 24 h, and lysed for analysis of indicated proteins by immunoblots. (G) 5TGM1 cells were treated with 20 μM 3′3′-cGAMP or 20 μM 3′3′-cGAMP plus 3.5 μM BFA for indicated times, and lysed for analysis of indicated proteins by immunoblots. Immunoblot data are representative of three independent experiments. (H) 5TGM1 cells were untreated or treated with 20 μM 3′3′-cGAMP or 20 μM 3′3′-cGAMP plus BFA of increasing concentrations (0, 0.5, 1 and 3 μM) for 24 h, and subjected to XTT assays. Percentages of growth were determined by comparing treated with untreated groups. Fold increase in survival was determined by comparing cells treated with 3′3′-cGAMP plus 0.5, 1 or 3 μM BFA with those treated with 3′3′-cGAMP plus 0 μM BFA (as 1). Each data point derived from four independent groups receiving exactly the same treatment was plotted as mean ± SD. Data are representative of three independent experiments. (I) Two-day LPS-stimulated XBP-1-proficient and XBP-1-deficient B cells were untreated or treated with 3′3′-cGAMP at indicated concentrations for 24 h, and subjected to XTT assays. Percentages of growth were determined by comparing treated with untreated groups. Each data point derived from four independent groups receiving exactly the same treatment was plotted as mean ± SD. Data are representative of three independent experiments. (J–L) B16 melanoma (J), Hepa 1–6 hepatoma (K), or LL/2 Lewis lung cancer (L) cells were untreated or treated with 3′3′-cGAMP (20 μM), DMXAA (20 μM) or CMA (20 μM) for 3 days, and subjected to XTT assays at the end of each day. Percentages of growth were determined by comparing treated groups with untreated groups. Each data point derived from four independent groups receiving exactly the same treatment was plotted as mean ± SD. Data are representative of three independent experiments.
Transient activation of the IRE-1/XBP-1 pathway partially rescues B cells from 3′3′-cGAMP-induced apoptosis
In light of that the IRE-1/XBP-1 pathway is suppressed in response to 3′3′-cGAMP-induced apoptosis (Fig. 4, C–D), and that B-cell leukemia, lymphoma and myeloma requires the IRE-1/XBP-1 pathway for survival (38,44,46,47), we hypothesized that transient activation of the IRE-1/XBP-1 pathway might counter 3′3′-cGAMP-induced apoptosis. We chose to use Brefeldin A (BFA) to activate the IRE-1/XBP-1 pathway, as it induces activation of IRE-1 and splicing of XBP-1 (Fig. 6G). When comparing 5TGM1 cells treated with 3′3′-cGAMP and 3′3′-cGAMP plus BFA, we observed that mitochondria-initiated apoptosis is significantly abated in 5TGM1 cells treated with 3′3′-cGAMP in combination with BFA (Fig. 6G). Increased concentrations of BFA is positively correlated with the survival of 3′3′-cGAMP-treated 5TGM1 cells (Fig. 6H). To further investigate the role of XBP-1s in 3′3′-cGAMP-inuced B cell death, we treated LPS-stimulated XBP-1-proficient and XBP-1-deficient B cells with 3′3′-cGAMP, and observed that XBP-1-deficient B cells are more susceptible to 3′3′-cGAMP-induced apoptosis (Fig. 6I). B-I09 is an inhibitor that potently suppresses the expression of XBP-1s (38). B-I09 enhances 3′3′-cGAMP-induced apoptosis in LPS-stimulated wild-type B cells and A20 cells (Supplementary Fig. 9, A–B).
STING agonists do not induce apoptosis in solid tumors and normal T cells
To investigate whether 3′3′-cGAMP exerts apoptosis in other types of cancer, we treated B16 (melanoma), Hepa 1–6 (hepatoma) and LL/2 (Lewis lung cancer) cells with 3′3′-cGAMP, DMXAA and CMA. None of the STING agonists influence the growth of these cells (Fig. 6, J–L), except that there is an approximately 20% growth inhibition in Hepa 1–6 cells after treatment with 3′3′-cGAMP for 24 h (Fig. 6K). To determine whether this was a result of cytostasis or cytotoxicity, we compared 3′3′-cGAMP-treated 5TGM1 myeloma cells with 3′3′-cGAMP-treated Hepa 1–6 cells. There is no mitochondria-mediated apoptosis observed in 3′3′-cGAMP-treated Hepa 1–6 cells (Supplementary Fig. 10A). Similar to MEFs (Fig. 1, E–F), B16, Hepa 1–6 and LL/2 cells can respond to 3′3′-cGAMP by phosphorylating and degrading STING, and inducing phosphorylation of IRF3 and STAT1 (Supplementary Fig. 10, B–D). There is also no significant change in the expression levels of IRE-1 and XBP-1 during the course of 3′3′-cGAMP stimulations (Supplementary Fig. 10, E–G). Since 3′3′-cGAMP can induce apoptosis in normal B cells, we tested whether it is also cytotoxic to normal T cells. We purified T cells from wild-type mice, treated them with 3′3′-cGAMP in the presence of IL-2 (to maintain T cell survival in culture), and observed no apoptosis in 3′3′-cGAMP-treated CD4+ or CD8+ T cells (Supplementary Fig. 11).
STING-deficient cells respond to ER stress inducers by activating the IRE-1/XBP-1 pathway and exhibit normal intracellular transport of class I MHC molecules
The association of STING with IRE-1 intrigued us to investigate whether STING is involved in activation of the IRE-1/XBP-1 pathway in response to various ER stress inducers. Each ER-stress inducer requires a distinct time duration to achieve maximal activation of the ER stress response. We stimulated 5TGM1 and 5TGM1 STING-ZFN cells for 3 h with dithiothreitol (DTT, 5 mM), thapsigargin (Tg, 2.5 μM), tunicamycin (Tu, 5 μg/mL), subtilase cytotoxin (SubAB which cleaves BiP and activates the IRE-1/XBP-1 pathway (48), 100 ng/mL), B-I09 (an IRE-1/XBP-1 pathway inhibitor (38), 20 μM), Brefeldin A (BFA, 3.5 μM) and proteasomal inhibitor (MG132, 50 μM). We observed no striking difference in activation of the IRE-1/XBP-1 pathway and the expression of BiP/GRP78, GRP94, PDI and calnexin between 5TGM1 and 5TGM1 STING-ZFN cells, except the increased expression of XBP-1s in thapsigargin- and SubAB-treated 5TGM1 STING-ZFN cells (Supplementary Fig. 12A). However, this difference in the expression of XBP-1s in response to thapsigargin and SubAB was not observed between A20 and A20 STING-ZFN (Supplementary Fig. 12B). In addition, the 3-h treatments with BFA or MG132 do not induce robust activation of the IRE-1/XBP-1 pathway in A20 and A20 STING-ZFN cells (Supplementary Fig. 12B). The quality control of the ER allows only correctly folded and assembled client proteins to exit the ER and be transported to their final destinations. The class I MHC molecule is one of such proteins. To examine whether the lack of STING on the ER membrane can disrupt the quality control function of the ER, we examined the transport of class I MHC molecules in 5TGM1, 5TGM1 STING-ZFN, A20 and A20 STING-ZFN cells by pulse chase experiments (Supplementary Fig. 12, C–D). Class I MHC molecules in 5TGM1 STING-ZFN and A20 STING-ZFN acquired complex glycans in the Golgi apparatus just like those in the respective STING-proficient counterparts (Supplementary Fig. 12, C–D), suggesting a normal ER quality control function in STING-deficient cells.
Intraperitoneal injections of 3′3′-cGAMP induce leukemic regression in Eμ-TCL1 mice, prolong the survival of myeloma-grafted KaLwRij mice, and suppress myeloma growth in NSG mice
Since 3′3′-cGAMP is potent in inducing apoptosis in malignant B cells in culture (Fig. 4), we investigated whether it can similarly elicit apoptosis in B cell malignancies in mice. We identified CLL-bearing Eμ-TCL1 mice by a complete blood count (CBC). We also analyzed the ratio of B220+/CD5+ CLL cells to B220+/CD5− precancerous B cells in the gated CD3−/CD19+/IgM+ population in the peripheral blood of the Eμ-TCL1 mice by flow cytofluorometry. Only mice that carry >8000 lymphocytes per μL blood and >90% B220+/CD5+ CLL cells in the CD3−/CD19+/IgM+ population are selected for injection studies (Fig 7, A–B). We observed a dramatic leukemic regression in CLL-bearing Eμ-TCL1 mice intraperitoneally injected with 3′3′-cGAMP (10 mg/kg) solubilized in 20% DMSO in PBS, but not in those mice injected with only the vehicle (Fig. 7B). By performing immunohistochemcial staining of cleaved caspase 3, we showed that 3′3′-cGAMP induces apoptosis in the spleens of 3′3′-cGAMP-injected Eμ-TCL1 mice (Fig. 7C).
Figure 7. Intraperitoneal injections of 3′3′-cGAMP lead to leukemic regression in CLL-bearing Eμ-TCL1 mice and prolong the survival of KaLwRij mice grafted with multiple myeloma.
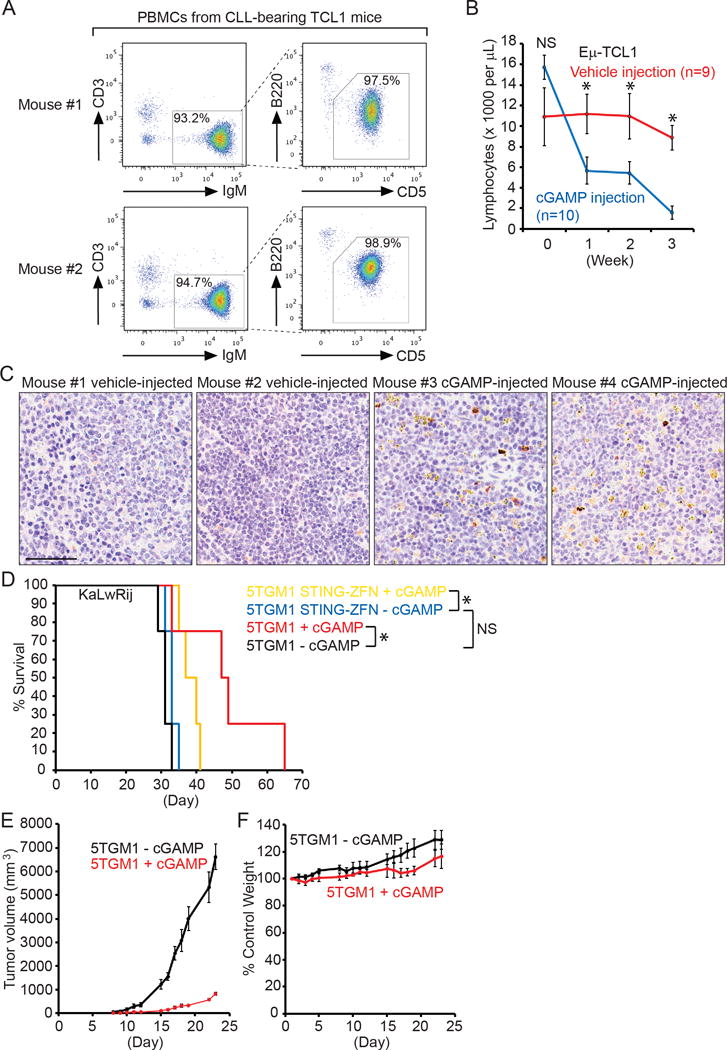
(A) PBMCs isolated from 2 representative CLL-bearing Eμ-TCL1 mice were stained with CD3-APC-Cy7, IgM-PE-Cy7, B220-FITC, CD5-APC and DAPI. Gated live CD3−/IgM+ B cell populations were analyzed for the expression of B220 and CD5. (B) CLL-bearing Eμ-TCL1 mice were injected with vehicle (20% DMSO in PBS, n=9) or 3′3′-cGAMP (10 mg/kg, n=10) daily for the first 5 days in a week for a period of three weeks. Each week, blood was collected by submandibular bleeding to measure lymphocyte numbers using a HemaTrue Hematology Analyzer (HESKA), and the data were plotted as mean ± SEM. * _p_-value < 0.05. NS: non-significant. (C) Paraffin-embedded sections of spleens from Eμ-TCL1 mice receiving three weeks of injections with vehicle or 3′3′-cGAMP (10 mg/kg) were immunohistochemically stained with an anti-cleaved caspase 3 antibody, developed using DAB (brown/yellow), and counterstained with hematoxylin. Scale bar: 60 μm. (D) 5TGM1 or 5TGM1 STING-ZFN cells (5 × 10⁶) were intravenously injected into KaLwRij mice (8 mice each group). Half of the 5TGM1-grafted and 5TGM1 STING-ZFN-grafted mice were intraperitoneally injected with 3′3′-cGAMP (10 mg/kg) daily on the first 5 days of each of the three weeks, and subjected to Kaplan-Meier survival analysis. * p-value < 0.05. NS: non-significant. (E–F) 5TGM1 cells (5 × 10⁶) were subcutaneously injected into immunodeficient NSG mice (n=10) on Day 0. Five 5TGM1-grafted NSG mice were intraperitoneally injected with the vehicle (20% DMSO in PBS), and the other five with 3′3′-cGAMP (10 mg/kg). A single injection occurs daily on the first 5 days of each of the first three weeks. No injection but data recording was performed on Day 22 and Day 23. (E) Tumor volume was plotted as mean ± SD. (F) Body weight were compared with the weight recorded on Day 1 (100%), and plotted as mean ± SD.
To investigate whether the lack of STING can alter malignant phenotypes of 5TGM1 cells in vivo, we injected intravenously 5 × 10⁶ 5TGM1 or 5TGM1 STING-ZFN cells back to KaLwRij mice (Fig. 7D). No significant difference in survival was observed between mice injected with 5TGM1 and 5TGM1 STING-ZFN cells (Fig 7D). Some 5TGM1-grafted and 5TGM1 STING-ZFN-grafted mice were intraperitoneally injected with 3′3′-cGAMP (10 mg/kg) daily for the first 5 days of each of the first three week. Injections with 3′3′-cGAMP significantly prolong the survival of 5TGM1-grafted mice (Fig. 7D). We also observed increased survival of 5TGM1 STING-ZFN-grafted mice (Fig. 7D), supporting a role of 3′3′-GAMP in boosting an anti-tumor immune response (16,17). To highlight the direct effect of 3′3′-cGAMP in targeting malignant B cells in vivo without the help of a functional immune system, we grafted immunodeficient NSG mice with 5TGM1 cells subcutaneously, and showed that injections with 3′3′-cGAMP can suppress the growth of multiple myeloma without the presence of T, B or natural killer cells (Fig. 7E). We confirmed that myeloma cells remain in the tumor injection site, and do not migrate to bone marrow, peripheral blood and spleen after 3′3′-cGAMP injections (Supplementary Fig. 13). Injections with 3′3′-cGAMP also does not cause NSG mice to lose weight (Fig. 7F).
Discussion
In IRE-1−/− and XBP-1−/− MEFs, STING agonists elicit compromised phosphorylation of STING and IRF3, reduced production of type I interferons, and decreased phosphorylation of STAT1 (Fig. 2), suggesting that the normal function of STING depends on the IRE-1/XBP-1 pathway of the ER stress response. Together with the data showing that the IRE-1/XBP-1 pathway can be activated normally in STING-ZFN cells by ER stress inducers (Supplementary Fig. 12, A–B), we propose that the IRE-1/XBP-1 pathway is downstream of STING.
STING agonists induce phosphorylation of STING and IRF3, leading to the production of type I interferons and phosphorylation of STAT1 in MEFs, melanoma, hepatoma and Lewis lung cancer cells (Figs. 1E, 1F, 1G, 2A, 2B, 2C, 2E, 2F, and Supplementary Fig. 10, B–D). Continuous incubation with these agonists exerts little impact on the growth of these cells (Figs. 2H, 2I, 6J, 6K and 6L). Although STING agonists can also trigger malignant B cells to produce type I interferons shortly after stimulations (Fig. 6, A–D), continuous incubation induces normal and malignant B cells to undergo rapid apoptosis (Figs. 3, 4 and 5C, and Supplementary Fig. 6). STING agonist-induced apoptosis is clearly mediated by STING because STING-ZFN cells do not undergo such apoptosis (Fig. 5, B–C and Supplementary Fig. 6). How does STING mediate the production of type I interferons in MEFs, melanoma, hepatoma and Lewis lung cancer cells, but apoptosis in normal and malignant B cells? Different from MEFs, melanoma, hepatoma and Lewis lung cancer cells, normal and malignant B cells are incapable of degrading STING efficiently after stimulations by STING agonists (Figs. 3A, 3G, 3H, 3F, 4C, 5C, 5D, and 6G, and Supplementary Fig. 6). The prolonged existence of agonist-bound STING may engage activation of apoptotic machineries through protein complex formation in the ER or Golgi apparatus (Fig. 5E). Upon 3′3′-cGAMP stimulations, IRE-1−/− MEFs are also less capable in degrading STING (Figs. 2D and 5D), but they do not undergo apoptosis like B cells even after prolonged treatment (Fig. 2H). We hypothesize that such a difference may be attributed to (1) the intrinsic lower expression levels of STING in MEFs (Fig. 5D), (2) the different phosphorylation status of STING in MEFs, and (3) the lack of B-cell-specific partner proteins in MEFs to allow for the formation of protein complexes that can initiate apoptosis.
Recently, in vitro treatment of 2′3′-cGAMP was shown to upregulate the surface expression of CD86 and increase proliferative activity in B cells purified from the mouse spleen (49). In this experiment, B cells were pulse-treated for 30 min with 2′3′-cGAMP (30 μM) dissolved in the permeabilization solution containing digitonin, washed twice with RPMI-1640 complete medium, and cultured in the presence of 0.6 μM 2′3′-cGAMP for 2 days before analysis. Our data suggest that STING agonists exert distinct effects on different cell types, and that continuous incubation with STING agonists induces normal and malignant B cells to die rapidly. While the expression levels of IRE-1 and XBP-1 stay constant in response to STING agonists in non-hematopoietic cells (Figs. 2A and 2E, and Supplementary Fig. 10, E–G), STING agonist-induced apoptosis leads to the significant degradation of IRE-1 and XBP-1s in normal and malignant B cells (Figs. 4C, 4D and 6G, and Supplementary Fig. 9A). BFA blocks vesicular transport between the ER to the Golgi apparatus, causes the ER stress, and activates the IRE-1/XBP-1 pathway. Transient activation of the IRE-1/XBP-1 pathway using BFA attenuates activation of apoptosis and increases the survival of STING agonist-treated malignant B cells (Fig. 6, G–H). Upon activation by the agonists, STING needs to be transported from the ER to the Golgi apparatus for phosphorylation. Thus, we observed decreased phosphorylation of STING in malignant B cells treated with BFA (Fig. 6G). To further support our hypothesis that activation of the pro-survival IRE-1/XBP-1 pathway can protect B cells from STING agonist-induced apoptosis, we showed that deletion of the XBP-1 gene and chemical inhibition of XBP-1s can aggrandize the growth suppression effect of STING agonists in normal and malignant B cells (Fig. 6I and Supplementary Fig. 9).
STING agonists have been proposed to be used as adjuvants for vaccinations and cancer therapy (14–17,50). Such applications rely on the capability of STING agonists in triggering the production of type I interferons. Type I interferons subsequently bind to IFNAR and activate the JAK-STAT signaling pathway to allow for the increased expression of cytokines such as TNFα, IL-1β, IL6 and CXCL10. Type I interferons together with these cytokines boost the immune system by promoting proliferation, differentiation, survival and mobilization of a number of immune cells. Our data show that STING agonists are cytotoxic to mouse B cells (Fig. 3), thus indicating their use as adjuvants to boost antibody production may not be feasible. Nevertheless, the specific cytotoxicity of STING agonists to malignant mouse B cells (Figs. 4 and 7) suggests the potential therapeutic use of STING agonists in treating B cell malignancies in addition to their immunomodulatory activity which is also against cancer (Fig. 7). Unmet medical needs still exist for the treatment of relapsed and refractory B cell-derived malignancies such as chronic lymphocytic leukemia, mantle cell lymphoma and multiple myeloma. The disadvantage of using STING agonists in treating B cell malignancies at least includes the collateral damage to normal B cells. Rituximab (an anti-CD20 monoclonal antibody) prescribed for the treatment of various B cell malignancies destroys both normal and malignant B cells. However, intravenous immunoglobulin (IVIG) can be administered during the treatment period to maintain adequate levels of antibodies to prevent infections.
Supplementary Material
1
2
Acknowledgments
This study was partially supported by grants (R01CA163910, R21CA199553 and R01CA190860) from the NIH/NCI. We thank Dr. David Ron at the University of Cambridge for providing us with IRE-1−/− MEFs. We thank Drs. Dmitry I. Gabrilovich, José R. Conejo-Garcia, Dario C. Altieri, Paul M. Lieberman, Troy E. Messick, Anthony Mato and Melanie R. Rutkowski for discussion, suggestions, and reading our manuscript. We also thank Dr. Hsin-Yao Tang at the Wistar Institute Proteomics Facility for his assistance on the analysis of phosphorylation sites of mouse STING.
Footnotes
All authors have declared that no conflict of interest exists.
The authors have no conflicting financial interests.
Author contributions: C.H.A.T. and C.C.A.H. designed research; C.H.A.T., J.A.Z., S.R., C.L., Y.N., J.R.D. and C.C.A.H. performed research; C.H.A.T., J.A.Z. and C.C.A.H. analyzed data; and C.H.A.T. and C.C.A.H. wrote the manuscript.
References
- 1.Wu JX, Sun LJ, Chen X, Du FH, Shi HP, Chen C, et al. Cyclic GMP-AMP Is an Endogenous Second Messenger in Innate Immune Signaling by Cytosolic DNA. Science. 2013;339(6121):826–30. doi: 10.1126/science.1229963. [DOI] [PMC free article] [PubMed] [Google Scholar]
- 2.Sun LJ, Wu JX, Du FH, Chen X, Chen ZJJ. Cyclic GMP-AMP Synthase Is a Cytosolic DNA Sensor That Activates the Type I Interferon Pathway. Science. 2013;339(6121):786–91. doi: 10.1126/science.1232458. [DOI] [PMC free article] [PubMed] [Google Scholar]
- 3.Diner EJ, Burdette DL, Wilson SC, Monroe KM, Kellenberger CA, Hyodo M, et al. The innate immune DNA sensor cGAS produces a noncanonical cyclic dinucleotide that activates human STING. Cell reports. 2013;3(5):1355–61. doi: 10.1016/j.celrep.2013.05.009. [DOI] [PMC free article] [PubMed] [Google Scholar]
- 4.Ablasser A, Goldeck M, Cavlar T, Deimling T, Witte G, Rohl I, et al. cGAS produces a 2′-5′-linked cyclic dinucleotide second messenger that activates STING. Nature. 2013;498(7454):380–4. doi: 10.1038/nature12306. [DOI] [PMC free article] [PubMed] [Google Scholar]
- 5.Zhang X, Shi H, Wu J, Zhang X, Sun L, Chen C, et al. Cyclic GMP-AMP containing mixed phosphodiester linkages is an endogenous high-affinity ligand for STING. Mol Cell. 2013;51(2):226–35. doi: 10.1016/j.molcel.2013.05.022. [DOI] [PMC free article] [PubMed] [Google Scholar]
- 6.Jin L, Hill KK, Filak H, Mogan J, Knowles H, Zhang B, et al. MPYS is required for IFN response factor 3 activation and type I IFN production in the response of cultured phagocytes to bacterial second messengers cyclic-di-AMP and cyclic-di-GMP. J Immunol. 2011;187(5):2595–601. doi: 10.4049/jimmunol.1100088. [DOI] [PMC free article] [PubMed] [Google Scholar]
- 7.Burdette DL, Monroe KM, Sotelo-Troha K, Iwig JS, Eckert B, Hyodo M, et al. STING is a direct innate immune sensor of cyclic di-GMP. Nature. 2011;478(7370):515–8. doi: 10.1038/nature10429. [DOI] [PMC free article] [PubMed] [Google Scholar]
- 8.Yin Q, Tian Y, Kabaleeswaran V, Jiang X, Tu D, Eck MJ, et al. Cyclic di-GMP sensing via the innate immune signaling protein STING. Mol Cell. 2012;46(6):735–45. doi: 10.1016/j.molcel.2012.05.029. [DOI] [PMC free article] [PubMed] [Google Scholar]
- 9.Gao P, Ascano M, Zillinger T, Wang W, Dai P, Serganov AA, et al. Structure-function analysis of STING activation by c[G(2′,5′)pA(3′,5′)p] and targeting by antiviral DMXAA. Cell. 2013;154(4):748–62. doi: 10.1016/j.cell.2013.07.023. [DOI] [PMC free article] [PubMed] [Google Scholar]
- 10.Ishikawa H, Barber GN. STING is an endoplasmic reticulum adaptor that facilitates innate immune signalling. Nature. 2008;455(7213):674–8. doi: 10.1038/nature07317. [DOI] [PMC free article] [PubMed] [Google Scholar]
- 11.Sun W, Li Y, Chen L, Chen H, You F, Zhou X, et al. ERIS, an endoplasmic reticulum IFN stimulator, activates innate immune signaling through dimerization. Proc Natl Acad Sci U S A. 2009;106(21):8653–8. doi: 10.1073/pnas.0900850106. [DOI] [PMC free article] [PubMed] [Google Scholar]
- 12.Zhong B, Yang Y, Li S, Wang YY, Li Y, Diao F, et al. The adaptor protein MITA links virus-sensing receptors to IRF3 transcription factor activation. Immunity. 2008;29(4):538–50. doi: 10.1016/j.immuni.2008.09.003. [DOI] [PubMed] [Google Scholar]
- 13.Ishikawa H, Ma Z, Barber GN. STING regulates intracellular DNA-mediated, type I interferon-dependent innate immunity. Nature. 2009;461(7265):788–92. doi: 10.1038/nature08476. [DOI] [PMC free article] [PubMed] [Google Scholar]
- 14.Chen W, Kuolee R, Yan H. The potential of 3′,5′-cyclic diguanylic acid (c-di-GMP) as an effective vaccine adjuvant. Vaccine. 2010;28(18):3080–5. doi: 10.1016/j.vaccine.2010.02.081. [DOI] [PubMed] [Google Scholar]
- 15.Dubensky TW, Jr, Kanne DB, Leong ML. Rationale, progress and development of vaccines utilizing STING-activating cyclic dinucleotide adjuvants. Therapeutic advances in vaccines. 2013;1(4):131–43. doi: 10.1177/2051013613501988. [DOI] [PMC free article] [PubMed] [Google Scholar]
- 16.Fu J, Kanne DB, Leong M, Glickman LH, McWhirter SM, Lemmens E, et al. STING agonist formulated cancer vaccines can cure established tumors resistant to PD-1 blockade. Science translational medicine. 2015;7(283):283ra52. doi: 10.1126/scitranslmed.aaa4306. [DOI] [PMC free article] [PubMed] [Google Scholar]
- 17.Deng L, Liang H, Xu M, Yang X, Burnette B, Arina A, et al. STING-Dependent Cytosolic DNA Sensing Promotes Radiation-Induced Type I Interferon-Dependent Antitumor Immunity in Immunogenic Tumors. Immunity. 2014;41(5):843–52. doi: 10.1016/j.immuni.2014.10.019. [DOI] [PMC free article] [PubMed] [Google Scholar]
- 18.Baguley BC, Ching LM. DMXAA: an antivascular agent with multiple host responses. International journal of radiation oncology, biology, physics. 2002;54(5):1503–11. doi: 10.1016/s0360-3016(02)03920-2. [DOI] [PubMed] [Google Scholar]
- 19.Philpott M, Baguley BC, Ching LM. Induction of tumour necrosis factor-alpha by single and repeated doses of the antitumour agent 5,6-dimethylxanthenone-4-acetic acid. Cancer chemotherapy and pharmacology. 1995;36(2):143–8. doi: 10.1007/BF00689199. [DOI] [PubMed] [Google Scholar]
- 20.Woon ST, Reddy CB, Drummond CJ, Schooltink MA, Baguley BC, Kieda C, et al. A comparison of the ability of DMXAA and xanthenone analogues to activate NF-kappaB in murine and human cell lines. Oncology research. 2005;15(7–8):351–64. doi: 10.3727/096504005776449743. [DOI] [PubMed] [Google Scholar]
- 21.Taylor JL, Schoenherr CK, Grossberg SE. High-yield interferon induction by 10-carboxymethyl-9-acridanone in mice and hamsters. Antimicrobial agents and chemotherapy. 1980;18(1):20–6. doi: 10.1128/aac.18.1.20. [DOI] [PMC free article] [PubMed] [Google Scholar]
- 22.Storch E, Kirchner H. Induction of interferon in murine bone marrow-derived macrophage cultures by 10-carboxymethyl-9-acridanone. European journal of immunology. 1982;12(9):793–6. doi: 10.1002/eji.1830120918. [DOI] [PubMed] [Google Scholar]
- 23.Cavlar T, Deimling T, Ablasser A, Hopfner KP, Hornung V. Species-specific detection of the antiviral small-molecule compound CMA by STING. EMBO J. 2013;32(10):1440–50. doi: 10.1038/emboj.2013.86. [DOI] [PMC free article] [PubMed] [Google Scholar]
- 24.Gao P, Zillinger T, Wang W, Ascano M, Dai P, Hartmann G, et al. Binding-pocket and lid-region substitutions render human STING sensitive to the species-specific drug DMXAA. Cell reports. 2014;8(6):1668–76. doi: 10.1016/j.celrep.2014.08.010. [DOI] [PMC free article] [PubMed] [Google Scholar]
- 25.Ron D, Walter P. Signal integration in the endoplasmic reticulum unfolded protein response. Nat Rev Mol Cell Biol. 2007;8(7):519–29. doi: 10.1038/nrm2199. [DOI] [PubMed] [Google Scholar]
- 26.Walter P, Ron D. The unfolded protein response: from stress pathway to homeostatic regulation. Science. 2011;334(6059):1081–6. doi: 10.1126/science.1209038. [DOI] [PubMed] [Google Scholar]
- 27.Shen X, Ellis RE, Lee K, Liu CY, Yang K, Solomon A, et al. Complementary signaling pathways regulate the unfolded protein response and are required for C. elegans development. Cell. 2001;107(7):893–903. doi: 10.1016/s0092-8674(01)00612-2. [DOI] [PubMed] [Google Scholar]
- 28.Yoshida H, Matsui T, Yamamoto A, Okada T, Mori K. XBP1 mRNA is induced by ATF6 and spliced by IRE1 in response to ER stress to produce a highly active transcription factor. Cell. 2001;107(7):881–91. doi: 10.1016/s0092-8674(01)00611-0. [DOI] [PubMed] [Google Scholar]
- 29.Calfon M, Zeng H, Urano F, Till JH, Hubbard SR, Harding HP, et al. IRE1 couples endoplasmic reticulum load to secretory capacity by processing the XBP-1 mRNA. Nature. 2002;415(6867):92–6. doi: 10.1038/415092a. [DOI] [PubMed] [Google Scholar]
- 30.Korennykh AV, Egea PF, Korostelev AA, Finer-Moore J, Zhang C, Shokat KM, et al. The unfolded protein response signals through high-order assembly of Ire1. Nature. 2009;457(7230):687–93. doi: 10.1038/nature07661. [DOI] [PMC free article] [PubMed] [Google Scholar]
- 31.Sriburi R, Jackowski S, Mori K, Brewer JW. XBP1: a link between the unfolded protein response, lipid biosynthesis, and biogenesis of the endoplasmic reticulum. J Cell Biol. 2004;167(1):35–41. doi: 10.1083/jcb.200406136. [DOI] [PMC free article] [PubMed] [Google Scholar]
- 32.Lee AH, Iwakoshi NN, Glimcher LH. XBP-1 regulates a subset of endoplasmic reticulum resident chaperone genes in the unfolded protein response. Mol Cell Biol. 2003;23(21):7448–59. doi: 10.1128/MCB.23.21.7448-7459.2003. [DOI] [PMC free article] [PubMed] [Google Scholar]
- 33.McGehee AM, Dougan SK, Klemm EJ, Shui G, Park B, Kim YM, et al. XBP-1-deficient plasmablasts show normal protein folding but altered glycosylation and lipid synthesis. J Immunol. 2009;183(6):3690–9. doi: 10.4049/jimmunol.0900953. [DOI] [PMC free article] [PubMed] [Google Scholar]
- 34.Reimold AM, Iwakoshi NN, Manis J, Vallabhajosyula P, Szomolanyi-Tsuda E, Gravallese EM, et al. Plasma cell differentiation requires the transcription factor XBP-1. Nature. 2001;412(6844):300–7. doi: 10.1038/35085509. [DOI] [PubMed] [Google Scholar]
- 35.Iwakoshi NN, Lee AH, Vallabhajosyula P, Otipoby KL, Rajewsky K, Glimcher LH. Plasma cell differentiation and the unfolded protein response intersect at the transcription factor XBP-1. Nat Immunol. 2003;4(4):321–9. doi: 10.1038/ni907. [DOI] [PubMed] [Google Scholar]
- 36.Hu CC, Dougan SK, McGehee AM, Love JC, Ploegh HL. XBP-1 regulates signal transduction, transcription factors and bone marrow colonization in B cells. Embo J. 2009;28(11):1624–36. doi: 10.1038/emboj.2009.117. [DOI] [PMC free article] [PubMed] [Google Scholar]
- 37.Zhang K, Wong HN, Song B, Miller CN, Scheuner D, Kaufman RJ. The unfolded protein response sensor IRE1alpha is required at 2 distinct steps in B cell lymphopoiesis. J Clin Invest. 2005;115(2):268–81. doi: 10.1172/JCI21848. [DOI] [PMC free article] [PubMed] [Google Scholar]
- 38.Tang CH, Ranatunga S, Kriss CL, Cubitt CL, Tao J, Pinilla-Ibarz JA, et al. Inhibition of ER stress-associated IRE-1/XBP-1 pathway reduces leukemic cell survival. J Clin Invest. 2014;124(6):2585–98. doi: 10.1172/JCI73448. [DOI] [PMC free article] [PubMed] [Google Scholar]
- 39.Gaffney BL, Veliath E, Zhao J, Jones RA. One-flask syntheses of c-di-GMP and the [Rp,Rp] and [Rp,Sp] thiophosphate analogues. Organic letters. 2010;12(14):3269–71. doi: 10.1021/ol101236b. [DOI] [PMC free article] [PubMed] [Google Scholar]
- 40.Gao P, Ascano M, Wu Y, Barchet W, Gaffney BL, Zillinger T, et al. Cyclic [G(2′,5′)pA(3′,5′)p] is the metazoan second messenger produced by DNA-activated cyclic GMP-AMP synthase. Cell. 2013;153(5):1094–107. doi: 10.1016/j.cell.2013.04.046. [DOI] [PMC free article] [PubMed] [Google Scholar]
- 41.Kim S, Li L, Maliga Z, Yin Q, Wu H, Mitchison TJ. Anticancer flavonoids are mouse-selective STING agonists. ACS chemical biology. 2013;8(7):1396–401. doi: 10.1021/cb400264n. [DOI] [PMC free article] [PubMed] [Google Scholar]
- 42.Conlon J, Burdette DL, Sharma S, Bhat N, Thompson M, Jiang Z, et al. Mouse, but not human STING, binds and signals in response to the vascular disrupting agent 5,6-dimethylxanthenone-4-acetic acid. J Immunol. 2013;190(10):5216–25. doi: 10.4049/jimmunol.1300097. [DOI] [PMC free article] [PubMed] [Google Scholar]
- 43.Bichi R, Shinton SA, Martin ES, Koval A, Calin GA, Cesari R, et al. Human chronic lymphocytic leukemia modeled in mouse by targeted TCL1 expression. Proc Natl Acad Sci U S A. 2002;99(10):6955–60. doi: 10.1073/pnas.102181599. [DOI] [PMC free article] [PubMed] [Google Scholar]
- 44.Kriss CL, Pinilla-Ibarz JA, Mailloux AW, Powers JJ, Tang CH, Kang CW, et al. Overexpression of TCL1 activates the endoplasmic reticulum stress response: a novel mechanism of leukemic progression in mice. Blood. 2012;120(5):1027–38. doi: 10.1182/blood-2011-11-394346. [DOI] [PMC free article] [PubMed] [Google Scholar]
- 45.Luo D, He Y, Zhang H, Yu L, Chen H, Xu Z, et al. AIP1 is critical in transducing IRE1-mediated endoplasmic reticulum stress response. J Biol Chem. 2008;283(18):11905–12. doi: 10.1074/jbc.M710557200. [DOI] [PMC free article] [PubMed] [Google Scholar]
- 46.Papandreou I, Denko NC, Olson M, Van Melckebeke H, Lust S, Tam A, et al. Identification of an Ire1alpha endonuclease specific inhibitor with cytotoxic activity against human multiple myeloma. Blood. 2011;117(4):1311–4. doi: 10.1182/blood-2010-08-303099. [DOI] [PMC free article] [PubMed] [Google Scholar]
- 47.Kharabi Masouleh B, Geng H, Hurtz C, Chan LN, Logan AC, Chang MS, et al. Mechanistic rationale for targeting the unfolded protein response in pre-B acute lymphoblastic leukemia. Proc Natl Acad Sci U S A. 2014;111(21):E2219–28. doi: 10.1073/pnas.1400958111. [DOI] [PMC free article] [PubMed] [Google Scholar]
- 48.Hu CC, Dougan SK, Winter SV, Paton AW, Paton JC, Ploegh HL. Subtilase cytotoxin cleaves newly synthesized BiP and blocks antibody secretion in B lymphocytes. J Exp Med. 2009;206(11):2429–40. doi: 10.1084/jem.20090782. [DOI] [PMC free article] [PubMed] [Google Scholar]
- 49.Zeng M, Hu Z, Shi X, Li X, Zhan X, Li XD, et al. MAVS, cGAS, and endogenous retroviruses in T-independent B cell responses. Science. 2014;346(6216):1486–92. doi: 10.1126/science.346.6216.1486. [DOI] [PMC free article] [PubMed] [Google Scholar] [Retracted]
- 50.Woo SR, Fuertes MB, Corrales L, Spranger S, Furdyna MJ, Leung MY, et al. STING-dependent cytosolic DNA sensing mediates innate immune recognition of immunogenic tumors. Immunity. 2014;41(5):830–42. doi: 10.1016/j.immuni.2014.10.017. [DOI] [PMC free article] [PubMed] [Google Scholar]
Associated Data
This section collects any data citations, data availability statements, or supplementary materials included in this article.
Supplementary Materials
1
2