Phase II Trial of Vorinostat With Idarubicin and Cytarabine for Patients With Newly Diagnosed Acute Myelogenous Leukemia or Myelodysplastic Syndrome (original) (raw)
Abstract
Purpose
To evaluate the safety and efficacy of the combination of the histone deacetylase inhibitor vorinostat with idarubicin and ara-C (cytarabine) in patients with acute myelogenous leukemia (AML) or myelodysplastic syndrome (MDS).
Patients and Methods
Patients with previously untreated AML or higher-risk MDS age 15 to 65 years with appropriate organ function and no core-binding factor abnormality were candidates. Induction therapy was vorinostat 500 mg orally three times a day (days 1 to 3), idarubin 12 mg/m2 intravenously (IV) daily × 3 (days 4 to 6), and cytarabine 1.5 g/m2 IV as a continuous infusion daily for 3 or 4 days (days 4 to 7). Patients in remission could be treated with five cycles of consolidation therapy and up to 12 months of maintenance therapy with single-agent vorinostat. The study was designed to stop early if either excess toxicity or low probability of median event-free survival (EFS) of more than 28 weeks was likely.
Results
After a three-patient run-in phase, 75 patients were treated. Median age was 52 years (range, 19 to 65 years), 29 patients (39%) were cytogenetically normal, and 11 (15%) had FLT-3 internal tandem duplication (ITD). No excess vorinostat-related toxicity was observed. Induction mortality was 4%. EFS was 47 weeks (range, 3 to 134 weeks), and overall survival was 82 weeks (range, 3 to 134 weeks). Overall response rate (ORR) was 85%, including 76% complete response (CR) and 9% in CR with incomplete platelet recovery. ORR was 93% in diploid patients and 100% in FLT-3 ITD patients. Levels of NRF2 and CYBB were associated with longer survival.
Conclusion
The combination of vorinostat with idarubicin and cytarabine is safe and active in AML.
INTRODUCTION
Outcomes in patients with acute myelogenous leukemia (AML) can be improved by incorporating new front-line agents1 or by adding a third drug to standard therapy.2,3 Standard therapy for AML at the MD Anderson Cancer Center (MDACC) consists of the combination of idarubicin with high-dose continuous infusion ara-C (cytarabine). This so-called IA program has been safely combined with other agents such as tipifarnib2 and sorafenib.3 Vorinostat is a histone deacetylase inhibitor (HDACI) with limited but single-agent activity in AML4 that is approved in the United States to treat specific subsets of patients with cutaneous T-cell lymphoma.5 We hypothesized that the addition of vorinostat as an investigative agent to IA could improve results in first-line AML therapy. This was based on data that indicated synergism between vorinostat and DNA topoisomerase II inhibitors6,7 and safety of the combination in a phase I trial.8 On the basis of these data, we conducted a phase II study to explore the safety and activity of vorinostat with IA in AML. This study had a Bayesian design with predefined stopping rules for toxicity and event-free survival (EFS).
PATIENTS AND METHODS
All patients were treated at MDACC under protocol 2007-0835 (Data Supplement) following institutional guidelines. In the protocol, EFS is referred to as progression-free survival.
Patient Eligibility
Patients age 15 to 65 years old with AML according to WHO9 criteria or with INT-2/high-risk myelodysplastic syndrome according to the International Prognostic Scoring System (IPSS)10 were eligible. The study had two phases: an initial run-in phase for patients with relapsed or refractory AML and the actual phase II portion for previously untreated patients with AML. Patients could have received prior therapy for myelodysplastic syndrome (blasts < 10%). An Eastern Cooperative Oncology Group (ECOG) performance status of less than 3 and a creatinine and total bilirubin of ≤ 2 mg/dL were required. Patients with cardiac ejection fraction (EF) less than 50%; those who were pregnant; those with t(15;17), inv16, or t(8;21); and those with severe active comorbidity were excluded.
Therapy and Evaluation
During induction, vorinostat 500 mg was administered orally three times a day on days 1 to 3. This dose was derived from our phase I trial of idarubicin and vorinostat.8 On day 4, idarubicin was started at a dose of 12 mg/m2 daily × 3 (days 4 to 6) with cytarabine at a dose of 1.5 gm/m2 daily administered as a continuous infusion for 4 days (days 4 to 7) in patients younger than age 60 years or for 3 days (days 4 to 6) in those older than age 60 years. Up to two cycles of induction therapy could be administered if response was not achieved with the first cycle. Patients in remission could receive up to five cycles of consolidation therapy with vorinostat at 500 mg orally three times per day (days 1 to 3), idarubicin 8 mg/m2 daily × 2 days (days 4 through 5), and cytarabine 0.75 g/m2 as a continuous infusion daily × 3 days (days 4 through 6). Steroids (salumedrol 50 mg intravenously on the same days as cytarabine) were used with cytarabine administration to prevent fever and rash. Patients who completed induction and consolidation therapy could be treated with single-agent vorinostat (200 mg orally 3 times a day for 14 days every 28 days) for up to 12 cycles. Criteria for dose adjustments are shown in the Data Supplement. Patients older than age 49 years were admitted to a laminar flow room. Baseline evaluation included echocardiogram and ECGs, basic laboratory analysis, bone marrow aspiration, and biopsy with cytogenetic and molecular studies. Bone marrow examination was repeated on days 21 and 28 of the first cycle and as needed thereafter. Cytogenetic and gene mutation (NPM1, RAS, and FLT-3) analysis were performed in clinical laboratories at MDACC.
Response Definition and Assessment of Toxicity
Complete response (CR) included normalization of marrow blasts (≤ 5% blasts) and of peripheral blood counts (neutrophil count ≥ 1 K/μL; platelet count > 100 × K/μL). CR with incomplete platelet recovery (CRp) was the same as CR but with platelets less than 100 × K/μL. CR duration was calculated from time of CR until relapse. EFS was calculated from the beginning of treatment until an event, including resistance, partial response, relapse, or death from any cause. Survival was plotted by the Kaplan-Meier method and compared by using the log-rank test. Differences in subgroups by different covariates were evaluated by using the χ2 test for nominal values and the Mann-Whitney U test and Fisher's exact test for continuous variables. Toxicity was assessed by using Common Terminology Criteria for Adverse Events (CTCAE) version 3.0.
Statistical Design
The objective of this trial was to provide an early assessment of efficacy (phase IIA) of vorinostat when used in combination with IA. Because we had limited experience with the administration of vorinostat with IA, first we planned a run-in phase in which vorinostat was used at the highest dose level with IA. If no toxicity was observed in the first three patients, then the study would move to the actual phase II portion of the trial. Details of statistical design are shown in the Data Supplement. The study had two stopping rules: for toxicity and for EFS. We assumed that EFS followed an exponential distribution and that the treatment would be considered successful if a median EFS of at least 28 weeks was achieved. The trial was monitored every 6 months by an independent statistician (N.B.B.). The study would stop early if the probability of median EFS being ≥ 28 weeks (compared with data from the trial) was less than 0.02. The study was also monitored for unacceptable vorinostat-related severe toxicity. The study was to stop early if an unacceptable toxicity rate more than 10% at 6 months (compared with data from the trial) was more than 0.99.
Correlative Studies
Peripheral blood mononuclear cells were isolated, as previously described, on days 0, 3, 7, and 28 of the first cycle of therapy.11 The following biomarkers were evaluated: histone acetylation, beclin levels, mRNA levels of TIMP1, interleukin-6 (IL-6), MMP9, p38MAPK, NRF2, CYBB, FOXO3, SOD1, SOD2, and GST-Pi. Induction of histone H3 acetylation and beclin levels were analyzed by Western blot as previously described.11,12 Antibodies for acetylated H3 were from Millipore (Billerica, MA); antibodies for beclin were from Cell Signaling Technology (Danvers, MA). Total cellular RNA was extracted with Trizol (Invitrogen, Carlsbad, CA). Reverse transcription was performed by using Moloney murine leukemia virus reverse transcription enzyme (Invitrogen) according to the manufacturer's protocol. For expression levels of IL-6, p38MAPK, TIMP1, and MMP9, primers and probes were purchased from Applied Biosystems (Carlsbad, CA) and analyzed with TaqMan Universal PCR Master Mix by using an ABI 7700 sequencing detection system (Applied Biosystems). Primers for NRF2, CYBB, FOXO3, SOD1, SOD2, and GST-Pi were synthesized by Invitrogen, real-time polymerase chain reaction was performed by using ABI 7700 sequencing detection system and SYBR Green reagents (Invitrogen).
RESULTS
From April 2008 to March 2010, 78 patients were treated: three in the run-in phase and 75 in the phase II portion. Three patients with relapsed AML were treated in the run-in phase. None of the three patients suffered significant vorinostat-related toxicity (data not shown). The study then moved to the formal phase II portion.
Patient Characteristics
In total, 75 patients were treated in the phase II portion of the study. Characteristics are detailed in Table 1. Median age was 52 years (range, 19 to 65 years), 21% of patients had therapy-related disease, seven (13%) had bone marrow blasts of 10% to 19%, 29 (39%) had diploid cytogenetics, and 11 (15%) had FLT-3 internal tandem duplication (ITD). Four patients (5%) had received prior therapy for blasts less than 10%. Only 18 patients (24%) did not have any of the following characteristics: secondary disease, abnormal cytogenetics, or FLT-3 ITD.
Table 1.
Patient Characteristics (N = 75)
| Characteristics | No. | % |
|---|---|---|
| Age, years | ||
| Median | 52 | |
| Range | 19-65 | |
| Male sex | 39 | 52 |
| Secondary disease | 16 | 21 |
| BM blasts ≥ 20% | 68 | 90 |
| FAB | ||
| M0-M2 | 26 | 35 |
| M4 | 12 | 16 |
| M5 | 11 | 15 |
| M6 | 2 | 3 |
| Mixed | 1 | 1 |
| RAEB | 2 | 3 |
| RAEB-T | 11 | 15 |
| Unknown/not done | 10 | 13 |
| WBC, K/μL | ||
| Median | 5.0 | |
| Range | 0.7-110.6 | |
| Platelets, K/μL | ||
| Median | 42 | |
| Range | 6-534 | |
| Hgb, g/dL | ||
| Median | 8.7 | |
| Range | 2.0-12.9 | |
| ANC, K/μL | ||
| Median | 0.713 | |
| Range | 0-33.456 | |
| % BM blasts | ||
| Median | 40 | |
| Range | 11-95 | |
| % PB blasts | ||
| Median | 14 | |
| Range | 0-92 | |
| Creatinine, mg/dL | ||
| Median | 0.9 | |
| Range | 0.4-1.6 | |
| Total bilirubin, mg/dL | ||
| Median | 0.3 | |
| Range | 0.2-1.7 | |
| Cytogenetics | ||
| Diploid | 29 | 39 |
| −5/−7 | 17 | 23 |
| Other | 26 | 35 |
| Inadequate | 3 | 4 |
| FLT-3 ITD status | ||
| Positive | 11 | 15 |
| Negative | 57 | 76 |
| Not done | 7 | 9 |
| RAS mutation | ||
| Positive | 10 | 13 |
| Negative | 53 | 71 |
| Not done | 12 | 16 |
| NPM1 mutation | ||
| Positive | 10 | 13 |
| Negative | 42 | 56 |
| Not done | 23 | 31 |
Toxicity
No excess toxicity was observed with IA vorinostat compared with historical experience with IA. Death at induction was documented in three patients (4%). Table 2 summarizes the most frequent toxicities observed during induction therapy. They were primarily gastrointestinal, including diarrhea (72%), nausea and vomiting (65%), and other gastrointestinal toxicity (39%). Skin toxicity was documented in 38% of patients. Grade 3 to 4 diarrhea was observed in 36% of patients, other GI toxicity in 14%, and nausea and vomiting in 10%. Severe skin toxicity was observed in only 4% of patients. Because of the potential for excess cardiac toxicity, cardiac EF was evaluated before therapy and at the end of cycle 1. Median EF was 60% at baseline and 55% at end of cycle 1 (P = not significant). Only one patient had irreversible EF reduction in the setting of sepsis and induction death.
Table 2.
Most Frequent Adverse Events During Induction Therapy
| Adverse Event | No. of Patients | Total % | ||
|---|---|---|---|---|
| Grade 1 to 2 | Grade 3 to 4 | Total | ||
| Cardiac | 4 | 7 | 11 | 15 |
| Diarrhea | 26 | 27 | 53 | 72 |
| Edema/swelling | 4 | 0 | 4 | 5 |
| Gastrointestinal, other (mucositis, typhlitis, colitis) | 18 | 11 | 29 | 39 |
| Hemorrhage/bleeding | 8 | 5 | 13 | 18 |
| Hepatic | 6 | 8 | 14 | 19 |
| Metabolic, hypomagnesemia | 1 | 0 | 1 | 1 |
| Nausea/vomiting | 40 | 8 | 48 | 65 |
| Neurologic | 2 | 1 | 3 | 4 |
| Pain | 2 | 0 | 2 | 3 |
| Rash/cellulitis/hand-foot syndrome | 25 | 3 | 28 | 38 |
| Renal | 3 | 2 | 5 | 7 |
| Respiratory | 0 | 2 | 2 | 3 |
| Thrombosis/deep vein thrombosis | 2 | 0 | 2 | 3 |
Overall Survival and EFS
With a median follow-up of 82 weeks (range, 5 to 132 weeks), median overall survival (OS) for the whole group was 82 weeks (range, 3 to 134 weeks), and EFS was 47 weeks (range, 3 to 134 weeks; Figs 1A and 1C). Details of the results are provided in Table 3. Median OS and EFS for patients with FLT-3 ITD were 91 weeks (range, 6 to 134 weeks) and 66 weeks (range, 6 to 134 weeks), respectively (Fig 1). There was a trend toward better survival in the FLT-3 ITD patients versus the unmutated group (P = .067). The characteristics of FLT-3 ITD patients are shown in the Data Supplement. Patients with diploid cytogenetics had a median OS of 105 weeks (range, 5 to 134 weeks) and a median EFS of 68 weeks (range, 5 to 134 weeks; Fig 1). There was a trend toward better survival in the diploid patients versus nondiploid patients (P = .09). Survival was poorer in patients with −5/−7 cytogenetics: OS was 34 weeks (range, 3 to 92 weeks), and EFS was 14 weeks (range, 3 to 92 weeks). In contrast, nondiploid non −5/−7 patients had a median OS of 92 weeks (range, 5 to 119 weeks), and EFS was not reached (range, 5 to 119 weeks).
Fig 1.
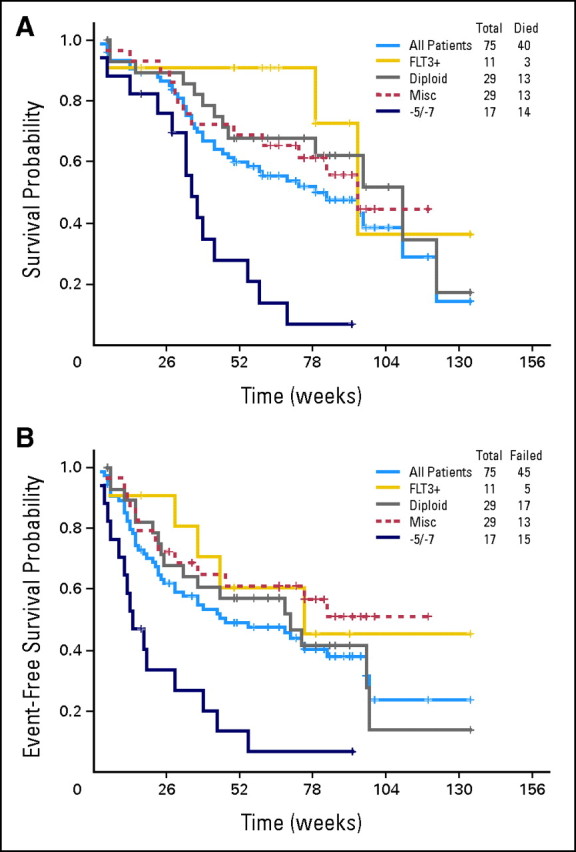
(A) Overall survival and (B) event-free survival of all patients by molecular cytogenetic subset. −5/−7 cytogenetics. Misc, miscellaneous.
Table 3.
Clinical Responses and Survival
| Patient Characteristic | CR | CRp | ORR | 95% CI | EFS (weeks) | Range | OS (weeks) | Range | |||
|---|---|---|---|---|---|---|---|---|---|---|---|
| No. | % | No. | % | No. | % | ||||||
| All patients | 57 | 76 | 7 | 9 | 64 | 85 | 0.75 to 0.91 | 47 | 3-134 | 82 | 3-134 |
| FLT-3 ITD | 10 | 91 | 1 | 9 | 11 | 100 | 0.73 to 0.99 | 66 | 6-134 | 91 | 6-134 |
| FLT-3 WT | 42 | 71 | 5 | 8 | 47 | 80 | 0.61 to 0.82 | 47 | 4-100 | 72 | 5-122 |
| NPM1+/FLT-3 WT | 6 | 100 | 0 | 6 | 100 | 0.59 to 0.99 | 29 | 6-91 | N/R | 6-91 | |
| NPM1+/FLT3 ITD | 2 | 67 | 1 | 33 | 3 | 100 | 0.39 to 0.99 | N/R | 5-134 | N/R | 5-134 |
| NPM1−/FLT-3 WT | 24 | 69 | 3 | 9 | 27 | 78 | 0.56 to 0.84 | 23 | 5-97 | 46 | 5-110 |
| NPM1−/FLT-3 ITD | 5 | 100 | 0 | 5 | 100 | 0.54 to 0.99 | 68 | 51-89 | N/R | 51-105 | |
| Diploid* | 25 | 86 | 2 | 7 | 27 | 93 | 0.77 to 0.97 | 68 | 5-134 | 105 | 5-134 |
| −5/−7 | 9 | 53 | 1 | 6 | 10 | 59 | 0.35 to 0.78 | 14 | 3-92 | 34 | 3-92 |
| Miscellaneous CG | 23 | 79 | 4 | 14 | 27 | 93 | 0.77 to 0.97 | N/R | 5-119 | 92 | 5-119 |
Clinical Responses
Responses are summarized in Table 3. CR was documented in 57 patients (76%) and CRp in an additional seven patients (9%) for an overall response rate (ORR) of 85% (95% CI, 75% to 91%). No differences in response were observed in patients younger than or older than 60 years. Seven patients (9%) received two cycles of induction therapy and four (44%) responded (two with CR and two with CRp). When analyzed on the basis of molecular or cytogenetic features, 10 of the 11 patients with FLT-3 ITD achieved a CR and one achieved a CRp (ORR, 100%). All six NPM1 mutated/FLT-3 wild-type patients achieved CR. The presence of Ras mutations had no impact on response. Of the diploid patients, 25 (86%) achieved a CR and two achieved a CRp (7%; ORR, 93%). Patients with other cytogenetic alterations, excluding −5/−7, had an ORR of 93%, including 23 patients (79%) with a CR and four patients with a CRp (14%). Only nine patients (53%) with −5/−7 achieved a CR and one patient (6%) achieved a CRp for an ORR of 64%.
Consolidation and Maintenance Therapy
The median number of consolidation cycles was two (range, two to five). This was because of the number of patients who did not respond to therapy (n = 11), those who received transplantation (n = 19), and those who relapsed (n = 27). Sixty-six percent required reduction of vorinostat dose during consolidation, frequently due to myelosuppression or gastrointestinal toxicity. The median dose of vorinostat administered during consolidation was 400 mg (range, 100 to 500 mg) orally three times a day for 3 days. Thirteen patients (17%) received maintenance therapy with single-agent vorinostat with a median of five cycles.
Outcome of Patients Undergoing SCT
Nineteen patients (25%) underwent stem-cell transplantation (SCT) during their first CR. Their characteristics are shown in the Data Supplement. All patients had achieved CR/CRp before SCT. Different preparative regimens were used. Eleven (57%) received transplantations from an unrelated donor, including two umbilical cords and two with antigen mismatch. Fifteen patients (79%) received ablative preparative regimens. Median OS and EFS had not been reached (Appendix Fig A1, online only) in the 19 patients who received transplantations.
Molecular Markers
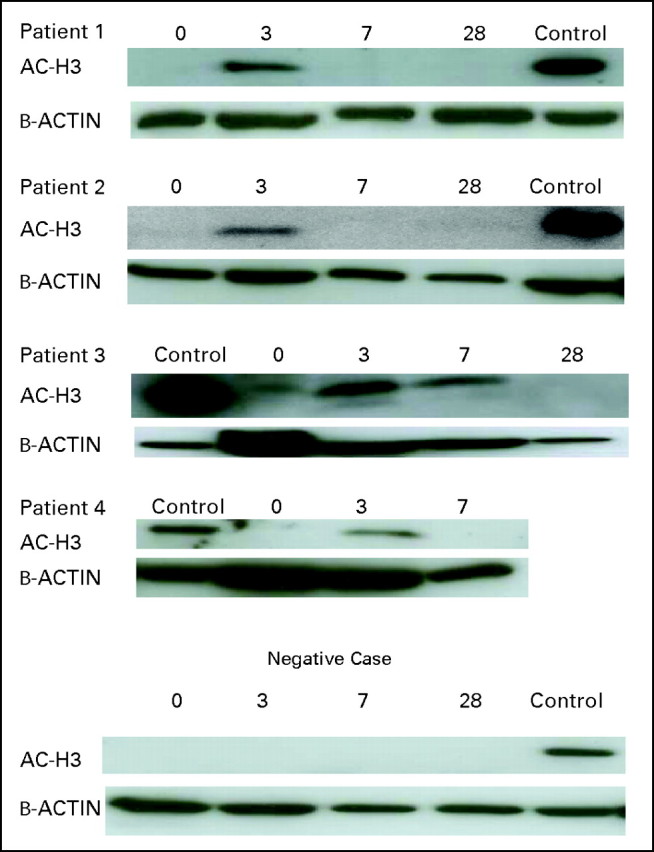
Robust induction of histone H3 acetylation was documented in 13 (32%) of 40 patients evaluated (Appendix Fig A2, online only). Because response rate was 100% in the 40 patients analyzed, no correlation was observed between acetylation and response. No induction of beclin was observed in any of the patients (data not shown). Baseline levels of genes analyzed are shown in Appendix Figure A3 (online only). mRNA upregulation occurred in all genes starting as early as day 3 of therapy (Fig 2). No association with response and gene expression was observed because a majority of patients analyzed had achieved a CR. Upregulation (> two-fold at day 3) of NRF2 and CYBB was associated with longer survival (Fig 3). No association between age or cytogenetics was found with NRF2 or CYBB.
Fig 2.

Gene expression of genes involved in resistance and reactive oxygen species sequentially during therapy. Gene expression was normalized to glyceraldehyde phosphate dehydrogenase and was measured sequentially during the first course of therapy. D, day.
Fig 3.
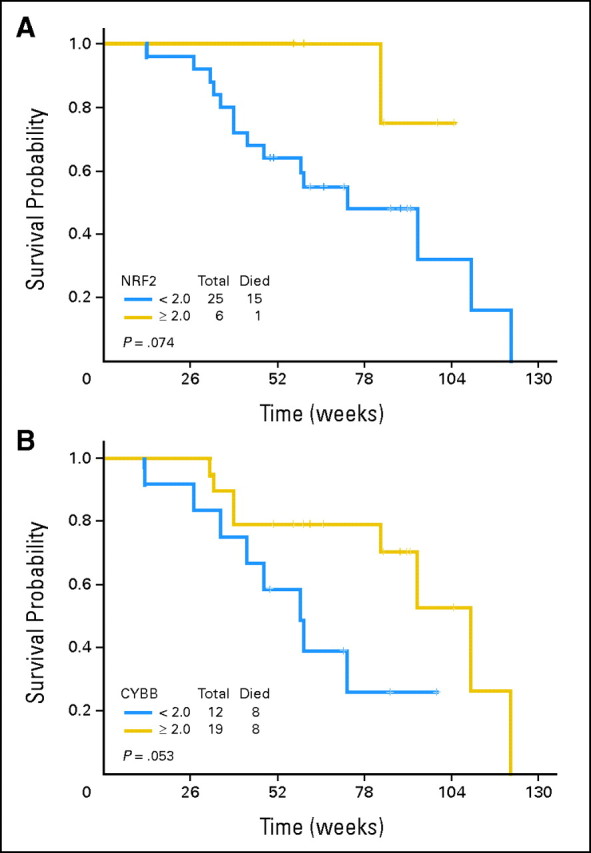
Overall survival based on levels of (A) NRF2 and (B) CYBB.
DISCUSSION
Standard therapy for younger patients with AML consists of the combination of an anthracycline with cytarabine.13 Long-term survival is usually achieved in patients with favorable cytogenetics or with molecular features such as mutation of NPM1.14 In the remaining patients (those with abnormal cytogenetics or the presence of FLT-3 ITD15), outcome is significantly poorer. Recently, the use of high-dose daunorubicin in combination with cytarabine has been associated with increased survival in younger patients with AML.13
In this study, we combined IA with vorinostat on the basis of our prior experience with single-agent vorinostat in relapsed or refractory AML4 and on the basis of in vitro data that demonstrated a sequence-dependent synergistic antileukemia effect of the combination of vorinostat with anthracyclines and cytarabine.6,7 A phase I clinical trial of idarubicin with higher doses of vorinostat demonstrated the safety of the combination.8 The study contained an initial run-in phase in which the highest dose of vorinostat was used. After treating three patients, the study was opened to previously untreated patients with AML. The study did not meet either of the two stopping rules and was considered statistically successful. The combination of vorinostat and IA did not result in excess toxicity compared with standard IA. A relatively high rate of diarrhea andgastrointestinal toxicity was observed in patients treated in this trial but this was similar to the result observed with the combination of IA and tipifarnib2 or standard IA. Induction mortality (4%) was low. EFS was 47 weeks in excess of the 7 months that had been set up as the stopping rule. The combination was active: the ORR was 85%, including 76% of patients in CR and 9% in CRp. This response rate is significant in view of the poor prognostic characteristics of the patients treated in this study. Use of vorinostat IA did not result in poor outcomes with SCT. Nineteen patients (25%) received SCT using different types of preparative programs and donor sources. Outcomes in patients receiving SCT were excellent, with median OS and EFS not having been reached at the time this article was submitted for publication.
This study also explored potential biomarkers that could explain mechanisms of sensitivity or resistance to the therapy. We evaluated four parameters: histone acetylation4; beclin12,16; levels of TIMP1, IL-6, and MMP9 as markers of chemotherapy resistance17; and a reactive oxygen species pathway (NRF2, CYBB, FOXO3, SOD1, SOD2,and GST-Pi) involved in HDACI resistance.18 We could detect significant levels of histone acetylation in 30% of patients. This low rate is probably related to the low sensitivity of the assay used (Western blot) as opposed to that of other assays such as enzyme-linked immunosorbent assay.4 Beclin is a surrogate marker of autophagy.12 HDACIs have been shown to induce autophagy in vitro.12,19,20 We could not detect increased beclin levels in any of the samples analyzed. These data do not imply that autophagy has no role in the antileukemia effect observed here but that measurement of beclin by Western blot is not a reliable marker in primary patient samples. Finally, we explored upregulation at the mRNA levels of a series of genes involved in chemotherapy resistance17 and reactive oxygen species.18 All of these genes were found to be upregulated during therapy. Of importance, levels of the transcription factor NRF2 and CYBB were associated with a trend toward improved survival. These results are of significant importance because both NRF2, a transcription factor involved in antioxidant response,18 and CYBB were shown to be involved in a pathway mediating resistance to HDACI.18 We also performed molecular analysis by using conventional cytogenetic and/or molecular analysis and more exploratory mechanistic approaches. As discussed earlier and as expected, cytogenetic patterns were clearly associated with response rates. Surprisingly, the presence of FLT-3 ITD was associated with a 100% ORR. These data should be viewed with caution, because the patient cohort studied was small.
This study has several limitations intrinsic to the design of early phase II clinical trials; therefore, results should be considered preliminary and the analysis of molecular biomarkers exploratory. A randomized study will be needed to demonstrate the contribution of vorinostat to IA in AML. One question is whether vorinostat IA is superior to IA or to other more traditional 7 + 3 schemas.13 Analysis of response indicates that response rates are higher with vorinostat IA versus IA (Data Supplement). In terms of comparison with the most recent 7 + 3 data, it should be noted that ECOG-1900 (E1900)13 included patients with favorable cytogenetics.13,21 In the intermediate-risk group, CR was 59% in E1900 compared with a range of 79% to 86% in our study. In the unfavorable prognosis group, CR in E1900 was 52% compared with 53% to 79% in vorinostat IA. CR rates were higher in the FLT-3 ITD subset with vorinostat IA compared with E1900 (91% v 67%). These data indicate that response rates with vorinostat IA are not inferior to those observed with IA or with modern 7 + 3 strategies. Second, this study was not powered to demonstrate an improved survival rate compared with other strategies. The population of patients treated here had poor characteristics that made it difficult to identify a matching historical cohort at MDACC for survival analysis (data not shown). That said, survival was not different from that reported with IA tipifarnib2 or sorafenib.3 It is difficult to compare survival between E1900 and our study, because we excluded patients with favorable cytogenetics and because survival data for both the favorable- and intermediate-risk groups in E1900 were plotted together. Furthermore, a significant fraction of patients received allogeneic SCT, which should be taken into account when analyzing these survival data. It should be noted that survival data were not censored for transplantation.
In summary, the combination of vorinostat with IA is associated with high induction response rates. Toxicity and EFS rules were not met, and the study exceeded expectations. Ongoing studies at MDACC are further evaluating the activity of vorinostat IA in _FLT-3_–mutated AML, and a randomized study comparing it to either standard IA or 7 + 3 therapy is planned for 2012. More studies on the impact of specific molecular pathways (FLT-3, NRF2, CYBB) need to be performed and could result in future target interventions.
Supplementary Material
Data Supplements
Appendix
Fig A1.

(A) Overall survival and (B) event-free survival from time of transplantation. (C) Overall survival and (D) event-free survival from time of therapy on protocol. NR, not reached.
Fig A2.
Examples of histone acetylation.
Fig A3.

Gene expression at baseline.
Footnotes
Supported by Merck Sharp & Dohme.
Authors' disclosures of potential conflicts of interest and author contributions are found at the end of this article.
Clinical trial information can be found for the following: NCT00656617.
AUTHORS' DISCLOSURES OF POTENTIAL CONFLICTS OF INTEREST
Although all authors completed the disclosure declaration, the following author(s) indicated a financial or other interest that is relevant to the subject matter under consideration in this article. Certain relationships marked with a “U” are those for which no compensation was received; those relationships marked with a “C” were compensated. For a detailed description of the disclosure categories, or for more information about ASCO's conflict of interest policy, please refer to the Author Disclosure Declaration and the Disclosures of Potential Conflicts of Interest section in Information for Contributors.
Employment or Leadership Position: None Consultant or Advisory Role: None Stock Ownership: None Honoraria: Guillermo Garcia-Manero, Merck Research Funding: None Expert Testimony: None Other Remuneration: None
AUTHOR CONTRIBUTIONS
Conception and design: Guillermo Garcia-Manero
Financial support: Guillermo Garcia-Manero
Administrative support: Guillermo Garcia-Manero
Provision of study materials or patients: Guillermo Garcia-Manero, Marina Y. Konopleva, Stefan Faderl, Jorge F. Cortes, Marcos de Lima, Hagop M. Kantarjian
Collection and assembly of data: Guillermo Garcia-Manero, Francesco Paolo Tambaro, Hui Yang, Mark Brandt, Yumin Hu, Willie Mae Newsome, Sherry R. Pierce
Data analysis and interpretation: Guillermo Garcia-Manero, Francesco Paolo Tambaro, Nebiyou B. Bekele, Farhad Ravandi, Elias Jabbour, Gautam Borthakur, Tapan M. Kadia, Deborah McCue, Hagop M. Kantarjian
Manuscript writing: All authors
Final approval of manuscript: All authors
REFERENCES
- 1.Kantarjian HM, Erba HP, Claxton D, et al. Phase II study of clofarabine monotherapy in previously untreated older adults with acute myeloid leukemia and unfavorable prognostic factors. J Clin Oncol. 2010;28:549–555. doi: 10.1200/JCO.2009.23.3130. [DOI] [PubMed] [Google Scholar]
- 2.Jabbour E, Kantarjian H, Ravandi F, et al. A phase 1-2 study of a farnesyltransferase inhibitor, tipifarnib, combined with idarubicin and cytarabine for patients with newly diagnosed acute myeloid leukemia and high-risk myelodysplastic syndrome. Cancer. 2011;117:1236–1244. doi: 10.1002/cncr.25575. [DOI] [PMC free article] [PubMed] [Google Scholar]
- 3.Ravandi F, Cortes JE, Jones D, et al. Phase I/II study of combination therapy with sorafenib, idarubicin, and cytarabine in younger patients with acute myeloid leukemia. J Clin Oncol. 2010;28:1856–1862. doi: 10.1200/JCO.2009.25.4888. [DOI] [PMC free article] [PubMed] [Google Scholar]
- 4.Garcia-Manero G, Yang H, Bueso-Ramos C, et al. Phase 1 study of the histone deacetylase inhibitor vorinostat (suberoylanilide hydroxamic acid [SAHA]) in patients with advanced leukemias and myelodysplastic syndromes. Blood. 2008;111:1060–1066. doi: 10.1182/blood-2007-06-098061. [DOI] [PubMed] [Google Scholar]
- 5.Duvic M, Talpur R, Ni X, et al. Phase 2 trial of oral vorinostat (suberoylanilide hydroxamic acid, SAHA) for refractory cutaneous T-cell lymphoma (CTCL) Blood. 2007;109:31–39. doi: 10.1182/blood-2006-06-025999. [DOI] [PMC free article] [PubMed] [Google Scholar]
- 6.Sanchez-Gonzalez B, Yang H, Bueso-Ramos C, et al. Antileukemia activity of the combination of an anthracycline with a histone deacetylase inhibitor. Blood. 2006;108:1174–1182. doi: 10.1182/blood-2005-09-008086. [DOI] [PMC free article] [PubMed] [Google Scholar]
- 7.Shiozawa K, Nakanishi T, Tan M, et al. Preclinical studies of vorinostat (suberoylanilide hydroxamic acid) combined with cytosine arabinoside and etoposide for treatment of acute leukemias. Clin Cancer Res. 2009;15:1698–1707. doi: 10.1158/1078-0432.CCR-08-1587. [DOI] [PubMed] [Google Scholar]
- 8.Kadia TM, Yang H, Ferrajoli A, et al. A phase I study of vorinostat in combination with idarubicin in relapsed or refractory leukaemia. Br J Haematol. 2010;150:72–82. doi: 10.1111/j.1365-2141.2010.08211.x. [DOI] [PMC free article] [PubMed] [Google Scholar]
- 9.Vardiman JW, Thiele J, Arber DA, et al. The 2008 revision of the World Health Organization classification of myeloid neoplasms and acute leukemia: Rationale and important changes. Blood. 2009;114:937–951. doi: 10.1182/blood-2009-03-209262. [DOI] [PubMed] [Google Scholar]
- 10.Greenberg P, Cox C, LeBeau MM, et al. International scoring system for evaluating prognosis in myelodysplastic syndromes. Blood. 1997;89:2079–2088. [PubMed] [Google Scholar]
- 11.Soriano AO, Yang H, Faderl S, et al. Safety and clinical activity of the combination of 5-azacytidine, valproic acid, and all-trans retinoic acid in acute myeloid leukemia and myelodysplastic syndrome. Blood. 2007;110:2302–2308. doi: 10.1182/blood-2007-03-078576. [DOI] [PubMed] [Google Scholar]
- 12.Wei Y, Kadia T, Tong W, et al. The combination of a histone deacetylase inhibitor with the Bcl-2 homology domain-3 mimetic GX15-070 has synergistic antileukemia activity by activating both apoptosis and autophagy. Clin Cancer Res. 2010;16:3923–3932. doi: 10.1158/1078-0432.CCR-10-0032. [DOI] [PMC free article] [PubMed] [Google Scholar]
- 13.Fernandez HF, Sun Z, Yao X, et al. Anthracycline dose intensification in acute myeloid leukemia. N Engl J Med. 2009;361:1249–1259. doi: 10.1056/NEJMoa0904544. [DOI] [PMC free article] [PubMed] [Google Scholar]
- 14.Schnittger S, Schoch C, Kern W, et al. Nucleophosmin gene mutations are predictors of favorable prognosis in acute myelogenous leukemia with a normal karyotype. Blood. 2005;106:3733–3739. doi: 10.1182/blood-2005-06-2248. [DOI] [PubMed] [Google Scholar]
- 15.Damm F, Heuser M, Morgan M, et al. Integrative prognostic risk score in acute myeloid leukemia with normal karyotype. Blood. 2011;117:4561–4568. doi: 10.1182/blood-2010-08-303479. [DOI] [PubMed] [Google Scholar]
- 16.Mizushima N, Levine B, Cuervo AM, et al. Autophagy fights disease through cellular self-digestion. Nature. 2008;451:1069–1075. doi: 10.1038/nature06639. [DOI] [PMC free article] [PubMed] [Google Scholar]
- 17.Gilbert LA, Hemann MT. DNA damage-mediated induction of a chemoresistant niche. Cell. 2010;143:355–366. doi: 10.1016/j.cell.2010.09.043. [DOI] [PMC free article] [PubMed] [Google Scholar]
- 18.Hu Y, Lu W, Chen G, et al. Overcoming resistance to histone deacetylase inhibitors in human leukemia with the redox modulating compound â-phenylethyl isothiocyanate. Blood. 2010;116:2732–2741. doi: 10.1182/blood-2009-11-256354. [DOI] [PMC free article] [PubMed] [Google Scholar]
- 19.Shao Y, Gao Z, Marks PA, et al. Apoptotic and autophagic cell death induced by histone deacetylase inhibitors. Proc Natl Acad Sci U S A. 2004;101:18030–18035. doi: 10.1073/pnas.0408345102. [DOI] [PMC free article] [PubMed] [Google Scholar]
- 20.Robert T, Vanoli F, Chiolo I, et al. HDACs link the DNA damage response, processing of double-strand breaks and autophagy. Nature. 2011;471:74–79. doi: 10.1038/nature09803. [DOI] [PMC free article] [PubMed] [Google Scholar]
- 21.Slovak ML, Kopecky KJ, Cassileth PA, et al. Karyotypic analysis predicts outcome of preremission and postremission therapy in adult acute myeloid leukemia: A Southwest Oncology Group/Eastern Cooperative Oncology Group Study. Blood. 2000;96:4075–4083. [PubMed] [Google Scholar]
Associated Data
This section collects any data citations, data availability statements, or supplementary materials included in this article.
Supplementary Materials
Data Supplements