Pattern of polymorphism after strong artificial selection in a domestication event (original) (raw)
Abstract
The process of strong artificial selection during a domestication event is modeled, and its effect on the pattern of DNA polymorphism is investigated. The model also considers population bottleneck during domestication. Artificial selection during domestication is different from a regular selective sweep because artificial selection acts on alleles that may have been neutral variants before domestication. Therefore, the fixation of such a beneficial allele does not always wipe out DNA variation in the surrounding region. The amount by which variation is reduced largely depends on the initial frequency of the beneficial allele, p. As a consequence, p has a strong effect on the likelihood of detecting the signature of selection during domestication from patterns of polymorphism. These theoretical results are discussed in light of data collected from maize. Although the main focus of this article is on domestication, this model can also be generalized to describe selective sweeps from standing genetic variation.
Keywords: population genetics, theory, coalescent, domestication selection
Artificial selection is believed to be the main evolutionary force acting on domesticated species since their origin 5,000–10,000 years ago. During domestication, humans exercised extremely strong selective pressure on ancestral gene pools to achieve desired phenotypic characteristics. These beneficial phenotypes were therefore fixed in the founder population of domesticated species in a short (probably very short) time. These fixation events differ from the fixation of an advantageous mutant in a natural population, in that artificial selection in a domestication event acts on an allele that was likely a neutral or nearly neutral variant before domestication. In other words, domestication causes some neutral polymorphisms in the ancestral population of the wild progenitor species to suddenly become very advantageous in the small founder population, the progenitor of the domesticated species. Therefore, the initial frequency of a beneficial allele (p) before domestication is not necessarily low. In contrast, the initial frequency of an advantageous mutant in a regular selective sweep model is 1/(2_N_) (1), where N is the diploid population size. Hence, models developed to describe selective sweeps in natural populations may not be appropriate for cases in which alleles are fixed from standing genetic variation, such as has been described for an amino acid variant at the CAULIFLOWER gene in Brassica (2).
In this article, a model for this process of strong artificial selection during a domestication event is developed. In addition to artificial selection, the model incorporates a population size bottleneck during domestication so that the level of polymorphism in the cultivated species is expected to be lower than that in its wild progenitor species (3, 4). In cultivated crops, polymorphism is typically reduced by 60–80% (5). Under this model, the patterns of DNA polymorphism both with and without selection are studied to understand the genetic consequences of domestication at the DNA level.
Recently, DNA polymorphism [i.e., single nucleotide polymorphism (SNP)] surveys at the genome level are becoming common, with rapid advances in sequencing and SNP-typing technologies. Domesticated species (e.g., rice and maize) are the main targets for genome-wide SNP surveys because of their agricultural importance. One of the purposes of such projects is to find “domestication genes,” that is, genes that were subject to artificial selection during domestication. Identifying such genes will be informative for future crop improvement. This article addresses the following questions: How can domestication genes be found from patterns of polymorphism? Under what conditions are they found?
Model and Simulation
We consider the demographic model illustrated in Fig. 1, in which the population experiences drastic population size changes twice. This model approximates the demography of cultivated species (3). More specifically, the system starts (forward in time) as a random mating diploid population with size _N_2, the ancestral population of the wild progenitor species from which the domesticated species originated. Domestication begins at time _t_d in the small founder population of the cultivated species, which is a subset of the members in the wild progenitor. Domestication is assumed to have occurred in this constant-size population with size _N_1. Usually, _N_1 will be much smaller than _N_2. When domestication is complete at time _t_e, it is assumed that the population size changes to _N_0. _N_0 will usually be much larger than _N_1, representing the rapid spread (population expansion) of the domesticated species. Let _T_0 and _T_1 be the lengths of time when the population sizes are _N_0 and _N_1, respectively (Fig. 1).
Fig. 1.

Illustration of the population model. At td, strong artificial selection becomes active on an allele at frequency p, which was neutral in the ancestral population. The allele fixed quickly under strong artificial selection. A possible realization of the trajectory of the frequency of the beneficial allele is also illustrated. The vertical axis represents the frequency of the beneficial allele.
Artificial selection during domestication is modeled as follows. Consider a biallelic polymorphic site at time _t_d in the ancestral population (Fig. 1). It is assumed that artificial selection now favors one of the two alleles (B represents the beneficial allele and b represents the other). Let p be the frequency of B at t_d. Artificial selection ends in τ (<T_1) generations when the beneficial allele becomes fixed in the population. Under selective pressure, the relative fitness of a b/b homozygote, a B/b heterozygote, and a B/B homozygote are 1, 1 + 2_sh, and 1 + 2_s, respectively.
To model this process, we used coalescent process of sampled sequences (6–8). The sequence contains the site under selection during the domestication event so that the genealogical history of the site involves the coalescent with two allelic classes. Hudson and Kaplan (9) first described the idea of genealogy conditional on two allelic classes, where genealogical history is considered separately for each allelic class, given the frequencies of the two alleles. Therefore, simulating the genealogy with two allelic classes requires the history of their frequencies. In our domestication model, the history of the beneficial allele has two phases: neutral phase in the ancestral population and selective phase during domestication. For the neutral phase, the genealogy at the focal site is highly variable due to random genetic drift (10–13). To describe the selective phase, most models used deterministic approximation of the trajectory of allele frequency, which assumes strong selection (1, 14–16). In this study, however, we incorporate the effect of random genetic drift (17, 18). Our model is flexible and may be more realistic because domestication might have occurred in small populations in which deterministic approximations may not be accurate.
A coalescent simulation under our domestication model can be conducted with the following procedure:
- Determine _X_S, the trajectory of the frequency of the beneficial allele (x) in the selective phase moving forward in time. The forward simulation starts with x = p at _t_d. For each generation, x is simulated according to a binomial distribution where the mean of x in the next generation follows the standard deterministic solution. The trajectory of x is recorded until it hits 1. Let τ be the time from _t_d to this fixation event. If the allele is lost (x = 0), the process starts again from the beginning (i.e., x = p at _t_d).
- Determine _X_N, the trajectory of the frequency of allele B in the neutral phase backward in time. This backward simulation is valid due to the reversibility of the diffusion process in a constant-size population (19–22). The system starts with x = p at _t_d. For each generation, x is simulated according to a binomial distribution. Because B is neutral, the mean of the binomial distribution for the previous generation is the same as x in the current generation. The trajectory of x is recorded until it hits 1 or 0. This time is denoted by _t_a. If x = 0 at _t_a, B is the derived allele. If x = 1 at _t_a, B is the ancestral allele.
- Simulate a neutral ancestral recombination graph backward in time from t = 0 to t_f (23). The coalescent time scale is measured in units of 2_N_0 generations. The rates of coalescence and recombination are given by k(k – 1)/(2_N/_N_0) and _kR_0/2, respectively, where k is the number of edges on the graph (number of ancestral sequences), N (= _N_0 or _N_1) is the population size at the time of the event, and _R_0 = 4_N_0ρ is the scaled recombination rate for the sequence (ρ is the recombination rate per generation).
- Simulate an ancestral recombination graph backward in time from _t_f to _t_a conditional on _X_S and _X_A, by using the algorithm of coalescent-with-recombination from Kim and Stephan (15). The four events in this phase (coalescence between B edges, coalescence between b edges, recombination in a B edge, and recombination in a b edge) occur with probabilities given by equations 2a–2d in Kim and Stephan (15), except that the probabilities of coalescence are adjusted by N, the population size at the time of event. See ref. 15 for details of this procedure.
- Simulate a neutral ancestral recombination graph backward in time from _t_a. The construction of the ancestral recombination graph stops at t = _t_limit. A considerably large _t_limit is chosen such that marginal trees at most nucleotide sites find the most recent common ancestor before _t_limit.
- Place neutral mutations on the ancestral recombination graph. The mutation rate per sequence per generation is assumed to be μ; θ0 = 4_N_0μ is the mutation parameter scaled by the coalescent time scale.
By using this procedure, patterns of DNA polymorphism after domestication are investigated. The effects of population bottleneck and selection are evaluated by measuring the reduction in the observed amount of polymorphism in simulated polymorphism data, by using three measures of the amount of polymorphism,  , and
, and  . Specifically,
 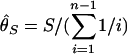 where S is the observed number of segregating sites (24),
  is the average number of pairwise nucleotide differences per site (8), and
  is the homozygosity of the derived allele per site (25, 26). Note that the calculation of
  requires the ancestral state of each segregating site, which we assume to be known. The expectations of these three measures of polymorphism are θ = 4_N_μ in a constant-size diploid population with population size N, but it does not hold in our bottleneck models (see below).
Results
We investigated patterns of DNA polymorphism after domestication with and without selection. First, to examine the effect of selection alone, a constant-size population (i.e., N = _N_0 = _N_1 = N_2) is modeled. Simulations are performed with a sample size of n = 20, N = 20,000, t_d = 2,000, and θ = R = 200 where R = 4_N_ρ. The simulated region is scaled such that the sequence ranges over the interval (0,1), with the selected target site at position 0. The region is divided into bins, and the average amount of polymorphism over 5,000 replications is calculated for each bin. The results are presented as θπ relative to θ. Let  be the expected value of θπ, which is θ in a constant-size population. Fig. 2_A_ shows the effect of p when 2_Ns = 5,000 and h = 0.5. Several values of p (0.5, 0.2, 0.1, 0.05, and 0.01) are investigated, and the results are compared with the standard selective sweep model [p = 1/(2_N)]. It is clear that p has a large effect on levels of variation. Even when p is relatively small (i.e., p = 0.01), the curve is quite different from that of a “normal” selective sweep starting with a newly arisen single advantageous mutation: the reduction in variation is much less for p = 0.01. For p ≥ 0.05, θπ near position 0 is much larger than zero. This is because θπ around the selection target site largely reflects the ancestral polymorphism that the beneficial allele had when domestication started. Theoretically, the result is understood as follows. Consider the coalescent process at the selection target site under the framework of the coalescent (i.e., time is considered backward). Because domestication occurred quite recently, it is very likely that the most recent common ancestor (MRCA) of the sampled sequences is older than t_d unless a very strong bottleneck or strong hitchhiking [i.e., p = 1/(2_N)] forces coalescence to the MRCA in the short period between _t_d and the present. Without such coalescent, at least two lineages exist at t_d, and all of these lineages must belong to the beneficial allele with frequency p. It is known that the expected coalescent time for a pair of lineages within such an allele is 2_N_2_p (10), indicating that allele B should have quite a large amount of intra-allelic variation at _t_d unless p is very small.
Fig. 2.

The expected level of polymorphism (θπ) in a constant-size population, which is scaled by θ.(A) The effect of p.(B) The effect of selection intensity (2_Ns_).
The effect of selection intensity (2_Ns_) is presented in Fig. 2_B_, in which 2_Ns_ ranges from 5 × 10² to 1 × 10⁴ and p = 0.01 and 0.1. As expected, as the selection intensity increases, the level of polymorphism decreases. The effect of 2_Ns_ is larger when p = 0.01 than when p = 0.1. This is because the reduction is primarily determined by the total sojourn time of the selected allele (τ + _t_a – _t_d). When p = 0.1, τ is very short relative to _t_a – t_d so that the relative effect of 2_Ns on the sojourn time is small.
Next, the joint effects of selection and a population bottleneck are investigated. Two bottleneck models are used (Table 1). For both models, the ancestral population size is assumed to be 200,000, which is 10 times larger than the current population size (_N_0 = 20,000). The time when domestication started is assumed to be t_d = 7,500 generations ago because most domestication occurred ≈5,000–10,000 years ago. The two models differ in the severity of the bottleneck, but both models are set such that  where θ2 = 4_N_2μ. In model I, the reduction in population size is large, but the length of time of the bottleneck is short, whereas in model II the level of bottleneck is mild. Selection intensity 2_N_1_s = 500 is assumed with h = 0.5.
Table 1. Parameters for two population models.
| Parameters | Model I | Model II |
|---|---|---|
| _N_0 | 20,000 | 20,000 |
| _N_1 | 2,000 | 10,000 |
| _N_2 | 200,000 | 200,000 |
| _T_0 | 7,250 | 5,000 |
| _T_1 | 250 | 2,500 |
Under both models, simulations are performed with sample size n = 20 and θ2 = _R_2 = 200 where _R_2 = 4_N_2ρ. The level of polymorphism measured by θπ scaled by θ2 are shown in Fig. 3. The level of polymorphism is reduced by the bottleneck regardless of the effect of selection. In addition, selection further reduces the level of variation. Notice that the qualitative effect of p is almost identical in models I and II and a constant-size population (Fig. 2) unless p is very small, further emphasizing the important role of p in determining the level of polymorphism. The effects of the other population parameters may be relatively small, which is shown below.
Fig. 3.

The expected level of polymorphism (θπ) after a domestication event, which is scaled by θ2. In both models I (A) and II (B),  , which is presented by a horizontal line. The simulated region correspond to an 8-kb region if we assume θ2 = _R_2 = 0.025 per site, which may be within typical ranges for maize (3).
Fig. 4A shows the effect of _t_d in model I (other parameters are as in Fig. 3_A_). Although the reduction in the level of polymorphism due to the bottleneck depends on _t_d, the effect of selection measured by  may be similar, in agreement with Fig. 3. Similar results are shown in Fig. 4 B and C, in which the effects of _N_0 and _N_2 are investigated (the mutation and recombination parameters θ2 and _R_2 are fixed so that θ0 and _R_0 vary).
Fig. 4.

The effects of _t_d, _N_0, and _N_2 on the expected level of polymorphism (θπ) after a domestication event. The simulated region corresponds to an 8-kb region if we assume θ2 = _R_2 = 0.025 per site. (A) The effect of _t_d. The five horizontal lines represent  for _t_d = 2,500, 5,000, 7,500, 10,000, and 20,000 from top to bottom. (B) The effect of _N_0. The five horizontal lines represent
  for _N_0 = 104, 2 × 10⁴, 5 × 10⁴, 105, and 2 × 10⁵ from bottom to top. (C) The effect of _N_2. The five horizontal lines represent
  for _N_2 = 5 × 10⁴, 105, 2 × 10⁵, 5 × 10⁵, and 106 from top to bottom.
Although the expected distribution of the level of polymorphism is given by a simple increasing function from the site of selection, the stochastic process in the history of the sampled sequences is extremely variable. Fig. 5 shows simulated patterns of the spatial distribution of  , and
, and  . A region with θ2 = _R_2 = 250 is simulated in model I, with the selection target site at the center of the region. For p = 0.1 and 0.01, four patterns of polymorphism are simulated, and a sliding window analysis is carried out for
  , and
, and  , in which the window size is 0.1 and the step size 0.025. Under this bottleneck model, we expect
  , and
, and  , where bars represent the expected values under neutrality. When p = 0.01, the amount of variation around the selection target site is usually significantly reduced from the expectation under neutrality (see Fig. 5 E, F, and G). However, there are exceptions. An example is Fig. 5_H_, in which a mild reduction in the level of
  and
and  is seen over the whole region, whereas
  is close to its neutral expectation. Although rare, this result may occur when the most recent common ancestor at the selected site is much older than _t_d. For example, the probability that the age of an allele with p = 0.01 exceeds _N_2 is 0.04 (27). This result indicates that, in some cases, we cannot expect a strong reduction in
  even when p is small. As p increases, the signature of selection becomes progressively weaker. When p = 0.1, the level of polymorphism around the selection target site is lower than in the surrounding regions, but this reduction is weak. When p = 0.5, the distribution of variation is similar to that under neutrality, and it becomes very hard to distinguish them visually (data not shown).
Fig. 5.

Patterns of polymorphism after a domestication event. (A_–_H) Each panel shows the result from an independent simulation run. Three horizontal lines represent  , and
, and  from top to bottom. The simulated region corresponds to a 10-kb region if we assume θ2 = _R_2 = 0.025 per site.
Next, we investigate how likely it is to find a signature of selection by using additional simulations. To measure the success in detecting the signature of selection, we first consider an Hudson-Kreitman-Aguadé (HKA)-type test (28). Here, r, the ratio of the amount of polymorphism to divergence, is used as a summary statistic to evaluate the reduction in the level of variation around the selection site. Suppose that we have an outgroup sequence. The average divergence between the outgroup and the cultivated species is assumed to be ≈10 times larger than the average level of polymorphism (θπ) in the cultivated species. First, we simulated polymorphism and divergence with θ2 = _R_2 = 125 to obtain the null distribution of r.  , and
, and  were again used to measure the amount of polymorphism. When divergence is simulated, the stochastic forces are allowed to act in the ancestral population of the two species (population size = _N_2 is assumed), but recombination is ignored. This makes the test slightly conservative, but, because divergence is high, the effect should be very small. From 10,000 replicates simulated under neutrality, the 5% critical values of r are determined.
Then, coalescent simulations with selection were carried out in models I and II, and the probability to detect selection is obtained as the number of replicates with r less than the 5% critical values. The results are summarized in Fig. 6_A_. The number of replicates for each parameter set is 10,000. The two models show almost identical results again, as expected from Fig. 3, so we show only results for model I here. The three measures of θ have similar powers to detect selection, although  has a little less, probably because θ_H_ has the largest variance. It seems that
  has slightly more power than
  .
.
Fig. 6.

Power of tests to detect domestication selection. The probabilities to obtain significant result at the 5% level are shown. (A) The power of the HKA test for θ2 = _R_2 = 125 (5 kb if θ2 = _R_2 = 0.025 per site). (B) The power of the HKA test for θ2 = _R_2 = 31.25 (1.25 kb if θ2 = _R_2 = 0.025 per site). (C) The powers of Tajima's D and Fay and Wu's H tests for θ2 = _R_2 = 125. (D) The powers of Tajima's D and Fay and Wu's H tests for θ2 = _R_2 = 31.25.
Fig. 6_A_ clearly demonstrates that there is a strong negative correlation between the probability of detecting selection and p. When p = 0.01, selection can be detected with very high probability (>90%), but this probability decreases dramatically as p increases. When p = 0.5, there is almost no chance of detecting selection (at least by this method); in this case, the probability that neutrality is rejected is only a little higher than the type I error (5%). This finding means that we cannot always expect a clear signature of artificial selection unless p is very small. Similar results are obtained when smaller chromosomal regions are investigated (Fig. 6_B_; θ2 = _R_2 = 31.25), except that the probabilities of detecting selection are slightly larger for smaller regions, especially when p is large.
The power of Tajima's D (29) and Fay and Wu's H (26) tests to detect selection during domestication was also considered. For Fay and Wu's H, we used  as a summary statistic, where the denominator is a scaling factor. Neutral simulations (see above) determine the 2.5% critical values for D and H. The critical values for the negative tails are denoted by _D_2.5% and _H_2.5% and those for the positive tails by _D_97.5% and _H_97.5%.Fig.6 C and D shows the power of D and H for θ2 = _R_2 = 125 and 31.25, respectively. Although overall these tests are not as powerful as the HKA test, D and H can also be used as summary statistics to detect domestication genes. Interestingly, these two tests work toward both tails as selection makes patterns of polymorphism variable, creating wide distributions of D and H. For example, in some cases, most of polymorphism in the entire region may have arisen after selection swept out almost all variation, so that negative D and positive H are observed. This result is likely when p is very small. However, if the investigated region is large (see Fig. 6_C_), recombination might create polymorphic sites with high derived allele frequencies (i.e., negative H). In cases where selection does not sweep out most polymorphism, the proportion of polymorphism with intermediate frequencies may be large so that positive D and negative H might be observed. In this case, Fay and Wu's H might have more power than Tajima's D. These two tests may therefore be informative when the level of polymorphism is not significantly reduced.
Although all simulations assume θ = R, the ratio of R to θ is a very important factor to determine the power of the tests. It is known that the local recombination rate is quite variable in comparison with mutation rate. It is obvious that, as the recombination rate decreases, the power to detect selection increases, as selection leaves its signature in a wide chromosomal region.
Discussion
We have modeled a recent domestication event to investigate its effect on the pattern of DNA polymorphism. It is well known that domesticated species have less genetic variation than their wild progenitor species because of the joint effects of population bottleneck and artificial selection during domestication. Our model incorporates both evolutionary forces. The artificial selection considered here is different from “regular” adaptive selection. That is, artificial selection in a domestication event works on an allele that may have been a neutral variant before domestication. Therefore, such selection does not necessarily reduce neutral variation in the region surrounding the selected site. As a consequence, artificial selection is not as easy to detect as a recent selective sweep due to natural selection, which creates a clear reduction in the level of polymorphism (15, 30, 31). For selection during domestication, the initial frequencies of alleles that ancient breeders favored have greatly affected the likelihood that evidence for selection can be detected from patterns of polymorphism. We may capture signatures of artificial selection acting on alleles starting with p < 0.2 with a reasonably high probability, but the chance of detecting selection is very low when _p_ > 0.5. When p is small, selection is likely to be detected by the HKA test, but, when polymorphism is not significantly reduced, it may be more informative to look at the allele frequency spectrum (e.g., Tajima's D and Fay and Wu's H tests). Tajima's D and Fay and Wu's H tests are also useful when there is little polymorphism data for neutral genes, which are required for the HKA test as controls. However, knowledge of the population demographic history is required to determine the critical values for Tajima's D and Fay and Wu's H. The HKA test, on the other hand, may be quite robust to demography.
It should be noted that the tests considered here may not be the best method to detect selection during domestication. One alternative may be to compare polymorphism in domesticated species with that of its wild progenitor (32, 33). This strategy should be very powerful, especially when a domesticated species and its wild progenitor share polymorphism. In such a case, however, there are statistical and theoretical challenges involved in testing the difference in the amount or pattern of polymorphism between the two species (34, 35) because of the complicated population history of domesticated species.
One important implication of our results is that we may not be able to detect many genes involved in domestication. The number of genes we can detect depends on the distribution of p when domestication began. The neutral allele frequency distribution is given by the famous formula of Wright (36), but this formula may not be appropriate for the distribution of p. Any model of the distribution of p should take the following factors into account. (i) We should consider the likelihood that our ancient breeders saw beneficial variants in natural populations. Beneficial mutants with very low p might be likely to be overlooked. (ii) It is likely that mutants favored by breeders were slightly deleterious in natural populations (37). The frequency of such a mutant might not have been so low that it contained a relatively large amount of intra-allelic variation at _t_d (17). Alleles that are strongly selected against before domestication can likely be ignored because they are maintained in very low frequencies. If an ancient breeder did happen to find such an mutant, however, it would leave a significant signature of selection.
It should be noted that, although our model considers a single selection event, multiple selection events must have been going on in many regions of a genome during domestication. Unless the recombination rates between selection targets are extremely small, causing the interference among selected alleles (38), our model can still be applied.
Our theoretical results are compared with the observation in maize, for which the most polymorphism data are available at present. Wang et al. (32) first reported that the level of polymorphism is significantly reduced in the 5′ upstream region of the teosinte branched1 gene (tb1), and, recently, Clark et al. (39) demonstrated that the region of reduced polymorphism extends ≈60 kb. However, this seems to be an extreme case. Evidence for selection in other candidate domestication genes is not as clear. For example, Whitt et al. (40) show that levels of variation at six genes in the maize starch pathway are about half of the average of the 11 random genes that are chosen because they are likely neutral. Other examples include C1 (41) and a few genes on chromosome 1 (4). These observations are compatible with our model of domestication with intermediate p. However, there are not enough data to evaluate the general likelihood of finding signatures of selection in the maize genome. If it turns out that strong signals of selection, such as that found at tb1, are found at many genes, it may suggest that ancient breeders had a great skill in detecting very rare beneficial variants.
Although this article focuses on domestication events, the model developed here can be generalized to selective sweeps from standing genetic variation. This type of selection may also occur in natural populations. After a drastic environmental change, some neutral polymorphisms may become advantageous. It is easy to imagine that the human population has experienced such changes quite recently so that there might be genes in the human genome that show polymorphism patterns similar to those of domestication genes.
Acknowledgments
We thank Y. Matsuoka and A. Betancourt for discussion, S. Barton for proofreading, and two anonymous reviewers for comments. H.I. is supported by a grant from the University of Texas, and Y.K. is supported by funds from the National Institutes of Health (2R01 G51932-06A1) and by the David and Lucile Packard Foundation (to Allen Orr).
This paper was submitted directly (Track II) to the PNAS office.
Abbreviation: HKA, Hudson-Kreitman-Aguadé.
Note. We would like to note that a similar selection model is being independently studied by M. Przeworski and J. Wall (personal communication).
References
- 1.Kaplan, N. L., Hudson, R. R. & Langley, C. H. (1989) Genetics 123**,** 887–899. [DOI] [PMC free article] [PubMed] [Google Scholar]
- 2.Purugganan, M. D., Boyles, A. L. & Suddith, J. I. (2000) Genetics 155**,** 855–862. [DOI] [PMC free article] [PubMed] [Google Scholar]
- 3.Eyre-Walker, A., Gaut, R. L., Hilton, H., Feldman, D. L. & Gaut, B. S. (1998) Proc. Natl. Acad. Sci. USA 95**,** 4441–4446. [DOI] [PMC free article] [PubMed] [Google Scholar]
- 4.Tenaillon, M. I., U'Ren, J., Tenaillon, O. & Gaut, B. S. (2004) Mol. Biol. Evol. 21**,** 1214–1225. [DOI] [PubMed] [Google Scholar]
- 5.Buckler, E. S., IV, Thornsberry, J. M. & Kresovich, S. (2001) Genet. Res. Camb. 77**,** 213–218. [DOI] [PubMed] [Google Scholar]
- 6.Kingman, J. F. C. (1982) Stochastic Processes Appl. 13**,** 235–248. [Google Scholar]
- 7.Hudson, R. R. (1983) Theor. Pop. Biol. 23**,** 183–201. [DOI] [PubMed] [Google Scholar]
- 8.Tajima, F. (1983) Genetics 105**,** 437–460. [DOI] [PMC free article] [PubMed] [Google Scholar]
- 9.Hudson, R. R. & Kaplan, N. L. (1986) Genetics 113**,** 1057–1076. [DOI] [PMC free article] [PubMed] [Google Scholar]
- 10.Innan, H. & Tajima, F. (1997) Genetics 147**,** 1431–1444. [DOI] [PMC free article] [PubMed] [Google Scholar]
- 11.Griffiths, R. C. & Tavaré, S. (1998) Stochastic Models 14**,** 273–295. [Google Scholar]
- 12.Griffiths, R. C. & Tavaré, S. (1999) Ann. Appl. Prob. 9**,** 567–590. [Google Scholar]
- 13.Wiuf, C. & Donnelly, P. (1999) Theor. Pop. Biol. 56**,** 183–201. [DOI] [PubMed] [Google Scholar]
- 14.Braverman, J. M., Hudson, R. R., Kaplan, N. L., Langley, C. H. & Stephan, W. (1995) Genetics 140**,** 783–796. [DOI] [PMC free article] [PubMed] [Google Scholar]
- 15.Kim, Y. & Stephan, W. (2002) Genetics 160**,** 765–777. [DOI] [PMC free article] [PubMed] [Google Scholar]
- 16.Przeworski, M. (2002) Genetics 160**,** 1179–1189. [DOI] [PMC free article] [PubMed] [Google Scholar]
- 17.Innan, H. & Tajima, F. (1999) Genet. Res. Camb. 73**,** 15–28. [Google Scholar]
- 18.Slatkin, M. (2001) Genet. Res. 78**,** 49–57. [DOI] [PubMed] [Google Scholar]
- 19.Maruyama, T. (1974) Genet. Res. Camb. 23**,** 137–143. [Google Scholar]
- 20.Li, W.-H. (1975) Am. J. Hum. Genet. 27**,** 274–286. [PMC free article] [PubMed] [Google Scholar]
- 21.Watterson, G. A. (1976) Theor. Pop. Biol. 10**,** 239–253. [DOI] [PubMed] [Google Scholar]
- 22.Watterson, W. A. (1977) Theor. Pop. Biol. 12**,** 179–196. [DOI] [PubMed] [Google Scholar]
- 23.Hudson, R. R. (1990) in Oxford Surveys in Evolutionary Biology, eds. Futuyma, D. & Antonovics, J. (Oxford Univ. Press, Oxford), Vol. 7, pp. 1–43. [Google Scholar]
- 24.Watterson, G. A. (1975) Theor. Pop. Biol. 7**,** 256–276. [DOI] [PubMed] [Google Scholar]
- 25.Fu, Y.-X. (1995) Theor. Pop. Biol. 48**,** 172–197. [DOI] [PubMed] [Google Scholar]
- 26.Fay, J. C. & Wu, C.-I. (2000) Genetics 155**,** 1405–1413. [DOI] [PMC free article] [PubMed] [Google Scholar]
- 27.Kimura, M. (1955) Proc. Natl. Acad. Sci. USA 41**,** 144–150. [DOI] [PMC free article] [PubMed] [Google Scholar]
- 28.Hudson, R. R., Kreitman, M. & Aguadé, M. (1987) Genetics 116**,** 153–159. [DOI] [PMC free article] [PubMed] [Google Scholar]
- 29.Tajima, F. (1989) Genetics 123**,** 585–595. [DOI] [PMC free article] [PubMed] [Google Scholar]
- 30.Nurminsky, D., De Aguiar, D., Bustamante, C. D. & Hartl, D. L. (2001) Science 291**,** 128–130. [DOI] [PubMed] [Google Scholar]
- 31.Innan, H., Padhukasahasram, B. & Nordborg, M. (2003) Genome Res. 13**,** 1158–1168. [DOI] [PMC free article] [PubMed] [Google Scholar]
- 32.Wang, R.-L., Stec, A., Hey, J., Lukens, L. & Doebley, J. (1999) Nature 398**,** 236–239. [DOI] [PubMed] [Google Scholar]
- 33.Vigouroux, Y., McMullen, M., Hittinger, C. T., Houchins, K., Schulz, L., Kresovich, S., Matsuoka, Y. & Doebley, J. (2002) Proc. Natl. Acad. Sci. USA 99**,** 9650–9655. [DOI] [PMC free article] [PubMed] [Google Scholar]
- 34.Wakeley, J. & Hey, J. (1997) Genetics 145**,** 847–855. [DOI] [PMC free article] [PubMed] [Google Scholar]
- 35.Innan, H. & Tajima, F. (2002) Genet. Res. 80**,** 15–25. [DOI] [PubMed] [Google Scholar]
- 36.Wright, S. (1931) Genetics 16**,** 97–159. [DOI] [PMC free article] [PubMed] [Google Scholar]
- 37.Ohta, T. (1972) Nature 246**,** 96–98. [DOI] [PubMed] [Google Scholar]
- 38.Kim, Y. & Stephan, W. (2003) Genetics 164**,** 389–398. [DOI] [PMC free article] [PubMed] [Google Scholar]
- 39.Clark, R. M., Linton, E., Messing, J. & Doebley, J. F. (2004) Proc. Natl. Acad. Sci. USA 101**,** 700–707. [DOI] [PMC free article] [PubMed] [Google Scholar]
- 40.Whitt, S. R., Wilson, L. M., Tenaillon, M. I., Gaut, B. S. & Buckler, E. S., IV (2002) Proc. Natl. Acad. Sci. USA 99**,** 12959–12962. [DOI] [PMC free article] [PubMed] [Google Scholar]
- 41.Hanson, M. A., Gaut, B. S., Stec, A. O., Fuerstenberg, S. I., Goodman, M. M., Coe, E. H. & Doebley, J. F. (1996) Genetics 143**,** 1395–1407. [DOI] [PMC free article] [PubMed] [Google Scholar]