Activating Transcription Factor 4 Is Translationally Regulated by Hypoxic Stress (original) (raw)
Abstract
Hypoxic stress results in a rapid and sustained inhibition of protein synthesis that is at least partially mediated by eukaryotic initiation factor 2α (eIF2α) phosphorylation by the endoplasmic reticulum (ER) kinase PERK. Here we show through microarray analysis of polysome-bound RNA in aerobic and hypoxic HeLa cells that a subset of transcripts are preferentially translated during hypoxia, including activating transcription factor 4 (ATF4), an important mediator of the unfolded protein response. Changes in mRNA translation during the unfolded protein response are mediated by PERK phosphorylation of the translation initiation factor eIF2α at Ser-51. Similarly, PERK is activated and is responsible for translational regulation under hypoxic conditions, while inducing the translation of ATF4. The overexpression of a C-terminal fragment of GADD34 that constitutively dephosphorylates eIF2α was able to attenuate the phosphorylation of eIF2α and severely inhibit the induction of ATF4 in response to hypoxic stress. These studies demonstrate the essential role of ATF4 in the response to hypoxic stress, define the pathway for its induction, and reveal that GADD34, a target of ATF4 activation, negatively regulates the eIF2α-mediated inhibition of translation. Taken with the concomitant induction of additional ER-resident proteins identified by our microarray analysis, this study suggests an important integrated response between ER signaling and the cellular adaptation to hypoxic stress.
Mammalian cells have the ability to alter their gene expression in order to adapt to a variety of environmental stresses, including nutrient depletion, oxidative stress, UV irradiation, reductive stress, exposure to toxins, and hypoxia, although the exact molecular events controlling the stress response have not been fully elucidated.
Hypoxic stress plays a pivotal role in normal human development and physiology, including embryogenesis and wound repair, and has been well studied for its importance in the pathogenesis of several human diseases, namely, heart disease, stroke, diabetes, and cancer (for a detailed review, see reference 52). Hypoxia results when oxygen availability does not meet the demand of the surrounding tissue, resulting in decreased oxygen tension. In cancer this is initiated by the rapid proliferation of tumor cells, which gives rise to abnormal and chaotic vasculature, leading to the development of occlusions, blind ends, and vesicular shunts (4). The presence of hypoxic cells in solid tumors is well documented, and both clinical and experimental evidence suggests that the hypoxic microenvironment of a tumor helps to produce a more aggressive phenotype (62) by functioning as a selective pressure for the clonal expansion of apoptotically insensitive cells (16). The presence of hypoxic regions in solid tumors also correlates with a poor prognosis and has been shown to limit the efficacy of standard anticancer treatments, such as radiotherapy and chemotherapy (5). A key element to cellular survival and adaptation during hypoxia is the transcription factor HIF-1 (hypoxia-inducible factor 1), the master regulator of oxygen homeostasis. Numerous critical genes are tightly regulated by HIF-1, including growth factors, oncoproteins, transcription factors, and glycolytic enzymes (62a), which mediate a shift in cellular metabolism toward energy conserving anaerobic glycolysis (53).
Other mechanisms of gene regulation are important to the cellular response to stress, such as the control of translation initiation. The importance of translational control on gene expression was originally proposed to play a fundamental role during development (47) and has subsequently been proven critical in regulating numerous physiological processes in the cell, including growth stimulation (39), cell cycle progression (48), differentiation (55), endoplasmic reticulum (ER) stress, (17), and oncogenic signaling in cancer (46). Translational control provides a rapid and reversible mechanism of expression, whereas transcriptional induction can take hours to occur.
Regulation of eukaryotic protein translation occurs mainly at the level of translation initiation. Most mRNAs recruit ribosomes through the m7G-cap structure by the eukaryotic initiation factor 4F (eIF4F) complex, followed by binding of the 43S preinitiation complex, consisting of the 40S ribosomal subunit, eIF1A, eIF3, and eIF2-GTP bound to the initiator tRNA, before scanning downstream to the initiating AUG (29). Successful translation initiation is only achieved when eIF2α binds GTP and (Met) tRNA, thereby forming the ternary complex. Formation of this complex is dependent on the exchange factor eIF2B, which exchanges the GDP-bound eIF2α for GTP. This can be inhibited by the phosphorylation of eIF2α at Ser-51 by an active eIF2α kinase. Mammalian cells have several eIF2α kinases that are activated in response to a variety of cellular stresses. PKR is activated by double-stranded RNA as a result of viral infection, whereas the ER-resident kinase, PERK, is activated by malfolded proteins in response to ER stress (19). The transcriptional effects during hypoxia and the result of HIF-1 signaling on cellular survival and adaptation are well-studied phenomena, whereas the contribution of translational control on hypoxia-responsive gene expression remains unclear. PERK has been implicated in the phosphorylation of eIF2α and the resulting attenuation of protein translation in response to hypoxic stress (28). Despite a profound inhibition of translation initiation that occurs in response to hypoxia, several discrete transcripts remain efficiently translated, including VEGF (58), HIF-1α (31), BiP (36), and ODC (45). These cellular mRNAs are able to recruit ribosome binding to internal ribosome entry sites (IRESs) without the need of cap recognition from the eIF4F complex.
We have focused on identifying novel hypoxia regulated genes with the use of microarray analysis of polysomal and total mRNA populations in order to gain insight into both the transcriptional and translational changes that occur in response to hypoxic stress. Our studies reveal the preferential translation of numerous hypoxia-induced genes namely, eIF5, ATF3, ATF4, ATF6, VEGF, FGF2, and IGFBP4. One of these, activating transcription factor 4 (ATF4) is an important mediator of the unfolded protein response (UPR), supporting the possibility of an integrated response between the UPR and hypoxia through the translational regulation of ATF4.
MATERIALS AND METHODS
Cell culture.
HeLa cells and 293T cells were maintained in alpha-modified Eagle medium supplemented with a 10% mixture of donor bovine serum and fetal calf serum (FCS; 3:1). Wild-type, PERK−/−, PKR−/−, and PERK−/− PKR−/− mouse embryonic fibroblasts (MEFs) were maintained in alpha-modified Eagle medium supplemented with 10% FCS. The constitutively active GADD34 C-terminal protein fragment was expressed in cells by transduction of the A1 retrovirus as previously described (40). HT-29 cells stably transfected with the GADD34 C-terminal fragment (HT29-A1) and control HT-29 cells transfected with the parent plasmid (HT29-Puro) were maintained in McCoy's medium supplemented with 10% FCS, β-mercaptoethanol (0.55 μM), nonessential amino acids (10 μM), and puromycin (1 μg/ml). Cells were treated with thapsigargin (100 nM), cycloheximide (CHX; 100 mM), and actinomycin D (ActD; 100 μM) where indicated.
Hypoxic treatments.
All experiments were performed with exponentially growing cells. For all experiments except for polysome fractionation, cells were plated in 60-mm glass culture dishes at a density of ∼106 cells/plate. After approximately 20 h, the culture dishes were placed in a hypoxic culture chamber (MACS VA500 miroaerophilic workstation [Don Whitley Scientific, Shipley, United Kingdom]). Hypoxic conditions were achieved with 90% N2, 5% CO2, 5% H2 (anaerobic grade gas), and palladium catalysts to scavenge trace oxygen.
Isolation of polysomes and RNA.
HeLa cells were plated on 150-mm glass culture dishes at a density of ∼7 × 10⁶ cells/plate. Cells were left untreated for approximately 32 h prior to hypoxic exposure (16 h) or they were left untreated (0 h). For the isolation of intact polysomes, cells were first treated with 0.1 mg of CHX/ml for 3 min (37°C) prior to cell lysis. Cell extracts were prepared at 4°C; the cells were washed twice with phosphate-buffered saline containing CHX (0.1 mg/ml) and lysed in RNA lysis buffer (1% Triton X-100, 0.3 M NaCl, 15 mM MgCl2, 15 mM Tris [pH 7.4], 0.1 mg of CHX/ml, 100 U of RNasin [Ambion, Austin Tex.]/ml). Lysed HeLa cells were stained with Hoechst 33342 (5 μg/ml) to ensure nuclei were intact during lysis. Nuclei were subsequently removed by centrifugation (3,000 rpm, 5 min, 4°C), and the supernatant was centrifuged again to remove cellular debris (14,000 rpm, 5 min, 4°C). The lysate was layered onto 10-ml continuous sucrose gradients (10 to 50% sucrose in 15 mM MgCl2-15 mM Tris [pH 7.4]-0.3 M NaCl). Approximately 20% of the total volume of the cytoplasmic lysate was used as a source for total RNA by using phenol-chloroform extraction and ethanol precipitation. After 90 min of centrifugation at 39,000 rpm in an SW41-Ti rotor at 4°C, the absorbance at 254 nm was measured continuously as a function of gradient depth. Each fraction was digested with proteinase K, and RNA was recovered from individual fractions by phenol-chloroform extraction and ethanol precipitation.
Microarray analysis.
After polysome fractionation and RNA isolation, RNA from the high-molecular-weight polysomes (fractions 7 to 10 or fraction 11) were pooled from the normoxic samples (hereafter called 0-h poly) and from the hypoxic samples (hereafter called 16-h poly). Prior to microarray analysis RNA from the polysome fractions and the total RNA from the cytoplasmic lysates (0-h total and 16-h total) was purified with the RNeasy kit (Qiagen, Mississauga, Ontario, Canada) according to the manufacturer's instructions. First, 20 μg of each RNA sample was processed according to the manufacturer's standard protocol (Affymetrix, Santa Clara, Calif.) and hybridized to an Affymetrix HGU95Av2 chip. Three independent 16-h poly and 0-h poly samples were obtained, and two independent 16-h total and 0-h total samples were obtained. The data from three independent experiments were analyzed by using the Affymetrix Mass 5.0 software and Genespring software (Silicon Genetics, Redwood City, Calif.).
Total cellular changes and polysome analysis.
Prior to the assessment of gene changes in response to hypoxic stress, data were filtered in order to decrease the number of irrelevant unchanging genes. Genes classified as absent (Affymetrix MAS 5.0) across all gene chips were removed from the analysis, as were genes whose mean signal intensity for one or more samples was not greater than 600. (This number reflects the background noise of the microarray and would not result in a meaningful interpretation of the data generated.) To identify total cellular changes in gene expression, we used a mean cutoff of twofold when we compared the 0-h total gene chips to the 16-h total gene chips. Genes were further categorized based on molecular function and sorted based on fold change (only previously corroborated and interesting gene changes are reported here).
To identify genes that are preferentially translated during hypoxic stress, we compared the mean signal intensities of the 0-h poly gene chips to the 16-h poly gene chips by using a mean cutoff of twofold. In order to identify purely translationally regulated candidates, we removed genes from this list that demonstrated a concomitant increase in total mRNA expression (>3-fold change in the 16-h total gene chip relative to the 0-h total gene chip). Using Genespring software, we used Venn diagrams in order to subtract genes induced by the hypoxic stress and genes that were preferentially mobilized into the polysome fractions during hypoxic stress. Genes were further categorized based on molecular function and sorted on the ratio of 16-h poly signal to 0-h poly signal, which was used as a basis for interpreting the efficiency of translation during hypoxic stress. Analysis of variance (ANOVA) was used to assess the statistical significance of the polysomal changes.
Quantitative RT-PCR.
The total and polysomal RNA described above from hypoxic and normoxic treated HeLa cells was reverse transcribed (500 ng of RNA) in the presence of 250 pg of vesicular stomatitis virus M protein (VSV-M) RNA (a viral transcript used as a control for reverse transcription [RT] efficiency and quantitative real-time PCR [Q-PCR]). Quantitative PCR was performed in triplicate to amplify all targets by using the FastStart DNA Master SYBR Green I kit (Roche Diagnostics, Laval, Canada) according to the manufacturer's instructions and the Roche LightCycler thermocycler. Crossing points were converted to absolute quantities based on standard curves generated for each target amplicon. All target signals were subsequently normalized to VSV-M in order to correct for RT-PCR efficiency. The following primers were used: hATF4 left (5′-CTTACGTTGCCATGATCCCT-3′) and right (5′-CTTCTGGCGGTACCTAGTGG-3′), mATF4 left (5′-TCCTGAACAGCGAAGTGTTG-3′) and right (5′-ACCCATGAGGTTTCAAGTGC-3′), eIF5 left (5′-TTGAAGGAGGCAGAGGAAGA-3′) and right (5′-ACATGTTGCACTTCTGGCTG-3′), txbp151 left (5′-CCAAAGGCTCCAAAAACAAA-3′) and right (5′-CATTTCACAGACTTGCCCCT-3′), hsCDC6 left (5′-5′-TTGTTGTTGTTTTTGAGGCG-3′) and right (5′-CCTGGCCAACATGGTAAAAC-3′), VSV-M Astart (5′-ACGAATTCAAATTAGGGATCGCACCACC-3′) and Bend (5′-ACGGATCCCGTGATACTCGGGTTGACCT-3′), ATF3 left (5′-TAGGCTGGAAGAGCCAAAGA-3′) and right (5′-TTCTCACAGCTGCAAACACC-3′), prolyl-4 hydroxylase left (5′-CCCATGTCAACGTGACAGAC-3′) and right (5′-GCAGCCACTTTGATCCTAGC-3′), ATF6 forward (5′-AGCAGGAACTCAGGGAGTGA-3′) and reverse (5′-GGAGGTAAGGAGGAACCGAC-3′), BiP forward (5′-CCACCAAGATGCTGACATTG-3′) and reverse (5′-GAAAAGCAGTAAACAGCCGC-3′), and cyclin D3 forward (5′-AGGCTGATGGGACAGAATTG-3′) and reverse (5′-AGCTGAGCAGAAAGCAAAGC-3′).
Q-PCR results are presented as either the number of transcripts in total RNA or as the polysomal RNA per cell. The results from each transcript were normalized to an exogenous control (VSV-M), multiplied by 100, and transformed to a log scale prior to plotting.
Immunoblotting.
After treatments, cells were placed on ice, washed with PBS, and lysed on ice in 2× WB buffer (5 mM Tris [pH 6.8], 0.5% sodium dodecyl sulfate, 2% glycerol, 2 mM dithiothreitol) supplemented with Complete mini protease inhibitor cocktail tables (Roche Diagnostics, Sussex, United Kingdom), 2 mM NaPPi, and 2 mM NaF for Western analysis. Protein concentrations of each sample were determined by the modified Bradford assay as recommended by the manufacturer (Bio-Rad, Hercules, Calif.). Proteins were resolved on sodium dodecyl sulfate-10% polyacrylamide gels and transferred onto Hybond ECL nitrocellulose membrane (Amersham, Arlington Heights, Ill.) with a wet transfer system (Bio-Rad). Membranes were stained with 0.15% Ponceau red (Sigma) to ensure equal loading and transfer and then blocked with 5% (wt/vol) dried nonfat milk in TBST buffer (10 mM Tris base, 150 mM NaCl, 0.5% Tween 20).
Primary antibodies for anti-rabbit Ser-51 phosphorylated eIF2α (1:500) and anti-mouse eIF2α (1:500; recognizes both the unphosphorylated and the phosphorylated forms of eIF2α) were obtained from Cell Signaling Technologies (Beverly, Mass.). The primary antibody for anti-mouse HIF-1α (1:1,000), H72320, was obtained from Transduction Labs, Lexington, Ky. Primary antibody sc-200 for anti-rabbit ATF4 (1:250) was obtained from Santa Cruz Biotechnology, Santa Cruz, Calif. Primary antibody for anti-mouse actin (1:10,000), A-5316, was obtained from Sigma, St. Louis, Mo. The primary antibody for anti-rabbit GADD34 (1:1,000) was kindly provided by David Ron (Skirball Institute). The primary antibody for BiP (1:1,000) was kindly provided by Martin Holcik (CHEO, Ottawa, Ontario, Canada). Anti-rabbit secondary antibody was obtained from Jackson ImmunoResearch (1:10,000), and anti-mouse secondary antibody was obtained from Bio-Rad (1:3,000). Horseradish peroxidase-coupled secondary antibodies were detected by enhanced chemiluminescence (ECL-Plus; Amersham Biosciences, Piscataway, N.J.) reagent kit in accordance with the manufacturer's recommendations.
RESULTS
Protein translation is inhibited by hypoxic stress.
In the present study, we used HeLa cervical carcinoma cells to study the preferential translation of messages after severe hypoxic stress (O2 < 0.01%). Microarray analysis was used to analyze gene expression profiles from total cellular mRNAs and polysome-associated mRNAs in HeLa cells grown in a hypoxic or a normoxic environment.
Polysomal mRNA was isolated from total cellular mRNA by fractionation through a 10 to 50% sucrose gradient. The optical density profiles of the sucrose gradients are shown in Fig. 1. In each gradient the top fractions (fractions 1 to 4) represent ribosomal complexes (40S, 60S, and 80S) and free mRNAs, whereas the bottom fractions (fractions 5 to 10 or fraction 11) represent transcripts associated with polysomes. In order to verify the proper identification of the polysomal peaks, cells were treated with puromycin, an inhibitor of translation that causes the release of nascent peptides and mRNAs from ribosomes. The resulting polysome profile demonstrated a shift of the mRNAs from the polysomes into the free mRNA, 40S, and 60S ribosomal complexes and monosome peaks (data not shown). After hypoxic stress, there is a significant inhibition in protein translation, as seen by the accumulation of free mRNA and rRNAs, with a considerable increase in the monosome peak. HeLa cells remained >98% viable throughout the 16 h of hypoxic stress (data not shown). For microarray analysis, mRNA associated with more than two ribosomes were pooled. These messages are thus indicative of highly expressed transcripts that undergo preferential translation in an environment that favors the overall inhibition of protein translation. Total RNA was also obtained from 16-h hypoxic lysates and normoxic lysates, hereafter named 16-h total and 0-h total, respectively, treated identically to the polysomal RNA prior to sucrose gradient fractionation. Affymetrix MAS 5.0 software was used to compare steady-state changes and polysomal changes in gene expression between the 16-h and 0-h lysates.
FIG. 1.

Hypoxic stress results in global inhibition of protein translation. (A and B) Polysome profiles (absorbance at 254 nm) in cell lysates fractionated by sucrose density ultracentrifugation. HeLa cells were exposed to hypoxic stress for 16 h (B) or left untreated (A). Cells were treated with CHX at 100 μg/ml (37°C, 3 min) and lysed in a Triton X-100 buffer (4°C). Cell lysates were layered on a 10-ml continuous sucrose gradient (10 to 50%) and ultracentrifuged in an SW41 rotor at 39,000 rpm for 90 min. The positions of the polysomes and ribosomal subunits are indicated. The increase in monosome-bound transcripts and ribosomal subunits combined with the decrease in polysomes apparent in the hypoxia-treated cells is indicative of decreased protein translation. RNA extracted from the polysome fractions was applied to a 1% agarose gel and electrophoresed. The abundant 28S, 18S, and 5S rRNAs were directly visualized by ethidium bromide staining. The polysome fractions isolated for microarray analysis, 0-h poly and 16-h poly, are indicated.
Microarray analysis of total and polysomal RNA.
We compared the 0-h and 16-h total mRNA species to identify changes in overall gene expression after hypoxic stress. We found that 11.6 and 10.3% of the accurately measured genes (see Materials and Methods for a description of this interpretation) were induced or repressed >2-fold, respectively (Fig. 2A). Interestingly, of the induced genes, only 58% of them were found to be enhanced in the polysomes, whereas the remaining 42% were either translationally unchanged or repressed, signifying that all transcripts are not translated with equal efficiency. These genes were functionally clustered and are displayed in Table 1. Many of the genes listed have been previously identified in the literature, indicating that our microarray analysis provided an accurate representation of known hypoxia-induced gene expression. The previously corroborated hypoxia-induced genes are referenced, including genes involved in glucose metabolism (Glut3, PGK, and G6PD), angiogenesis (VEGF, HO-1, PAI, and angiogenin), pH regulation (CA9 and CA12), cell stress response (CHOP, ORP150, and BiP), and cell death (NIP3 and BIK).
FIG. 2.

Scatter plots of oligonucleotide probes as affected by hypoxic stress. Total and polysomal RNAs were hybridized to the Affymetrix Human Genome U95A (HG-U9Av2) oligonucleotide microarray chip. Relative gene probe intensities (x axis) of total RNA (A) and polysomal mRNA (B and C) of aerobic cells (0 h) were plotted against the corresponding gene probe intensities (y axis) of hypoxia-treated cells (16 h). Gene probes above the top green line represent genes induced >2-fold; gene probes below the bottom green line represent genes repressed >2-fold. (C) Gene probes in green represent genes that were induced >2-fold in the polysomes but whose total mRNA was not induced >2-fold. A short list of these translational candidates is presented in Table 2. Gene probes in yellow represent genes whose expression was induced >2-fold in both the total RNA and polysomal mRNA profiles.
TABLE 1.
Steady-state changes in gene expressiona
| Category and probe set | Fold change | Poly 16/0 | GenBank no. | Description | Reference(s) |
|---|---|---|---|---|---|
| Energy generation and metabolism | |||||
| 40193_at | 19 | 12.9 | X51956 | ENO2 gene for neuron specific (gamma) enolase | 24 |
| 37188_at | 14 | 12.7 | X92720 | Phosphoenolpyruvate carboxykinase | 42 |
| 1586_at | 11 | 18.8 | M35878 | Human insulin-like growth factor-binding protein 3 | 13 |
| 32331_at | 6 | 7.4 | X60673 | Adenylate kinase 3 (AK3) | 61 |
| 31488_s_at | 5 | 2.3 | S81916 | Phosphoglycerate kinase (alternatively spliced) | 24 |
| 40107_at | 3 | 5.5 | AF054987 | Aldolase C | 24 |
| 38042_at | 2.4 | 1.6 | X03674 | Glucose-6-phosphate dehydrogenase (G6PD) | |
| 36979_at | 2.4 | 3.1 | M20681 | Glucose transporter-like protein III (GLUT3) | 24, 61 |
| 35938_at | −12 | −10.0 | M72393 | Calcium-dependent phospholipid-binding protein (PLA2) | |
| 262_at | −3.8 | −3.6 | M21154 | _S_-Adenosylmethionine decarboxylase | |
| Angiogenesis or vessel dynamics | |||||
| 1103_at | 9.2 | 15.0 | M11567 | Angiogenin | 20 |
| 34777_at | 8.7 | 17.4 | D14874 | Adrenomedultin precursor | 10 |
| 36606_at | 5.9 | 2.9 | X51405 | Carboxypeptidase E | |
| 36100_at | 4 | 5.4 | AF022375 | Vascular endothelial growth factor (VEGF) | 7, 24, 50 |
| Matrix metabolism and pH regulation | |||||
| 40309_at | 83 | 85.6 | X66839 | Carbonic anhydrase IX | 37, 63 |
| 926_at | 20 | 8.8 | J03910 | Metallothionein-IG (MTIG) | |
| 34390_at | 20 | 20.4 | U90441 | Human prolyl 4-hydroxylase alpha (II) subunit | 60 |
| 38637_at | 17.3 | 20.5 | L16895 | Human lysyl oxidase (LOX) | |
| 33127_at | 13.5 | 11.9 | U89942 | Human lysyl oxidase-related protein (WS9-14) | |
| 37037_at | 10.2 | 14.9 | M24486 | Human prolyl 4-hydroxylase alpha subunit | 60 |
| 41750_at | 8.1 | 8.6 | D49489 | Protein disulfide isomerase-related protein P5 | |
| 34795_at | 7.8 | 5.4 | U84573 | Lysyl hydroxylase isoform 2 (PLOD2) mRNA | |
| 36454_at | 5.8 | 9.6 | AF037335 | Carbonic anhydrase precursor (CA12) | 63 |
| 36666_at | 5.7 | 5.1 | M22806 | Prolyl 4-hydroxylase β-subunit | 60 |
| Cell stress response or DNA repair | |||||
| 442_at | 12.2 | 15.8 | X15187 | tra1 mRNA | |
| 36614_at | 11.3 | 9.4 | X87949 | BiP | 36 |
| 38986_at | 6.3 | 7.2 | Z49835 | Protein disulfide isomerase (glucose-related protein 58) | |
| 1955_s_at | −6.1 | −10.6 | AF035528 | Smad6 mRNA | |
| 1104_s_at | −5 | −3.8 | M11717 | Human heat shock protein (hsp 70) | |
| 36785_at | −3.3 | −2.5 | Z23090 | 28-kDa heat shock protein | |
| Cell death and proliferation | |||||
| 37168_at | 16.5 | 20.7 | AB013924 | TSC403 protein | |
| 39436_at | 15.1 | 8.3 | AF079221 | BCL2/adenovirus E1B 19-kDa interacting protein 3a | |
| 654_at | 15.3 | 12.5 | L07648 | Human MXI1 mRNA | |
| 2011_s_at | 11.9 | 3.8 | U34584 | Human Bcl-2 interacting killer (BIK) | 27 |
| 38010_at | 10.8 | 10.4 | AF002697 | Homo sapiens E1B 19K/Bcl-2-binding protein Nip3 | 6 |
| 37028_at | 3.4 | 6.0 | U83981 | Apoptosis-associated protein (GADD34) | 34 |
| 37228_at | −4.6 | −5.9 | U01038 | pLK mRNA | |
| Cell cycle | |||||
| 1913_at | 3.5 | 2.9 | U47414 | Cyclin G2 | |
| 1206_at | −7.3 | −2.3 | X66364 | PSSALRE for serine/threonine protein kinase | |
| 38414_at | −5.3 | −3.6 | U05340 | p55CDC | |
| 1945_at | −4.7 | −7.0 | M25753 | Cyclin B | |
| 1794_at | −3.9 | −3.9 | M92287 | Cyclin D3 (CCND3) | 12 |
| 1943_at | −3.3 | −2.4 | X51688 | Cyclin A | |
| 35699_at | −3 | −4.4 | AF053306 | Mitotic checkpoint kinase Mad3L | |
| 1803_at | −2.3 | −2.7 | X05360 | CDC2 | |
| RNA splicing or transcription | |||||
| 36618_g_at | −23 | −12.0 | X77956 | 1d1 mRNA | 50 |
| 351_f_at | −4 | −2.4 | D28423 | Pre-mRNA splicing factor SRp20 |
Although changes in overall transcripts were conservative, hypoxic stress is known to cause a remarkable inhibition in protein translation. Indeed, 88.5% of genes demonstrated no increase in translation or were subjected to a substantial decrease in translation after hypoxia. By comparing the expression profiles of the 0-h poly and 16-h poly microarray chips we were able to deduce that 2.5% of genes demonstrated increased translational efficiency by >2-fold during hypoxia (Fig. 2C), as determined by their increased polysomal association without a concomitant increase in total cellular mRNA. It is important to stress that this portion of the differentially regulated genes would have been missed if only the total cellular transcript profiling had been performed. The data comparing gene expression of the polysome-associated transcripts from 0-h and 16-h hypoxia-treated HeLa cell extracts were used to generate a list of translational candidates. The genes listed in Table 2 were chosen based on high levels of mRNA in the polysomes at 16 h versus at 0 h (poly 16/0) and were grouped based on cellular function. One example, ATF4, has been described in the literature as being translationally induced in response to ER stress and amino acid starvation (18).
TABLE 2.
Hypoxia-induced translationally regulated genesa
| Function | Poly 16/0 | ANOVA value | Total 16/0 | GenBank no. | Name: derivation |
|---|---|---|---|---|---|
| Antiapoptosis or apoptosis | 4.1 | 0.179 | 2.2 | U33821 | TXBP151: Tax1-binding protein |
| 2.7 | 0.243 | 1.3 | X75861 | TEGT: testis enhanced gene transcript (BAX inhibitor 1) | |
| 2.7 | 0.015 | 1.8 | S81914 | IER3: immediate early response 3 | |
| 2.3 | 0.100 | 1.5 | Z15108 | PRKCZ: protein kinase C, zeta | |
| 2.3 | 0.007 | 1.9 | AB020680 | BAG5: BCL2-associated athanogene 5 | |
| 2.0 | 0.063 | 1.8 | AF099935 | GG2-1: tumor necrosis factor-induced protein | |
| Cell cycle regulator | 2.0 | 0.040 | 1.8 | U22398 | KIP2: Cdk-inhibitor p57KIP2 |
| DNA repair | 2.4 | 0.126 | 1.7 | D83702 | CRY1: cryptochrome 1 |
| 2.3 | 0.113 | 1.4 | D21089 | XPC: xeroderma pigmentosum | |
| Metabolism | 5.0 | 0.023 | 1.2 | AF061741 | SDR1: short-chain dehydrogenase/reductase 1 |
| 3.5 | 0.052 | 1.6 | AA873266 | PDK3: pyruvate dehydrogenase kinase | |
| 2.9 | 0.148 | 1.9 | Y10275 | PHKG1: phosphorylase kinase | |
| 2.1 | 0.205 | 1.2 | X69433 | IDH2: isocitrate dehydrogenase 2 | |
| 1.9 | 0.064 | 1.1 | M15182 | GUSB: glucuronidase | |
| 1.6 | 0.288 | 1.6 | X15573 | PFKL: phosphofructokinase | |
| Stress response/UPR | 9.0 | 0.013 | 2.7 | L19871 | ATF3: Activating transcription factor 3 |
| 5.0 | 0.037 | 1.2 | AL022312 | ATF4: activating transcription factor 4 | |
| 2.4 | 0.129 | 1.7 | D83702 | Casein kinase 1, epsilon | |
| 2.0 | 0.336 | 1.8 | AB017642 | OSR1: oxidative-stress responsive 1 | |
| 2.0 | 0.250 | 1.0 | X68277 | DUSP1: dual specificity phosphatase 1 | |
| 1.9 | 0.054 | 0.9 | AF005887 | ATF6: activating transcription factor 6 | |
| 1.9 | 0.080 | 1.0 | U09759 | MAPK9: mitogen-activated protein kinase 9 | |
| Regulation of transcription | 3.1 | 0.257 | 2.5 | U49020 | MEF2A: MADS box transcription enhancer factor 2 |
| 3.0 | 0.181 | 0.5 | AB015051 | DAXX: death-associated protein 6 | |
| 2.8 | 0.010 | 1.3 | AB000468 | RNF4: ring finger protein 4 | |
| 2.6 | 0.033 | 1.9 | U11861 | G10: maternal G10 transcript | |
| 2.5 | 0.168 | 1.0 | AF069733 | TADA3L: transcriptional adaptor 3 | |
| 2.3 | 0.017 | 2.0 | X51345 | JUNB: junB proto-oncogene | |
| 2.3 | 0.113 | 1.6 | M95929 | PMX1: paired mesoderm homeobox | |
| 2.2 | 0.216 | 1.5 | X91648 | PURA: purine-rich element binding protein A | |
| 2.2 | 0.068 | 1.9 | AF038177 | FHX: FOXJ2 forkhead factor | |
| 2.1 | 0.022 | 1.4 | M34539 | FKBP1A: FK506 binding protein 1A | |
| 2.1 | 0.500 | 1.1 | M25077 | SSA2: Sjögren syndrome antigen A2 | |
| 2.0 | 0.025 | 1.2 | Z35278 | RUNX3: runt-related transcription factor 3 | |
| 2.0 | 0.027 | 1.1 | AF078096 | FOXC1: forkhead box C1 | |
| 2.0 | 0.004 | 1.6 | U71300 | SNAPC3: small nuclear RNA activating complex | |
| 1.9 | 0.097 | 0.9 | M16801 | NR3C2: nuclear receptor | |
| 1.8 | 0.480 | 1.9 | M27691 | CREB1: cAMP responsive element binding protein 1 | |
| 1.8 | 0.702 | 1.5 | AF019214 | HBP1: HMG-box containing protein 1 | |
| Signal transduction | 4.0 | 0.070 | 1.4 | L11284 | MAP2K1: mitogen-activated protein kinase kinase 1 |
| 2.2 | 0.167 | 1.6 | M62403 | IGFBP4: insulin-like growth factor binding protein 4 | |
| 2.0 | 0.154 | 1.3 | M97815 | CRABP2: cellular retinoic acid binding protein 2 | |
| Protein biosynthesis | 2.8 | 0.004 | 1.7 | X94754 | MARS: methionine-tRNA synthetase |
| 2.5 | 0.014 | 2.0 | AL050281 | NAG: neuroblastoma-amplified protein | |
| Regulation of translation | 3.4 | 0.459 | 1.7 | U49436 | eIF5: eukaryotic translation initiation factor 5 |
| Angiogenesis | 2.2 | 0.032 | 1.3 | U43368 | VEGFB: vascular endothelial growth factor B |
| 2.0 | 0.053 | 0.7 | M27968 | FGF2: fibroblast growth factor 2 | |
| Iron ion transport | 5.5 | 0.000 | 1.3 | L20941 | FTH1: ferritin, heavy polypeptide 1 |
| Proteolysis | 3.5 | 0.048 | 1.9 | AB029027 | PITRM1: pitrilysin metalloproteinase 1 |
Patterns of gene expression during hypoxia.
Two predominant patterns of gene expression emerged throughout the analysis of the microarray data: changes in the steady-state mRNA levels and translationally mediated changes. Changes in the steady-state levels of mRNA could be a result of changes in transcription or may involve changes in mRNA stability. These were marked by an increase in total mRNA expression and may or may not correlate with their presence in the polysomes, since not all cellular transcripts are translated with equal efficiency. In contrast, genes that are regulated exclusively at the translational level display a higher efficiency of translation, as seen by their presence in the polysomes but do not demonstrate any change in their gene expression at the level of total mRNA. We used Q-PCR to verify the translational regulation of six candidate genes identified by our microarray analysis (Fig. 3). Q-PCR values were normalized to an internal control, VSV RNA encoding the M protein (VSV-M), added exogenously to each RT reaction. All data was converted to the number of transcripts per cell for a more meaningful interpretation of the data sets. Hypoxia causes numerous changes in gene expression, including those of housekeeping genes such as actin and GAPDH (glyceraldehyde-3-phosphate dehydrogenase). Thus, using a spiked viral mRNA as an internal control not only allows for the control of gene expression differences between normoxic and hypoxic samples, it also allows us to control for differences in the efficiency of each RT reaction.
FIG. 3.

ATF4 mRNA is more efficiently translated during hypoxia. (A) Translational candidates. The total mRNA expression does not change during hypoxia. Total RNA was isolated prior to sucrose gradient fractionation from hypoxia treated (16 h) or normoxic (0 h) HeLa cells, reverse transcribed, and quantified by real-time PCR. The quantities of each transcript are described as the number of transcripts isolated from total RNA per cell. Each sample was independently normalized to a spiked internal control. Q-PCR analysis was replicated in triplicate. The results are representative of the average ± the standard error of the mean (SEM) of at least five independent experiments. (B) Translational candidates. Transcripts are enriched in the polysomes during hypoxia. High-molecular-weight polysomes from hypoxia-treated (16 h) or normoxic (0 h) HeLa cells were pooled (fractions 7 to 11), reverse transcribed, and quantified by real-time PCR. The quantities of each transcript are described as the number of transcripts isolated from polysomal RNA per cell. Each sample was independently normalized to a spiked internal control. Q-PCR analysis was repeated in triplicate. The results are representative of the average ± the SEM of at least five independent experiments. (C) Trans-lation efficiency increases for translationally regulated genes. The efficiency of translation during hypoxic treatment (16 h) and normoxia (0 h) was plotted as the percentage of total mRNA associated with polysomes: (quantity of poly mRNAtime x/quantity of total mRNAtime x) × 100%. (D) Hypoxia-induced genes. Total mRNA expression is induced during hypoxia. Total RNA was isolated prior to sucrose gradient fractionation from hypoxia-treated (16 h) or normoxic (0 h) HeLa cells, reverse transcribed, and quantified by real-time PCR. The quantities of each transcript are described as the number of transcripts isolated from total RNA per cell. Each sample was independently normalized to a spiked internal control. Q-PCR analysis was replicated in triplicate. The results are representative of the average ± the SEM of at least three independent experiments. (E) Hypoxia-induced genes. Transcripts are enriched in the polysomes during hypoxia. High-molecular-weight polysomes from hypoxia-treated (16 h) or normoxic (0 h) HeLa cells were pooled (fractions 7 to 11), reverse transcribed, and quantified by real-time PCR. The quantities of each transcript are described as the number of transcripts isolated from polysomal RNA per cell. Each sample was independently normalized to a spiked internal control. Q-PCR analysis was repeated in triplicate. The results are representative of the average ± the SEM of at least three independent experiments. (F) Changes in translation efficiency for hypoxia induced genes. The efficiency of translation during hypoxic treatment (16 h) and normoxia (0 h) was plotted as the percentage of total mRNA associated with polysomes: (quantity of poly mRNAtime x/quantity of total mRNAtime x) × 100%.
Data from the translationally regulated candidates and transcriptionally regulated genes are illustrated in Fig. 3. Translationally active transcripts demonstrate a redistribution onto the polysomes without a concomitant increase in the amount of mRNA in the total lysate (Fig. 3A and B); therefore, translationally regulated genes are more efficiently translated in response to hypoxia (Fig. 3C). Even genes that appeared to be statistically insignificant by ANOVA (TXBP151 and eIF5), demonstrated consistent increases in their translational efficiency as determined by Q-PCR analysis. In contrast, transcriptionally induced genes exhibit a substantial increase in both the total lysate and the polysomal fractions (Fig. 3D and E). Examples of this regulation are the HIF-1-responsive genes, carbonic anhydrase 9 (CA9) and prolyl-4-hydroxylase-2 (P4H2). These genes, however, do not increase their overall translation efficiency (Fig. 3F). The detection of BiP in the high-molecular-weight polysomes substantiates the possibility of identifying a third expression profile, a transcriptional and translational-coupled response. BiP is both transcriptionally induced by hypoxia and preferentially translated, perhaps due to an IRES element in its 5′ untranslated region (UTR); as such there is an increase in the efficiency of BiP translation in response to hypoxia. ATF3 demonstrated a similar expression pattern to BiP under hypoxic stress, exhibiting a transcriptional induction in the total lysate and mobilization of the transcript onto the polysomes (Fig. 3D and E). The increase in the translational efficiency of ATF3 in response to hypoxia (Fig. 3F) indicates the likelihood of a combined transcriptional and translation induction of ATF3, a possibility to be further determined.
ATF4 protein expression is induced during hypoxia.
Previous reports have established a regulatory mechanism for the translational control of ATF4 in response to ER stress and amino acid starvation (18). The 5′UTR of human ATF4 encodes three short open reading frames (uORFs), two of which are conserved in all known species. These mediate the repression of ATF4 expression in unstressed cells. Under conditions of eIF2α phosphorylation, successful reinitiation at the authentic start codon results in the efficient translation of ATF4. Our observation that hypoxia results in the mobilization of ATF4 mRNA onto the polysomes made us question whether ATF4 is preferentially translated during hypoxic stress. Both the microarray and the Q-PCR analysis suggest a posttranscriptional induction of ATF4 during hypoxia. This was further corroborated by the induction of the ATF4 protein after both 4 and 16 h of hypoxia (Fig. 4A), with maximal ATF4 induction by 4 h. The translational regulation of ATF4 was further supported by the observation that treatment with the transcriptional inhibitor ActD did not prevent the accumulation of ATF4 protein during hypoxia (Fig. 3B). Similar observations were found with a second transcriptional inhibitor, DRB (data not shown). To refute the possibility that ATF4 protein expression was mediated by increased protein stability during translation, HeLa cells were treated with the translational inhibitor CHX before treatment with hypoxia and after 1 h of hypoxia (Fig. 4C and D). Cells treated with CHX before hypoxic stress do not induce ATF4 protein during 4 h of hypoxia and do not further induce ATF4 if treated with CHX after 1 h of hypoxic stress. ATF4 has a short half-life between 30 min and 1 h (32), which supports the observed immediate degradation of ATF4 after CHX treatment. These findings are consistent with the previously reported translational regulation of ATF4 during ER stress and amino acid deprivation (18).
FIG. 4.

ATF4 is translationally induced after hypoxic stress. (A) Immunoblot analysis of ATF4 and HIF-1α protein content in HeLa cells exposed to hypoxia or left untreated for the indicated period of time. Actin serves as a loading control. (B) Immunoblot of ATF4 and BiP in HeLa cells treated with hypoxia for the indicated period of time in the presence or absence of the transcriptional inhibitor ActD (100 μM) added 5 min before treatment. Similar results were obtained by using another transcriptional inhibitor, DRB at 100 μM (data not shown). Actin serves as a loading control. (C) Immunoblot of ATF4 and HIF-1α in HeLa cells treated with hypoxia for the indicated period of time in the presence or absence of the translational inhibitor CHX (100 μM). Actin serves as a loading control. (D) Immunoblot of ATF4 and HIF-1α in HeLa cells exposed to hypoxia for the indicated period of time. Cells were first treated with hypoxia, followed by the addition of the translational inhibitor CHX for 15 min, 30 min, or 1 h. Actin served as a loading control.
Phosphorylation of eIF2α by PERK is necessary for ATF4 translation during hypoxia.
The activation of eIF2α kinases and phosphorylation of eIF2α has been shown to be essential for the selective translational induction of ATF4 in response to both ER stress and amino acid starvation (18). The importance of PERK in the phosphorylation of eIF2α during hypoxic and anoxic stress has been reported (28).
Parallel analysis of ATF4 mRNA in the polysomes of PERK+/+ and PERK−/− MEFs revealed that in the absence of PERK there was a significant decrease in the amount of ATF4 mRNA recruited to polysomes and translated under both normoxic and hypoxic conditions (Fig. 5B and C). As expected, eIF2α phosphorylation was induced in response to hypoxic stress only in PERK+/+ MEFs (Fig. 5C). In a previous study, analysis of PKR knockout (PKR−/−) MEFs during hypoxic stress was not shown to have any impact on the levels of eIF2α phosphorylation (28). Our analysis of MEFs derived from wild-type, PKR knockout (PKR−/−), and PERK/PKR double knockout (PERK−/−, PKR−/−) mice confirmed these findings (Fig. 6). However, we sought to examine directly the effects of disrupting both the PKR and the PERK signaling pathways on ATF4 expression during hypoxia.
FIG. 5.

PERK is required for induction of ATF4 in response to hypoxic stress. (A) High-molecular-weight polysomes from normoxic cells (PERK+/+, PERK−/−, PKR−/−, PERK−/− PKR−/−, HT29-A1, and HT29-Puro) were pooled (fractions 7 to 11), reverse transcribed, and quantified by real-time PCR. The quantity of ATF4 is described as the number of ATF4 transcripts isolated from polysomal RNA per cell. Each sample was independently normalized to a spiked internal control. Q-PCR analysis was repeated in triplicate. (B) High-molecular-weight polysomes from hypoxia-treated (16 h) or normoxic (0 h) PERK+/+ and PERK−/− cells were pooled (fractions 7 to 11), reverse transcribed, and quantified by real-time PCR. The efficiency of ATF4 translation during hypoxic treatment (16 h) and normoxia (0 h) was plotted as the percentage of total mRNA associated with polysomes: (quantity of poly mRNAtime x/quantity of total mRNAtime x) × 100%. Each sample was independently normalized to a spiked internal control. Q-PCR analysis was repeated in triplicate. (C) Immunoblot of ATF4 and eIF2α phosphorylated on Ser-51 [eIF2a(p)] in PERK+/+ and PERK−/− MEFs for the indicated period of time after hypoxic stress. Actin served as a loading control.
FIG. 6.

PERK is necessary for ATF4 signal transduction during hypoxic stress. Immunoblot of ATF4, eIF2α(p), total eIF2α, and GADD34 from hypoxia-treated and 100 nM thapsigargin (Tg)-treated wild-type, PKR−/−, and PKR−/− PERK−/− double-knockout MEFs for the indicated periods of time. Actin served as a loading control.
As expected, hypoxia increased the levels of eIF2α phosphorylation and the induction of ATF4 in the wild-type and PKR−/− MEFs. Under normoxic conditions all MEFs exhibited very little expression of ATF4. Within 1 h of hypoxic stress, ATF4 expression was induced in both the wild-type and the PKR−/− MEFs (Fig. 6A and B). Although the magnitude of this induction appears to be lower in the PKR−/− cells relative to the wild type, the consequence of this on the eIF2α signaling pathway remains to be elucidated. Similar results were obtained with cells treated with thapsigargin. Treatment of double-knockout (PERK−/− PKR−/−) MEFs with either hypoxia or thapsigargin failed to induce phosphorylation of eIF2α or increase translation of ATF4 (Fig. 6C), whereas the PKR−/− thapsigargin-treated control demonstrated a phosphorylated eIF2α signal, as well as induced ATF4 protein expression.
GADD34 expression antagonizes the induction of ATF4 during hypoxia.
GADD34 protein can directly interact and activate the catalytic subunit of type 1 protein serine/threonine phosphatase (PP1), which in turn functions to dephosphorylate eIF2α to allow protein translation to resume (9, 40, 41). Recently, ATF4 was found to bind and activate a conserved ATF site in the promoter sequence of GADD34, providing a model for a negative feedback loop that might control protein translation during ER stress (35). To date, there is no evidence that GADD34 is induced during hypoxia. The data obtained with the wild-type, PKR−/−, and double-knockout MEFs during hypoxic stress revealed that the induction of GADD34 was inhibited when the PERK signaling pathway was repressed (Fig. 6B and C and Fig. 7). To determine whether GADD34 expression can antagonize eIF2α phosphorylation and ATF4 induction during hypoxia, HT29 cells stably expressing a C-terminal truncated mutant of GADD34 (HT-29 A1) were treated with hypoxia and thapsigargin. These cells express the insert of a retroviral clone A1, which encodes the COOH-terminal 299 amino acids (292 to 590) of the hamster GADD34 protein (40), which causes the constitutive dephosphorylation of eIF2α. Treatment of HT-29 A1 cells with hypoxia severely inhibited the phosphorylation of eIF2α and induction of ATF4; however, HT-29 cells expressing the parental plasmid (HT29-Puro) exhibited the same expression profile as wild-type and PKR−/− MEFs in response to hypoxia. Similar results were obtained when these cells were treated with thapsigargin. These findings suggest that ATF4 regulates the expression of GADD34, which in turn can inhibit the ATF4 signaling pathway during hypoxia. Q-PCR analysis verified that reduced levels of ATF4 protein expression observed in the knockout MEFs and the HT29-GADD34 truncated mutant was not the product of decreased ATF4 mRNA levels (Fig. 5A). Interestingly, the PKR−/− and double-knockout MEFs express higher basal levels of ATF4 mRNA than the wild-type MEFs. Similarly, higher ATF4 mRNA levels are expressed in HT29 cells expressing the COOH-terminal truncated GADD34.
FIG. 7.
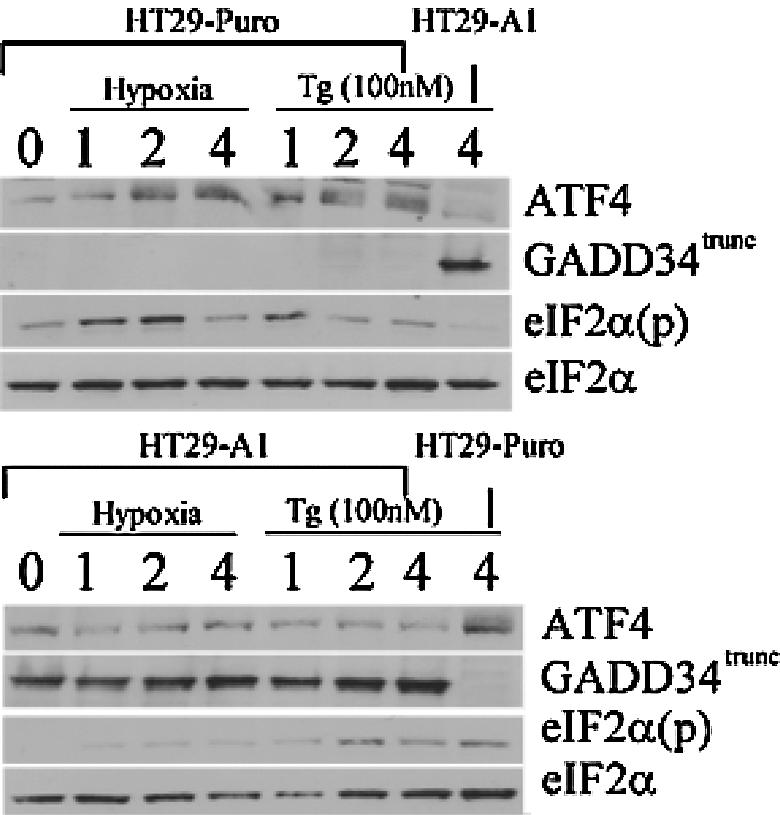
Overexpression of GADD34 can antagonize ATF4 signaling during hypoxia. Immunoblot of ATF4, eIF2α(p), total eIF2α, and GADD34 from hypoxia-treated or 100 nM thapsigargin (Tg)-treated HT29-Puro (parental) cells or HT29-A1 cells expressing a C-terminal fragment of GADD34 that constitutively dephosphorylates eIF2α (GADD34trunc) (41). Actin served as a loading control.
DISCUSSION
Adaptation to environmental stress is essential for long-term cell survival. Mechanisms that control cellular responses to stress are often exploited by tumor cells, allowing them to survive and thrive in unfavorable environments. As an example, metabolic changes that provide a growth advantage to tumor cells exposed to a hypoxic microenvironment are mediated in large part by the heterodimeric transcription factor HIF-1. The shift in cellular metabolism toward the energy conserving anaerobic glycolysis is facilitated by the HIF-1-regulated glycolytic enzymes (phosphoglycerate kinase 1 and aldolase A) and glucose transporters (GLUT-1 and GLUT-3) (14, 54, 56). Tolerance to hypoxia is also promoted through changes in protein translation. Translation is the second largest consumer of ATP (22) in the cell, and its coordinated shutdown may be one strategy to ensure energy conservation in the cell when ATP levels are limiting. It has been well established that hypoxic stress results in a profound inhibition in translation (30, 33, 43), thereby causing the majority of mRNA transcripts to experience diminished translational efficiencies. Our microarray analysis revealed that 95% of cellular mRNA species that do not change or decrease in abundance during hypoxia experience a decrease in their translational efficiency. PERK has been implicated in the inhibition of translation during hypoxia through the phosphorylation of eIF2α at Ser-51 (28). However, despite PERK-mediated inhibition, the translation of some genes remains unaffected, whereas others, e.g., HIF-1α and its downstream gene products (31) are translated more efficiently. Consequently, cells must be capable of maintaining and inducing gene expression in order to mediate cellular adaptation and cell viability during hypoxia.
A collective analysis of data generated by microarray and Q-PCR facilitated the identification of three classes of gene expression that likely contribute to this strategy. The first category includes mRNAs that are transcriptionally induced and are more efficiently translated under hypoxic stress; both BiP and ATF3 are examples of this method of gene regulation (Fig. 3D to F; additional candidate genes are listed in Table 1). A second category includes genes that are transcriptionally induced and whose translational efficiencies are either unchanged or diminished in response to hypoxia. CA9 and P4H2, both HIF-1-regulated gene products, demonstrate a decrease in their translational efficiencies during hypoxia (Fig. 3D to F; additional candidate genes are listed in Table 1). The third class of gene expression includes genes that are more efficiently translated during hypoxia without an associated transcriptional induction in total mRNA. Genes that correspond to this category include eIF5, txbp151, ATF6, and ATF4 (Fig. 3A to C; additional candidate genes are listed in Table 2). Similar analyses have been previously used to identify translationally regulated genes involved in host cell response to poliovirus infection (26), T-cell activation (38), VHL expression (14), and most recently in oncogenic signaling through Ras and Akt (46). Thus, a combination of changes in steady-state mRNA and translational changes in gene expression can modulate the cellular responses to stress.
The selective inhibition of cap-dependent translation could regulate the translational expression of important hypoxia-responsive genes with IRESs. IRES-mediated initiation was first discovered in picornaviruses such as poliovirus (25). Many cellular IRES elements—namely, PDGF2 (2), c-sis (51), APAF-1 (8), c-myc (59), and XIAP (23)—function under stress conditions when rates of protein synthesis via cap-dependent translation are reduced. Specifically, VEGF (58), HIF-1α (31), BiP (36), and ODC (45) have demonstrated functional IRES activity during hypoxic stress. The importance of IRES expression as a key regulator of translation during hypoxia currently remains undetermined. We are undertaking efforts to determine which, if any, of the translationally regulated transcripts reported possess functional IRESs.
ATF4, an important mediator of the UPR, is ubiquitously expressed at low basal levels, although poorly translated in unstressed cells due to the presence of three uORFs in its 5′UTR (18). This regulatory mechanism resembles that of the yeast protein GCN4. In yeast, global inhibition of translation occurs upon amino acid depletion. Active GCN2 phosphorylates eIF2α and preferentially promotes the synthesis of GCN4, a transcription factor that controls the expression of genes involved in amino acid biosynthesis (21).
Translation of ATF4 rapidly follows eIF2α phosphorylation during times of ER stress, arsenite treatment, and amino acid starvation (17). During hypoxia PERK activation results in the phosphorylation of eIF2α (28); taken together, this suggests an important UPR-integrated response to hypoxic stress. Microarray analysis of total cellular mRNAs revealed the transcriptional induction of many other ER-resident proteins, including GADD34, GRP58, HSP70, Grp78/BiP, and HSP28 (Table 1), as well as CHOP/Gadd153, ORP150, and Gadd45 (C. Koumenis, unpublished data), further supporting the connection between hypoxia and the UPR.
Our studies with PERK−/− MEFs have shown that this kinase is absolutely required for ATF4 translation (Fig. 5C). Interestingly, even in the absence of efficient translation, ATF4 mRNA is still recruited, to some extent, into the polysome fraction. Since we and others have shown that the initiation of translation at the authentic start codon of ATF4 is dependent on PERK phosphorylation of eIF2α (18, 28), our results (Fig. 5B) suggest that ATF4 mRNA can be recruited to the polysome fraction in the absence of PERK activity through initiation and translation of upstream ORFs.
Although others have suggested that anoxic induction of ATF4 is regulated at the level of protein stability (1), our experiments with CHX treatment of HeLa cells (Fig. 4) suggest a requirement for de novo protein synthesis. Although we cannot exclude that increased protein stability of ATF4 may contribute to its posttranslational regulation, our data demonstrate that ATF4 is regulated, at least in part, by an increase in its translational efficiency during hypoxic stress.
Our microarray analysis revealed an induction of GADD34 gene expression in the total cellular mRNA by 3.4-fold accompanied by a 6.1-fold increase in its translational efficiency. GADD34 directs the catalytic subunit of protein phosphatase 1 to eIF2α (9, 35, 40), leading to its dephosphorylation and promoting resolution of the translational repression stage of the UPR (41). ATF4 is known to directly bind and activate an ATF site upstream of the GADD34 promoter (35); however, the role of GADD34 expression in the attenuation of hypoxia-induced eIF2α phosphorylation has not been addressed. Phosphorylation of eIF2α occurs upon acute exposure to hypoxic stress yet eIF2α phosphorylation appears to subside by 8 h (28). Our data demonstrate that induction of GADD34 begins after 2 h of hypoxic stress and is strongly induced by 4 h (Fig. 7). Furthermore, over expression of a COOH-truncated GADD34, which constitutively dephosphorylates eIF2α, demonstrated a severe inhibition in the induction of ATF4 during hypoxia (Fig. 7). This suggests an important role for GADD34 as a negative feedback regulator, mediating eIF2α dephosphorylation and inhibiting ATF4 expression during hypoxic stress (Fig. 8). Protein synthesis inhibition and phosphorylation of eIF2α are transient in response to ER stress (44). Sustained eIF2α phosphorylation is lethal both in cultured cells and in the in vivo neuronal response to ischemic stress (11). It has been suggested that the GADD34 negative feedback loop is necessary for cellular recovery after ER stress (41), as seen by a decrease in cell survival in cells expressing a GADD34 mutant lacking the COOH-terminal domain necessary for PP1 activation and eIF2α dephosphorylation. In addition, it has been demonstrated that expression of a nonphosphorylatable eIF2α partially protects cells from apoptosis. Conversely, the expression of an eIF2α phosphormimetic (S51D) increased apoptotic cell death (57). The observation that the mechanism of translational inhibition during prolonged hypoxic exposure changes from a global inhibition through eIF2α phosphorylation to a selective inhibition of cap-dependent translation by preventing the formation of eIF4F complexes (B. G. Wouters, unpublished data), presents the possibility of a molecular switch responsible for this response. The attenuation of eIF2α phosphorylation by GADD34 during hypoxia may play a role in this molecular switch.
FIG. 8.

Model depicting the role of ATF4 during Hypoxic stress. Hypoxia and oxidative stress activate the eIF2α kinase PERK. Phosphorylation of eIF2α results in the global inhibition of protein translation. Some transcripts, such as ATF4, ATF6, and eIF5, are able to escape this general control mechanism. Transcriptional induction of GADD34 results in the activation of PP1 and the dephosphorylation of eIF2α after prolonged exposure to hypoxia. The microarray data also support the notion that numerous ER-resident proteins are induced in response to hypoxic stress, suggesting that cellular adaptation to hypoxic stress may rely on a integrated ER-generated stress signal.
Our experiments show that in response to severe hypoxic stress, the result of translational inhibition promotes the selective translation of several hypoxia responsive genes. The increase in the translational efficiency of these genes at a time of global protein synthesis inhibition indicates the importance of rapid and reversible gene expression in response to hypoxic stress. The preferential translation of ATF4 and the analogous translational and transcriptional induction of other ER-resident proteins suggests an integrated stress response involving an ER-generated signal and the cellular adaptation to hypoxia (Fig. 8). Furthermore, induction of GADD34 and its role in the dephosphorylation of eIF2α may be an essential intermediate signal for the switch from the inhibition of global translation to a more selective inhibition of cap-dependent translation.
Understanding the molecular events that support the development of tumor cell resistance to hypoxia is imperative for the discovery of effective therapies. The ability of hypoxic tumor cells to simultaneously promote angiogenesis, metastasis, and glycolysis, substantiates the need of cellular adaptation for continued cell viability. Whether the ATF4 signaling pathway is a key element that promotes cell survival during hypoxia still needs to be determined. Interestingly, the overexpression of a novel hypoxia regulated gene, SKIP3, has been implicating in destabilization of ATF4 protein in multiple primary human tumors (3). The occurrence of deregulated ATF4 expression in primary cancers therefore implicates ATF4 signaling in tumor progression.
Acknowledgments
J.D.B. was supported by OGGST with funds raised from the Ottawa Regional Cancer Center Foundation. This study was supported by a grant from the National Cancer Institute of Canada (to J.C.B). D.R. and H.P.H. were supported by National Institutes of Health grants ES08681 and DK47119.
We thank D. Stojdl for critically reading the manuscript.
REFERENCES
- 1.Ameri, K., C. E. Lewis, M. Raida, H. Sowter, T. Hai, and A. L. Harris. 2003. Anoxic induction of ATF-4 via HIF-1 independent pathways of protein stabilization in human cancer cells. Blood 103**:**1876-1882. [DOI] [PubMed] [Google Scholar]
- 2.Bernstein, J., O. Sella, S. Y. Le, and O. Elroy-Stein. 1997. PDGF2/c-sis mRNA leader contains a differentiation-linked internal ribosomal entry site (D-IRES). J. Biol. Chem. 272**:**9356-9362. [DOI] [PubMed] [Google Scholar]
- 3.Bowers, A. J., S. Scully, and J. F. Boylan. 2003. SKIP3, a novel Drosophila tribbles ortholog, is overexpressed in human tumors and is regulated by hypoxia. Oncogene 22**:**2823-2835. [DOI] [PubMed] [Google Scholar]
- 4.Brown, J. M., and A. J. Giaccia. 1998. The unique physiology of solid tumors: opportunities (and problems) for cancer therapy. Cancer Res. 58**:**1408-1416. [PubMed] [Google Scholar]
- 5.Brown, J. M., and Q. T. Le. 2002. Tumor hypoxia is important in radiotherapy, but how should we measure it? Int. J. Radiat. Oncol. Biol. Phys. 54**:**1299-1301. [DOI] [PubMed] [Google Scholar]
- 6.Bruick, R. K. 2000. Expression of the gene encoding the proapoptotic Nip3 protein is induced by hypoxia. Proc. Natl. Acad. Sci. USA 97**:**9082-9087. [DOI] [PMC free article] [PubMed] [Google Scholar]
- 7.Carmeliet, P., Y. Dor, J. M. Herbert, D. Fukumura, K. Brusselmans, M. Dewerchin, M. Neeman, F. Bono, R. Abramovitch, P. Maxwell, C. J. Koch, P. Ratcliffe, L. Moons, R. K. Jain, D. Collen, E. Keshert, and E. Keshet. 1998. Role of HIF-1α in hypoxia-mediated apoptosis, cell proliferation, and tumour angiogenesis. Nature 394**:**485-490. [DOI] [PubMed] [Google Scholar]
- 8.Coldwell, M. J., S. A. Mitchell, M. Stoneley, M. MacFarlane, and A. E. Willis. 2000. Initiation of Apaf-1 translation by internal ribosome entry. Oncogene 19**:**899-905. [DOI] [PubMed] [Google Scholar]
- 9.Connor, J. H., D. C. Weiser, S. Li, J. M. Hallenbeck, and S. Shenolikar. 2001. Growth arrest and DNA damage-inducible protein GADD34 assembles a novel signaling complex containing protein phosphatase 1 and inhibitor 1. Mol. Cell. Biol. 21**:**6841-6850. [DOI] [PMC free article] [PubMed] [Google Scholar]
- 10.Cormier-Regard, S., S. V. Nguyen, and W. C. Claycomb. 1998. Adrenomedullin gene expression is developmentally regulated and induced by hypoxia in rat ventricular cardiac myocytes. J. Biol. Chem. 273**:**17787-17792. [DOI] [PubMed] [Google Scholar]
- 11.DeGracia, D. J., R. Kumar, C. R. Owen, G. S. Krause, and B. C. White. 2002. Molecular pathways of protein synthesis inhibition during brain reperfusion: implications for neuronal survival or death. J. Cereb. Blood Flow Metab. 22**:**127-141. [DOI] [PubMed] [Google Scholar]
- 12.Douglas, R. M., T. Xu, and G. G. Haddad. 2001. Cell cycle progression and cell division are sensitive to hypoxia in Drosophila melanogaster embryos. Am. J. Physiol. Regul. Integr. Comp. Physiol. 280**:**R1555-R1563. [DOI] [PubMed] [Google Scholar]
- 13.Feldser, D., F. Agani, N. V. Iyer, B. Pak, G. Ferreira, and G. L. Semenza. 1999. Reciprocal positive regulation of hypoxia-inducible factor 1α and insulin-like growth factor 2. Cancer Res. 59**:**3915-3918. [PubMed] [Google Scholar]
- 14.Firth, J. D., B. L. Ebert, C. W. Pugh, and P. J. Ratcliffe. 1994. Oxygen-regulated control elements in the phosphoglycerate kinase 1 and lactate dehydrogenase A genes: similarities with the erythropoietin 3′ enhancer. Proc. Natl. Acad. Sci. USA 91**:**6496-6500. [DOI] [PMC free article] [PubMed] [Google Scholar]
- 15.Galban, S., J. Fan, J. L. Martindale, C. Cheadle, B. Hoffman, M. P. Woods, G. Temeles, J. Brieger, J. Decker, and M. Gorospe. 2003. von Hippel-Lindau protein-mediated repression of tumor necrosis factor alpha translation revealed through use of cDNA arrays. Mol. Cell. Biol. 23**:**2316-2328. [DOI] [PMC free article] [PubMed] [Google Scholar]
- 16.Graeber, T. G., O. C. Jacks, T. Housman, D. E. Koch, C. J. Lowe, and A. J Giaccia. 1996. Hypoxia-mediated selection of cells with diminished apoptotic potential in solid tumours. Nature 379**:**88-91. [DOI] [PubMed] [Google Scholar]
- 17.Harding, H. P., M. Calfon, F. Urano, I. Novoa, and D. Ron. 2002. Transcriptional and translational control in the mammalian unfolded protein response. Annu. Rev. Cell Dev. Biol. 18**:**575-599. [DOI] [PubMed] [Google Scholar]
- 18.Harding, H. P., I. Novoa, Y. Zhang, H. Zeng, R. Wek, M. Schapira, and D. Ron. 2000. Regulated translation initiation controls stress-induced gene expression in mammalian cells. Mol. Cell 6**:**1099-1108. [DOI] [PubMed] [Google Scholar]
- 19.Harding, H. P., Y. Zhang, and D. Ron. 1999. Protein translation and folding are coupled by an endoplasmic-reticulum-resident kinase. Nature 397**:**271-274. [DOI] [PubMed] [Google Scholar]
- 20.Hartmann, A., M. Kunz, S. Kostlin, R. Gillitzer, A. Toksoy, E. B. Brocker, and C. E. Klein. 1999. Hypoxia-induced up-regulation of angiogenin in human malignant melanoma. Cancer Res. 59**:**1578-1583. [PubMed] [Google Scholar]
- 21.Hinnebusch, A. G. 1997. Translational regulation of yeast GCN4: a window on factors that control initiator-tRNA binding to the ribosome. J. Biol. Chem. 272**:**21661-21664. [DOI] [PubMed] [Google Scholar]
- 22.Hochachka, P. W., L. T. Buck, C. J. Doll, and S. C. Land. 1996. Unifying theory of hypoxia tolerance: molecular/metabolic defense and rescue mechanisms for surviving oxygen lack. Proc. Natl. Acad. Sci. USA 93**:**9493-9498. [DOI] [PMC free article] [PubMed] [Google Scholar]
- 23.Holcik, M., C. Lefebvre, C. Yeh, T. Chow, and R. G. Korneluk. 1999. A new internal-ribosome-entry-site motif potentiates XIAP-mediated cytoprotection. Nat. Cell Biol. 1**:**190-192. [DOI] [PubMed] [Google Scholar]
- 24.Iyer, N. V., L. E. Kotch, F. Agani, S. W. Leung, E. Laughner, R. H. Wenger, M. Gassmann, J. D. Gearhart, A. M. Lawler, A. Y. Yu, and G. L. Semenza. 1998. Cellular and developmental control of O2 homeostasis by hypoxia-inducible factor 1α. Genes Dev. 12**:**149-162. [DOI] [PMC free article] [PubMed] [Google Scholar]
- 25.Jang, S. K., H. G. Krausslich, M. J. Nicklin, G. M. Duke, A. C. Palmenberg, and E. Wimmer. 1988. A segment of the 5′ nontranslated region of encephalomyocarditis virus RNA directs internal entry of ribosomes during in vitro translation. J. Virol. 62**:**2636-2643. [DOI] [PMC free article] [PubMed] [Google Scholar]
- 26.Johannes, G., M. S. Carter, M. B. Eisen, P. O. Brown, and P. Sarnow. 1999. Identification of eukaryotic mRNAs that are translated at reduced cap binding complex eIF4F concentrations using a cDNA microarray. Proc. Natl. Acad. Sci. USA 96**:**13118-13123. [DOI] [PMC free article] [PubMed] [Google Scholar]
- 27.Koong, A. C., N. C. Denko, K. M. Hudson, C. Schindler, L. Swiersz, C. Koch, S. Evans, H. Ibrahim, Q. T. Le, D. J. Terris, and A. J. Giaccia. 2000. Candidate genes for the hypoxic tumor phenotype. Cancer Res. 60**:**883-887. [PubMed] [Google Scholar]
- 28.Koumenis, C., N. C. Denko, M. Koritzinsky, S. Rastani, A. Diehl, N. Sonenberg, A. Koromilas, and B. G. Wouters. 2002. Regulation of protein synthesis by hypoxia via activation of the endoplasmic reticulum kinase PERK and phosphorylation of the translation initiation factor eIF2α. Mol. Cell. Biol. 22**:**7405-7416. [DOI] [PMC free article] [PubMed] [Google Scholar]
- 29.Kozak, M. 1999. Initiation of translation in prokaryotes and eukaryotes. Gene 234**:**187-208. [DOI] [PubMed] [Google Scholar]
- 30.Kraggerud, S. M., J. A. Sandvik, and E. O. Pettersen. 1995. Regulation of protein synthesis in human cells exposed to extreme hypoxia. Anticancer Res. 15**:**683-686. [PubMed] [Google Scholar]
- 31.Lang, W. H., and R. H. Reeder. 1993. The REB1 site is an essential component of a terminator for RNA polymerase I in Saccharomyces cerevisiae. Mol. Cell. Biol. 13**:**649-658. [DOI] [PMC free article] [PubMed] [Google Scholar]
- 32.Lassot, I., E. Segeral, C. Berlioz-Torrent, H. Durand, L. Groussin, T. Hai, R. Benarous, and F. Margottin-Goguet. 2001. ATF4 degradation relies on a phosphorylation-dependent interaction with the SCF(βTrCP) ubiquitin ligase. Mol. Cell. Biol. 21**:**2192-2202. [DOI] [PMC free article] [PubMed] [Google Scholar]
- 33.Lefebvre, V. H., M. Van Steenbrugge, V. Beckers, M. Roberfroid, and P. Buc-Calderon. 1993. Adenine nucleotides and inhibition of protein synthesis in isolated hepatocytes incubated under different pO2 levels. Arch. Biochem. Biophys. 304**:**322-331. [DOI] [PubMed] [Google Scholar]
- 34.Liebermann, D. A., and B. Hoffman. 2002. Myeloid differentiation (MyD)/growth arrest DNA damage (GADD) genes in tumor suppression, immunity and inflammation. Leukemia 16**:**527-541. [DOI] [PubMed] [Google Scholar]
- 35.Ma, Y., and L. M. Hendershot. 2003. Delineation of a negative feedback regulatory loop that controls protein translation during endoplasmic reticulum stress. J. Biol. Chem. 278**:**34864-34873. [DOI] [PubMed] [Google Scholar]
- 36.Macejak, D. G., and P. Sarnow. 1991. Internal initiation of translation mediated by the 5′ leader of a cellular mRNA. Nature 353**:**90-94. [DOI] [PubMed] [Google Scholar]
- 37.Maxwell, P. H., C. W. Pugh, and P. J. Ratcliffe. 2001. Activation of the HIF pathway in cancer. Curr. Opin. Genet. Dev. 11**:**293-299. [DOI] [PubMed] [Google Scholar]
- 38.Mikulits, W., B. Pradet-Balade, B. Habermann, H. Beug, J. A. Garcia-Sanz, and E. W. Mullner. 2000. Isolation of translationally controlled mRNAs by differential screening. FASEB J. 14**:**1641-1652. [DOI] [PubMed] [Google Scholar]
- 39.Nielsen, F. C., L. Ostergaard, J. Nielsen, and J. Christiansen. 1995. Growth-dependent translation of IGF-II mRNA by a rapamycin-sensitive pathway. Nature 377**:**358-362. [DOI] [PubMed] [Google Scholar]
- 40.Novoa, I., H. Zeng, H. P. Harding, and D. Ron. 2001. Feedback inhibition of the unfolded protein response by GADD34-mediated dephosphorylation of eIF2α. J. Cell Biol. 153**:**1011-1022. [DOI] [PMC free article] [PubMed] [Google Scholar]
- 41.Novoa, I., Y. Zhang, H. Zeng, R. Jungreis, H. P. Harding, and D. Ron. 2003. Stress-induced gene expression requires programmed recovery from translational repression. EMBO J. 22**:**1180-1187. [DOI] [PMC free article] [PubMed] [Google Scholar]
- 42.O'Rourke, J. F., C. W. Pugh, S. M. Bartlett, and P. J. Ratcliffe. 1996. Identification of hypoxically inducible mRNAs in HeLa cells using differential-display PCR: role of hypoxia-inducible factor-1. Eur. J. Biochem. 241**:**403-410. [DOI] [PubMed] [Google Scholar]
- 43.Pettersen, E. O., N. O. Juul, and O. W. Ronning. 1986. Regulation of protein metabolism of human cells during and after acute hypoxia. Cancer Res. 46**:**4346-4351. [PubMed] [Google Scholar]
- 44.Prostko, C. R., M. A. Brostrom, E. M. Malara, and C. O. Brostrom. 1992. Phosphorylation of eukaryotic initiation factor (eIF) 2α and inhibition of eIF-2B in GH3 pituitary cells by perturbants of early protein processing that induce GRP78. J. Biol. Chem. 267**:**16751-16754. [PubMed] [Google Scholar]
- 45.Pyronnet, S., L. Pradayrol, and N. Sonenberg. 2000. A cell cycle-dependent internal ribosome entry site. Mol. Cell 5**:**607-616. [DOI] [PubMed] [Google Scholar]
- 46.Rajasekhar, V. K., A. Viale, N. D. Socci, M. Wiedmann, X. Hu, and E. C. Holland. 2003. Oncogenic Ras and Akt signaling contribute to glioblastoma formation by differential recruitment of existing mRNAs to polysomes. Mol. Cell 12**:**889-901. [DOI] [PubMed] [Google Scholar]
- 47.Richter, J. D. 1993. Translational control in development: a perspective. Dev. Genet. 14**:**407-411. [DOI] [PubMed] [Google Scholar]
- 48.Rosenwald, I. B., N. A. Setkov, V. N. Kazakov, J. J. Chen, A. G. Ryazanov, I. M. London, and O. I. Epifanova. 1995. Transient inhibition of protein synthesis induces expression of proto-oncogenes and stimulates resting cells to enter the cell cycle. Cell Prolif. 28**:**631-644. [DOI] [PubMed] [Google Scholar]
- 49.Ruzinova, M. B., R. A. Schoer, W. Gerald, J. E. Egan, P. P. Pandolfi, S. Rafii, K. Manova, V. Mittal, and R. Benezra. 2003. Effect of angiogenesis inhibition by Id loss and the contribution of bone-marrow-derived endothelial cells in spontaneous murine tumors. Cancer Cell 4**:**277-289. [DOI] [PubMed] [Google Scholar]
- 50.Ryan, H. E., J. Lo, and R. S. Johnson. 1998. HIF-1 alpha is required for solid tumor formation and embryonic vascularization. EMBO J. 17**:**3005-3015. [DOI] [PMC free article] [PubMed] [Google Scholar]
- 51.Sella, O., G. Gerlitz, S. Y. Le, and O. Elroy-Stein. 1999. Differentiation-induced internal translation of c-sis mRNA: analysis of the cis elements and their differentiation-linked binding to the hnRNP C protein. Mol. Cell. Biol. 19**:**5429-5440. [DOI] [PMC free article] [PubMed] [Google Scholar]
- 52.Semenza, G. L. 2000. HIF-1 and human disease: one highly involved factor. Genes Dev. 14**:**1983-1991. [PubMed] [Google Scholar]
- 53.Semenza, G. L. 1998. Hypoxia-inducible factor 1: master regulator of O2 homeostasis. Curr. Opin. Genet. Dev. 8**:**588-594. [DOI] [PubMed] [Google Scholar]
- 54.Semenza, G. L., P. H. Roth, H. M. Fang, and G. L. Wang. 1994. Transcriptional regulation of genes encoding glycolytic enzymes by hypoxia-inducible factor 1. J. Biol. Chem. 269**:**23757-23763. [PubMed] [Google Scholar]
- 55.Sheets, M. D., C. A. Fox, T. Hunt, G. Vande Woude, and M. Wickens. 1994. The 3′-untranslated regions of c-mos and cyclin mRNAs stimulate translation by regulating cytoplasmic polyadenylation. Genes Dev. 8**:**926-938. [DOI] [PubMed] [Google Scholar]
- 56.Sivitz, W. I., D. D. Lund, B. Yorek, M. Grover-McKay, and P. G. Schmid. 1992. Pretranslational regulation of two cardiac glucose transporters in rats exposed to hypobaric hypoxia. Am. J. Physiol. 263**:**E562-E569. [DOI] [PubMed] [Google Scholar]
- 57.Srivastava, S. P., K. U. Kumar, and R. J. Kaufman. 1998. Phosphorylation of eukaryotic translation initiation factor 2 mediates apoptosis in response to activation of the double-stranded RNA-dependent protein kinase. J. Biol. Chem. 273**:**2416-2423. [DOI] [PubMed] [Google Scholar]
- 58.Stein, I., A. Itin, P. Einat, R. Skaliter, Z. Grossman, and E. Keshet. 1998. Translation of vascular endothelial growth factor mRNA by internal ribosome entry: implications for translation under hypoxia. Mol. Cell. Biol. 18**:**3112-3119. [DOI] [PMC free article] [PubMed] [Google Scholar]
- 59.Stoneley, M., S. A. Chappell, C. L. Jopling, M. Dickens, M. MacFarlane, and A. E. Willis. 2000. c-Myc protein synthesis is initiated from the internal ribosome entry segment during apoptosis. Mol. Cell. Biol. 20**:**1162-1169. [DOI] [PMC free article] [PubMed] [Google Scholar]
- 60.Takahashi, Y., S. Takahashi, Y. Shiga, T. Yoshimi, and T. Miura. 2000. Hypoxic induction of prolyl 4-hydroxylase alpha (I) in cultured cells. J. Biol. Chem. 275**:**14139-14146. [DOI] [PubMed] [Google Scholar]
- 61.Wood, S. M., M. S. Wiesener, K. M. Yeates, N. Okada, C. W. Pugh, P. H. Maxwell, and P. J. Ratcliffe. 1998. Selection and analysis of a mutant cell line defective in the hypoxia-inducible factor-1α-subunit (HIF-1α): characterization of HIF-1α-dependent and -independent hypoxia-inducible gene expression. J. Biol. Chem. 273**:**8360-8368. [DOI] [PubMed] [Google Scholar]
- 62.Wouters, B. G., M. Koritzinsky, R. K. Chiu, J. Theys, J. Buijsen, and P. Lambin. 2003. Modulation of cell death in the tumor microenvironment. Semin. Radiat. Oncol. 13**:**31-41. [DOI] [PubMed] [Google Scholar]
- 62a.Wouters, B. G., T. van den Beucken, M. G. Magagnin, P. Lambin, and C. Koumenis. 2004. Targeting hypoxia tolerance in cancer. Drug Resist. Updates 7**:**25-40. [DOI] [PubMed]
- 63.Wykoff, C. C., N. J. Beasley, P. H. Watson, K. J. Turner, J. Pastorek, A. Sibtain, G. D. Wilson, H. Turley, K. L. Talks, P. H. Maxwell, C. W. Pugh, P. J. Ratcliffe, and A. L. Harris. 2000. Hypoxia-inducible expression of tumor-associated carbonic anhydrases. Cancer Res. 60**:**7075-7083. [PubMed] [Google Scholar]