L1-Associated Genomic Regions are Deleted in Somatic Cells of the Healthy Human Brain (original) (raw)
. Author manuscript; available in PMC: 2017 Jun 1.
Published in final edited form as: Nat Neurosci. 2016 Sep 12;19(12):1583–1591. doi: 10.1038/nn.4388
Abstract
The healthy human brain is a mosaic of varied genomes. L1 retrotransposition is known to create mosaicism by inserting L1 sequences into new locations of somatic cell genomes. Using a machine learning-based, single-cell sequencing approach, we discovered that Somatic L1-Associated Variants (SLAVs) are actually composed of two classes: L1 retrotransposition insertions and retrotransposition-independent L1-associated variants. We demonstrate that a subset of SLAVs are, in fact, somatic deletions generated by L1 endonuclease cutting activity. Retrotransposition- independent rearrangements within inherited L1s resulted in the deletion of proximal genomic regions. These rearrangements were resolved by microhomology-mediated repair, which suggests that L1-associated genomic regions are hotspots for somatic copy number variants in the brain and therefore a heritable genetic contributor to somatic mosaicism. We demonstrate that SLAVs are present in crucial neural genes, such as DLG2/PSD93, and affect between 44–63% of cells of the cells in the healthy brain.
Introduction
Genetic variation occurs not only as variation in the germline but also within the somatic cells of an individual, termed somatic mosaicism1. Somatic point mutations restricted to a subset of cells in the body cause a variety of neurological disorders, including Sturge-Weber syndrome2 and hemimegancephaly3. It is now clear that somatic mosaicism is more common than previously thought and that this phenomenon is particularly prevalent in the brain. In 2005, Muotri et al.4 discovered that Long INterspersed Element-1 (LINE-1 or L1) retrotransposons mobilize during neural development, despite the many cellular defenses that inhibit retrotransposition. L1 is an active mobile endogenous element capable of de novo insertions into new genomic locations5, leading to somatic mosaicism in the human hippocampus and other regions6–11. Several studies employing copy number qPCR assays, L1 reporter assays, and next-generation sequencing of bulk and single cells confirmed that somatic retrotransposition occurs during neural development and may be increased in neurons6–11. Furthermore, striking levels of megabase-sized somatic copy number variants (CNVs) are present in neurotypic neurons12,13. However, the levels of somatic mosaicism in different cell types and the types of somatic variants are not clearly defined.
Somatic variants, particularly in non-cancerous tissue, are difficult to identify because the alterations are present in only a fraction of cells, with some variants unique to a single cell. Single cell genomic analysis is a powerful technology to identify somatic variants, but the process of whole genome amplification introduces artifacts that make accurate identification challenging. This difficulty has resulted in conflicting estimates of the frequency of somatic L1 insertions in neurons: <0.04–0.6 L1 insertions per cell6,8 vs. 13.7 L1 insertions per cell9.
Herein, we investigate the role of L1 in the creation of somatic mosaicism in the healthy brain. We developed a high-throughput sequencing method to specifically capture Somatic L1 Associated Variants (SLAVs) in bulk tissue and single nuclei, which we refer to as SLAV-seq. We found that somatic events occur at a similar rate, ~0.58–1 events per cell, in both glia and neurons and affect at least 36% of the cells in the healthy brain. Somatic events occurred during a variety of neural development stages, including in an early progenitor cell that contributes to both hippocampus and frontal cortex. Other events occurred late in development and could only be detected in a single cell. We also demonstrate that a subset of SLAVs are, in fact, somatic deletions generated by homology-mediated mechanisms independent of retrotransposition.
Results
Identification of SLAVs by Single Nuclei Sequencing
Robust identification of SLAVs is instrumental in advancing our understanding of somatic retrotransposition in the human brain. A systematic identification of SLAVs has been challenging because of the low allele frequency of somatic variants and the amplification artifacts due to whole genome amplification. A high level of amplification artifacts could be partially due to low coverage of somatic variants and insufficient sequence information. We therefore developed a targeted single-cell sequencing approach and machine learning-based analysis to identify SLAVs. SLAV-seq improves upon previous methods6,8,9 by 1) increasing sensitivity and efficiency, leading to increased coverage; 2) using a non- PCR-based method of fragmentation/adapter ligation, allowing for better identification of unique molecules; 3) allowing for more confident detection of novel insertions by employing paired-end sequencing, with one of the reads spanning the junction between L1 and the flanking genomic sequence; and 4) employing a data-driven, machine learning-based prediction of variants.
We sequenced whole-genome amplified single nuclei (n=89) and bulk samples from the frontal cortex and hippocampus of three healthy individuals (Fig. 1A). Single nuclei isolated from the brain were subjected to whole genome amplification by multiple displacement amplification (MDA)14. Post-mortem brain nuclei were purified from mixed populations of cells using FACS after immunostaining for the neural-specific antigen, NeuN (Fig. S1). We employed multiple controls to confirm proper NeuN sorting, the presence of a single nucleus in each well, the absence of exogenous human DNA contamination, and quality control for MDA products (see Materials and Methods and Fig. S1).
Figure 1. SLAV-seq identifies reference and non-reference L1-associated insertions.
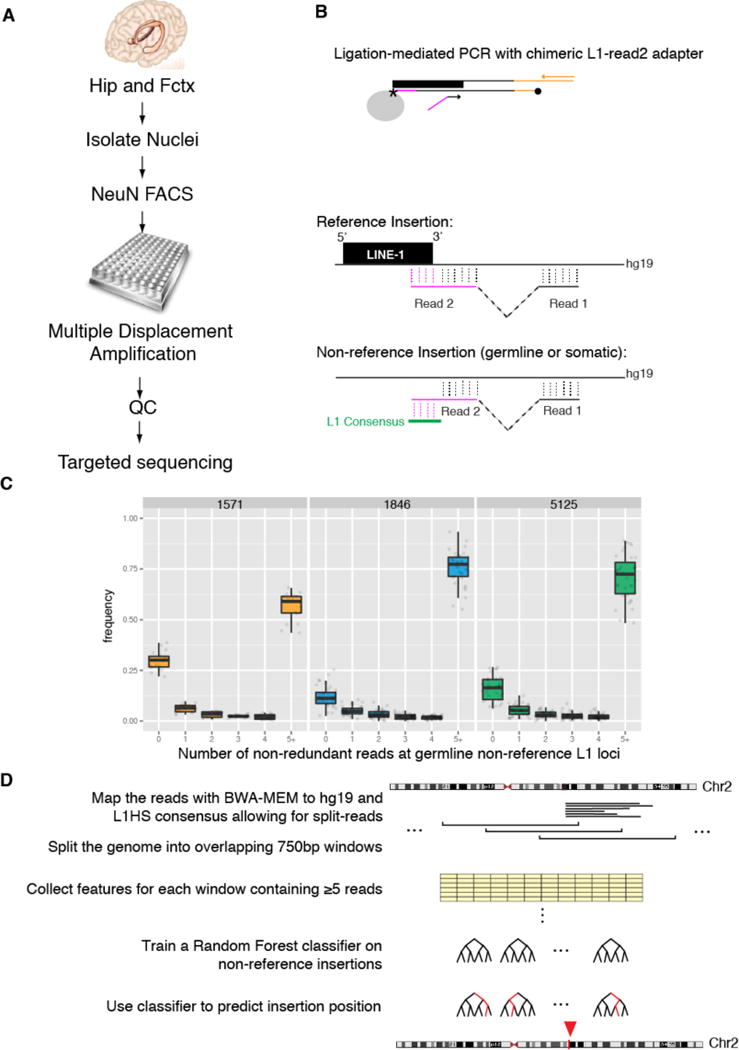
(A) Schematic of SLAV-seq. Individual nuclei from the hippocampus (Hip) and frontal cortex (Fctx) of postmortem samples from 3 individuals were isolated, immunofluorescently labeled for NeuN, and sorted into a 384-well plate. Whole-genome amplification is performed using multiple displacement amplification. After quality control (QC), amplified DNA is subjected to targeted sequencing. (B) The targeted sequencing approach involves a single extension with a biotinylated (*) L1HS-specific oligo on sheared DNA. This step was followed by capture and on-bead ligation of an amino-modified asymmetric adapter (magenta) and hemi-specific nested PCR. Read 2 is an L1-flanking genome split read. For reference insertions, read 1 and read 2 [including the L1 (magenta)] are fully aligned to hg19. For non-reference insertions, the first portion of read 2 aligns with the 3′ end of L1 consensus sequence but not to the hg19 reference sequence. (C) SLAV-seq yields high detection rates for known non-reference germline L1 insertions. Boxplots are shown for each single-cell library from the specified individuals (1571, 1846, and 5125), indicating the fraction of known non-reference germline loci (KNRGL) detected (y axis) as a function of the number of non-redundant L1 junction reads (x axis). (D) Schematic of the analysis to identify somatic insertions using a Random Forest machine learning classifier. Red arrowhead indicates a genomic window classified as containing a non-reference variant.
To generate genome-wide profiles of L1 insertions, SLAV-seq uses ligation-mediated PCR techniques15,16 to allow split-read identification of the 3′ end of the most active L1 subfamily17 by paired-end Illumina sequencing (Fig. 1B). Using this approach, we can classify each read pair as potentially originating from reference or non-reference insertions, depending on how well the initial portion of read 2 aligns with the reference genome and to the L1 consensus sequence (Fig. 1B). SLAV-seq provides high sensitivity and specificity for reference and non-reference L1 insertions (Fig S2).
To measure the sensitivity of this technique in identifying somatic variants, we asked what percentage of known non-reference germline loci (KNRGL) was detected within our single-cell datasets as a function of coverage (i.e., the number of non-redundant 3′ L1 junction reads identifying the insertion). In a single cell, a heterozygous polymorphic germline L1 insertion and a somatic L1 insertion are equivalent in allele frequency and thus equally detectable. We observed a median of 71% KNRGLs supported by 5 or more non-redundant reads, a median of 14% KNRGLs detected by 1–4 reads, and a median of 15% KNRGLs not detected by any reads. Thus, SLAV-seq has high sensitivity in detecting L1 insertion variants and therefore applies a threshold of ≥5 non-redundant reads to identify SLAVs (Fig 1C).
To identify non-reference variants, we opted for a machine-learning approach in which the rules to separate real SLAVs from false positives are learned from examples within the datasets (Fig. 1D). MDA and other amplification steps generate chimeric molecules18 that can introduce false positives, which a data-driven machine-learning approach aims to distinguish by examining many features from the data. We mapped the sequencing reads against the reference genome hg19 using the BWA-MEM aligner19. We took advantage of BWA-MEM’s support for split-read mapping to identify which portions of the reads mapped to L1 and which portions mapped to the flanking genome. We subdivided the genome into 750-bp windows with a 500-bp overlap. For each window, we collected 70 features such as total number of reads and number of reads mapping partially to L1 and partially to the genome (non-reference transposable element (NRTE) reads) (Table S2). For each single-cell dataset, we trained a Random Forest classifier20 using as positive examples the windows containing KNRGLs covered by ≥5 non-redundant reads and, as negative examples, the subset of windows with ≥5 non-redundant reads from a set of 10,000 randomly drawn windows from the genome. The classifiers were evaluated by 4-fold cross-validation and demonstrated highly accurate identification of non-reference germline insertions in bulk and single-cell samples. The median precision, which measures the specificity of the classifiers, was above 87% for L1 in bulk and single-nuclei samples (Fig. S3A). The median recall, which measures sensitivity, was above 70% for bulk and single-nuclei libraries (Fig. S3B). As expected, the Random Forest classifier selected the number of non-redundant reads that had a portion aligned to the retrotransposon and not to the genome (NRTE reads) as an important feature to identify non-reference insertions (Fig. S3C).
To identify somatic insertions, we obtained the set of loci predicted to be non-reference variants and subtracted all previously annotated KNRGL19 and private germline insertion loci found in the individuals (Table S3). Because false positives due to whole genome amplification are enriched near known L1 loci6,9, and our machine-learning approach does not use proximity to known L1 loci as a predictive feature, we subtracted candidates within 10kb of germline L1HS, PA2, PA3 and KNRGL to minimize false positives. Those genomic regions accounted for 9.3% of the genome and contained 170 putative SLAVs most likely to be false positives (Table S4). After subtracting these regions, our analysis identified 46 putative SLAVs in the single-nucleus samples from brain cells (Table S5). A similar filter was imposed by previous single cell somatic L1 insertion identification studies. Putative L1 variants were identified in neurons and non-neurons from both hippocampus and frontal cortex.
Somatic L1 Retrotransposon Insertions Occur in Progenitors Cells, Neurons and Glia
To independently validate the L1 somatic candidates identified within single cells, we performed two PCR assays (Table S5) followed by Sanger sequencing, again using features of polymorphic germline insertions to guide our true positive calls. The first assay confirmed the 3′ end of L1 using one primer complementary to the 3′ end of L1 paired with a primer complementary to the flanking genomic sequence. The second PCR assay involved primers complementary to the 5′ and 3′ sequences flanking the insertions, such that the L1 insertion generated a larger sized fragment for an insertion allele and a smaller band for the empty allele. This PCR strategy also confirmed that somatic insertions were not present in bulk genomic DNA (gDNA) from the individual, because all somatic candidates were undetected from bulk gDNA samples. After PCR, Sanger sequencing was performed on all amplified products.
We confirmed that somatic L1 retrotransposon insertions harboring target site duplication (TSD) occurred in neurons and glia. TSD is a short direct repeat flanking both sides of the L1 sequence that occurs upon L1 retrotransposition insertion5. One insertion with validated TSD was identified in a hippocampal neuron from individual 5125 into Chr5:147471250 (Fig. 2A, and Table S5). This 1336-bp L1HS insertion occurred into the 8th intron of SPINK5. The insertion utilized the canonical TT/AAAA endonuclease site with a 13-bp A homopolymer present in the reference genome. Because of the A stretch and homology to L1 sequence, we could not determine the exact length of TSD, but it was between 2 and 7 bp. A second 1593-bp L1HS insertion with TSD was found in a frontal cortex NeuN-negative nucleus located in the second intron of ADCY1. This insertion also utilized the canonical endonuclease TT/AAAA site and contained a 3-bp TSD (Fig. 2B, and Table. S5).
Figure 2. A subset of somatic L1 insertions contains target site duplication and occurred in a progenitor cell.
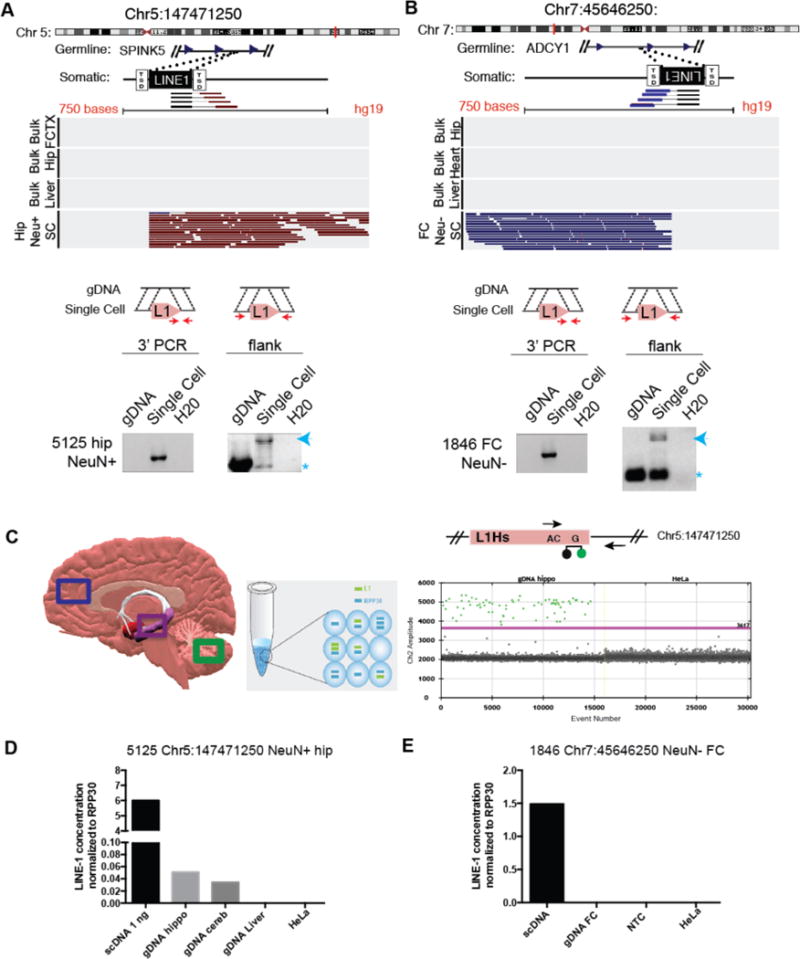
(A,B) Visualization of sequencing reads and PCR validation that indicate a somatic L1 insertion in a hippocampal neuron (A) and in a frontal cortex glial cell (B) but absent from bulk tissue isolated from the same individual. Note: Red indicates reads mapping on the − strand and blue indicates reads mapping on the + strand. 3′ and flanking PCR and Sanger sequencing (PCR primers red arrow) were used to validate the L1HS sequence with target site duplication (TSD). Gels indicate the insertion product (blue arrow) and the empty allele (*). (C–E) Digital PCR assay was used to detect the specific L1 3′ junction sequence in single cell (scDNA) and bulk gDNA isolated from the same individual (C). A forward primer and a VIC-labeled taqman probe specific for the 3′ end of young L1 insertions were paired with a locus-specific reverse primer adapted from White et. al23. _Colored boxes indicate brain regions extracted for genomic DNA. Example VIC fluorescence signal (Ch 2, y axis) for each positive droplet (green) above the threshold (purple line). Quantification for Chr5:147471250 (D) and Chr7:45646250 (E) variants normalized to the single-copy control RPP30. NTC, non-template control.
If the somatic L1 insertions occurred in a progenitor cell, the unique variant could be used to trace the progenitor cell’s developmental contribution to the brain7. We applied droplet PCR assays to quantify the percentage of cells harboring SLAVs in the bulk tissue from frontal cortex, hippocampus, or cerebellum from the same individual (Fig. 2C, and Table S5). Digital PCR overcame the limitations of standard PCR assays to accurately detect rare nucleic acid sequences7,21. The digital PCR assay involved partitioning samples into a large number of small droplets prior to amplification. After amplification with a taqman fluorescence probe for the junction of the 3′ end of L1 and the unique insertion location, the fluorescence of each droplet was read. For the neuronal insertion into ch5:147471250, the insertion was specifically detected in the amplified single cell and corresponding bulk hippocampal and cerebellar DNA from that individual (Fig. 2D). Approximately 0.5% of the cells in the hippocampus and cerebellum harbored the L1 insertion, suggesting that the L1 insertion occurred in a progenitor that gave rise to cells of the hippocampus and cerebellum. The hippocampal glia insertion into Chr7:45646250 was detected only in the amplified single cell DNA and was, therefore, unique to the single cell or present in less than 0.1% of the cells, the detection limit of the assay (Fig. 2E and S4). All SLAVs were below the detection limit for standard PCR assays in bulk tissue, confirming that they were not germline variants.
A Portion of SLAVs Lack TSD
Of 15 loci tested, 11 passed 3′ PCR validation, whereas two L1 insertions passed 3′ PCR and flanking PCR validation with Sanger sequencing-demonstrated TSDs (Fig. 3A, and Table S5). As a reference, 80% of full-length heterozygous germline loci passed the flanking PCR assay (Fig. S5). This PCR and sequencing strategy is similar to the previous report for identifying somatic L1 insertions in single cells6 but achieved a higher true-positive validation rate (73% vs. 21% for 3′ PCR, and 13% vs. 1% for flanking PCR), likely because our data are paired end with L1 split read information. (Comparison with other PCR validation strategies is discussed in the Supplemental Discussion and Fig S6–7.)
Figure 3. Identification of retrotransposition-independent SLAVs.
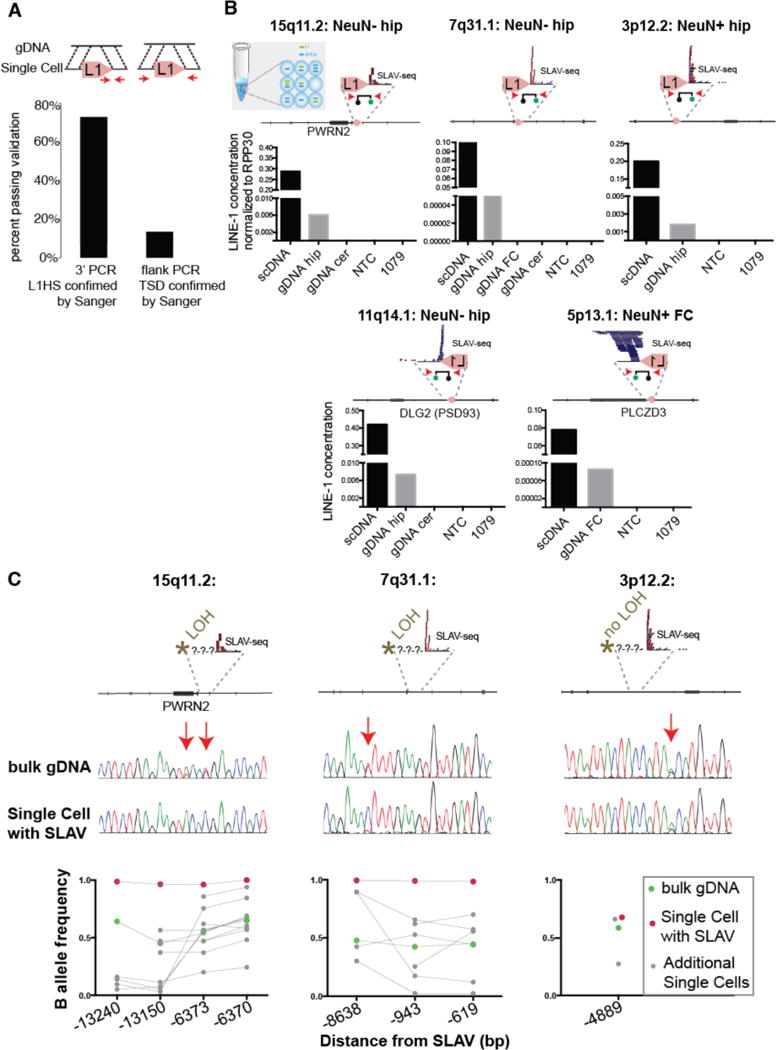
(A) Percentage of predicted variants validated by 3′ PCR-Sanger sequencing or flanking/TSD PCR-Sanger (arrows indicate PCR primers). (B) Digital PCR assay confirms the presence of the L1 variant in single cell (scDNA) and bulk genomic DNA (gDNA) (as described in Fig. 2C). The specified variants have a confirmed 3′-L1Hs junction but lack TSD. (C) Loss of heterozygosity is detected upstream of the variant in 2 of 3 specified variants. The arrows indicate single nucleotide polymorphisms detected in bulk gDNA. Bottom: Quantification of additional SNVs from single cell and bulk genomic DNA. Connecting line indicates the same DNA sample tested across several positions.
We next asked if the variant calls with confirmed 3′ L1HS sequence but lacking TSD could be detected in bulk tissue, which would indicate that the variants existed in a subset of cells in the individual and were not merely artifacts. For the nine variants validated exclusively on the 3′ side, three were detected by digital PCR in bulk tissue, three were not detected in bulk tissue, and three failed assay design (Fig. 3B, and Table S5). The five variants detected in single cells and bulk tissue were found in <0.01% of the cells from the corresponding bulk hippocampus. They were not detected in corresponding cerebellum or HeLa negative controls. Variants occurred in DLG2/PSD93, PLCZD3 and intergenic regions.
For three loci validated in bulk tissue, we asked if another form of genomic variation besides retrotransposition-dependent insertion with TSD could have occurred. Intriguingly, exogenous retrotransposition assays had previously demonstrated that L1 retrotransposition could create genetic instability, including the generation of chimeric L1s, intrachromosomal deletions, intrachromosomal duplications, and intra-L1 rearrangements22,23. If the L1 variants were associated with a deletion in the single cell, this would result in a loss of heterozygosity 5′ of the variant (Fig. 3C). For two of the three variants assayed, loss of heterozygosity occurred. Heterozygous single nucleotide polymorphisms (SNPs) were detected in the bulk tissue and a loss of heterozygosity was detected in the single-cell DNA at the sequence 5′ upstream of the variant. Importantly, allele dropout did occur in other single cells, but only the single cell with the identified SLAV contained LOH for all loci assayed within the putative deletion region. For the third variant at 3p12.2, both the bulk gDNA and single-cell DNA had heterozygous SNPs, indicating no deletion.
L1 sequences are hotspots for somatic CNVs that are created by L1 endonucleases
For the two loci indicating loss of heterozygosity, we successfully identified the deletion junction for both variants (Fig. 4, and Table S5). For the variant at 7q31.1 (Fig. 4A, and Table S5), we performed a flanking PCR assay with primers walking 5′ upstream of the variant location paired with a fixed primer outside of the L1 sequence in the 3′ unique sequence (Fig. 4A). A 4.2-kb band was specifically detected in the single-cell DNA when a primer 796 kb upstream of the variant was paired with a primer just 3′ of the L1 sequence. When bulk genomic hippocampal DNA was tested by PCR and Sanger sequencing, the deletion variant was also confirmed specifically in the corresponding bulk genomic hippocampal DNA, confirming that the variant occurred in a progenitor cells and was detectable in unamplified material. As an additional confirmation of the deletion variant, we subjected a portion of the MDA-amplified single cell genomic DNA that was used for SLAV-seq to shallow whole genome sequencing. Consistent with previous reports24, we observed high variability in the normalized read count per 500kb bin across the genome [coefficient of variation (SD/mean) of 0.65, 0.77 and 1.01 for samples 48, 53, and 153, respectively] due to unequal amplification from single cell whole genome amplification. Nevertheless, we observed a reduction in normalized read counts at position chr7:108.7–109.5MB, consistent with the SLAV found in that position in sample 153 (Fig 4A, right).
Figure 4. Retrotransposition-independent somatic deletions are associated with L1 sequences.
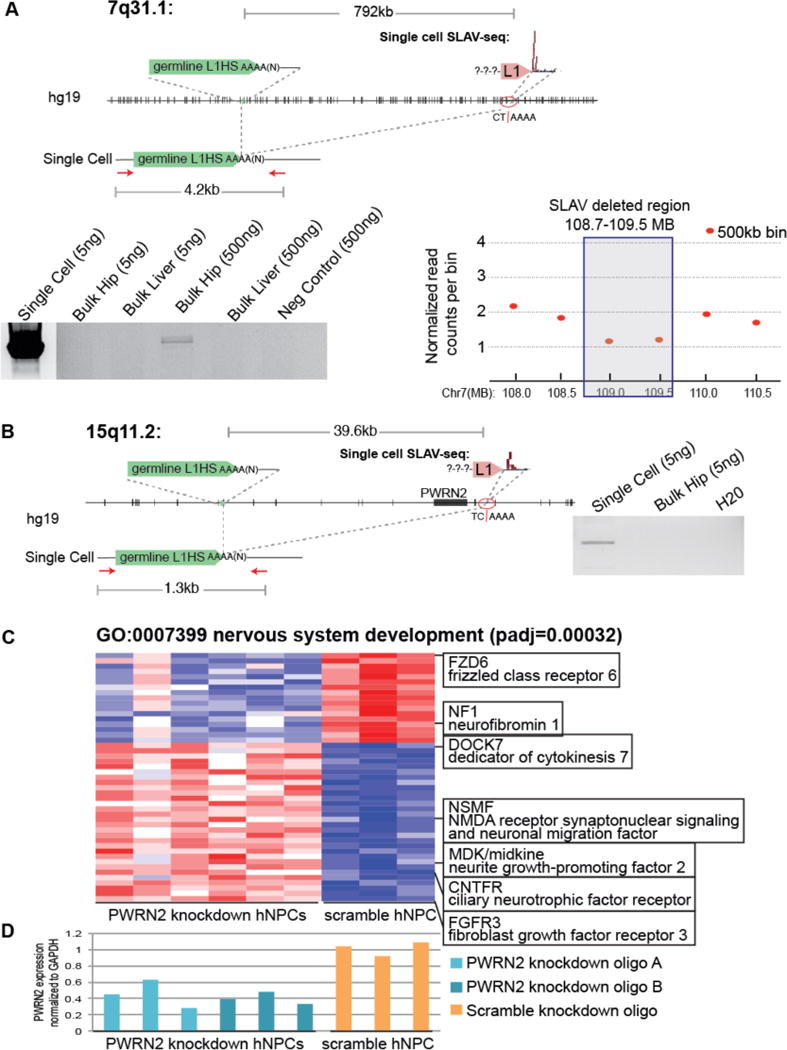
(A) Identification of a SLAV with a 792-kb deletion. Schematic of the reference genome (hg19) and the somatic variant. Red arrows indicate PCR primers. Gel indicates the presence of a 4.2-kb amplification product in the single cell and bulk hippocampal DNA that is absent from the corresponding bulk liver and 1079 gDNA. Note: The amplified product in single cell lane is a much higher concentration and is presented at a reduced contrast compared to the rest of the gel. Right:Whole genome sequencing copy number profile confirms a reduced copy number of the SLAV-deleted region. Plot showing the copy number profile for the single cell containing the 7q31.1 SLAV analyzed by whole genome sequencing. The normalized read count values for each individual genomic bin are shown for 500-kb bins (red). Note: Single cell amplification generates variable copy numbers and larger bin sizes are considered more reliable (B) Identification of a 39.6-kb SLAV deletion resulted in the deletion of PWRN2. Schematic of the reference genome (hg19) and the somatic variant. Red arrows indicate PCR primers. Gel indicates the presence of a 1.3-kb amplification product in the single cell that is absent from the corresponding bulk hippocampal gDNA. (C) PWRN2 knockdown in human embryonic stem cell derived hippocampal progenitor cells results in aberrant expression of nervous system development genes. Heatmap of the significantly differentially expressed genes between PWRN2 and scramble control NPCs (padj<0.001, 3 biological replicates for each shRNA) that were enriched in the nervous system development category (n=69 genes, padj=0.00032). Red: high expression, Blue: low expression, Z score by gene expression level. Columns indicate each biological replicate, rows indicate genes. (D) PWRN2 knockdown results in decreased PWRN2 transcript levels. PWRN2 expression was determined by reverse transcription PCR quantification normalized to GAPDH.
A similar strategy was used to characterize the deletion junction of the 15q11.2 variant. For the variant at 15q11.2, a 1.3-kb PCR band was detected specifically in the single-cell DNA when a primer 40 kb upstream of the variant was paired with a primer just 3′ of the L1 sequence (Fig 4B). Unfortunately, we exhausted the matched hippocampal tissue. Therefore, a higher concentration of bulk hippocampal tissue could not be tested by this flanking PCR. For the single cell, Sanger sequencing indicated that a 39.6-kb deletion between two A homopolymer sequences occurred (Table S5). The upstream A homopolymer was from a reference L1HS poly-A tail that recombined with a downstream A homopolymer sequence, resulting in deletion of the pwrn2 gene.
Surprisingly, the 15q11.2 and 7q31.1 variants occurred independently of retrotransposition. No additional sequence was present, indicating no incorporation of reverse-transcribed cDNA. Cleavage at the L1 endonuclease motifs25 could have mediated the deletion, although other mechanisms could result in a similar deletion. In summary, we discovered that a subset of SLAVs lacked TSD and were somatic deletions that likely occurred independent of retrotransposition.
Deletions of genes involved in neuronal differentiation or function have the potential to alter proper function. To reveal potential biological consequences of SLAVs, we modeled the hippocampal 15q11.2 deletion of PWRN2 in vitro using human embryonic stem cell-derived hippocampal progenitor cells2. Using RNA-seq, we assayed for transcriptome-wide changes that were caused by decreased PWRN2 expression. PWRN2 knockdown resulted in significant disruption of nervous system development-related genes. The significantly differentially expressed genes (padj<0.001, table S6) were enriched in neuronal differentiated Gene Ontology categories, such as nervous system development (GO:0007399, padj=0.00032)(Fig. 4C). We confirmed efficient knockdown in these samples by qRT-PCR, which demonstrated 28–63% PWRN2 transcript remaining in knockdown samples compared to scramble controls (Fig. 4D).
To discover the mechanism generating SLAVs, we asked if genomic L1 sequences are prone to instability. L1 retrotransposons encodes for an endonuclease26. In addition, L1 DNA sequences harbor the preferential sequence motif recognized by the endonuclease that they encode.25 Therefore, the increased expression of L1 protein during neurogenesis5,8 may have caused excessive DNA damage at genomic L1 DNA sequences that resulted in retrotransposition-independent SLAVs preferentially occurring at germline L1 sequences during neural development. First, we assayed the expression pattern in an in vitro human embryonic stem cell differentiation system of human hippocampal neural differentiation of L1 ORF2, which harbors endonuclease and reverse transcriptase domains (Fig. 5A). Consistent with previous reports in pan neuronal differentiation8, L1 ORF2 is highly upregulated during the initial stages of hippocampal neural progenitor cell differentiation towards neurons. In addition, L1 transcript levels return to a high level at later development stages, when most cells are post-mitotic27
Figure 5. L1 endonuclease creates dsDNA damage preferentially at germline L1 genomic loci.
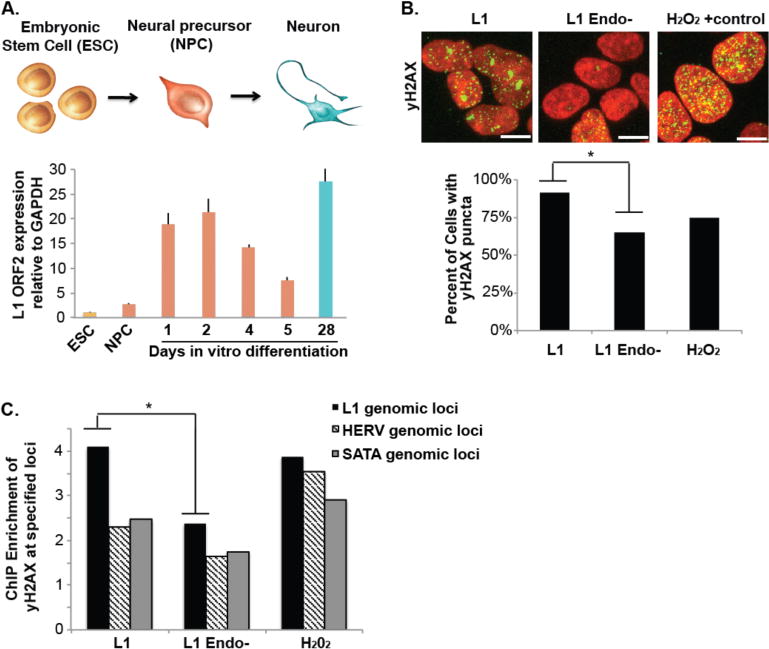
(A) L1 expression is upregulated during human hippocampal neuronal differentiation. Human embryonic stem cells (ESC) were differentiated to hippocampal neurons via a neural precursor cell (NPC). L1 expression was determined by reverse transcription PCR quantification normalized to GAPDH. (B) L1 overexpression creates dsDNA damage that is dependent on a functional L1 endonuclease domain. HEK293T cells were transfected with L1, L1 endonuclease and reverse transcriptase-deficient plasmids (L1 Endo-) or treated with 1.85mM of H2O2 for 10min and stained for γ-H2AX (green) DAPI (red). Scale bar= 5μm, * indicates p<0.05, t-test. (C) L1 overexpression induces γ-H2AX preferentially at germline L1 genomic loci. HEK293T cells were transfected with L1, L1 endonuclease and reverse transcriptase-deficient plasmids (L1 Endo-) or treated with 1.85mM of H2O2 for 10min. Chromatin Immunoprecipitation (ChIP) for γ-H2AX or IgG control was performed and Quantitative PCR of γ-H2AX associated DNA normalized to IgG control for the specified repetitive genomic loci. * indicates p<0.05, t-test.
Next, we asked if L1 overexpression creates dsDNA damage preferentially at germline L1 genomic loci. We overexpressed a functional L1 (L1)23,26,28 and visualized dsDNA damage by γ-H2AX, which is associated with DSB ends29. We confirmed that L1 overexpression results in an increase in dsDNA damage as visualized by γ-H2AX (Fig. 5B)30. We asked where L1-induced dsDNA damage is localized by chromatin immunoprecipitation for γ-H2AX or IgG negative control. We observed a specific increase in γ-H2AX localization at genomic L1 loci upon L1 overexpression, which is absent in L1 Endo-and H2O2 oxidation-induced DNA damage. Therefore, L1-associated genomic regions are predisposed to somatic CNVs in the brain. The increased expression of L1 endonuclease during neural differentiation induced dsDNA breaks preferentially at L1 loci.
We next asked what the average rate and distribution of variants were per cell and cell type. We plotted the number of SLAVs identified in each cell (Fig. 6A). To correct for cell-specific variation in amplification and library preparation, we normalized by the fraction of KNRGL detected. For neurons, we obtained 0.91 and 0.83 mean normalized somatic insertions per cell for hippocampus and frontal cortex, respectively. For glial cells, we obtained 1.66 and 0.78 mean normalized variants per cell for hippocampus and frontal cortex, respectively. Surprisingly, neurons and glia harbored similar numbers of SLAVs (no significant difference, Mann-Whitney U test, one-sided p-values: hippo_NeuN− vs hippo_NeuN+: 0.12; hippo_NeuN− vs cortex_NeuN+,0.24; hippo_NeuN− vs cortex_NeuN−: 0.09; hippo_NeuN+ vs cortex_NeuN+: 0.39; hippo_NeuN+ vs cortex_NeuN−: 0.28; cortex_NeuN+ vs cortex_NeuN−:0.24), in contrast to previous reports9. Previous single-cell somatic L1 retrotransposition studies have estimated rates of <0.04–0.6 L1 insertions per cell6,8 or 13.7 L1 insertions per cell9. In the Figure S6–S7 and Supplemental Discussion section, we compare our findings with those previous two studies. We provide evidence that the differences between these studies stem mainly from the stringency of the criteria used to call and validate L1 insertions.
Figure 6. Rate and distribution of SLAV events in healthy brain cells.
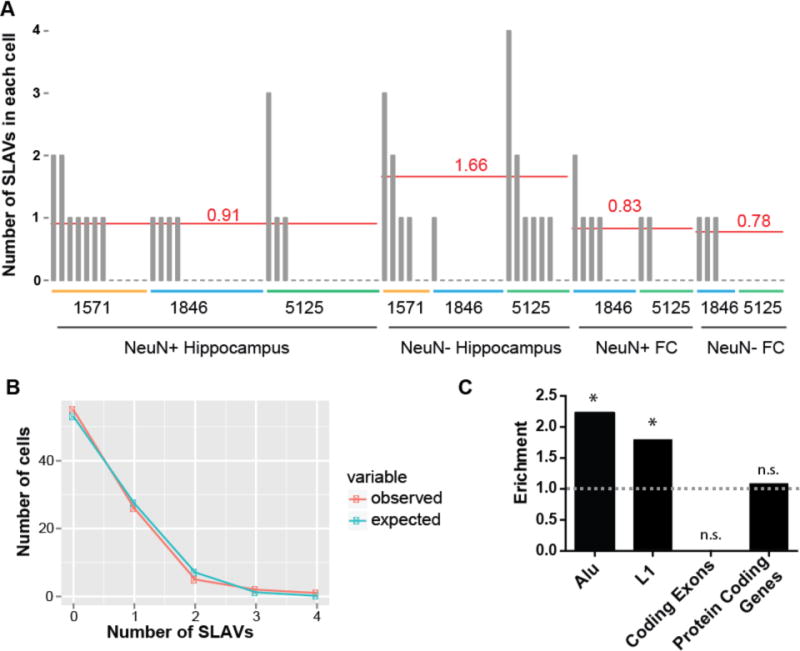
(A) The number of somatic L1 candidates in each cell that was sequenced (one bar represents one cell). The average number of insertions per cell type, normalized for detection rate of known non-reference insertions, is represented by the red line. FC, frontal cortex. (B) The distribution of SLAVs per cell follows closely a Poisson distribution (χ2 test p-value=0.26). (C) SLAVs are enriched in germline Alu and L1 regions and are not depleted from protein coding genes (exons plus introns). No SLAVs were detected in coding exons. (* indicates p<0.05, exact binomial test)
We next asked if SLAVs were equally distributed among all cells in the brain or if a subset of cells harbor a large number of SLAVs. The number of SLAVs per cell fit a Poisson distribution (no significant deviation from Poisson distribution, χ2 test p-value=0.26), indicating a similar probability for any cell to contain a SLAV (Fig. 6B). SLAVs also demonstrated a significant enrichment to occur in reference L1 and Alu sequences (Fig. 6C). No SLAVs occurred within protein coding exons, but SLAVs occurred within protein coding genes, which includes introns and exons, at the expected frequency.
To estimate the rate and type of SLAVs per cell, we incorporated PCR validation rates and detection of KNRGL. For all cells in the brain, we estimate a pre-validation base rate of 0.88 SLAVs per cell by combining the pre-validation rates of all cells, corrected for the respective KNRGL detection rates. We estimated the upper bound of 1 SLAVs per cell by multiplying the pre-validation base rate by the 3′ validation rate of 75% (12 out of 16) and dividing by the rate of 80% germline validation. The lower bound estimate of 0.58 SLAVs per cell was calculated by multiplying the base pre-validation rate with the fraction of insertions passing flanking PCR or digital droplet PCR of .437% (7 of 16) and dividing by the rate of 80% germline validation. Since the number of SLAVs per cell was well approximated by a Poisson distribution, we estimated the upper and lower bound fraction of cells containing at least one SLAV to be 44–63% of cells by evaluating Pr (x > 0) = 1− e−λ for a Poisson distribution with rate parameter λ given by the upper and lower bound estimates. Surprisingly, approximately half of the SLAVs might occur independently of retrotransposition.
Discussion
Using SLAV-seq and independent validation, our study reveals that L1 sequences generate somatic mosaicism in the brain through both retrotransposon insertions and retrotransposition-independent structural variants mediated by L1 endonuclease. Previously, single-cell sequencing revealed that a subset of neurons from neurotypic individuals harbored large CNVs that were between 500 kb and 1 Mb in size12,13, but the state-of-the-art methods of the time lacked the sensitivity to detect the CNV junction sequence. Therefore, the mechanism generating these large somatic CNVs could not be determined. Our data suggest that L1 sequences are prone to dsDNA damage because of L1 upregulation during neural differentiation that can generate somatic CNVs in the brain (Fig. 5 and 7).
Figure 7. SLAVs are composed of two classes of variants.
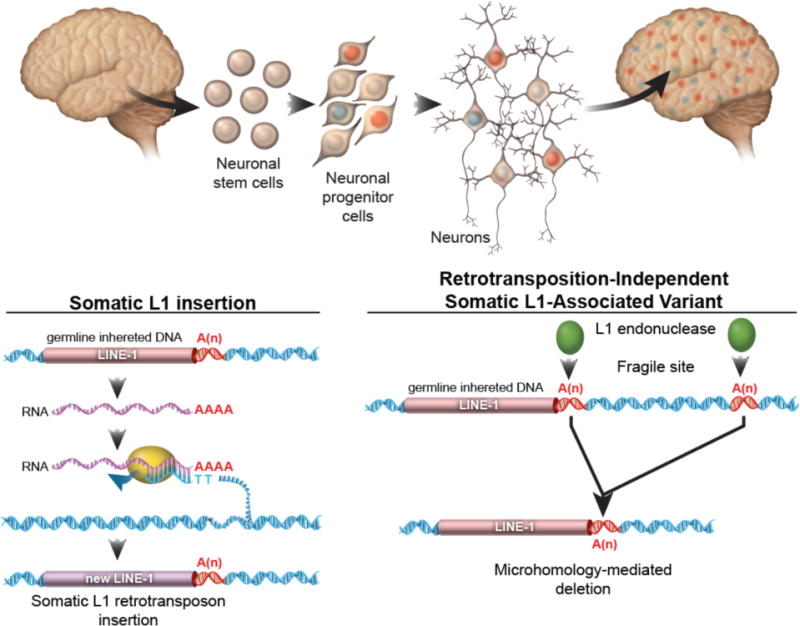
For somatic L1 insertions, a germline-inherited LINE-1 sequence is transcribed into RNA. The L1 endonuclease and reverse transcriptase protein nicks the genomic DNA and reverse transcribes the L1 RNA, resulting in the insertion of a new copy of Line-1 sequence. For retrotransposition-independent SLAVs, L1 endonuclease preferentially cuts a a germline-inherited LINE-1 sequence and recombination with a downstream A microsatellite results in a microhomology-mediated deletion. The A microsatellite regions may be nicked by the L1 endonuclease or a fragile site within the genome of neural progenitor cells.
By identifying a heritable component that contributes to somatic mosaicism, we reveal the potential for features of somatic mosaicism to be subjected to natural selection, suggesting a heritable, genetic state with regions of the genome predisposed to somatic CNVs in the brain. Genomic regions near fixed L1 sequences may have a propensity for somatic CNVs in the brain. Individuals with different germline L1 sequences may differ in their mosaic SLAV composition, but our findings predict that the mosaic SLAV composition could be similar between related individuals.
Considering the size of retrotransposition-independent SLAVs, some of which result in large deletions, we propose that SLAVs have the potential to significantly impact gene expression for the lineage of cells containing the SLAV. We previously reported that the retrotransposition of an engineered human L1 into the DLG2/PSD-93 gene led to its overexpression, which influenced the differentiation pattern of NPCs4. Here we report an endogenous SLAV within the same gene, DLG2/PSD93, which occurred in hippocampal progenitor cells. DLG2 plays a crucial role in complex learning, cognitive flexibility and attention31. Mutations in DLG2 have been associated with schizophrenia in several independent studies32,33. Therefore, SLAVs can occur in important neural genes, and we suggest that PSD93 may be a hotspot of SLAVs.
Previous studies have demonstrated that brain-specific somatic mutations can cause significant phenotypic variations1,3. For example, somatic mTOR mutations that are undetectable in blood and present in <10% of the cells in the focal dysplastic regions have been shown to cause focal cortical dysplasia type II in several patients34. In addition, small percentages of cells can affect network activity. In rodents, depleting the hippocampus of adult-born immature neurons, which represent >0.5% of the dentate gyrus35, causes defects in pattern separation, memory discrimination, and contextual memory consolidation36. Future experiments will help reveal if somatic mosaicism is particularly relevant to brain function, where small groups of cells (or even individual cells) can affect network activity.
Online Materials and Methods
Single cell isolation
Postmortem human tissues from neurotypical individuals UMB#5125 (a neurotypical 24-year-old female, 9-hour post-mortem interval), UMB#1846 (a neurotypical 20-year-old female, 9-hour post-mortem interval), UMB#1079 (a neurotypical 19-year-old female, 10-hour post-mortem interval) and UMB#1571 (a neurotypical 18-year-old female, 8-hour post-mortem interval) were obtained from the NICHD Brain and Tissue Bank for Developmental Disorders at the University of Maryland. Tissue samples were placed in nuclear isolation medium [(NIM) 25 mM KCl, 5 mM MgCl2, 10 mM Tris-Cl, 250 mM sucrose, 1 mM dithiothreitol (DTT), 0.1% TritonX-100, and 1× protease inhibitor cocktail (Roche)] and homogenized with a dounce homogenizer on ice. Samples were centrifuged (1,000 × g, 8 min) and the pellet was resuspended in 10:5:1 NIM:Iodixanol (Sigma):OptiPrep Diluent for Nuclei [(ODN) 150 mM KCl, 30 mM MgCl2, 60 mM Tris-Cl, 250 mM sucrose)]. Samples were layered onto a 29% Iodixanol in ODN cushion using a 1 mL syringe and centrifuged (10,300 × g, 20 min, 4°C). Pellets were resuspended in nuclei storage buffer [5 mM MgCl2, 50 mM TrisCl, 166 mM sucrose, 1 mM DTT, and 1× protease inhibitor cocktail]. Free nuclei and purity were confirmed visually using microscopy.
Neuronal nuclei were purified from bulk brain nuclei using NeuN immunostaining. Immunostaining was performed for 1 hour at 4°C with gentle agitation in PBS containing 5 μg/mL (1:2000) AF488-conjugated NeuN antibody (Millipore, MAB377). Nuclei were then stained for DNA content with 10 μg/mL DAPI and analyzed by FACS. Single nuclei (94) from the NeuN- and DAPI-positive population were sorted into 384-well plates containing lysis buffer alongside 2 water controls (containing lysis buffer but no nuclei), such that all nucleus-containing wells were surrounded by empty wells to avoid cross contamination. During the FACS process, additional single nuclei that did not receive MDA amplification were sorted into 384-well plates. These plates were subjected to taqman qPCR assays of Line1-Orf2-2 (5) to calculate the sorting efficiency. For all sorts, >95% of wells contained 0 or 1 nucleus.
Whole genome amplification and quality control
Genomic DNA was amplified via multiple displacement amplification (MDA) using phi29 polymerase (Genomiphi HY, GE Healthcare, Piscataway, NJ), as described14. Single nuclei were sorted into 1.5 μL of lysis buffer (0.2 M KOH, 0.05 M DTT), incubated on ice for 10 min and then at 65°C for 10 min, then a 4°C hold. Once at 4°C, 9 μL of sample buffer, 9 uL reaction buffer and 1 μL phi29 enzyme were added. Reactions were incubated at 30°C for 16 hours and then inactivated at 65°C for 10 min. MDA products (5 ng) were examined for sufficient amplification (e.g., +/−5% of the Ct for 5 ng bulk genomic DNA) using qPCR (Applied Biosystems, San Diego, CA). To test for sufficient amplification, we used a 4-locus subset of the 47 single copy loci used in Hosano et al (here, Chr3q, Chr7p, Chr11p, Chr14q) for MDA quality control37. MDA products were also quantified by picogreen (Life Technologies). Water control products were analyzed for human DNA contamination using L1-Orf2-2 taqman qPCR (LifeTechnologies)10. Once nuclei passed these QC, they were randomly selected to be prepared into libraries. All pre-amplified material was handled in a separate single cell room in a laminar flow hood. All materials used in pre-amplification (excluding the enzyme, sample buffer, and reaction buffer) were UV sterilized before use.
Library preparation and sequencing
Version 1
Genomic DNA and MDA samples were processed identically after the amplification step. Ten micrograms of DNA was sheared to an average size of 500 bp via sonication using Covaris S2 instrument (5% duty cycle, intensity of 3, 200 cycles per burst, 80 s total time). DNA was then concentrated using Agencourt Ampure beads (Beckman Coulter) and L1 capture was performed with a single anneal and extension step with platinum Pfx DNA polymerase (Invitrogen) and biotinylated L1 oligo: 5′-biotin-TGGGAGATATACCTAATGCTAGATGACAC*A-3′,where the asterisk denotes phosphorothioate linkages (94°C 5 min, 61.5°C anneal 30 s, 68°C extension 3 min). The reaction was cleaned up with Agencourt Ampure beads, and end-repaired (NEB end-repair kit). Size was selected on 1.5% pippen prep gel (Sage bioscience). Biotinylated fragments were incubated with streptavidin magnetic beads (Dynabeads MyOneTM Streptavidin C1, Life Technologies, Inc., Carlsbad, California, USA); a 3′ A overhang was added to bead-DNA (NEB dA-tailing module). Adapter ligation was then performed on bead-attached DNA with ultrapure T4 DNA ligase (Enzymatics) using the following custom asymmetric annealed oligos: JE117: 5′AATGATACGGCGACCACCGAGATCTACACTCTTTCCCTACACGACGCTCTTCCGATC*T-3′, JE149: 5′-/P/GATCGGAAGAGCG/3AmM/-3′, where/P/denotes phosphate group and/3AmM/denotes amino group. All custom oligonucleotides were synthesized by Integrated DNA Technologies (Coalville, Iowa) and HPLC purified. The adapter ligated-bead-DNA was washed 3×, resuspended in 10 mM Tris-Cl, pH 8.5, and PCR amplified for 16 cycles (KAPA HiFi HotStart ReadyMix, Kapa Biosystems Wilmington, MA) with the following oligos: (NNNNNN) denotes barcode: L1: 5′-CGGTCTCGGCATTCCTGCTGAACCGCTCTTCCGATCTN(3–10) ATGTGCACATGTACCCTAAAACTT*A-3′. These PCR products were purified away from bead DNA and size selected for 250–650 bp on 1.5% pippen prep agarose gels. Each library was analyzed on a Bioanalyzer DNA HS chip (Agilent Technologies, Inc., Santa Clara, CA, USA) and further manual size selections were performed when necessary on 2% agarose gels. A whole flow cell of Illumina HiSeq200 100-bp paired-end sequencing was performed at McGill University and Genome Quebec Innovation Centre.
Version 2
Version 1 was updated to perform targeted sequencing using standard Illumina sequencing primers. Modifications were also made to increase throughput. Ten micrograms of MDA and gDNA were sheared by covaris E220 and concentrated with Ampure beads as in version 1. Five micrograms of DNA was aliquoted for L1 3′ library generation. Capture, extension, A-tailing, and ligation proceeded as before except the L1 capture proceeded with the following oligo: JE281L1_ACA:/5biosg/ATATACCTAATGCTAGATGACAC*A. Custom asymmetric annealed oligos/adapters were used: JED501+JED50x_lig:5′-AATGATACGGCGACCACCGAGATCTACACNNNNNNNNACACTCTTTCCCTACACGACGCTCTTCCGATC*T-3′ annealed to: JED50x_lig:/5Phos/GATCGGAAGAGCGTCGTGTAGGGAAAGAGTGT/3AmM/-3′. PCR amplification proceeded as before for 16 cycles but with the following PCR primers: L3′: JE502-517 (5′-CAAGCAGAAGACGGCATACGAGANNNNNNNGTGACTGGAGTTCAGACGTGTGCTCTTCCGATCTNTAACTAACCTGCACAATGTGCAC-3′) + JE620 (5′-AATGATACGGCGACCACCGAGATCTACAC-3′). Size selection was performed via double ampure purification. Libraries were quantified using picogreen (Life Technologies) and qPCR and were mixed with 10–20% phiX and sequenced on Illumina HiSeq2500 at the Salk Genomics Core.
Computational analysis
Preprocessing and mapping
Reads were trimmed with the cutadapt program (version 1.3) to remove adaptor sequences and 3′ ends having Phred quality smaller than 28. Read pairs having one read smaller than 36 bp after trimming were discarded. Trimmed reads were mapped to the reference human genome hg19 with BWA-MEM19 (version 0.7.5a) in paired-end mode with parameter -T 19. Read pairs sharing the same end coordinates were treated as PCR duplicates, and only the pair with the highest total sequence quality score was retained. The first k bp of read 2 (see Table 1 for k values) were aligned to the last k bp of L1HS consensus, for L1. If the read pair was mapped in proper pairing, the first k bps of read 2 were aligned to k+2 bp of the local genomic sequence, anchored to read 2 mapping position. Otherwise, the first k bps of read 2 were aligned to 750 bp of the local genomic sequence anchored to read 1 mapping position. These alignments were done with a modified Needleman-Wunsch pairwise alignment algorithm38 with the following scoring parameters: match: 1, mismatch: −1, gap opening: −5, gap extension: −1, terminal gap: 0. This resulted in two alignment scores: YA: alignment of read 2 prefix to retrotransposon consensus, and YG: alignment of read 2 prefix to local genome sequence. SLAV-Seq data have been deposited at EMBL-EBI ArrayExpress and are accessible through accession E-MTAB-3880.
Table 1.
Read 2 prefix length (bp)
| L1 3′ | |
|---|---|
| SLAV-seq v1. | 12 bp |
| SLAV-seq v2. | 29 bp |
Machine-learning approach to identify L1 insertions
We split the reference genome hg19 into equally spaced 750-bp windows with an overlap of 500 bp between consecutive windows. For each window, we collected 70 features, listed on table S2. For each single cell or bulk tissue sample dataset, we trained a random forest classifier20 with the objective of predicting whether or not each window had an insertion. We used as positive examples the windows containing previously known non-reference L1 polymorphic insertions covered by ≥5 non-redundant reads and, as negative examples, the subset of windows with ≥5 non-redundant reads from a set of 10,000 randomly drawn windows from the genome. For each window, the classifier output a score, ranging from 0 to 1, that corresponded to the estimated probability that that window had an insertion. We evaluated precision and recall of the classifiers (Fig. S3).
Identification of germline L1 insertions
We applied the Random Forest classifiers to bulk tissue sample datasets and selected the windows that had a score >0.75 in at least two distinct tissues from the same patient.
Identification of candidate somatic L1
We applied the Random Forest classifiers to single cells sample datasets and selected those windows with a score >0.75 as non-reference insertions. Germline L1 insertions and previously identified non-reference insertions19, which contain a comprehensive summary of published L1HS insertion polymorphisms identified in health or pathological human samples, were subtracted from the non-reference insertion set to obtain candidate somatic L1 windows.
Whole genome sequencing analysis
We performed whole genome sequencing on MDA-amplified single cell genomic DNA for single cell samples 48, 53 and 153, which contain the putative L1-associated somatic variants. We performed standard Illumina library preparation and 150bp paired-end sequencing with Illumina Next seq instrument. Reads were mapped with bowtie239, and the resulting BAM alignment files were converted to BED format using bedtools40. These files were used for read depth analysis with the Ginkgo software suite24. WGS data have been deposited at EMBL-EBI ArrayExpress and are accessible through accession E-MTAB-4824.
Primer design
We wrote a custom primer design tool in Python, using the package primer3_py Python package to have access to primer341 functionality. For each insertion candidate, the program fetches 2 kb of the genomic sequence that flanks the insertion and uses it to design 3 primer pairs: (1) one primer in each of the two genomic flanks of the insertion point; (2) one primer in the 5′ flank and another inside the retrotransposon; and (3) one primer in the 3′ flank and another inside the retrotransposon. We used a preferred product size parameter of 200 bp to preferentially design short amplicons. To make sure primers were specific to the target regions, repeat regions obtained from the RepeatMasker (Smit et al., 1996–2010) UCSC genome browser42 track were masked from prior to primer design. For the minority of cases in which no primers could be designed without the use of repeat masked sequences, we allowed the use of those sequences but annotated that condition in the output.
RNA-Seq analysis
Low quality ends and adapter removal/trimming were performed using Cutadapt Python package. The trimmed reads were mapped using STAR43. Expression values, and heatmaps were performed using R 3.0.2 and RStudio 0.98.490 software based on normalized counts, variance stabilizing transformation (VST) and differential expression calculated using DESeq2 R package (bioconductor.org). GO pathway analyses were done using DAVID (.org) and we included enriched terms up and down to adjp < 0.001. RNA-seq data have been deposited at EMBL-EBI ArrayExpress and are accessible through accession E-MTAB-4830.
Implementation
Most of the analyses were performed with locally developed Python and R code. We used the Random Forest implementation from the scikit-learn Python package (http://scikit-learn.org/).
PCR validation
A detailed table of loci, primers, Sanger sequencing results, and conclusions of validations performed is presented in table S4.
Flanking PCR validation
PCR validation assays were performed with 10 ng of DNA and primers as indicated (tables S5) with 0.25 μM primers. L1 PCRs were performed with LongAmp Hotstart mix (NEB, Ipswich, MA). Reactions were visualized using 1% agarose gel electrophoresis. Positive amplicons were excised, gel purified with Wizard-SV Gel and PCR clean-up system (Promega), and either directly sequence or topo-cloned into PCR2.1 (Life Technologies) and capillary sequenced at Eton Biosciences (San Diego, CA).
L1 3′ PCR validation
PCR validation assays were performed with 10 ng of DNA and primers as indicated (Tables S5), with 0.25 μM primers and 2× Hotstart Supermix with loading dye (BioPioneer, San Diego, CA). Reactions were visualized using 1% agarose gel electrophoresis. Positive amplicons were excised, gel purified with Wizard-SV Gel and PCR clean-up system (Promega) and capillary sequenced at Eton Biosciences (San Diego, CA).
Droplet digital PCR
Droplet PCR assays were adapted from21 and performed on a QX200 ddPCR droplet reader (Bio-Rad; Hercules, CA, USA). Twenty microliter reactions using ddPCR Supermix for Probes (no dUTP) (Bio-Rad; Hercules, CA, USA) were performed with 5 ng single-cell DNA and 250 ng bulk genomic DNA input. Nine hundred nanomolars of 3′ L1Hs primer, 900 nM of locus-specific primer, and 200 nM of 3′ L1HS probe were used. Cycling conditions were 95°C for 10 min, followed by 40 cycles of 94°C for 30 s and 60°C for 1 min, and then a final 10-min incubation at 98°C. Droplet reading was performed on a QX200 ddPCR droplet reader (Bio-Rad; Hercules, CA, USA), and analysis was done using QuantaSoft Analysis software (Bio-Rad; Hercules, CA, USA).
Loss of heterozygosity assay
PCR assays were performed with 10 ng of DNA and primers, as indicated (table S5), with 0.25 μM primers and 2× Hotstart Supermix with loading dye (BioPioneer, San Diego, CA). Reactions were visualized using 1% agarose gel electrophoresis. Positive amplicons were excised, gel purified (Wizard SV gel and PCR cleanup System) and capillary sequenced at Eton Biosciences (San Diego, CA).
Cell culture and yH2AX assays
Hues6 human embryonic stem cell (hESC)-derived hippocampal progenitor cells were cultured and differentiated to neurons as previously described2. HEK293T cells were grown in 10% FBS in DMEM. Cells were transfected by PEI with L1(KS99LRE33) L1 endonuclease and reverse transcriptase deficient plasmids (L1 Endo-)4 or treated with 1.85mM of H2O2 for 10min. Cells were fixed in 4% PFA 24 hours post transfection and immunofluorescence for yH2AX (Cell Signalling 9718, 1:400 dilution).
For chromatin immunoprecipitation assays, HEK293T chromatin was crosslinked by 1% Formamide 24 hours post transfection and ChIP was performed as described (Milipore, Chromatin Immunoprecipitation Assay). Dynabead Protein A beads (ThermoFisher 10001D) were pre-coated with 5ug of yH2AX (Cell Signalling 9718, 1:400 dilution) or rabbit IgG (ab27472). Enrichment qPCR was performed by taqman qPCR assay with ORF2-2, HERV and SATA primers as previously described8.
PWRN2 knockdown
dsRNA (DsiRNA) from IDT were used for knowdown: knockdown A: CrCrUrGrUrCrArArArCrUrArGrArCrArArUrGrArGrUrGCT Knockdown B:GrGrArUrGrUrGrArArCrArArUrUrCrCrArUrArGrGrUrUAT. Hues 6 hESC-derived hippocampal NPCs2 were transfected by nucleofection (Amaxa Biosystems) with the rat NSC kit, A31 program with DsiRNA at 300uM concentration. Three biological replicates per dsRNA were performed. Two days post-transfection, cells were harvested for RNA-seq and RT-PCR analysis.
High-throughput whole transcriptome RNA sequencing (RNA-Seq)
RNA-Seq libraries were prepared using the TruSeq Stranded mRNA Sample Prep Kit according to the manufacturer’s instructions (Illumina). Libraries were sequenced single-end 50 bp using the Illumina HiSeq 2500 platform.
Reverse Transcription PCR Analysis
Nuclei were directly sorted into TrizolLS (Invitrogen) and purified. RNA was DNAsed for 30 min with turbo DNAse (Ambion), and reverse transcribed with oligo-dT primers and SuperScriptIII (Invitrogen). PCR was performed using Biopioneer 2X Hotstart Supermix (95deg 2min, 95deg 30s, 60deg 30s, 72deg 1min, cycle 35x) with the following primers: NeuN (5′-CCGATGGTGTGATGGTACG, 5′-GGGTCGTGTATCAGGATGGA) and GFAP (5′-GGAAGATTGAGTCGCTGGAG, 5′-GGTACCACTCTTCGGCTTCA), PWRN2 (5′-AAATCATGGAGCAGGGTCAC, 5′-GCCCAGTATCAACCAGGAAA), GAPDH (5′-TGTTGCCATCAATGACCCCTT, 5′-CTCCACGACGTACTCAGCG)
Supplementary Material
Supplemental Materials
Table S1
Table S2
Table S3
Table S4
Table S5
Table S6
Acknowledgments
We thank J. Moran, M.L. Gage, M. McConnell, C. Benner, R. Herai, and David O’Keefe for critical reading of the manuscript and helpful discussions. J.A.E. is supported by the George E. Hewitt Foundation for Medical Research, A.C.M.P. was supported by a training grant from the California Institute for Regenerative Medicine. The Gage Laboratory, and this project, was partially funded by NIH MH095741, NIH MH088485, The G. Harold & Leila Y. Mathers Foundation, The Engman Foundation, The Leona M. and Harry B. Helmsley Charitable Trust, and JPB Foundation.
References
- 1.Campbell IM, Shaw CA, Stankiewicz P, Lupski JR. Somatic mosaicism: implications for disease and transmission genetics. Trends in genetics: TIG. 2015;31:382–392. doi: 10.1016/j.tig.2015.03.013. [DOI] [PMC free article] [PubMed] [Google Scholar]
- 2.Shirley MD, et al. Sturge-Weber syndrome and port-wine stains caused by somatic mutation in GNAQ. The New England journal of medicine. 2013;368:1971–1979. doi: 10.1056/NEJMoa1213507. [DOI] [PMC free article] [PubMed] [Google Scholar]
- 3.Poduri A, et al. Somatic activation of AKT3 causes hemispheric developmental brain malformations. Neuron. 2012;74:41–48. doi: 10.1016/j.neuron.2012.03.010. [DOI] [PMC free article] [PubMed] [Google Scholar]
- 4.Muotri AR, et al. Somatic mosaicism in neuronal precursor cells mediated by L1 retrotransposition. Nature. 2005;435:903–910. doi: 10.1038/nature03663. [DOI] [PubMed] [Google Scholar]
- 5.Erwin JA, Marchetto MC, Gage FH. Mobile DNA elements in the generation of diversity and complexity in the brain. Nature reviews Neuroscience. 2014;15:497–506. doi: 10.1038/nrn3730. [DOI] [PMC free article] [PubMed] [Google Scholar]
- 6.Evrony GD, et al. Single-neuron sequencing analysis of L1 retrotransposition and somatic mutation in the human brain. Cell. 2012;151:483–496. doi: 10.1016/j.cell.2012.09.035. [DOI] [PMC free article] [PubMed] [Google Scholar]
- 7.Evrony GD, et al. Cell lineage analysis in human brain using endogenous retroelements. Neuron. 2015;85:49–59. doi: 10.1016/j.neuron.2014.12.028. [DOI] [PMC free article] [PubMed] [Google Scholar]
- 8.Evrony GD, Lee E, Park PJ, Walsh CA. Resolving rates of mutation in the brain using single-neuron genomics. Elife. 2016;5 doi: 10.7554/eLife.12966. [DOI] [PMC free article] [PubMed] [Google Scholar]
- 9.Upton KR, et al. Ubiquitous L1 Mosaicism in Hippocampal Neurons. Cell. 2015 doi: 10.1016/j.cell.2015.03.026. doi: http://dx.doi.org/10.1016/j.cell.2015.03.026. [DOI] [PMC free article] [PubMed]
- 10.Coufal NG, et al. L1 retrotransposition in human neural progenitor cells. Nature. 2009;460:1127–1131. doi: 10.1038/nature08248. [DOI] [PMC free article] [PubMed] [Google Scholar]
- 11.Muotri AR, et al. L1 retrotransposition in neurons is modulated by MeCP2. Nature. 2010;468:443–446. doi: 10.1038/nature09544. [DOI] [PMC free article] [PubMed] [Google Scholar]
- 12.McConnell MJ, et al. Mosaic copy number variation in human neurons. Science. 2013;342:632–637. doi: 10.1126/science.1243472. [DOI] [PMC free article] [PubMed] [Google Scholar]
- 13.Cai X, et al. Single-cell, genome-wide sequencing identifies clonal somatic copy-number variation in the human brain. Cell reports. 2014;8:1280–1289. doi: 10.1016/j.celrep.2014.07.043. [DOI] [PMC free article] [PubMed] [Google Scholar]
- 14.Dean FB, et al. Comprehensive human genome amplification using multiple displacement amplification. Proceedings of the National Academy of Sciences of the United States of America. 2002;99:5261–5266. doi: 10.1073/pnas.082089499. [DOI] [PMC free article] [PubMed] [Google Scholar]
- 15.Witherspoon DJ, et al. Mobile element scanning (ME-Scan) by targeted high-throughput sequencing. BMC genomics. 2010;11:410. doi: 10.1186/1471-2164-11-410. [DOI] [PMC free article] [PubMed] [Google Scholar]
- 16.Iskow RC, et al. Natural mutagenesis of human genomes by endogenous retrotransposons. Cell. 2010;141:1253–1261. doi: 10.1016/j.cell.2010.05.020. [DOI] [PMC free article] [PubMed] [Google Scholar]
- 17.Brouha B, et al. Hot L1s account for the bulk of retrotransposition in the human population. Proceedings of the National Academy of Sciences of the United States of America. 2003;100:5280–5285. doi: 10.1073/pnas.0831042100. [DOI] [PMC free article] [PubMed] [Google Scholar]
- 18.Lasken RS, Stockwell TB. Mechanism of chimera formation during the Multiple Displacement Amplification reaction. BMC biotechnology. 2007;7:19. doi: 10.1186/1472-6750-7-19. [DOI] [PMC free article] [PubMed] [Google Scholar]
- 19.Li H. Aligning sequence reads, clone sequences and assembly contigs with BWA-MEM. 2013 [Google Scholar]
- 20.Breiman L. Random Forests. Machine Learning. 2001;45:5–32. [Google Scholar]
- 21.White TB, McCoy AM, Streva VA, Fenrich J, Deininger PL. A droplet digital PCR detection method for rare L1 insertions in tumors. Mobile DNA. 2014;5:30. doi: 10.1186/s13100-014-0030-4. [DOI] [PMC free article] [PubMed] [Google Scholar]
- 22.Gilbert N, Lutz-Prigge S, Moran JV. Genomic deletions created upon LINE-1 retrotransposition. Cell. 2002;110:315–325. doi: 10.1016/s0092-8674(02)00828-0. [DOI] [PubMed] [Google Scholar]
- 23.Morrish TA, et al. DNA repair mediated by endonuclease-independent LINE-1 retrotransposition. Nature genetics. 2002;31:159–165. doi: 10.1038/ng898. [DOI] [PubMed] [Google Scholar]
- 24.Garvin T, et al. Interactive analysis and assessment of single-cell copy-number variations. Nature methods. 2015;12:1058–1060. doi: 10.1038/nmeth.3578. [DOI] [PMC free article] [PubMed] [Google Scholar]
- 25.Jurka J. Sequence patterns indicate an enzymatic involvement in integration of mammalian retroposons. Proc Natl Acad Sci USA. 1997;94:1872–1877. doi: 10.1073/pnas.94.5.1872. [DOI] [PMC free article] [PubMed] [Google Scholar]
- 26.Feng Q, Moran JV, Kazazian HH, Boeke Jef D. Human L1 retrotransposon encodes a conserved endonuclease required for retrotransposition. Cell. 1996;87:905–916. doi: 10.1016/s0092-8674(00)81997-2. [DOI] [PubMed] [Google Scholar]
- 27.Yu DX, et al. Modeling hippocampal neurogenesis using human pluripotent stem cells. Stem cell reports. 2014;2:295–310. doi: 10.1016/j.stemcr.2014.01.009. [DOI] [PMC free article] [PubMed] [Google Scholar]
- 28.Moran JV, et al. High frequency retrotransposition in cultured mammalian cells. Cell. 1996;87:917–927. doi: 10.1016/s0092-8674(00)81998-4. [DOI] [PubMed] [Google Scholar]
- 29.d’Adda di Fagagna F, et al. A DNA damage checkpoint response in telomere-initiated senescence. Nature. 2003;426:194–198. doi: 10.1038/nature02118. [DOI] [PubMed] [Google Scholar]
- 30.Gasior SL, Wakeman TP, Xu B, Deininger PL. The human LINE-1 retrotransposon creates DNA double-strand breaks. Journal of molecular biology. 2006;357:1383–1393. doi: 10.1016/j.jmb.2006.01.089. [DOI] [PMC free article] [PubMed] [Google Scholar]
- 31.Nithianantharajah J, et al. Synaptic scaffold evolution generated components of vertebrate cognitive complexity. Nature neuroscience. 2013;16:16–24. doi: 10.1038/nn.3276. [DOI] [PMC free article] [PubMed] [Google Scholar]
- 32.Kirov G, et al. De novo CNV analysis implicates specific abnormalities of postsynaptic signalling complexes in the pathogenesis of schizophrenia. Molecular psychiatry. 2012;17:142–153. doi: 10.1038/mp.2011.154. [DOI] [PMC free article] [PubMed] [Google Scholar]
- 33.Fromer M, et al. De novo mutations in schizophrenia implicate synaptic networks. Nature. 2014;506:179–184. doi: 10.1038/nature12929. [DOI] [PMC free article] [PubMed] [Google Scholar]
- 34.Lim JS, et al. Brain somatic mutations in MTOR cause focal cortical dysplasia type II leading to intractable epilepsy. Nat Med. 2015;21:395–400. doi: 10.1038/nm.3824. [DOI] [PubMed] [Google Scholar]
- 35.Kempermann G, Kuhn HG, Gage Fred H. Genetic influence on neurogenesis in the dentate gyrus of adult mice. Proc Natl Acad Sci USA. 1997;94:10409–10414. doi: 10.1073/pnas.94.19.10409. [DOI] [PMC free article] [PubMed] [Google Scholar]
- 36.Aimone JB, Deng W, Gage Fred H. Adult neurogenesis: integrating theories and separating functions. Trends Cogn Sci (RegulEd) 2010;14:325–337. doi: 10.1016/j.tics.2010.04.003. [DOI] [PMC free article] [PubMed] [Google Scholar]
- 37.Hosono S, et al. Unbiased whole-genome amplification directly from clinical samples. Genome research. 2003;13:954–964. doi: 10.1101/gr.816903. [DOI] [PMC free article] [PubMed] [Google Scholar]
- 38.Needleman SB, Wunsch CD. A general method applicable to the search for similarities in the amino acid sequence of two proteins. Journal of molecular biology. 1970;48:443–453. doi: 10.1016/0022-2836(70)90057-4. [DOI] [PubMed] [Google Scholar]
- 39.Langdon WB. Performance of genetic programming optimised Bowtie2 on genome comparison and analytic testing (GCAT) benchmarks. BioData Min. 2015;8:1. doi: 10.1186/s13040-014-0034-0. [DOI] [PMC free article] [PubMed] [Google Scholar]
- 40.Quinlan AR, Hall IM. BEDTools: a flexible suite of utilities for comparing genomic features. Bioinformatics. 2010;26:841–842. doi: 10.1093/bioinformatics/btq033. [DOI] [PMC free article] [PubMed] [Google Scholar]
- 41.Untergasser A, et al. Primer3–new capabilities and interfaces. Nucleic acids research. 2012;40:e115. doi: 10.1093/nar/gks596. [DOI] [PMC free article] [PubMed] [Google Scholar]
- 42.Kent WJ, et al. The human genome browser at UCSC. Genome research. 2002;12:996–1006. doi: 10.1101/gr.229102.. Article published online before print in May 2002. [DOI] [PMC free article] [PubMed] [Google Scholar]
- 43.Dobin A, et al. STAR: ultrafast universal RNA-seq aligner. Bioinformatics. 2013;29:15–21. doi: 10.1093/bioinformatics/bts635. [DOI] [PMC free article] [PubMed] [Google Scholar]
Associated Data
This section collects any data citations, data availability statements, or supplementary materials included in this article.
Supplementary Materials
Supplemental Materials
Table S1
Table S2
Table S3
Table S4
Table S5
Table S6