Mos as a tool for genome-wide insertional mutagenesis in Caenorhabditis elegans: results of a pilot study (original) (raw)
Abstract
The sequence of the Caenorhabditis elegans genome contains approximately 19 000 genes. Available mutants currently exist for <20% of these genes. The existence of a _Mos_-based inducible transposon system in C.elegans could theoretically serve as a tool to saturate the genome with insertions. We report here the results of a pilot study aimed at assaying this strategy. We generated 914 independent random Mos insertions and determined their location by inverse PCR. The distribution of the insertions throughout the genome does not reveal any gross distortion, with the exception of a major hotspot on chromosome I (rDNA locus). Transposons are evenly distributed between the genic and intergenic regions. Within genes, transposons insert preferentially into the introns. We derived the consensus target site for Mos in C.elegans (ATATAT), which is common to Tc1, another mariner element. Finally, we assayed the mutagenic properties of insertions located in exons by comparing the phenotype of homozygous strains to that of known mutations or RNAi of the same gene. This pilot experiment shows that a _Mos_-based approach is a viable strategy that can contribute to the constitution of genome-wide collections of identified C.elegans mutants.
INTRODUCTION
Since their discovery, transposons have been used as tools to generate mutations and polymorphisms. In the nematode Caenorhabditis elegans, despite the fact that their use is cumbersome, Tc elements from the mariner family have been used extensively in both forward and reverse genetic approaches [reviewed in (1,2)]. Tc insertions within genes can sometimes lead to phenotypes by perturbing gene expression. In many cases, insertions have been used to generate deletions after remobilization (2).
The genome sequence of the model organism C.elegans was published in 1998 (3). Since then, plans have been made towards the establishment of comprehensive collections of identified C.elegans mutants. Similar approaches based on systematic gene mutagenesis have also been carried out in other major model organisms, including yeast, flies and mouse (4–6). In C.elegans, a gene knockout consortium has been set up to target specific genes by deletions (7). As a strategy complementary to knockouts, non-directed transposon-based insertional mutagenesis appears to be a feasible way to cover most of the genome at a relatively low cost. A preliminary study to test this idea led to the production and analysis of hundreds of new insertions of the endogenous transposons Tc1 and Tc3 (8). This study showed that Tc1 and Tc3 show a relatively even distribution in the genome, and that half of the insertions were within or close to genes (8).
A major drawback of Tc1 and Tc3, the best characterized among the C.elegans transposons, is that they are present in numerous copies throughout the C.elegans genome, making the detection of additional copies tedious and their control difficult. A significant breakthrough was made in 2001 with the demonstration that the Drosophila Mos transposon is active in the C.elegans germline (9). Because there is no resident Mos transposon in the genetic background of C.elegans, Mos insertion sites can be localized more easily than Tc elements by inverse PCR (9). These arguments currently make the Mos transposon the best tool for insertional mutagenesis in C.elegans.
A critical point in transposon-based mutagenesis resides in a potential bias in the sites of insertion, since this would reduce the proportion of the genome, which can be covered randomly. The absence of a strong bias in the distribution is therefore a prerequisite before entering in a large-scale transposon-based strategy.
In this paper, we report the result of a pilot experiment in which over 900 Mos insertions were randomly generated and mapped in the C.elegans genome.
MATERIALS AND METHODS
Generation of Mos insertions
Transposition was obtained as in Bessereau et al. (9). Strain EG1642 (genotype lin-15(n765); oxEx166[HSP::MosTRANSPOSASE, lin-15(+), unc-129::GFP]) carrying the non-integrated Mos transposase under a heat-shock promoter was crossed into strain EG1470 (genotype oxEx229[Mos1 Substrate, myo-2::GFP]) carrying the non-integrated Mos template (Figure 1). Double transgenic F0 animals were identified based on the presence of both fluorescent markers (labelling the pharynx and the coelomocytes) and were heat-shocked (1 h at 33°C, 1 h at 15°C and 1 h at 33°C). Although oxEx229 carries a wild-type copy of Mos, this non-marked element is not active alone (L. Ségalat, unpublished results).
Figure 1.
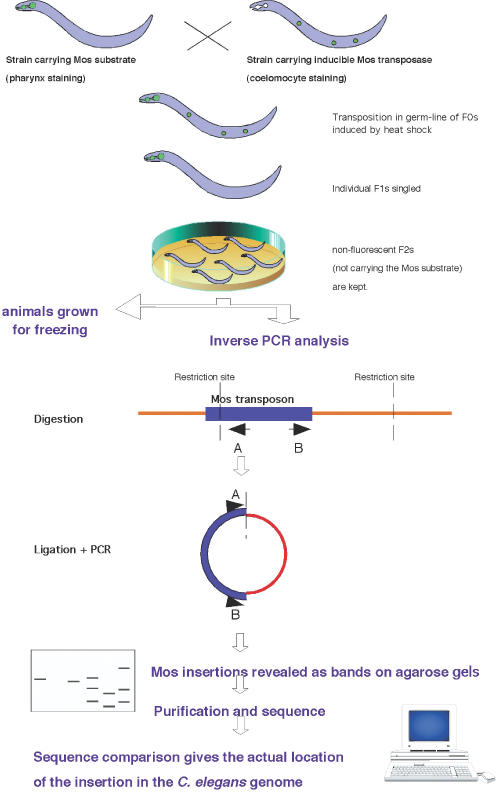
Strategy used to generate and identify Mos transposon insertions. RE, restriction enzyme site. A and B represent PCR primers. See text for details.
Analysis was performed on non-transgenic (non-fluorescent) F2 animals. Animals were grown on normal NGM plates (10).
Alleles generated during this study carry the name cxPy (where y is the allele number). Strains are currently conserved in Lyon, France. Strain requests must be sent to L. Ségalat.
Determination of Mos insertion sites
The following protocol was adapted from (11).
Lysis
Two to five live worms were put in 3 μl of 10 mM Tris–HCl, pH 8.2, 50 mM KCl, 2.5 mM MgCl2, 0.5% Tween-20, 100 μg Proteinase K, frozen at −80°C for at least 30 min and incubated for 60 min at 60°C followed by 15 min at 95°C.
Digestion and ligation
The lysate was then digested with 1.5–2 U of one of the following enzymes: HaeIII, HpaII and MboI for 2 h, which were subsequently heat inactivated (65°C, 20 min). The DNA was then ligated with 100 U of T4 DNA ligase (NEB) at 15°C overnight.
Inverse PCR
An aliquot of 3 μl of the ligation reaction was used as a substrate in a PCR reaction with primers oJL103-oJL114 (9) (30 cycles, annealing temperature 60°C). A nested PCR was performed on 0.03 μl of the first reaction, using primers oJL115-oJL116 (9) (30 cycles, annealing temperature 62°C). PCR reactions were performed with the Eurobio enzyme in the buffer provided by the manufacturer. MgCl2 was adjusted to 2 mM. PCR products were analysed by migration of an aliquot on 1.8% agarose gels. When a unique band was seen, the product was purified with the Minelute kit (Qiagen); when multiple bands were seen, they were reamplified after picking.
Sequence analysis
Sequences were compared with the C.elegans genome sequence to determine the sites of insertion using the blast program. Sequences of poor quality or for which the blast result was ambiguous were not preserved. Inconclusive blasts could usually be attributed to one of the following reasons: (i) the sequence was too short; (ii) the sequence contained numerous undetermined bases that caused matches to more than one genomic region; (iii) the sequence mapped to a highly repetitive genomic region.
Freezing and storage of the strains
Descendants of positive F2s were used to seed six 60 mm plates, which were grown to saturation. Note that since the inverse PCR protocol does not distinguish between homozygous and heterozygous insertions, a large number of worms grown for freezing were heterozygous.
When the plates were saturated (approximately two generations later), worms were washed off the plate with M9 and pooled to fill three 1.8 ml cryovials (Nunc), which were frozen according to standard protocols (10). Permanent storage was carried out at −80°C for one copy and in liquid nitrogen for two copies.
Recovery tests
For recovery tests and response to strain requests, an aliquot (approximately one-tenth) of the vial stored at −80°C was scrapped with a sterile spatula and put on a regular NGM plate. Up to 15 animals were singled on individual plates and PCR-tested with a Mos primer and an insertion-specific primer.
Website
The insertions produced in this study are freely available to the research community. The list of insertions can be found on http://www.cgmc.univ-lyon1.fr/EN/. The insertions also appear on the Wormbase database http://www.wormbase.org.
RESULTS
Generation of lines carrying novel insertions
We generated over 600 lines following the protocol outlined in Figure 1. An average of two Mos insertions per strain were detected. On agarose gels loaded with inverse PCR products, new insertions appear as bands. A representative gel is shown in Figure 2, on which each lane corresponds to a different strain. After elimination of bands that gave poor quality sequences, or blasts that were inconclusive, the final number of curated independent insertions is 914.
Figure 2.
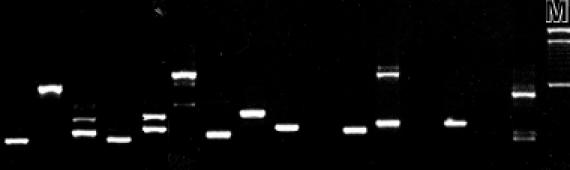
Representative example of gels run to detect Mos insertions. An aliquot of PCR reactions was loaded on a 2% agarose gel. Each lane represents a different strain. Between 0 and 4 bands per lane are visible. The last lane (M) was loaded with a size marker. The three major bands correspond to 2000, 1500 and 600 bp.
Recovery rate of insertions
We assayed our ability to recover predicted insertions from the frozen samples. A total of 49 insertions were subjected to the test, either because we wanted to assay the phenotype of homozygous animals (see below) or because the insertions were requested by other laboratories for their own use. For each insertion, we designed an insertion-specific primer located ∼500 bp from the predicted insertion site. We thawed worms from the corresponding strain and PCR-tested 6 to 20 individual animals using as primers a _Mos_-specific primer and an insertion-specific primer. Out of 49 insertions, we were able to recover the insertion in 38 cases. This means that the recovery rate per insertion is ∼77% in this sample. Note that the recovery rate might be quite different for insertions located in coding sequences (potentially more deleterious) than for other ones.
Target sequence of Mos insertions
We aligned the target sequences of the Mos insertions generated in this experiment (Figure 3). The consensus sequence is ATATATAT, in which the central TA is invariant, identical to that of Tc1 and other mariner elements (12–14). Although the consensus is identical, discrepancies with Tc1 sites can be seen in the degree of conservation of the bases at −3/+3 relative to the central TA, as it is less conserved for Mos than for Tc1 (Figure 3).
Figure 3.

Graphical representation of transposons insertion consensus in C.elegans. Top, Mos; middle, Tc1; bottom, Tc3. Letter sizes indicate the frequency of any given base around the central TA site. Mos and Tc1 share the same ATATATAT 8-base consensus; but analysis at each position shows that base frequencies vary for the two transposons. [Tc1 and Tc3 values are taken from previous studies (13)].
Distribution on chromosomes
The major goal of this study is to analyse the distribution of randomly generated Mos insertions in the genome. Table 1 gives the total number of insertions per chromosome, compared to the size of the genome. It appears that the distribution is relatively uniform. The number of insertions closely follows the chromosome size for four out of the six chromosomes (II, III, IV and X). However, there is an excess of insertions (compared to a non-biased distribution) for chromosome I, and a deficit for chromosome V. A Chi-square analysis of the distribution by chromosome indicates that the distribution is non-uniform because of the distortion caused by chromosomes I and V (P < 0.001). This distortion remains if insertions at the rDNA hotspot (see below) are subtracted. The causes of this distortion are not known.
Table 1. Distribution of insertions by chromosome.
| | Chromosome | | | | | | | | | ------------------------------ | -------- | -------- | -------- | -------- | -------- | -------- | --------- | | | I | II | III | IV | V | X | Total | | | Percentage of genome | 15 | 15 | 14 | 17 | 21 | 18 | 100 | | Number of Mos insertions (%) | 187 (21) | 132 (14) | 118 (13) | 154 (17) | 140 (15) | 183 (20) | 914 (100) |
The physical distribution of Mos insertions is shown on the genome map (Figure 4). It reveals that all chromosomic regions are covered with Mos insertions.
Figure 4.
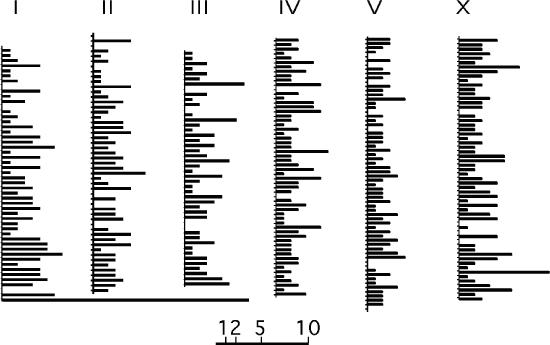
Distribution of the Mos insertions on the C.elegans genome. Each chromosome is shown in the standard orientation. Each chromosome has been divided in 300 kb intervals. Bar length indicate the number of insertions within an interval. Scale is shown below. Note the major hotspot at the bottom of chromosome I, due to 21 insertions within a 4 kb interval at the rDNA locus. The detailed list of insertions can be found on http://www.cgmc.univ-lyon1.fr/EN/.
Hotspots
A major hotspot accounts for 2.3% of the total number of insertions. It consists of 21 insertions scattered within 4 kb. This hotspot corresponds to the rDNA locus situated on the right end of chromosome I (Figure 4). It is the only hotspot we were able to detect. Other regions of apparent high insertion density visible on Figure 4 are due to the non-contiguous accumulation of insertions within the same 300 kb interval, and should not be considered as hotspots at this stage.
Absence of correlation with transcription levels
Since the rDNA locus is highly transcribed, we next tested whether there was a correlation between Mos insertion sites and transcription levels. For this purpose, the 456 insertions located within genes (excepted the rDNA locus) were matched to the gene categories defined by Hill et al. (15) in terms of gene expression levels. No bias was observed in the distribution of genes hit by Mos insertions, compared to the whole genome distribution (data not shown). Therefore, we conclude that Mos insertions sites are not influenced by expression levels.
Absence of positive bias among genes
We next tried to determine if some genes are more prone to Mos transposon integration than others. An indication of this can be given by comparing the number of genes hit by two independent insertions in our sample (18) with the expected number if there is no bias. (Insertions at the rDNA hotspot were excluded from this calculation.) An approximation of the expected number can be given by a Poisson distribution of λ = 456/19 000 (where 456 is the number of insertions, and 19 000 is the number of genes). This distribution predicts that, if all genes have an equal probability to be hit, the average number of genes hit twice is 5.3, much less than the observed number of 18 (_P_-value = 10−6). However, the calculation of the expected number is based on the assumption that all genes are of equal length, which is not the case. Indeed, genes hit twice in our sample are longer than the average C.elegans gene. Therefore, we conclude that there is no evidence for a strong bias in favour of a subset of genes, except for the one naturally arising from length.
Distribution according to genome composition
Another important parameter of transposon distribution is the type of genomic region the transposon jumps into (exons, introns, intergenic regions). Table 2 gives a compilation of the results. It shows that more than half of the insertions are within or close to genes. Approximately 20% insert into coding sequences, ∼30% in introns and 4% in 5′ and 3′-untranslated regions (3′-UTRs) (arbitrarily defined as 100 bp before and after the coding sequence appearing in the Wormbase database). The sum of exonic insertions (coding sequences + UTRs) is 224 out of 914 insertions (23%). Within the genome, coding sequences account for 26% of the total and introns for 14% (3), indicating that there is a bias for transposon insertions in introns. Since the target sequence of the Mos element is the dinucleotide TA, and since introns are TA-rich, we tested whether this bias was due to the higher content of TAs in introns. However, if one recalculates the proportion of the genome in terms of the TA frequency, one observes that there is still a bias towards introns (Table 2).
Table 2. Distribution of insertions according to genome composition.
| | Coding | UTR | Introns | Intergenic | Total | | | ---------------------------------- | -------- | ------- | ---------- | -------- | --------- | | Percentage of genome | 26 | 4 | 14 | 56 | 100 | | Percentage of total genome TAs (%) | 17 | 3 | 18 | 62 | 100 | | Number of Mos insertions (%) | 204 (22) | 10 (1) | 263 (29) | 437 (48) | 914 (100) |
Mutagenic properties of Mos insertions
Since 20% of the insertions fall within exons, we next wondered whether they produce a phenotype comparable to that of the inactivated gene.
We selected 29 exons insertions for which the corresponding gene has been reported in the Wormbase database (www.wormbase.org) to produce a phenotype when inactivated, either by RNAi or by mutation. After thawing of the strain, insertions were recovered in 21 out of 29 cases. For the remaining eight lines, none of the animals thawed (up to 20 per line) carried the insertion.
We next compared the phenotype of _Mos_-homozygous animals to that of the corresponding mutant or RNAi. Homozygous insertions led to phenotypes resembling those obtained by mutation or RNAi in 11 out of 21 cases (52%). The details are given in Table 3. This percentage is probably underestimated because it is likely that several of the eight insertions which were not recovered after thawing were lost because they were counterselected as the strain was grown prior to freezing.
Table 3. Phenotype of Mos insertion alleles.
| Allele | Gene | Gene region | RNAi phenotype | Null phenotype (when it exists) | Insertion phenotype |
|---|---|---|---|---|---|
| cxP9037 | Y49F6B.1 | Coding | Emb, Unc, Sck | — | Egl, Sck |
| cxP9041 | C25A1.5 | Coding | Lva, Sck | — | Lva |
| cxP9092 | C01A2.5 | Coding | Emb, Gro, Sck | — | Emb |
| cxP9220 | T12F5.4/lin-59 | Coding | WT, Egl, Unc | Emb, Lvl | WT, Egl, Unc |
| cxP10217 | C04A2.3/egl-27 | Coding | Lvl, Egl, Unc | Egl, Unc | Egl, Unc |
| cxP9889 | F13D11.2/lin-57 | 3′ | Emb, Dpy, Egl | Emb | Egl |
| cxP9731 | Y54E10A.9a | Coding | WT, Emb | — | WT |
| cxP9977 | C42D4.8/rpc-1 | Coding | Emb, Gro | Emb | WT |
| cxP10053 | F30F8.8 | Coding | Emb, Sck | — | Lvl |
| cxP10101 | Y47D3B.7 | Coding | Stp, Gro, Sck | — | WT |
| cxP10032 | E02H1.1 | 5′ | Emb, Gro, Stp | — | Emb |
| cxP10146 | K07A1.2 | Coding | Emb, Ste | — | Ste |
| cxP10481 | F32A5.6 | Coding | Gro | — | WT |
| cxP10421 | Y75B8A.7 | Coding | Gro, Lvl | — | Lvl |
| cxP10435 | T05H10.2 | Coding | WT, Emb | — | WT |
| cxP10504 | C05D9.8 | 3′ | WT, Gro | — | WT |
| cxP10603 | F58G1.5 | Coding | Him | — | WT |
| cxP10605 | Y71G12B.1a | Coding | Emb, Prl, Unc | — | Emb, Prl |
| cxP10719 | ZK1151.1/vab-10 | Coding | WT, Emb, Lvl | Lva, Lvl, Prz | WT |
| cxP10796 | F32B5.8 | Coding | Emb | — | WT |
| cxP10880 | B0491.8/clc-2 | Coding | WT, Emb, Sck | Emb | WT |
DISCUSSION
Distribution
A critical point in transposon-mediated global mutagenesis is the ability of the transposon to hit most of the genome with a reasonable frequency. The main purpose of the pilot experiment described in this paper was to assay this point. The chromosome distribution reveals a relatively even distribution with no chromosomic regions devoid of insertions at the current resolution. Should it be confirmed by larger numbers, the relative under-representation of insertions on chromosome V, although statistically significant, is not striking. Remarkably, whereas Tc1 and Tc3 transposons of C.elegans are attracted by other mariner elements (L. Ségalat, unpublished results), Mos transposons in C.elegans are not. In a different dimension, the distribution of Mos insertions in genic versus intergenic regions shows that more than half of them are in or near genes, a proportion consistent with the C.elegans genome content. Within genes, there is positive bias towards introns, similar to the one previously observed for Tc elements (8). The driving force behind this bias of mariner elements for introns in C.elegans is still a matter for conjecture. With the exception of the rDNA locus, for genes of similar length there is no indication so far that the probability of being hit by a Mos transposon varies significantly.
Recovery
The recovery rate measures our ability to recover predicted insertions from the frozen samples. The observed recovery rate of 77% is somewhat low in the perspective of a large-scale project. This is probably due to the fact that numerous strains were frozen as a mixture of heterozygous and homozygous animals. In the future, the number of heterozygous strains can be reduced by propagating the strains a few generations after the insertions are produced. Since C.elegans is self-fertilizing, strains tend to become homozygous rapidly. We calculated that keeping the strains four generations before characterizing them would leave <20% of strains heterozygous for the insertion. Such a modification of the protocol should increase significantly the recovery rate compared to the current protocol.
Future prospects
In conclusion, this study shows that a _Mos_-based large-scale mutagenesis is a viable strategy to generate insertions in most C.elegans genes. Most of these insertions will probably be devoid of phenotype, but they can be readily used to generate deletions after remobilization of the transposon. The establishment of a large-scale collection of identified Mos insertions will therefore constitute a complementary resource to the existing C.elegans knockout consortium. Furthermore, if transposable element-mediated targeted gene replacement (16), a long sought-after technique in C.elegans, was achieved, a collection of transposon insertions would become an even more valuable resource.
Acknowledgments
ACKNOWLEDGEMENTS
The authors are grateful to J. Godet, J. Samarut, J.-A. Lepesant, M. Philippe and P. Couble for their decisive support for this project over the years. They also thank L. Duret and C. Biémont for stimulating discussions, T. Drynda for help with the website, T. Harris and L. Stein for incorporating the data into the Wormbase database, and J. Ewbank and F. Palladino for adive on the manuscript. This work was supported by a Centre National de la Recherche Scientifique (CNRS) grant, a French Ministry of Research grant, a Rhône-Alpes district grant and a European union (6th Framework program) grant (code NEMAGENTAG) to L.S.
REFERENCES
- 1.Anderson P. (1995) Mutagenesis. In Epstein,H.F. and Shakes,D.C. (eds), Caenorhabditis elegans. Academic Press, San Diego, CA, pp. 31–58. [Google Scholar]
- 2.Plasterk R. and van Luenen,H. (1997) Transposons. In Riddle,D., Blumenthal,T., Meyer,B. and Priess,J. (eds), Caenorhabditis elegans II. Cold Spring Harbor Laboratory Press, Cold Spring Harbor, NY, pp. 97–116. [PubMed] [Google Scholar]
- 3.The C.elegans Consortium (1998) Genome sequence of the nematode C. elegans: a platform for investigating biology. Science, 282, 2012–2017. [DOI] [PubMed] [Google Scholar]
- 4.Vidan S. and Snyder,M. (2001) Large-scale mutagenesis: yeast genetics in the genome era. Curr. Opin. Biotechnol., 12, 28–34. [DOI] [PubMed] [Google Scholar]
- 5.Liao G., Rehm,E. and Rubin,G. (2000) Insertion site preferences of the P transposable element in Drosophila melanogaster. Proc. Natl Acad. Sci. USA, 97, 3347–3351. [DOI] [PMC free article] [PubMed] [Google Scholar]
- 6.Zambrowicz B., Friedrich,G., Buxton,E., Lilleberg,S., Person,C. and Sands,A. (1998) Disruption and sequence identification of 2000 genes in mouse embryonic stem cells. Nature, 392, 608–611. [DOI] [PubMed] [Google Scholar]
- 7.Barstead R. (1999) Reverse genetics. In Hope,I. (ed.), C.elegans: A Practical Approach. Oxford University Press, NY, pp. 97–118. [Google Scholar]
- 8.Martin E., Laloux,H., Couette,G., Alvarez,T., Bessou,C., Sookhareea,S., Labouesse,M. and Ségalat,L. (2002) Identification of 1088 new transposon insertions of C. elegans, a pilot study towards large-scale screens. Genetics, 162, 521–524. [DOI] [PMC free article] [PubMed] [Google Scholar]
- 9.Bessereau J., Wright,A., Williams,D., Schuske,K., Davis,M. and Jorgensen,E. (2001) Mobilization of a Drosophila transposon in the Caenorhabditis elegans germ line. Nature, 413, 70–74. [DOI] [PubMed] [Google Scholar]
- 10.Wood W. B. (1988) The nematode Caenorhabditis elegans. Cold Spring Harbor Laboratory Press. Cold Spring Harbor, NY. [Google Scholar]
- 11.Williams B., Schrank,B., Huynh,C., Shownkeen,R. and Waterston,R. (1992) A genetic mapping system in Caenorhabditis elegans based on polymorphic sequence-tagged sites. Genetics, 131, 609–624. [DOI] [PMC free article] [PubMed] [Google Scholar]
- 12.Vigdal T., Kaufman,C., Izsvak,Z., Voytas,D. and Ivics,Z. (2002) Common physical properties of DNA affecting target site selection of sleeping beauty and other Tc1/mariner transposable elements. J. Mol. Biol., 323, 441–452. [DOI] [PubMed] [Google Scholar]
- 13.Preclin V., Martin,E. and Segalat,L. (2003) Target sequences of Tc1, Tc3 and Tc5 transposons of Caenorhabditis elegans. Genet Res., 82, 85–88. [DOI] [PubMed] [Google Scholar]
- 14.Carlson C., Dupuy,A., Fritz,S., Roberg-Perez,K., Fletcher,C. and Largaespada,D. (2003) Transposon mutagenesis of the mouse germline. Genetics, 165, 243–256. [DOI] [PMC free article] [PubMed] [Google Scholar]
- 15.Hill A., Hunter,C., Tsung,B., Tucker-Kellogg,G. and Brown,E. (2000) Genomic analysis of gene expression in C. elegans. Science, 290, 809–812. [DOI] [PubMed] [Google Scholar]
- 16.Gloor G., Nassif,N., Johnson-Schlitz,D., Preston,C. and Engels,W. (1991) Targeted gene replacement in Drosophila via P element-induced gap repair. Science, 253, 1110–1117. [DOI] [PubMed] [Google Scholar]