Scaffolding bacterial genomes and probing host-virus interactions in gut microbiome by proximity ligation (chromosome capture) assay (original) (raw)
Two proximity ligation approaches are used to probe the gut’s phage-bacteria infection network using Meta3C and GRAAL scaffolding.
Keywords: metagenomics, mouse, phage, proximity ligation, Hi-C, meta3C, contact genomics, virome, mammal, genome assembly
Abstract
The biochemical activities of microbial communities, or microbiomes, are essential parts of environmental and animal ecosystems. The dynamics, balance, and effects of these communities are strongly influenced by phages present in the population. Being able to characterize bacterium-phage relationships is therefore essential to investigate these ecosystems to the full extent of their complexity. However, this task is currently limited by (i) the ability to characterize complete bacterial and viral genomes from a complex mix of species and (ii) the difficulty to assign phage sequences to their bacterial hosts. We show that both limitations can be circumvented using meta3C, an experimental and computational approach that exploits the physical contacts between DNA molecules to infer their proximity. In a single experiment, dozens of bacterial and phage genomes present in a complex mouse gut microbiota were assembled and scaffolded de novo. The phage genomes were then assigned to their putative bacterial hosts according to the physical contacts between the different DNA molecules, opening new perspectives for a comprehensive picture of the genomic structure of the gut flora. Therefore, this work holds far-reaching implications for human health studies aiming to bridge the virome to the microbiome.
INTRODUCTION
High-throughput DNA sequencing technologies developed over the past decade have set a milestone for the analysis of microbial communities in natural environments. Metagenomic approaches provide an overview of the diversity of DNA or RNA molecules directly isolated from natural mixes of species (1–4). Large-scale exploratory studies have revealed that complex communities are ubiquitous in all environments (5, 6), where they hold diverse and important roles, including contributions to animal and plant metabolisms (7–10). These developments have greatly accelerated the discovery of new bacteria (3, 4, 11–14), plasmids (15, 16), and virus/phages (17–20). However, some limitations persist despite constant technological improvements. Notably, the difficulty to assemble complete genomes and full episome sequences (21) and the inability to characterize the interactions between those different molecules impair the full resolution of the genomic structure of these populations. For instance, bacteria-phage relationships remain poorly characterized, despite the impact of phages on the balance of microbial communities (22, 23). The presence of phages, which are considered the most abundant and diverse biological entities on earth (24), in these ecosystems, has far-reaching consequences beyond particular pairwise interactions (25), influencing everything from bacterial virulence (26) to cell physiology (27). However, the characterization of a phage genome from sequencing data is usually not sufficient to identify its bacterial host(s). As a result, understanding the interplay between phages and the overall microbial community remains limited or out of reach (28). Therefore, new approaches alleviating these limitations are needed to better understand phage-bacteria relationships in complex ecosystems (29).
One way to address this challenge is to exploit the physical collisions experienced by DNA segments along one and/or between multiple DNA molecules. The frequencies of cis contacts between pairs of loci within a chromosome are higher than the trans contacts between segments located in different chromosomes. These contacts generate a predictive three-dimensional (3D) signature that can be exploited to improve chromosome scaffolding (21, 30, 31). Recent studies suggest that metagenomic analyses could also benefit from these approaches (32–35). A blind clustering analysis of the contacts experienced by DNA molecules isolated from controlled or seminatural mixes of microorganisms showed that most contacts involve pairs of DNA regions coming from the same genome (34). These contacts were quantified using meta3C (34), a derivative of the chromosome conformation capture method (3C; Materials and Methods) (36). Briefly, DNA molecules within a mixture of microbial species are frozen in space with a cross-linking agent. The DNA trapped within cross-linked protein complexes is then digested with a restriction enzyme. The resulting restriction fragments (RFs) are then religated together. Ligation events will mostly involve RFs that were in close vicinity in space before the fixation step and, therefore, that were very likely to share the same cell compartment. The quantification of these events is done using paired-end (PE) sequencing. Meta3C reads can be used to perform a de novo assembly that will generate contigs reflecting the genetic content of the community, as well as the clustering and scaffolding steps that will provide a glimpse of the genomic structure of the population [reviewed by Marbouty and Koszul (35)]. Fortuitous hints have suggested that chromosomes and other kinds of DNA molecules, such as plasmids (34), could be identified from the meta3C data and assigned to their host cells. However, no large-scale exploration of the genomic structure of a truly natural complex community had been undertaken so far using this approach.
Here, we investigated the ability of meta3C to bring new insights into the genomic structure of a natural and complex mammalian gut microbiota, including its phage-host interactions. Starting with a single, unknown natural complex microbial ecosystem, a computational workflow was designed to allow the de novo assembly and scaffolding of dozens of bacterial genome scaffolds. Moreover, the pipeline also leads to the assembly of large bacteriophage sequences, including a large genome phylogenetically close to the phiKZ phage family (37, 38) and never fully characterized before in the mammalian gut (39). Finally, these phage sequences were assigned to bacterial chromosome scaffold(s) based on their physical contact frequencies, providing information about the coexistence of bacteriophages within multiple species and/or strains. These results show that DNA collisions allow the tracking of mobile genetic elements of interest within complex microbial populations, opening the way to high-resolution monitoring of horizontal transfer events within populations and dynamic studies of microbiota genomic structure.
RESULTS AND DISCUSSION
Applying meta3C to a mice gut microbiota
To investigate the genomic structure of the mouse gut microbiome, a single feces sample from a healthy control male mouse (C57BL/6) from the Institut Pasteur animal facility was collected, split, and processed through two meta3C protocols that solely differed by the restriction enzyme being used: either Hpa II [C′CGG] or Mlu CI [′AATT] (Fig. 1A and Materials and Methods). As discussed before (34, 35), using enzymes differing in the GC content of the corresponding restriction sites (RSs) is expected to improve contact coverage for GC- and AT-rich genomes. The Hpa II and Mlu CI libraries were sequenced on an Illumina NextSeq machine [2 × 75 base pairs (bp)], with 114 and 71 million PE reads recovered, respectively. Reads from both libraries were pooled and assembled into contigs using the IDBA-UD program (40), resulting in 374,363 contigs (cumulated size, 580 Mb; N50, 3783 bp; maximum size, 490 kb; mean size, 1402 bp). Translated coding sequences resulting from this assembly [594,648 open reading frames (ORFs) detected—MetaGeneMark; (41)] were analyzed at the taxon and functional levels using the metagenomics RAST (MG-RAST) pipeline (Materials and Methods) (42). As expected from a gut metagenome, the major clades in the sample were Firmicutes (70%) and Bacteroidetes (15%) (Fig. 1B) (43). An analysis of DNA sequences using the Kraken program (44) (Materials and Methods) confirmed these results with, also as expected, ~80% of the sequences not attributed to a specific genome (43). Coding sequences were then annotated for essential genes, phages, and conjugative elements using repository databases (14, 45, 46), and the annotated contigs were then split into 1-kb fragments. This step has two objectives: first, to limit the impact of misassembly errors (such as chimeric contigs) arising during the assembly step, and second, to normalize the contact signal with respect to the influence of contig size on their representation during the segmentation of the network. Contigs under 500 bp were discarded, leading to a global set of 553,310 contigs (513 Mb total). An internal control for the network segmentation step was implemented by introducing meta3C reads of a chosen mix of three bacterial species (Materials and Methods and fig. S1A), resulting in a final set of 569,146 contigs (526 Mb total). The contact network was then generated by aligning meta3C PE reads against the contigs. Whereas in most (75%) instances both reads of a pair mapped within the same contig, in 46 million instances each read of a pair aligned along a different contig, resulting in a pair of contigs bridged by at least one contact. Contact frequencies between contigs were then normalized by the read coverage of the contigs (Materials and Methods), resulting in a large network of 569,146 nodes and 20,557,427 weighted edges. Contigs showing enriched contacts are likely to correspond to DNA molecules sharing the same cell compartment (34).
Fig. 1. Meta3C analysis of the mice gut microbiome.
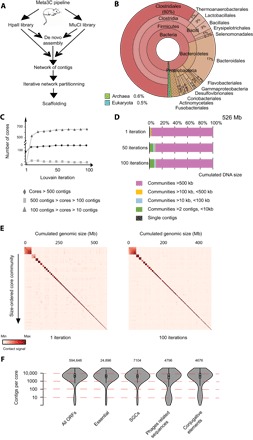
(A) Flowchart representing the computational analysis steps of a meta3C experiment. First, the reads from two sequenced meta3C libraries are assembled de novo into contigs. The meta3C contact information from both data sets is then used to generate a contact network between all contigs. The Louvain algorithm is then applied iteratively to segment the global network into CCs. (B) MG-RAST taxonomy analysis of the contigs generated from the de novo assembly step. (C) Evolution of the distribution of CC sizes over 100 Louvain iterations (x axis). Triangles, CCs with 10 to 99 contigs; squares, CCs with 100 to 499 contigs; diamonds, CCs with 500 contigs or more. (D) Stacked bar chart of the distribution of CC sizes for 1, 50, or 100 Louvain iterations. Categories of CCs are indicated under the histograms. (E) Contact maps of the 100 largest CCs recovered after a single and 100 Louvain iterations (1 vector = 200 kb). The x and y axes are labeled with the cumulated DNA size and the index of the community, respectively. (F) Vioplot of different functional contig annotations as a function of their CC size (in number of contigs) (y axis = log scale). The number of annotated elements is indicated for each category.
Iterative segmentation of the meta3C contact map into core communities
The global network was then segmented into communities (in a network analysis sense) using the Louvain clustering algorithm (Materials and Methods) (47). A community is a subnetwork, or partition, of contigs having enriched contacts with each other as opposed to the other contigs. After one clustering step, 515 Mb (>98%) of the total DNA was spread among 93 communities ranging in size from 500 to 61,000 contigs. By design, the Louvain algorithm cannot attribute a node to multiple communities and is nondeterministic: When a segmentation is performed twice on the same network, some nodes will be assigned to distinct partitions if these communities share the elements represented by these nodes. We reasoned that this inherent property could be exploited to strengthen the analysis and identify DNA sequences shared by two or more large communities. To do so, we performed the segmentation independently 100 times, delineating core communities (CCs) made of contigs that systematically cluster together for each of these iterations (Fig. 1C, fig. S2, and Materials and Methods). The distribution of the sizes of CCs recovered after iterative segmentation was computed, showing that the number of CCs larger than 500 contigs (that is, of approximately 500 kb or more) quickly converges toward 124 clusters encompassing ~90% of the total DNA (Fig. 1, C and D, and table S1). The iteration procedure also led to a reduction of the contact background between communities of contigs, suggesting a better resolution of the network (Fig. 1E). The control contigs containing three bacterial species were segmented into three well-defined CCs (black triangles in fig. S1B), confirming that the Louvain iterative procedure conveniently segregates genomes from the meta3C network. The presence of very large CCs containing more than 10,000 contigs nevertheless suggests that some CCs encompass more than one genome of closely related species, potentially due to the presence of numerous shared sequences (below). Finally, the influence of the choice of the restriction enzyme on the contig representation is made clear when the contact map is binned into a fixed number of RFs for each enzyme, illustrating the interest of combining two different restriction enzymes to cover both AT- and GC-rich sequences (fig. S1C).
Characterization of meta3C CCs
To investigate the genetic nature of CCs, we computed gene ontology distribution based on contig annotation for different classes of genetic elements (Fig. 1F). Contigs carrying essential genes (n = 24,896) (48) or lineage-specific markers [single genes copy (SGCs), n = 7104] (49), all specific of bacterial chromosomes, were predominantly found in the larger CCs. On the other hand, contigs carrying genes related to conjugative elements (n = 4676) (50) and phages (n = 4796) (20) were significantly enriched in small CCs as opposed to the previous categories. This analysis indicates that large CCs contain contigs of sequences belonging to bacterial chromosomes (table S1) and mobile elements (table S2), whereas small CCs represent mostly independent episomes or mobile elements, such as plasmids and phages (table S3).
Metagenomic data are often analyzed in light of covariance analyses of genetic elements over multiple samples (14, 43, 48). These approaches have led to the characterization of co-abundance groups of genes (CAGs) (14, 43), which are clusters of genes whose sequencing coverage covaries within the samples. Among CAGs, groups containing more than 700 coding sequences have been dubbed metagenomic species (MGS). It was suggested that MGS clusters represent species-specific groups of genes. To compare both approaches, meta3C reads were aligned against the gene catalog of mouse microbiota MGS (43). Genes were then clustered, either through their MGS index or through the Louvain iterative procedure, and contact maps of the 100 largest MGS and meta3C CCs were generated (fig. S2). A strong diagonal revealed important contact signal within MGS, confirming that, to a large extent, MGS do group together DNA molecules belonging to the same cellular compartment, thus the same species. This map also immediately pointed at MGS exhibiting potent physical contacts with each other, strongly suggesting that these groups of sequences share at least one cellular compartment in the population and hence belong to the same species. On the other hand, meta3C CCs hardly exhibit any contacts between each other, as expected if these CCs correspond to phased genomic sequences of discrete species. A comparison of both methods reveals that around half of the genes present in a given MGS are found in a CC, a difference that may result from the fact that MGS are computed over more than a hundred samples, whereas CCs are generated with a single sample. Therefore, the two approaches complement each other for well-studied ecosystems for which many samples are already available.
De novo assembly and scaffolding of bacterial genomes
The content of large CCs was then investigated qualitatively. First, contigs from each of the 121 CCs encompassing more than 500 contigs (excluding the 3 control CCs) were used as an index to align all raw meta3C reads using Bowtie2 (mapping parameters: -local -sensitive, ambiguous matches allowed -parameters a-; Fig. 2A and Materials and Methods). When at least one member of a read pair mapped onto one of these contigs, both sequences were retained. All PE reads with a good quality score (Materials and Methods) recovered for each CC were then assembled de novo with IDBA-UD to generate a new set of contigs (no precorrection option, default parameters). For each final assembly above 500 kb, all contigs above 500 bp were retrieved. The quality of bacterial genome assemblies can be assessed by looking for the presence of a standardized set of marker genes (51). The pools of contigs generated for each CC were therefore screened using the CheckM pipeline for these markers (49). Most assemblies had a marker gene content typical of what is expected from a single bacterial genome, although some of the largest communities contained multiple copies of marker genes, suggesting that they contained more than one genome (see below).
Fig. 2. De novo scaffolding of bacterial genomes from large CCs.
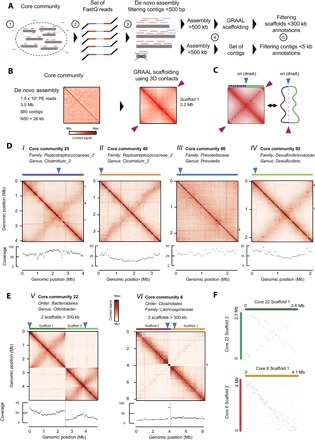
(A) Pipeline describing the computational processing of CCs. Contigs pooled together within a CC are used to build a genome index (step 1). All PE reads from meta3C libraries are aligned against this index (step 2). If one read of a pair maps onto these contigs, then both reads are retained for the de novo assembly using IDBA-UD (step 3). If the cumulated size of the newly assembled contigs of 5 kb or more reaches at least 500 kb, then they are processed with the GRAAL scaffolding program (step 4). For each CC, the resulting scaffolds and/or contigs are then annotated for taxonomy or the presence of phage sequences (step 5). (B) Example of CC63: The 3264 newly assembled contigs [step 2 in (A)] are processed by GRAAL [step 4 in (A)]. Left: Contact map of the newly assembled contigs. Right: Contact map of the 3.2-Mb scaffold obtained after GRAAL processing. Pink triangles point at the circularization signal in the map, consistent with a bacterial circular chromosome. (C) Schematic representation of the typical primary and secondary features found on a bacterial contact map (left), alongside a diagram of the corresponding chromosome organization (right). Beside the circularization signal (purple triangles), a secondary diagonal is often found (dotted black lines) as a result of contacts between the left (violet) and right (green) replichores. The secondary diagonal crosses the main diagonal at the origin of replication (blue triangles). (D) Contact maps (10-kb bins) of the largest (>500 kb) GRAAL scaffolds retrieved in four CCs, displaying patterns characteristic of bacterial chromosomes [with (i, ii, and iv) or without (iii) a secondary diagonal]. Taxonomic annotation, distribution of read coverage, and position of dnaA (blue triangles) are indicated for each scaffold. The read coverage distribution can be used to infer the growth state of the corresponding bacterium. When present, putative prophage loci are represented on the right vertical axis with green (complete prophage) or red (incomplete prophage) rectangles. (E) Same analysis as in (D) but for two CCs each containing two large and distinct scaffolds [core 22 (v); core 6 (vi)]. Scaffold 2 from core 6 (vi) exhibits a discrete, more covered (see red rectangle on the coverage distribution) region annotated as an incomplete prophage. (F) Comparison of the positions of orthologous genes in the scaffolds obtained in (E). Orthologous genes are displayed as dots based on their position along scaffolds 1 and 2 represented in the x and y axes, respectively (top, core 22; bottom, core 6). The conservation of synteny between the two scaffolds is apparent from the higher density of orthologous genes (dots) in the diagonal of the graph.
The contigs from each of the 121 CCs were then scaffolded using the program GRAAL (Fig. 2B) (30). Briefly, GRAAL exploits contacts between DNA regions to assess for their colinearity. The program progresses by successive iterations to converge toward the 1D genome structure that best accounts for the 3D data. For instance, the 3264 contigs present in CC #63 were reordered by GRAAL into a large, 3.2-Mb scaffold (Fig. 2B). These scaffolds can then be compared to chromosomal contact maps of single species, which have been described before and are schematically represented in Fig. 2C (34, 52). These maps display typical patterns. First, a main diagonal reflects enriched local contacts all along the chromosome, a consequence of neighboring DNA regions interacting more often together than distant ones. Second, a strong signal in each corner of the map indicates a circular chromosome (pink arrowheads in Fig. 2C). Finally, secondary features that are specific to bacterial chromosome metabolism are also sometimes visible, notably a secondary diagonal (Fig. 2C) (53). This feature reflects the cohesion of replichores initiated at the origin of replication and has been described in Caulobacter crescentus (52), Bacillus subtilis (53), and Vibrio cholerae (54). It is present in other species as well but not in Escherichia coli (35). GRAAL was run for 100 iterations on each newly assembled CC (Fig. 2, D and E; fig. S4; table S1; and Materials and Methods). Two-thirds (80) of the 121 assemblies resulted in a marked increase in the N50 of the sequences present in the corresponding CC, with the generation of one (or more) large, megabase-scaled scaffold(s). The resulting contact maps of these large scaffolds were inspected for any potential remaining inconsistencies left out by the probabilistic nature of GRAAL’s algorithm (fig. S5 and Materials and Methods). The features displayed by these contact maps were often highly consistent with published contact maps of bacterial genomes. Notably, the continuous main diagonal and the presence of a circularization signal suggest that no large DNA regions are missing in many of the scaffolds. In addition, a secondary diagonal was often present on some of the maps (Fig. 2, i, ii, iv, and v; see also fig. S4). Finally, dnaA homologs were often identified at the crossing between this secondary and the main diagonal (Fig. 2, i, ii, iv, and v). dnaA is found at the origin of replication (ori) in most bacteria, and its presence at the edge of the secondary diagonal is highly consistent with recent analyses describing the role of the replication origin during the cell cycle of B. subtilis in chromosome folding (53, 55). Moreover, the position of these putative ori sites correlates with the highest coverage in PE reads of the scaffold (Fig. 2, i, ii, iv, and v), suggesting that this procedure also allows one to infer the growth status of these species. The recovered scaffolds and the assembled large CCs were again analyzed through the CheckM pipeline (table S1), revealing a clear improvement in the quality, with respect to both completeness and contamination level, of the recovered genomes. For instance, each of the two large scaffolds retrieved after processing CC #6 (Fig. 2E, v) shows a nearly complete bacterial gene catalog, pointing at the presence of two individual genomes belonging to the same clade. The global conservation of gene order between these two scaffolds (Fig. 2F) suggests that these two species are closely related, and therefore highlights the potential of the meta3C approach [see also CC #22 for another example; Fig. 2, E (vi) and F].
Annotation and analysis of prophages in bacterial genomes
The annotation of the large scaffolds, using the Phaster pipeline (56), also pointed at the presence of putative prophage sequences integrated within bacterial genome scaffolds (Fig. 2, D and E, small red and green rectangles on the right side of all matrices). Here, again, our recent work (53) proved convenient to interpret the corresponding contact maps (Fig. 3A). The prophages present within the B. subtilis genome appear in the contact map as discrete regions with peculiar contact patterns [fig. S6A; see Marbouty _et al._ (53) for discussion]. The SPβ prophage sequence is particularly apparent in the contact maps of exponentially growing cells. This prophage appears to get activated upon exposition of the cells to the rifampicin drug, as revealed by the increase in read coverage of the phage genome, resulting in a strong increase in 3C contact signal (fig. S6B) (53). In addition, enriched contacts between the extremities of the phage genome were also characterized, suggesting a possible circular form. The phage sequences encompassed within the genomic scaffolds retrieved after GRAAL processing display contact patterns reminiscent of these observations (see, for instance, CC #25; Fig. 3A). This observation suggests that the contact map patterns could be exploited to refine predictions from the Phaster pipeline and to help in the characterization of prophage sequences. For CC #25, the contact pattern and read coverage of the two prophage loci are consistent with a silent pattern (fig. S6A). On the contrary, one of the two scaffolds retrieved from CC #6 (Fig. 2E, vi; scaffold 2 in red) exhibits a peculiar locus, isolated from the rest of the scaffold, more covered and annotated as an incomplete prophage. The contact pattern and read coverage of this region are consistent with an active phage similar to B. subtilis SPβ in the presence of rifampicin (fig. S6B). More analyses will be needed to further validate the presence and activity of these phages in these bacteria, but this analysis nevertheless suggests the meta3C data point at silent and active prophages among complex communities. However, one must note that it remains unclear whether the approach has the ability to trap phage genomes present in phage particles outside the bacteria cellular compartment or if it traps virulent phages infecting and killing bacteria in a short amount of time; more experiments will be needed to answer these important questions.
Fig. 3. Analysis of phage-bacteria interactions.
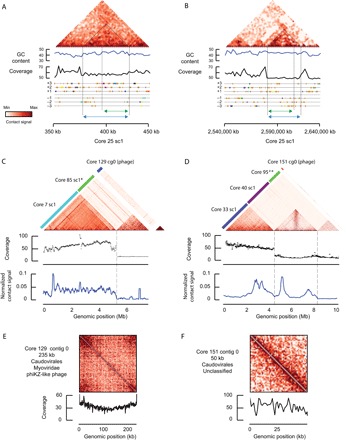
(A and B) Putative prophage sequences in bacterial scaffolds. Magnification of the main diagonal and annotations of the two genomic loci characterized as intact prophages by Phaster in the core 25 scaffold (green rectangles, Fig. 2D). GC content, read coverage distribution, and the predicted ORF annotations (six-frame translation) are indicated under each matrix. Orange genes encode for hypothetical proteins and are enriched in this genomic region. The peculiar contact signals displayed by prophages in contact matrices (see fig. S6) suggest that the border of the prophage locus predicted by Phaster (green double arrows) can be refined because of the meta3C data (dotted black lines and blue double arrows). (C and D) Representative contact maps between large independent phage contigs (cores 129 and 151) and bacterial scaffolds of interest either (i) display enriched contacts or (ii) present clustered regularly interspaced short palindromic repeats (CRISPR) spacer sequences also found in the phage sequence (scaffold labeled with an asterisk). The read coverage of the bacterial scaffolds and the normalized contact frequencies between the phage contigs and the bacterial scaffolds are plotted under the maps (black and blue graphs, respectively). “#” indicates a set of contigs not scaffolded by GRAAL. (E and F) Cis contact map and read coverage distribution for the candidate phage contigs from (C) and (D), respectively. A circularization signal appears on the large (235 kb) core 129 contig. The corresponding coverage also points at the possible multiplication of this genomic structure from a discrete position.
In some instances, the scaffolding step results in multiple scaffolds that do not seem to correspond to large, fully individualized bacterial chromosomes. These scaffolds sometimes display contact patterns consistent with the presence of small genomic entities (for instance, see the squares in the upper left corner of cores 11 and 14, contact maps in fig. S4; table S2 and data set S3), leaving room for unexpected or surprising results, such as the identification of new viruses or genetic elements (28). However, the exploration of this “dark matter” will require deeper analyses.
Phage assembly and analysis
The annotation of the contigs contained in the small CCs revealed an enrichment in phage sequences, suggesting that some of these pools of contigs correspond to viral genomes. To further investigate these communities, we performed a new round of assemblies (Fig. 2A) on these CCs (see Materials and Methods for details; no GRAAL scaffolding was performed at this stage). Contigs above 10 kb were annotated with a BLASTP search against two National Center for Biotechnology Information (NCBI) databases of viral sequences [Phage Orthologous Group (POG) and Viral databases; E < 10−4; Materials and Methods] (57). Forty-three contigs ranging from 10 to 235 kb displayed at least one significant hit against the POG database (table S3) and multiple hits against the Viral database (table S3). For instance, 11 putative encoded proteins from the 218 ORFs identified within the largest contig (235 kb, core129 contig0) presented a similarity with proteins from the POG database, including a genetic marker associated to the phiKZ giant phage family known to infect Pseudomonas aeruginosa (POG 3254) (table S3 and fig. S7) (37, 38, 58). This contig’s genomic organization is typical of phage genomes, with ORFs that are largely co-oriented and organized in sizable blocks encoded on the same strand (fig. S7) (28, 59). The contact map of this contig displays a circularization signal, as well as a skewed read coverage, suggesting that bidirectional replication is taking place (Fig. 3E). This large contig was not present in its full length in the first assembly (95% of the sequence was contained within three large contigs), confirming the interest of our approach to assemble and scaffold metagenomes.
Phage-host interactions
As discussed above, assigning phages to their bacterial hosts remains a challenge in metagenomic studies. To see whether quantifying DNA collision events between the phage and the host genome could alleviate this limitation, we computed the normalized contacts between the phiKZ-like contig and the 140 bacterial genome scaffolds (that is, from large CCs). A single bacterial scaffold belonging to the Clostridiales phylum (core7 scaffold1) presented enriched contacts with this long contig (Fig. 3C). This result suggests that this phage genome has frequent contacts with the genome of this bacterial species; hence, this bacterial species hosts the phage. We performed the same analysis of several other putative phage contigs (Fig. 3, D and F, and fig. S8). Notably, we identified a contig (core151 contig0) harboring typical markers from the Caudovirales family and exhibiting several enriched contacts with reconstructed bacterial genomes (Fig. 3D). A refined analysis of those contacts indicates the existence of hot interaction spots of this contig with different loci and points to possible multiple integration sites into the bacterial scaffolds (core33 scaffold1, Clostridiales and core40 scaffold1, Clostridiales). In parallel, we searched for CRISPR spacers found in the different bacterial scaffolds that would present a match on the candidate phage contigs (fig. S9) (23, 28, 29). We identified 1575 putative spacers and 55 significant blast matches in our candidate contigs (table S4). With only one exception, none of the bacterial scaffolds detected by this analysis displayed enriched contacts with the phage contigs (Fig. 3, C and D, and fig. S8, A and B; bacterial cores labeled with asterisks). For instance, a perfect match was found for a spacer present on the phiKZ-like contig and on the scaffold retrieved from CC #85, but no contacts between the two sequences were detected. One possible explanation is that this bacterium maintains this spacer in its genome as a defense against future infections and therefore contacts between the two genomes are very limited. CRISPR spacer–based predictions are known to detect high rates of false positives, especially when only one hit is detected between the host and its phage (29). Additional meta3C data will help to understand these observations and to provide new insights into the ecology of phages and bacteria in the gut.
To broaden the analysis, we studied the contacts between the 43 candidate phage contigs and all 140 bacterial CCs. A host-phage interaction was considered significant when it accounted for at least 10% of all contacts made by the phage sequence. All but three phage candidates displayed at least one, sometimes more, preferred bacterial scaffold(s). An “infection heatmap” was generated to represent the contacts between the phage genomes and the putative host genomes (47 potential hosts were detected), ordered according to their phylogenetic relationship (CheckM pipeline; table S1 and Fig. 4). The infection spectrum of phages in this bacterial community emerges from this representation. Boundaries between clades are consistent with previous studies (60). Overall, this first viral-host contact map illustrates the approach’s interest and enables further analyses of phage infection dynamics as well as mobile element propagation in complex communities.
Fig. 4. Overview of phage-bacteria interactions through meta3C.
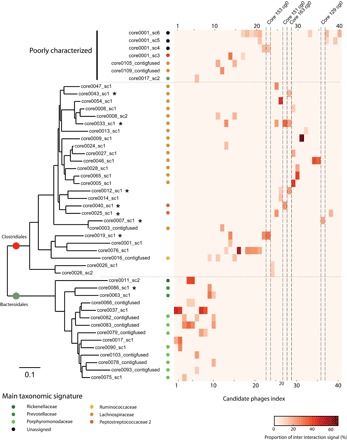
Normalized contact map between the 40 candidate phage contigs in the x axis (obtained from the reassembly of small CCs) and the 47 bacterial genome scaffolds/assemblies in the y axis. An interaction had to represent at least 10% of the total contacts made by a candidate phage with a bacterial genome scaffold/assembly to be retained. Bacterial genome scaffolds/assemblies were ordered according to their phylogeny relationships (tree on the left of the map). Main taxonomic annotations based on genetic marker analysis are indicated with colored circles next to each predicted bacterial genome. The color scale reflects the contact frequencies, in % of total contacts made by the phage sequence. The stars points at CCs of bacterial genome scaffolds emphasized in Figs. 2 and 3 and fig. S8. The phage contigs outlined along the x axis correspond to those described in Fig. 3 and fig. S8.
CONCLUSION
Overall, the first meta3C experiment performed on a truly complex natural microbiome highlights the power of contact genomics/proximity ligation approaches to study phages and bacterial interactions (21). It is worth noting again that this approach does not require multiple experiments: A single meta3C library generated with a single restriction enzyme will bring an important amount of information. Therefore, meta3C could significantly contribute to the full characterization of the genomic structure of complex environmental microbial communities and the analysis of their dynamic changes. The experiment so far does not provide an exhaustive overview of the phage population, mostly because virulent phages that kill bacteria quickly were not sought for. In the future, the present experiment could be backed by the sequencing and genomic analyses of the population of viral particles. That way, one would expect to be able to confront viral particle genomes and phage genomes in contact with bacterial chromosomes, to reach a truly exhaustive characterization of the entire population. Performed over time, the genomes of the different species within a population and the dynamics of mobile elements within the population could be generated, providing valuable insights into the adaptation/evolution of the species present in the ecosystem.
MATERIALS AND METHODS
Generation of meta3C libraries
Feces from a C57BL/6 male mouse were recovered and immediately suspended in 30 ml of 1× tris-EDTA buffer supplemented with 3% of fresh formaldehyde. Fixation proceeded for 1 hour under gentle agitation. Ten milliliters of glycine (2.5 M) was added to the tube, and the quenching was performed for 20 min. The pellet was recovered by centrifugation and stored at −80°C until use. Meta3C libraries were then prepared and sequenced (2 × 75 bp, Illumina NextSeq, 10 first bases as index), as described by Marbouty et al. (34).
Metagenome assembly
Raw reads were filtered using the QIIME software, as described by Bokulich et al. (61). A de novo assembly was generated using IDBA-UD v1.0.9 (40) with default parameters but without any precorrection option (raw reads, 193 million PE reads; filtered reads, 169 million PE reads) (resulting assembly, 374,363 contigs; cumulated size, 580 Mb; N50, 3783 bp; maximum size, 490 kb; mean size, 1402 bp). After filtration of contigs of sizes under 500 bp, the total assembly was 521 Mb.
Metagenome analysis
Contigs from the metagenomic assembly were analyzed with the MG-RAST and Kraken pipelines. The MG-RAST server (42) allowed automated annotations of complete or draft microbial genomes and provided information on phylogenetic and functional classification of the contigs. Kraken (44) is a program that assigns taxonomic labels to short DNA sequences using exact _k_-mer alignments.
Generation of internal control
Concurrently with the mice gut meta3C process, 4 million PE reads from a previous meta3C experiment performed onto a controlled mix of three bacteria (E. coli, V. cholera, and B. subtilis) (34) were used to perform an assembly using the same parameters as above. The resulting contigs were added to the final set of 553,310 contigs from the mice gut assembly, providing a set of 569,146 contigs corresponding to an assembly of 526 Mb.
Identification of CCs
An approach based on the Louvain algorithm (v0.3) (47) was used to pool contigs into CCs (fig. S2). Before clustering, contigs were split into 1-kb chunks (without a sliding window). Again, contigs smaller than 500 bp were discarded at this stage (this process resulted in a small loss of 8 Mb of sequences, with a total assembly left of 513 Mb). The resulting 553,310 contigs covered ~90% of the initial assembly (569,146 contigs with the ones from the control experiment, corresponding to an assembly of 526 Mb). Raw reads (plus the 4 million PE reads of the control) were then independently realigned against this set of contigs using Bowtie2 (parameters: --very-sensitive-local) coupled with an iterative procedure, and no ambiguous matches were allowed (53). PE information was then included: Whereas two reads of a pair often mapped onto the same contig, 46 million contig pairs were nevertheless bridged by at least one pair of reads. For each pair of contigs, the weighted interaction was normalized by the square root of the product of their respective read coverages.
The Louvain algorithm was run 100 times independently. Its nondeterministic heuristics were exploited to weigh and improve the reliability and stability of the clustering. Each group of contigs that systematically clustered together over the 100 iterations defined a CC (fig. S2). Topologically, this means that the Jaccard distance between every contig index vector (that is, a vector whose components are the indices of the Louvain community to which the vector’s contig was assigned for that Louvain iteration) belonging to a single CC is 0.
Contig annotations
Putative coding sequences on the assembled contigs were determined using the MetaGeneMark v3.26 software (41) and annotated using BLASTP v2.2.30 and two protein databases (ftp://ftp.ncbi.nlm.nih.gov/pub/kristensen/extendedPOGs-10/blastdb/ and ftp://ftp.ncbi.nih.gov/refseq/release/viral/), as well as published hidden Markov models (HMM) [CONJscan (47) and MultiMetaGenome (48)] and the HMMER software (62). Positive hits (+1 positions) were then assigned to the processed contigs (500 bp to 1 kb). Sequences from contigs (>5 kb) recovered after the reassembly of small CCs were annotated using the same databases and HMM models. Among those sequences, the 43 contigs carrying at least one homolog contained in the POG database were considered to be a candidate phage contig (57).
Comparison with CAGs
A catalog of mice microbiota genes was retrieved from Xiao et al. (43) and used as a genome index to map the reads from the two meta3C libraries. Consistent with this work, approximately 60% of PE reads could be aligned unambiguously to this index. Genes were then clustered on the basis of either their CAG index (43) or their CC indexes. Contact matrices of the 100 largest groups for each category were then generated (contact scores were normalized by the coverage of each gene).
Assembly of CCs
Contigs from each CC were used as an index to align all meta3C reads with Bowtie2 (mapping parameters: -local -sensitive, ambiguous matches allowed -parameters a-). When at least one member of the PE reads mapped onto one of these indexes, both read sequences were retained. Raw PE sequences recovered for each CC were quality-filtered (see above) and then processed using IDBA-UD v1.0.9 (same parameters as above) to generate a de novo assembly. For each CC, if the cumulated assembly size was larger than 500 kb, then all contigs above 500 bp were retrieved and processed by the scaffolding program GRAAL (30). For assemblies smaller than 500 kb, which, for instance, can represent a poorly assembled chromosome because of low coverage, the resulting contigs were directly annotated (see above).
GRAAL scaffolding
GRAAL was run for 100 iterations on the set of contigs (>500 bp) present in a given CC, as described by Marie-Nelly et al. (30). Briefly, the algorithm fitted the contact data onto a classic DNA polymer model (63) and then altered the relative positions and orientations of pairs of DNA sequences to gradually converge toward the most likely 1D genome according to the said model. The model was then readjusted to better fit the new data, and a new iteration began. The duplication mode described by Marie-Nelly et al. was not activated. Table S1 summarizes the outcome of this scaffolding step and the generation of large (>500 kb) scaffolds exhibiting the properties of bacterial genomes. The contact signal generated by some of these idiosyncratic properties, such as circularity or the presence of a secondary diagonal, was not predicted by GRAAL’s general polymer model. It can sometimes induce scaffolding errors (such as flips of large blocks) readily visible because of the incongruous signal they generate in the contact map of the scaffold (see Marie-Nelly et al. for more examples). Hence, manual corrections were added. These are mainly simple modifications of the same nature as GRAAL’s (that is, inversions and transpositions) that alleviate incongruities in a self-evident way on the contact map [fig. S5 shows how two modifications (one inversion and one transposition) alleviate all incongruities from a GRAAL scaffold].
Genome completion analysis
The scaffolds generated by GRAAL were analyzed using CheckM (49). This program assesses the quality of a genome assembly by checking for the presence of lineage-specific gene markers. This pipeline was also used to build phylogenetic trees and assign taxonomy annotation to the CCs and scaffolds retrieved. Scaffolds/assemblies with less than 10 characterized genetic markers were removed from the phylogenetic tree construction.
Bacterial genome comparison
Scaffolds ranging from CC #6 to CC #22 were annotated and compared using RAST v2.0 (http://rast.nmpdr.org/) (64).
Genome annotations
Bacterial scaffolds obtained after GRAAL processing were screened for prophage sequences using the Phaster software (56). The putative coding sequences of the phiKZ-like genome (core129 contig0) were annotated using BLASTP v2.2.30 and the NCBI nonredundant RefSeq protein database.
Phage-host prediction through CRISPR spacer analysis
The pilecr v1.06 program was used to screen the different assembled bacterial genomes and to identify 1575 CRSIPR spacers. The candidate phage contigs were then screened for the presence of these spacers using BLASTN v2.2.30 with short query parameters (28, 29). Hits with E values lower than 0.1 were retained and are displayed in fig. S9 and table S4.
Supplementary Material
http://advances.sciencemag.org/cgi/content/full/3/2/e1602105/DC1
Acknowledgments
We thank M. de Paepe and E. Rocha for fruitful discussions. We also thank J. Mozziconacci for helpful suggestions, J.-F. Flot for performing the original IDBA-UD assembly and Kraken analysis, and T. Pedron for providing us the mouse samples. Funding: This research was supported by funding from the European Research Council (ERC) under the 7th Framework Program (FP7/2007-2013)/ERC grant agreement 260822 (to R.K.). Author contributions: M.M. and R.K. conceived the analysis. M.M. performed the experiments. M.M., L.B., and A.C. performed the analysis, and M.M. and R.K. interpreted the results. M.M. and R.K. wrote the manuscript. Competing interests: The GRAAL program is owned by Institut Pasteur. The entire program and its full source code are freely available online for noncommercial purposes, but commercial usage requires a specific license. R.K., M.M., L.B., and A.C. have a patent application, PCT/EP2015/064286, submitted 12/30/2015, related to the described work through Institut Pasteur; the publication number is WO2015197711 A1. Data and materials availability: All data needed to evaluate the conclusions in the paper are present in the paper and/or the Supplementary Materials. Additional data related to this paper may be requested from the authors. Raw sequences are accessible on Sequence Read Archive database through the following accession number: SRX1434905.
SUPPLEMENTARY MATERIALS
Supplementary material for this article is available at http://advances.sciencemag.org/cgi/content/full/3/2/e1602105/DC1
fig. S1. Generation of raw CCs.
fig. S2. Iterative Louvain procedure and characterization of CCs.
fig. S3. Comparison of CAGs and meta3C approaches.
fig. S4. Scaffolding of dozens of bacterial chromosomes.
fig. S5. Example of post-GRAAL scaffold correction.
fig. S6. Structural behavior of phage SPβ in B. subtilis genome.
fig. S7. Schematic representation of the phiKZ-like genome.
fig. S8. Interactions of phages with bacterial genomes.
fig. S9. CRISPR spacers’ blast output.
table S1. Description of the 140 largest genomic structures (>500 kb) detected in the mice gut microbiome and their assembly/scaffolding statistics.
table S2. Description of the 59 contigs corresponding to candidate phages hailing from the unscaffolded output of the GRAAL software.
table S3. Description of the 43 contigs hailing from the reassembly of small CCs and corresponding to candidate phages.
table S4. CRISPR spacers’ blast output (format #6).
data set S1. Contig data (contigs_id, contig_name, GC content, coverage, core_community_index, core_size).
data set S2. Normalized contig network (contig_1, contig_2, normalized interaction).
data set S3. This file contains all the GRAAL scaffolds larger than 300 kb (FASTA format).
data set S4. This file, in complement of data set S3, contains all the contigs not included in the scaffolds larger than 300 kb (FASTA format).
data set S5. This file contains all the CC assemblies (contigs >5 kb, FASTA format) that were not scaffolded by GRAAL because of their small size (cumulated size, <500 kb; see steps 4 and 5 in fig. S2).
REFERENCES AND NOTES
- 1.Handelsman J., Rondon M. R., Brady S. F., Clardy J., Goodman R. M., Molecular biological access to the chemistry of unknown soil microbes: A new frontier for natural products. Chem. Biol. 5, R245–R249 (1998). [DOI] [PubMed] [Google Scholar]
- 2.Hugenholtz P., Goebel B. M., Pace N. R., Impact of culture-independent studies on the emerging phylogenetic view of bacterial diversity. J. Bacteriol. 180, 4765–4774 (1998). [DOI] [PMC free article] [PubMed] [Google Scholar]
- 3.Qin J., Li R., Raes J., Arumugam M., Burgdorf K. S., Manichanh C., Nielsen T., Pons N., Levenez F., Yamada T., Mende D. R., Li J., Xu J., Li S., Li D., Cao J., Wang B., Liang H., Zheng H., Xie Y., Tap J., Lepage P., Bertalan M., Batto J.-M., Hansen T., Le Paslier D., Linneberg A., Nielsen H. B., Pelletier E., Renault P., Sicheritz-Ponten T., Turner K., Zhu H., Yu C., Li S., Jian M., Zhou Y., Li Y., Zhang X., Li S., Qin N., Yang H., Wang J., Brunak S., Doré J., Guarner F., Kristiansen K., Pedersen O., Parkhill J., Weissenbach J.; MetaHIT Consortium, Bork P., Ehrlich S. D., Wang J., A human gut microbial gene catalog established by metagenomic sequencing. Nature 464, 59–65 (2010). [DOI] [PMC free article] [PubMed] [Google Scholar]
- 4.Venter J. C., Remington K., Heidelberg J. F., Halpern A. L., Rusch D., Eisen J. A., Wu D., Paulsen I., Nelson K. E., Nelson W., Fouts D. E., Levy S., Knap A. H., Lomas M. W., Nealson K., White O., Peterson J., Hoffman J., Parsons R., Baden-Tillson H., Pfannkoch C., Rogers Y.-H., Smith H. O., Environmental genome shotgun sequencing of the Sargasso Sea. Science 304, 66–74 (2004). [DOI] [PubMed] [Google Scholar]
- 5.Pace N. R., A molecular view of microbial diversity and the biosphere. Science 276, 734–740 (1997). [DOI] [PubMed] [Google Scholar]
- 6.Partensky F., Hess W. R., Vaulot D., Prochlorococcus, a marine photosynthetic prokaryote of global significance. Microbiol. Mol. Biol. Rev. 63, 106–127 (1999). [DOI] [PMC free article] [PubMed] [Google Scholar]
- 7.Kau A. L., Ahern P. P., Griffin N. W., Goodman A. L., Gordon J. I., Human nutrition, the gut microbiome and the immune system. Nature 474, 327–336 (2011). [DOI] [PMC free article] [PubMed] [Google Scholar]
- 8.Cryan J. F., Dinan T. G., Mind-altering microorganisms: The impact of the gut microbiota on brain and behaviour. Nat. Rev. Neurosci. 13, 701–712 (2012). [DOI] [PubMed] [Google Scholar]
- 9.Philippot L., Raaijmakers J. M., Lemanceau P., van der Putten W. H., Going back to the roots: The microbial ecology of the rhizosphere. Nat. Rev. Microbiol. 11, 789–799 (2013). [DOI] [PubMed] [Google Scholar]
- 10.Yang J., Kloepper J. W., Ryu C.-M., Rhizosphere bacteria help plants tolerate abiotic stress. Trends Plant Sci. 14, 1–4 (2009). [DOI] [PubMed] [Google Scholar]
- 11.Hug L. A., Baker B. J., Anantharaman K., Brown C. T., Probst A. J., Castelle C. J., Butterfield C. N., Hernsdorf A. W., Amano Y., Ise K., Suzuki Y., Dudek N., Relman D. A., Finstad K. M., Amundson R., Thomas B. C., Banfield J. F., A new view of the tree of life. Nat. Microbiol. 1, 16048 (2016). [DOI] [PubMed] [Google Scholar]
- 12.Guermazi S., Daegelen P., Dauga C., Rivière D., Bouchez T., Godon J. J., Gyapay G., Sghir A., Pelletier E., Weissenbach J., Le Paslier D., Discovery and characterization of a new bacterial candidate division by an anaerobic sludge digester metagenomic approach. Environ. Microbiol. 10, 2111–2123 (2008). [DOI] [PMC free article] [PubMed] [Google Scholar]
- 13.Bork P., Bowler C., de Vargas C., Gorsky G., Karsenti E., Wincker P., Tara Oceans studies plankton at planetary scale. Science 348, 873 (2015). [DOI] [PubMed] [Google Scholar]
- 14.Nielsen H. B., Almeida M., Juncker A. S., Rasmussen S., Li J., Sunagawa S., Plichta D. R., Gautier L., Pedersen A. G., Chatelier E. L., Pelletier E., Bonde I., Nielsen T., Manichanh C., Arumugam M., Batto J.-M., Quintanilha dos Santos M. B., Blom N., Borruel N., Burgdorf K. S., Boumezbeur F., Casellas F., Doré J., Dworzynski P., Guarner F., Hansen T., Hildebrand F., Kaas R. S., Kennedy S., Kristiansen K., Kultima J. R., Léonard P., Levenez F., Lund O., Moumen B., Le Paslier D., Pons N., Pedersen O., Prifti E., Qin J., Raes J., Sørensen S., Tap J., Tims S., Ussery D. W., Yamada T.; MetaHIT Consortium, Renault P., Sicheritz-Ponten T., Bork P., Wang J., Brunak S., Ehrlich S. D., Identification and assembly of genomes and genetic elements in complex metagenomic samples without using reference genomes. Nat. Biotechnol. 32, 822–828 (2014). [DOI] [PubMed] [Google Scholar]
- 15.Schlüter A., Krause L., Szczepanowski R., Goesmann A., Pühler A., Genetic diversity and composition of a plasmid metagenome from a wastewater treatment plant. J. Biotechnol. 136, 65–76 (2008). [DOI] [PubMed] [Google Scholar]
- 16.Sentchilo V., Mayer A. P., Guy L., Miyazaki R., Tringe S. G., Barry K., Community-wide plasmid gene mobilization and selection. ISME J. 7, 1173–1186 (2013). [DOI] [PMC free article] [PubMed] [Google Scholar]
- 17.Ogilvie L. A., Jones B. V., The human gut virome: A multifaceted majority. Front. Microbiol. 6, 918 (2015). [DOI] [PMC free article] [PubMed] [Google Scholar]
- 18.Lim E. S., Zhou Y., Zhao G., Bauer I. K., Droit L., Ndao I. M., Warner B. B., Tarr P. I., Wang D., Holtz L. R., Early life dynamics of the human gut virome and bacterial microbiome in infants. Nat. Med. 21, 1228–1234 (2015). [DOI] [PMC free article] [PubMed] [Google Scholar]
- 19.Breitbart M., Salamon P., Andresen B., Mahaffy J. M., Segall A. M., Mead D., Azam F., Rohwer F., Genomic analysis of uncultured marine viral communities. Proc. Natl. Acad. Sci. U.S.A. 99, 14250–14255 (2002). [DOI] [PMC free article] [PubMed] [Google Scholar]
- 20.Kristensen D. M., Mushegian A. R., Dolja V. V., Koonin E. V., New dimensions of the virus world discovered through metagenomics. Trends Microbiol. 18, 11–19 (2010). [DOI] [PMC free article] [PubMed] [Google Scholar]
- 21.Flot J.-F., Marie-Nelly H., Koszul R., Contact genomics: Scaffolding and phasing (meta)genomes using chromosome 3D physical signatures. FEBS Lett. 589 (20 Pt. A), 2966–2974 (2015). [DOI] [PubMed] [Google Scholar]
- 22.Canchaya C., Fournous G., Chibani-Chennoufi S., Dillmann M. L., Brüssow H., Phage as agents of lateral gene transfer. Curr. Opin. Microbiol. 6, 417–424 (2003). [DOI] [PubMed] [Google Scholar]
- 23.Stern A., Mick E., Tirosh I., Sagy O., Sorek R., CRISPR targeting reveals a reservoir of common phages associated with the human gut microbiome. Genome Res. 22, 1985–1994 (2012). [DOI] [PMC free article] [PubMed] [Google Scholar]
- 24.Suttle C. A., Viruses in the sea. Nature 437, 356–361 (2005). [DOI] [PubMed] [Google Scholar]
- 25.Seed K. D., Yen M., Shapiro B. J., Hilaire I. J., Charles R. C., Teng J. E., Evolutionary consequences of intra-patient phage predation on microbial populations. eLife 3, e03497 (2014) [DOI] [PMC free article] [PubMed] [Google Scholar]
- 26.Davis B. M., Waldor M. K., Filamentous phages linked to virulence of Vibrio cholerae. Curr. Opin. Microbiol. 6, 35–42 (2003). [DOI] [PubMed] [Google Scholar]
- 27.Welkos S. L., Holmes R. K., Regulation of toxinogenesis in Corynebacterium diphtheriae. I. Mutations in bacteriophage β that alter the effects of iron on toxin production. J. Virol. 37, 936–945 (1981). [DOI] [PMC free article] [PubMed] [Google Scholar]
- 28.Dutilh B. E., Cassman N., McNair K., Sanchez S. E., Silva G. G. Z., Boling L., Barr J. J., Speth D. R., Seguritan V., Aziz R. K., Felts B., Dinsdale E. A., Mokili J. L., Edwards R. A., A highly abundant bacteriophage discovered in the unknown sequences of human faecal metagenomes. Nat. Commun. 5, 4498 (2014). [DOI] [PMC free article] [PubMed] [Google Scholar]
- 29.Edwards R. A., McNair K., Faust K., Raes J., Dutilh B. E., Computational approaches to predict bacteriophage–host relationships. FEMS Microbiol. Rev. 40, 258–272 (2015). [DOI] [PMC free article] [PubMed] [Google Scholar]
- 30.Marie-Nelly H., Marbouty M., Cournac A., Flot J.-F., Liti G., Parodi D. P., Syan S., Guillén N., Margeot A., Zimmer C., Koszul R., High-quality genome (re)assembly using chromosomal contact data. Nat. Commun. 5, 5695 (2014). [DOI] [PMC free article] [PubMed] [Google Scholar]
- 31.Kaplan N., Dekker J., High-throughput genome scaffolding from in vivo DNA interaction frequency. Nat. Biotechnol. 31, 1143–1147 (2013). [DOI] [PMC free article] [PubMed] [Google Scholar]
- 32.Beitel C. W., Froenicke L., Lang J. M., Korf I. F., Michelmore R. W., Eisen J. A., Darling A. E., Strain- and plasmid-level deconvolution of a synthetic metagenome by sequencing proximity ligation products. PeerJ 2, e415 (2014). [DOI] [PMC free article] [PubMed] [Google Scholar]
- 33.Burton J. N., Liachko I., Dunham M. J., Shendure J., Species-level deconvolution of metagenome assemblies with Hi-C–based contact probability maps. G3 4, 1339–1346 (2014). [DOI] [PMC free article] [PubMed] [Google Scholar]
- 34.Marbouty M., Cournac A., Flot J.-F., Marie-Nelly H., Mozziconacci J., Koszul R., Metagenomic chromosome conformation capture (meta3C) unveils the diversity of chromosome organization in microorganisms. eLife 3, e03318 (2014). [DOI] [PMC free article] [PubMed] [Google Scholar]
- 35.Marbouty M., Koszul R., Metagenome analysis exploiting high-throughput chromosome conformation capture (3C) data. Trends Genet. 31, 673–682 (2015). [DOI] [PMC free article] [PubMed] [Google Scholar]
- 36.Dekker J., Rippe K., Dekker M., Kleckner N., Capturing chromosome conformation. Science 295, 1306–1311 (2002). [DOI] [PubMed] [Google Scholar]
- 37.Mesyanzhinov V. V., Robben J., Grymonprez B., Kostyuchenko V. A., Bourkaltseva M. V., Sykilinda N. N., Krylov V. N., Volckaert G., The genome of bacteriophage ϕKZ of Pseudomonas aeruginosa. J. Mol. Biol. 317, 1–19 (2002). [DOI] [PubMed] [Google Scholar]
- 38.Cornelissen A., Hardies S. C., Shaburova O. V., Krylov V. N., Mattheus W., Kropinski A. M., Complete genome sequence of the giant virus OBP and comparative genome analysis of the diverse φKZ-related phages. J. Virol. 86, 1844–1852 (2012). [DOI] [PMC free article] [PubMed] [Google Scholar]
- 39.Waller A. S., Yamada T., Kristensen D. M., Kultima J. R., Sunagawa S., Koonin E. V., Bork P., Classification and quantification of bacteriophage taxa in human gut metagenomes. ISME J. 8, 1391–1402 (2014). [DOI] [PMC free article] [PubMed] [Google Scholar]
- 40.Peng Y., Leung H. C. M., Yiu S. M., Chin F. Y. L., IDBA-UD: A de novo assembler for single-cell and metagenomic sequencing data with highly uneven depth. Bioinformatics 28, 1420–1428 (2012). [DOI] [PubMed] [Google Scholar]
- 41.Zhu W., Lomsadze A., Borodovsky M., Ab initio gene identification in metagenomic sequences. Nucleic Acids Res. 38, e132 (2010). [DOI] [PMC free article] [PubMed] [Google Scholar]
- 42.Meyer F., Paarmann D., D’Souza M., Olson R., Glass E. M., Kubal M., Paczian T., Rodriguez A., Stevens R., Wilke A., Wilkening J., Edwards R. A., The metagenomics RAST server—A public resource for the automatic phylogenetic and functional analysis of metagenomes. BMC Bioinformatics 9, 386 (2008). [DOI] [PMC free article] [PubMed] [Google Scholar]
- 43.Xiao L., Feng Q., Liang S., Sonne S. B., Xia Z., Qiu X., Li X., Long H., Zhang J., Zhang D., Liu C., Fang Z., Chou J., Glanville J., Hao Q., Kotowska D., Colding C., Licht T. R., Wu D., Yu J., Sung J. J. Y., Liang Q., Li J., Jia H., Lan Z., Tremaroli V., Dworzynski P., Nielsen H. B., Bäckhed F., Doré J., Le Chatelier E., Ehrlich S. D., Lin J. C., Arumugam M., Wang J., Madsen L., Kristiansen K., A catalog of the mouse gut metagenome. Nat. Biotechnol. 33, 1103–1108 (2015). [DOI] [PubMed] [Google Scholar]
- 44.Wood D. E., Salzberg S. L., Kraken: Ultrafast metagenomic sequence classification using exact alignments. Genome Biol. 15, R46 (2014). [DOI] [PMC free article] [PubMed] [Google Scholar]
- 45.Roux S., Enault F., Hurwitz B. L., Sullivan M. B., VirSorter: Mining viral signal from microbial genomic data. PeerJ 3, e985 (2015). [DOI] [PMC free article] [PubMed] [Google Scholar]
- 46.Guglielmini J., Néron B., Abby S. S., Garcillán-Barcia M. P., de la Cruz F., Rocha E. P. C., Key components of the eight classes of type IV secretion systems involved in bacterial conjugation or protein secretion. Nucleic Acids Res. 42, 5715–5727 (2014). [DOI] [PMC free article] [PubMed] [Google Scholar]
- 47.Blondel V. D., Guillaume J.-L., Lambiotte R., Lefebvre E., Fast unfolding of communities in large networks. J. Stat. Mech. Theory Exp. 2008, P10008 (2008). [Google Scholar]
- 48.Albertsen M., Hugenholtz P., Skarshewski A., Nielsen K. L., Tyson G. W., Nielsen P. H., Genome sequences of rare, uncultured bacteria obtained by differential coverage binning of multiple metagenomes. Nat. Biotechnol. 31, 533–538 (2013). [DOI] [PubMed] [Google Scholar]
- 49.Parks D. H., Imelfort M., Skennerton C. T., Hugenholtz P., Tyson G. W., CheckM: Assessing the quality of microbial genomes recovered from isolates, single cells, and metagenomes. Genome Res. 25, 1043–1055 (2015). [DOI] [PMC free article] [PubMed] [Google Scholar]
- 50.Guglielmini J., Quintais L., Garcillán-Barcia M. P., de la Cruz F., Rocha E. P. C., The repertoire of ICE in prokaryotes underscores the unity, diversity, and ubiquity of conjugation. PLOS Genet. 7, e1002222 (2011). [DOI] [PMC free article] [PubMed] [Google Scholar]
- 51.Lang J. M., Darling A. E., Eisen J. A., Phylogeny of bacterial and archaeal genomes using conserved genes: Supertrees and supermatrices. PLOS ONE 8, e62510 (2013). [DOI] [PMC free article] [PubMed] [Google Scholar]
- 52.Umbarger M. A., Toro E., Wright M. A., Porreca G. J., Baù D., Hong S.-H., Fero M. J., Zhu L. J., Marti-Renom M. A., McAdams H. H., Shapiro L., Dekker J., Church G. M., The three-dimensional architecture of a bacterial genome and its alteration by genetic perturbation. Mol. Cell 44, 252–264 (2011). [DOI] [PMC free article] [PubMed] [Google Scholar]
- 53.Marbouty M., Le Gall A., Cattoni D. I., Cournac A., Koh A., Fiche J.-B., Mozziconacci J., Murray H., Koszul R., Nollmann M., Condensin- and replication-mediated bacterial chromosome folding and origin condensation revealed by Hi-C and super-resolution imaging. Mol. Cell 59, 588–602 (2015). [DOI] [PubMed] [Google Scholar]
- 54.Val M.-E., Marbouty M., de Lemos Martins F., Kennedy S. P., Kemble H., Bland M. J., Possoz C., Koszul R., Skovgaard O., Mazel D., A checkpoint control orchestrates the replication of the two chromosomes of Vibrio cholerae. Sci. Adv. 2, e1501914 (2016). [DOI] [PMC free article] [PubMed] [Google Scholar]
- 55.Wang X., Le T. B. K., Lajoie B. R., Dekker J., Laub M. T., Rudner D. Z., Condensin promotes the juxtaposition of DNA flanking its loading site in Bacillus subtilis. Genes Dev. 29, 1661–1675 (2015). [DOI] [PMC free article] [PubMed] [Google Scholar]
- 56.Arndt D., Grant J. R., Marcu A., Sajed T., Pon A., Liang Y., Wishart D. S., PHASTER: A better, faster version of the PHAST phage search tool. Nucleic Acids Res. 44, W16–W21 (2016). [DOI] [PMC free article] [PubMed] [Google Scholar]
- 57.Kristensen D. M., Cai X., Mushegian A., Evolutionarily conserved orthologous families in phages are relatively rare in their prokaryotic hosts. J. Bacteriol. 193, 1806–1814 (2011). [DOI] [PMC free article] [PubMed] [Google Scholar]
- 58.Kristensen D. M., Waller A. S., Yamada T., Bork P., Mushegian A. R., Koonin E. V., Orthologous gene clusters and taxon signature genes for viruses of prokaryotes. J. Bacteriol. 195, 941–950 (2013). [DOI] [PMC free article] [PubMed] [Google Scholar]
- 59.Akhter S., Aziz R. K., Edwards R. A., PhiSpy: A novel algorithm for finding prophages in bacterial genomes that combines similarity- and composition-based strategies. Nucleic Acids Res. 40, e126 (2012). [DOI] [PMC free article] [PubMed] [Google Scholar]
- 60.Flores C. O., Meyer J. R., Valverde S., Farr L., Weitz J. S., Statistical structure of host–phage interactions. Proc. Natl. Acad. Sci. U.S.A. 108, E288–E297 (2011). [DOI] [PMC free article] [PubMed] [Google Scholar]
- 61.Bokulich N. A., Subramanian S., Faith J. J., Gevers D., Gordon J. I., Knight R., Mills D. A., Caporaso J. G., Quality-filtering vastly improves diversity estimates from Illumina amplicon sequencing. Nat. Methods 10, 57–59 (2013). [DOI] [PMC free article] [PubMed] [Google Scholar]
- 62.Eddy S. R., A new generation of homology search tools based on probabilistic inference. Genome Inform. 23, 205–211 (2009). [PubMed] [Google Scholar]
- 63.Rippe K., Making contacts on a nucleic acid polymer. Trends Biochem. Sci. 26, 733–740 (2001). [DOI] [PubMed] [Google Scholar]
- 64.Overbeek R., Olson R., Pusch G. D., Olsen G. J., Davis J. J., Disz T., Edwards R. A., Gerdes S., Parrello B., Shukla M., Vonstein V., Wattam A. R., Xia F., Stevens R., The SEED and the Rapid Annotation of microbial genomes using Subsystems Technology (RAST). Nucleic Acids Res. 42, D206–D214 (2014). [DOI] [PMC free article] [PubMed] [Google Scholar]
Associated Data
This section collects any data citations, data availability statements, or supplementary materials included in this article.
Supplementary Materials
http://advances.sciencemag.org/cgi/content/full/3/2/e1602105/DC1
Supplementary material for this article is available at http://advances.sciencemag.org/cgi/content/full/3/2/e1602105/DC1
fig. S1. Generation of raw CCs.
fig. S2. Iterative Louvain procedure and characterization of CCs.
fig. S3. Comparison of CAGs and meta3C approaches.
fig. S4. Scaffolding of dozens of bacterial chromosomes.
fig. S5. Example of post-GRAAL scaffold correction.
fig. S6. Structural behavior of phage SPβ in B. subtilis genome.
fig. S7. Schematic representation of the phiKZ-like genome.
fig. S8. Interactions of phages with bacterial genomes.
fig. S9. CRISPR spacers’ blast output.
table S1. Description of the 140 largest genomic structures (>500 kb) detected in the mice gut microbiome and their assembly/scaffolding statistics.
table S2. Description of the 59 contigs corresponding to candidate phages hailing from the unscaffolded output of the GRAAL software.
table S3. Description of the 43 contigs hailing from the reassembly of small CCs and corresponding to candidate phages.
table S4. CRISPR spacers’ blast output (format #6).
data set S1. Contig data (contigs_id, contig_name, GC content, coverage, core_community_index, core_size).
data set S2. Normalized contig network (contig_1, contig_2, normalized interaction).
data set S3. This file contains all the GRAAL scaffolds larger than 300 kb (FASTA format).
data set S4. This file, in complement of data set S3, contains all the contigs not included in the scaffolds larger than 300 kb (FASTA format).
data set S5. This file contains all the CC assemblies (contigs >5 kb, FASTA format) that were not scaffolded by GRAAL because of their small size (cumulated size, <500 kb; see steps 4 and 5 in fig. S2).