Large-Scale Analysis of CRISPR/Cas9 Cell-Cycle Knockouts Reveals the Diversity of p53-Dependent Responses to Cell-Cycle Defects (original) (raw)
. Author manuscript; available in PMC: 2018 Feb 27.
SUMMARY
Defining the genes that are essential for cellular proliferation is critical for understanding organismal development and identifying high-value targets for disease therapies. However, the requirements for cell-cycle progression in human cells remain incompletely understood. To elucidate the consequences of acute and chronic elimination of cell-cycle proteins, we generated and characterized inducible CRISPR/Cas9 knockout human cell lines targeting 209 genes involved in diverse cell-cycle processes. We performed single-cell microscopic analyses to systematically establish the effects of the knockouts on subcellular architecture. To define variations in cell-cycle requirements between cultured cell lines, we generated knockouts across cell lines of diverse origins. We demonstrate that p53 modulates the phenotype of specific cell-cycle defects through distinct mechanisms, depending on the defect. This work provides a resource to broadly facilitate robust and long-term depletion of cell-cycle proteins and reveals insights into the requirements for cell-cycle progression.
In Brief
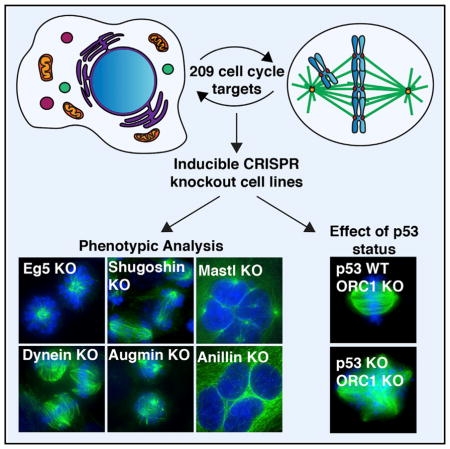
McKinley and Cheeseman report a resource of ~500 inducible CRISPR/Cas9 knockout cell lines targeting 209 genes involved in cell-cycle processes. Defining the corresponding phenotypes associated with these cell lines and comparing them across diverse cell types reveals differential responses of the p53 pathway to specific cell-cycle defects.
INTRODUCTION
The development of an adult human from a single-cell zygote requires that cells repeatedly transit through the cell cycle to duplicate and transmit their cellular contents. During every cell cycle, hundreds of different gene products must execute their functions with exquisite precision to generate functional daughter cells (Morgan, 2007). Defects in cell-cycle processes can lead to cell death or can produce abnormal daughter cells that are deleterious to the organism, for example by contributing to cancer progression(Holland and Cleveland, 2009). Thus, dissecting the molecular functions of cell-cycle-associated genes is of critical importance.
Defining the functional contributions of cell-cycle genes requires both the robust elimination of targets and phenotypic analysis at the single-cell level. The large-scale analysis of the phenotypes resulting from the RNAi-based depletion of cell-cycle gene products has made important contributions to defining the requirements for genomic transmission (Goshima et al., 2007; Hutchins et al., 2010; Neumann et al., 2006, 2010). Recently, CRISPR/Cas9-based knockout approaches have revolutionized functional analyses (Shalem et al., 2014; Wang et al., 2014), offering several advantages over RNAi including the ability to generate a complete and irreversible knockout instead of reduced protein levels as achieved through RNAi knockdowns.
To gain insights into the functional contributions of cell-cycle structures and regulatory circuits, we generated inducible CRISPR/Cas9-based knockout human cell lines for the precise and potent disruption of 209 genes with key roles across diverse cell-cycle functions. We generated more than 500 inducible knockout cell lines across cancerous and non-transformed cellular backgrounds to provide a resource for mechanistic biological dissection and the analysis of disease-related mutations. Our systematic analysis of these cell lines reveals the cell biological phenotypes and corresponding functions for this broad set of gene targets. We find that spindle multipolarity is the predominant phenotype associated with disruption of diverse cell-cycle-associated genes, including for multiple players not previously implicated spindle or centrosome function. In addition, we exploit the advantages of the CRISPR/Cas9 system to define the contributions of genes whose knockouts do not result in discernible cell-cycle defects, including by simultaneously targeting redundant pathways and generating stable knockouts. Finally, we analyze the contributions of the tumor suppressor p53 to modulating the phenotypic consequences of specific cell-cycle deletions. Together, the inducible knockout cell lines that we generated will facilitate cell biological analyses of the acute and chronic elimination of cell-cycle genes.
RESULTS
CRISPR/Cas9-Inducible Knockout Cell Lines for Large-Scale Analysis of Cell-Cycle Gene Function
We sought to generate a resource for large-scale functional analyses of cell-cycle-related genes in human cells. To do this, we used a CRISPR/Cas9-based system to generate individual inducible knockouts in human HeLa cells (McKinley et al., 2015; Shalem et al., 2014; Wang et al., 2014) (Table S1). For this system, each cell line stably expresses a single guide RNA (sgRNA) targeting an early exon of a gene of interest, and a doxycycline-inducible Cas9 nuclease. Upon Cas9 induction, double-strand breaks are generated in the target gene, with error-prone repair by non-homologous end joining resulting in insertions and deletions that disrupt protein function (Figure 1A).
Figure 1. Generation of an Inducible CRISPR/Cas9 Knockout Collection Targeting Cell-Cycle Genes.

(A) Schematic showing the induction of the knockouts.
(B) Schematic representing the interphase or mitotic functions of the gene targets in the collection. Note that some targets are represented in multiple categories due to their contribution to multiple distinct processes. See also Table S2.
(C) Representative immunofluorescence images of the mitotic and interphase morphologies used to categorize the defects observed in the collection. Gene names are presented in large text; names in parentheses refer to commonly used protein designations. Scale bars, 15 μm.
We defined a list of 209 target genes that function in the core physical and regulatory processes required for cellular proliferation (Figure 1B and Table S2). Previous reports have implicated these targets in processes that include DNA replication, cytokinesis, and cell-cycle progression, as well as the components of key cellular structures including the centrosome, the kinetochore, and the mitotic spindle (Figure 1B and Table S2). Lesions in approximately one-third of these targets have been strongly implicated in the etiology of human diseases (Stenson et al., 2003; Table S3). We also targeted the 70 genes for which expression profiles were previously found to correlate with chromosomal instability, termed the CIN70 (Carter et al., 2006). Thus, these targets represent critical players in both biological and pathological outcomes of cell-cycle processes.
For each gene, we generated at least two independent inducible knockout HeLa cell lines with distinct guide sequences to direct cleavage of an early exon (Figure 1A and Table S1). As we reported previously (McKinley et al., 2015), induction of the knockout results in robust elimination of the target protein, although some cells escaped the cutting or repaired the break in a manner that retains the open reading frame. This results in clonal populations in which there is either no detectable protein (apparently null) or detectable protein (wild-type or heterozygous) (Figure S1A). These populations can be readily distinguished through single-cell phenotypic analyses. Together, this work provides a collection of 434 HeLa cell lines with genetically encoded inducible knockouts for the precise and potent elimination of cell-cycle components (Table S1).
Next, we assessed the phenotypic consequences of the inducible knockouts by immunostaining for microtubules and DNA. We analyzed cells following 4 days of Cas9 induction, a time point selected based on our previous analysis of depletion kinetics for mitotic targets using this system (McKinley et al., 2015). As with all protein-depletion strategies that target DNA or RNA, we note that this approach presents the potential for secondary effects due to the time required to effectively deplete the target protein as the cell transits through partially depleted states. The complete set of representative micrographs is available at http://cellcycleknockouts.wi.mit.edu/. We performed a blind analysis of the fixed cells, characterizing each cell line according to 11 phenotypic categories to assess altered interphase nuclear morphology, disruption of the mitotic spindle, and defects in cell-cycle progression or viability (Figures 1C, 2, and S1B; Table S4). We found that the elimination of ~50% of the targeted genes resulted in striking and diverse phenotypic consequences after 4 days of Cas9 induction (Figures 2A and 2B; Table S4). Thus, as intended, this collection targets multiple genes that are required for cellular proliferation and viability, necessitating their analysis by conditional strategies.
Figure 2. Phenotypic Characterization of the Inducible CRISPR/Cas9 Knockout Collection in HeLa Cells.

(A) Heatmap demonstrating the phenotypic categorization of the knockouts in the collection after 4 days of Cas9 induction. At least two cell lines were generated for each target. One cell line per target is shown here, selecting the cell line with the most potent apparent phenotype. The complete phenotypic categorizations of all HeLa cell lines are reported in Table S4. Dark-blue bars indicate phenotypes that were frequently observed in the population (categorized with the number 2 in Table S4); light-blue bars indicate phenotypes that were observed less frequently in the population (categorized with the number 1 in Table S4). These designations are qualitative, but correspond approximately to phenotypes observed in 5%–30% of cells (light blue) and >30% of cells (dark blue). Gene targets were clustered by assigning the following weights to each phenotypic category: monopolarity, 7; multipolarity, 6; major plate defects, 5; some off-axis chromosomes, 4; spindle defects not otherwise specified (n.o.s), 3; cytokinesis defects, 2; all other categories, 1. Magnifications highlight a selection of targets with similar functions that clustered together in the analysis.
(B) Representative immunofluorescence images of cells following 4-day induction of the respective knockouts. Green: microtubules; blue: DNA. The complete collection of micrographs is available at http://cellcycleknockouts.wi.mit.edu/. Gene names are presented in large text; names in parentheses refer to commonly used protein designations. Scale bar, 15 μm.
In our analysis, perturbation of proteins with related reported functions resulted in highly similar phenotypes (Figure 2A). For example, disruption of centriole components or key players in spindle bipolarity resulted in spindle monopolarity (Figures 2A and 2B). These analyses also revealed multiple cases in which conspicuous mitotic defects were observed following disruption of genes with poorly defined functions and phenotypes. For example, we observed severe defects in chromosome alignment following knockout of the splicing component encoded by LSM4. LSM4 depletion defects have not been previously reported (Sundaramoorthy et al., 2014), but LSM4 may contribute to the role of the splicing machinery in sister chromatid cohesion (Oka et al., 2014; Sundaramoorthy et al., 2014; van der Lelij et al., 2014; Watrin et al., 2014). Additionally we observed strong mitotic defects following knockout of POC1A, which encodes a centriolar protein. Although mutations in POC1A are linked to a variety of diseases, including primordial dwarfism (Shaheen et al., 2012), the molecular functions of the Poc1A have remained elusive, with previous reports suggesting that it functions redundantly with Poc1B (Venoux et al., 2013) (Figure 2A).
Together, these inducible knockoutcelllines provide a resource for the cell biological analysis of cell-cycle-related genes, and our associated phenotypic analysis provides critical information regarding the diverse functions of this gene collection.
Inducible Knockouts Provide an Efficient Strategy for the Simultaneous Disruption of Two Redundant Genes to Reveal Synthetic Interactions
Numerous targets in our analyses did not display discernible phenotypes following acute induction of the knockout for 4 days (Figure 2A and Table S4). One possible cause of this is the compensation by gene products that function redundantly with the gene of interest. Simultaneously disrupting multiple gene products is critical for analyzing such redundant genes and for probing synergistic interactions between pathways (Bender and Pringle, 1991). For example, in cultured cells, Nde1 and NdeL1 have been proposed to have overlapping functions in dynein pathways (Lam et al., 2010). To test this, we generated an NDE1-NDEL1 inducible double knockout by the simultaneous introduction of two guide RNAs. In striking contrast to the mild or absent phenotypes observed in the single knockouts (Figures 2A and 3A; Table S4), we observed severe phenotypes in the NDE1-NDEL1 double knockout that are highly similar to those observed in the knockout of dynein heavy chain, DYNC1H1 (Figure 3A). Therefore, this system enables the simultaneous disruption of multiple gene targets to reveal synthetic interactions between gene products.
Figure 3. Knockouts without Detectable Defects after 4 Days of Induction Participate in Redundant Pathways or Extremely Stable Processes or Are Non-essential for Viability and Proliferation.

(A) Representative immunofluorescence images showing microtubule morphology in the NDE1 and NDEL1 single knockouts and the NDE1-NDEL1 double knockout. Numbers represent the proportion of cells exhibiting defective mitoses. An image of the DYNC1H1 (dynein heavy chain) knockout is shown for comparison. Scale bar, 5 μm.
(B) Representative micrographs showing DNA staining of inducible knockouts targeting proteins associated with CENP-A deposition following 4 or 7 days of Cas9 induction. Scale bar, 15 μm.
(C) Western blots (top) and immunofluorescence images (bottom) indicating the absence of the indicated proteins in stable clonal cell lines isolated after long-term knockout induction. Immunofluorescence images are scaled equivalently; overexposed images are included in Figures S2A and S2B to confirm that the protein is undetectable. Cells were arrested in 330 nM nocodazole for 12 hr to assay for the presence of CENP-F by immunofluorescence. Scale bars, 15 μm.
(D) Viability (as assayed by luminescence in the CellTiter-Glo assay) of the indicated cell lines after 3 days of incubation with increasing concentrations of nocodazole. Data are presented as percentage of the luminescence measured in untreated cells at the same time point. Error bars represent SD.
Inducible Knockouts Facilitate Long-Term Protein Depletion for the Analysis of Stable Processes
A key advantage of these inducible Cas9 cell lines is that, once the knockouts are initiated, they are irreversible. This facilitates the analysis of gene targets that produce or affect highly stable proteins, for which phenotypes would only be detectable after extended durations. For example, the centromeric histone CENP-A (also known as CenH3) is extremely stable once incorporated at centromeres (reviewed in McKinley and Cheeseman, 2016). Consistent with this stability, we did not detect any defects following 4 days of induction of knockouts of CENPA or key components of the CENP-A deposition machinery (HJURP, OIP5 [encoding Mis18β], and MIS18BP1; Figures 2A and 3B; Table S4). However, after 7 days of Cas9 induction, these inducible knockouts displayed severe defects (Figure 3B). Thus, the inducible knockouts can be used to disrupt genes and pathways with long-term depletion kinetics, which have been refractory to previous perturbation approaches.
Irreversible Protein Elimination Using the Inducible Knockouts Reveals Genes that Are Non-essential for Viability
The irreversible nature of the Cas9 system additionally allows for the permanent elimination of non-essential targets. In particular, this system facilitates a test of gene essentiality, whereby cells are tested for their ability to proliferate indefinitely in culture in the absence of the target protein. This strategy represents an important complement to recent work analyzing the requirements for the relative fitness of human knockouts based on comparative bar-code recovery (Blomen et al., 2015; Hart et al., 2015; Wang et al., 2015).
To test whether we could permanently eliminate specific cell-cycle proteins, we focused on the microtubule end-binding protein EB1 (MAPRE1) and the kinetochore protein CENP-F (CENPF), whose contributions to mitotic progression are controversial (Bomont et al., 2005; Ferreira et al., 2013; Holt et al., 2005; Pfaltzgraff et al., 2016; Thomas et al., 2016). As we did not detect defects following 4 days of Cas9 induction in the _MAPRE1_- and _CENPF_-inducible knockouts (Figure 2A and Table S4), we tested the essentiality of these proteins by long-term induction of the knockout and generation of clonal cell lines. In both cases, we were able to isolate and maintain discrete clones in which the corresponding protein was undetectable by western blotting (Figure 3C). Although the CRISPR/Cas9-based knockout strategy eliminates isoforms targeted by the designed sgRNAs, it is possible that cells may initiate in-frame gene products downstream of the target site that may retain partial functions. Therefore, we additionally analyzed the knockouts by immunofluorescence using antibodies recognizing C-terminal regions of the corresponding proteins to detect products with alternative start sites. These antibodies did not generate detectable signals in our knockout cell lines, indicating that these functions are not compensated by downstream gene products (Figures 3C, 2A, and 2B). Nonetheless, it is possible that suppressor mutations could have arisen in these cell lines, although the absence of detectable defects following acute elimination of these proteins (Figure 2A and Table S4) argues against this possibility. In addition, it remains possible that some target protein remains that is below our detection thresholds in these assays, or that gene products undetectable by our reagents compensated for the wild-type protein such that these cell lines contain hypomorphic alleles of the targeted gene, rather than true nulls.
The MAPRE1 and CENPF stable knockout cell lines did not display discernible growth or phenotypic effects, indicating that they are non-essential for proliferation under normal conditions in cell culture. However, MAPRE1 knockout cells displayed heightened sensitivity to the microtubule poison, nocodazole (Figure 3D). In addition, we found that the combined knockout of MAPRE1 together with the EB family member, MAPRE3 (EB3), resulted in increased frequency and severity of mitotic defects compared with either knockout alone (Figures S2C and S2D). Thus, these genes may be non-essential due to their role in redundant pathways. Together, these cell lines provide a rigorous test of the requirements for these proteins for viability and proliferation, and provide avenues for the analysis of the functions of these proteins.
Distinct Defects in the Cell-Cycle Knockouts Result in Spindle Multipolarity
The analysis of a broad collection of inducible knockout cell lines permits the identification of phenotypic patterns across targets with distinct cellular functions. In our collection, the most frequently observed defect was spindle multipolarity (knockout of 102 targets resulted in increased multipolarity; Figure 2A and Table S4), a defect that is frequently observed in tumor cells and may underlie their genomic instability (Brinkley, 2001; Lingle et al., 1998). To define the molecular events underlying the multipolar spindles, we analyzed the functional basis of spindle multipolarity in 23 knockout cell lines targeting proteins that function in diverse cell-cycle processes including DNA replication, centriole and centrosome integrity, kinetochore, spindle, and chromosome structure, and cytokinesis (Figure 4).
Figure 4. Diverse Cell-Cycle Knockouts Cause Multipolarity through Absence of Centrioles, Supernumerary Centrioles, and/or Centriole Splitting.

(A) Representative immunofluorescence images illustrative of the diverse centriole defects observed in the knockouts. Insets show magnifications of the centrioles. Centrioles are marked with anti-centrin2. Two examples of CENPW knockout cells are shown, illustrating one cell in which centriole splitting was not observed (such that one pole forms in the absence of centrioles), and one cell in which centriole splitting was observed. Some poles lack detectable centrioles, for example in the SASS6 knockout and the CENPW knockout without centriole splitting. In a subset of cells centrioles occupied a minor pole, leaving a major pole without detectable centrioles, as illustrated in the CENPW knockout. In other cells centrioles occupied both major poles, while the minor pole lacked detectable centrioles. Scale bar, 5 μm.
(B) Quantification of the number of centrioles per multipolar cell in each knockout. Error bars represent SD. n = 20 cells.
(C) Quantification of the percentage of multipolar cells with at least two poles containing odd numbers of centrioles, as a measure of centriole splitting. n = 20 cells.
(D) Representative immunofluorescence images of cells following 2 days of treatment of the Plk4 inhibitor Centrinone and 4 days of total induction of the ORC1 knockout. Centrioles are stained with anti-centrin2. Scale bar, 5 μm.
(E) Quantification of the number of centrioles per multipolar cell following 2 days of Centrinone treatment and 4 days of total induction of the DNA replication knockouts. Bars represent median with interquartile range. ***p < 0.001 (Student’s t test).
(F) Quantification of the number of spindle poles per multipolar cell following 2 days of Centrinone treatment and 4 days of total induction of the DNA replication knockouts. Bars represent median with interquartile range. n.s., not significant (ANOVA).
As an increase in centriole number has been shown to cause spindle multipolarity (Brinkley, 2001; Godinho and Pellman, 2014), we first analyzed the number of centrioles upon induction of the knockouts. During an unperturbed mitosis cells contain two pairs of centrioles, with each pair nucleating microtubules to form a bipolar spindle. Centrioles in excess of this number can direct the formation of additional spindle poles in the absence of mechanisms that cluster these centrioles (Quintyne et al., 2005). We found that knockouts that disrupted cytokinesis, including several centrosomal proteins, displayed supernumerary centrioles (Figures 4A and 4B), consistent with previous reports demonstrating the retention of all replicated centrioles in a single daughter cell following cytokinetic failure. In addition, knockout of the dynein-associated gene LIS1 resulted in supernumerary centrioles, unlike the other dynein-associated knockouts, which suggests a dynein-independent role for Lis1 at centrosomes (Figures 4B, S3A, and S3B; see also Moon et al., 2014). Strikingly, we also observed supernumerary centrioles in cells containing multipolar spindles following knockout of genes involved in diverse aspects of DNA replication. Although previous reports suggested direct roles for the DNA replication factors ORC1 (Hemerly et al., 2009) and MCM5 (Ferguson et al., 2010) in centriole biogenesis, our data indicate that DNA replication defects broadly affect centriole number (Figures 4A, 4B, and S3A). Thus, supernumerary centrioles explain a subset of the observed multipolar phenotypes that result from diverse cell-cycle knockouts.
Importantly, many inducible knockouts resulted in multipolarity in the absence of supernumerary centrioles. Indeed, even knockouts of gene targets that resulted in a substantial reduction in centriole number, such as knockouts for the centriole component SASS6, displayed occasional multipolar spindles in addition to the frequent monopolar spindles that have been reported previously (Figures 4A and 4B). In multiple other knockouts, multipolar cells were observed with spindle poles nucleated by single or odd-numbered centrioles (Figures 4A and 4C), indicating that premature separation of the mother and daughter centrioles, known as centriole splitting, had occurred. We observed centriole splitting across knockouts with a broad range of reported functions, not simply those implicated in maintaining spindle pole integrity (Figures 4A and 4C). For example, we observed centriole splitting following induction of kinetochore defects (CENPW, DSN1, SKA1), spindle structure defects (HAUS8), sister chromatid cohesion defects (RAD21, SGO1), and DNA replication defects (CDC6, CDT1, ORC1) (Figure 4C). These analyses indicate that diverse defects that cause imbalances in spindle forces and/or prolonged mitoses can result in centriole splitting in cells with wild-type centriole numbers (reviewed in Maiato and Logarinho, 2014).
As we observed both centriole overduplication and centriole splitting in inducible knockouts of DNA replication genes, we sought to distinguish the contributions of these effects to the multipolar spindle phenotype. To suppress centriole overduplication, we treated DNA replication knockout cells with the Plk4 inhibitor Centrinone (Wong et al., 2015) 2 days after Cas9 induction and analyzed centriole number and distribution 2 days later. This treatment effectively reduced centriole numbers to levels at or below those of control cells (Figures 4D and 4E). Despite the reduction in centriole numbers, Centrinone treatment did not suppress spindle multipolarity in the inducible knockout cells, as we observed approximately equivalent numbers of spindle poles in knockout cells with or without Centrinone treatment (Figures 4D and 4F). These data indicate that spindle multipolarity caused by DNA replication defects is not solely due to centriole overduplication. Together, these analyses indicate that spindle multipolarity is a frequent consequence of disrupting diverse cell-cycle components, including numerous genes not directly implicated in spindle organization.
Comparison of Inducible Knockout Phenotypes across Cellular Backgrounds
Although cell-cycle processes are required for the duplication of all cells, we next considered the possibility that the precise requirements for faithful cell division may differ between cell types (for example, see Salimian et al., 2011; Silio et al., 2015). Therefore, we sought to determine whether the phenotypes that we defined for cell-cycle-associated genes in HeLa cells vary across cellular backgrounds. To test this, we introduced the inducible Cas9 transgene into a distinct karyotypically unstable human cancer cell line (U2OS; osteosarcoma), a pseudodiploid human cancer cell line (DLD1; colorectal adenocarcinoma), and a non-transformed diploid human cell line (hTERT-RPE1; hTERT-immortalized retinal pigment epithelium) (Table S1). These cell lines also carry additional features that will facilitate future functional analyses: the U2OS cells carry a lacO array (Janicki et al., 2004) to ectopically target proteins to the arm of chromosome 1 (Gascoigne et al., 2011), and the DLD-1 cells carry a transgene expressing the plant TIR1 cullin subunit to facilitate studies using the auxin-inducible degron (AID) system (Holland et al., 2012; McKinley et al., 2015; Nishimura et al., 2009).
We selected 20 gene targets with diverse functions and phenotypes based on our analyses in HeLa cells (Figure 2), generated the inducible knockouts in these three additional cellular backgrounds, and categorized the corresponding phenotypes after 4 days of Cas9 induction (Figures 5A and 5B; Table S5). For multiple targets with functions ranging from cohesion to cytokinesis, we found that all three additional cell lines displayed phenotypes that were highly similar to those we observed in HeLa cells (Figures 5A and 5B). However, as analyzed further below, a subset of targets displayed severe mitotic defects in HeLa and DLD-1 cells, but mild defects in U2OS cells, and barely discernible or undetectable mitotic defects in RPE1 cells (Figure 5B). These additional cellular backgrounds enable the comparison of cell-cycle requirements between distinct cell types.
Figure 5. The Functions of Cell-Cycle Proteins are Broadly Similar across Cell-Cycle Backgrounds.

(A) Representative immunofluorescence images of cells following 4-day induction of the respective knockouts in DLD-1, U2OS, and RPE1 cell lines. Green: microtubules; blue: DNA. Scale bar, 15 μm.
(B) Heatmap demonstrating the phenotypic frequency in the knockouts of DLD1, U2OS, and RPE1 cell lines. Dark-blue and light-blue bars were designated as in Figure 2A. HeLa categorization is reproduced from Figure 2A for comparison. The complete phenotypic categorizations can be found in Table S5.
The p53 Pathway Suppresses Mitotic Defects Arising from Diverse Knockouts
We next sought to define the mechanisms underlying the differences in phenotypic severity that we observed for a subset of the knockouts between HeLa and RPE1 cells (Figure 5B). A notable difference between HeLa cells and RPE1 cells is the presence of the tumor suppressor p53. p53 is inactivated in HeLa cells, which exhibited severe mitotic defects for a wide spectrum of knockouts, whereas p53 is wild-type in RPE1 cells, for which mitotic defects were not detectable in selected cases. Therefore, we sought to directly test whether p53 was responsible for suppressing the defects associated with a subset of knockouts in RPE1 cells. For these experiments, we utilized the 20 RPE1 knockout cell lines generated for comparison with the DLD-1 and U2OS cells (Figure 5), as well as ten additional RPE1 knockout cell lines that we generated to further broaden our panel of representative cell-cycle defects. We then introduced an sgRNA targeting the gene encoding p53 (TP53) into these 30 RPE1-inducible knockout cell lines, as well as the parental RPE1 cell line. The inducible knockout of TP53 in otherwise wild-type RPE1 cells resulted in a mild increase in the proportion of mitotic cells that exhibited mitotic chromosome alignment defects (Figures 6A and 6B). In contrast, simultaneous elimination of both p53 and diverse cell-cycle targets resulted in a dramatic increase in the frequency and severity of mitotic defects at 4 days in numerous cases (18 out of 30 targets) (Figures 6A, 6B, and 6C, top two groups). As a result, when cell-cycle knockouts that displayed barely discernible defects were combined with knockout of TP53, they displayed defects that phenocopied those observed in HeLa cells (Figures 2A, 2B, 6A, and 6B). However, we also observed numerous knockouts that displayed severe phenotypes in both the presence and absence of p53 at equivalent time points (Figure 6C, bottom two groups). These data indicate that the presence of functional p53 is a major determinant of the phenotypic severity associated with the disruption of specific cell-cycle processes.
Figure 6. p53 Status Affects the Manifestation of Cell-Cycle Defects and Accelerates Basal Cell-Cycle Rate in RPE1 Cells.

(A) Representative immunofluorescence images of defects observed in RPE1 knockout cell lines in the presence or absence of TP53 knockout following 4 days of induction. Scale bar, 15 μm.
(B) Quantification of the proportion of mitotic cells displaying defective metaphase chromosome alignment in RPE1 knockout cell lines in the presence or absence of TP53 knockout. Error bars represent SD; n = 100 cells, unless designated by an asterisk, which indicates that insufficient mitotic cells were present to achieve this number. In these cases, n > 20.
(C) Heatmap demonstrating the phenotypic categorization of the indicated RPE1 knockouts in presence or absence of TP53 knockout after 4 or 6 days, as indicated. These designations are qualitative, but correspond approximately to phenotypes as follows. White bars, defects observed in <35% mitotic cells; light-blue bars: defects observed in 40%–65% of mitotic cells; dark-blue bars, defects observed in >70% of mitotic cells. Asterisk indicates that mitotic cells were very rare in these populations. Dotted lines group targets based on the requirement for extended depletion to uncover mitotic phenotypes. In the third category from the top, the frequency of mitotic defects decreased with extended depletion. We speculate that this apparent reduction is due to the majority of knockout cells either exiting the cell cycle or dying by the 6-day time point. For example, components of the centriole duplication machinery assemble monopolar spindles as the centrioles are depleted out, but ultimately undergo a p53-dependent arrest.
(D) Quantification of anti-CENP-T centromeric fluorescence intensity in mitotic RPE1 cells in the indicated knockouts after 4 days of Cas9 induction. Error bars represent SEM; n = 20 cells. ***p < 0.001.
(E) Quantification of the proportion of mitotic cells displaying defective metaphase chromosome alignment in RPE1 knockout cell lines in the presence or absence of TP53 knockout after 4 or 6 days of induction, as indicated. Error bars represent SD; n = 100 cells, unless designated by an asterisk, which indicates that insufficient mitotic cells were present to achieve this number. In these cases, n > 20.
(F) Quantification of fold increase in cell number in the presence or absence of TP53 knockout in otherwise wild-type RPE1 cells in 24 hr. Error bars represent SD.
(G) Top: DNA content profile of p53 wild-type RPE1 cells analyzed by flow cytometry. Bottom: proportion of cells in G1, S, and G2 phases according to the Watson (pragmatic) model.
(H) Top: DNA content profile of p53 knockout RPE1 cells analyzed by flow cytometry. Bottom: proportion of cells in G1, S, and G2 phases according to the Watson (pragmatic) model.
KO, knockout; WT, wild-type.
p53 Knockout Accelerates the Manifestation of a Subset of Defects through Enhanced Cell-Cycle Rate
We next sought to delineate the mechanisms that suppress these diverse cell-cycle defects downstream of p53. We first tested the possibility that p53 knockout resulted in a more potent phenotype due to an increased depletion rate of a target protein by monitoring the levels of the kinetochore protein CENP-T at kinetochores following induction of the knockout of its obligate binding partner, CENPW (Nishino et al., 2012). Although CENP-T levels were substantially reduced in both cases, we found that simultaneously eliminating p53 and CENPW significantly enhanced CENP-T depletion after 4 days compared with CENPW knockout alone (Figure 6D). Therefore, eliminating p53 may accelerate the manifestation of phenotypic defects in specific cases at least in part through enhancing protein depletion.
If differences in depletion efficiency were responsible for the suppression of the cell-cycle defects in RPE1 cells, we reasoned that extending the duration of the depletion would allow for further protein turnover and cell division-based dilution. Indeed, for a subset of knockouts (9 out of 30 targets; Figure 6E), we found that increasing the duration of Cas9 induction from 4 days to 6 days in cells with wild-type p53 uncovered severe defects comparable with those observed when the target was eliminated for 4 days in conjunction with p53 knockout (Figures 6C and 6E). This suggests that p53 knockout expedites the manifestation of a subset of defects by modulating the rate of protein depletion. Compared with RNAi-based approaches, the irreversible nature of these knockouts will significantly enhance the ability to achieve the long-term depletions required to perform robust analyses in p53-proficient cells.
We next sought to define the basis for the differential rate of protein depletion in cells corresponding to their p53 status. p53 knockout has been reported to accelerate the basal cycling rate of cells isolated from mice (Harvey et al., 1993; Tsukada et al., 1993). In this case, an increased rate of cell-cycle progression in the absence of p53 could accelerate the rate of protein depletion through cell division-based dilution. Indeed, we found that TP53 knockout increased the rate of cellular proliferation of RPE1 cells by 25% relative to unperturbed RPE1 cells (Figure 6F). We also observed a striking change in the cell-cycle profile of _TP53_-inducible knockout based on flow cytometry (Figures 6G and 6H), with a strong shift of the population from the 2c peak. As we did not observe a significant increase in the frequency of binucleated p53 knockout cells by immunofluorescence (data not shown), which would reflect increased occupancy of the 4c peak due to tetraploidization, these data suggest that p53 accelerates proliferation by shortening the G1 phase of the cell cycle.
Thus, elimination of p53 accelerates progression through the cell cycle, which can enhance the rate of protein depletion in the inducible knockouts.
A Subset of Cell-Cycle Knockouts Induces p53-Dependent, p21-Dependent Senescence
Although faster protein depletion due to an increased cell-cycle rate explains a subset of the phenotypic variation observed in the presence or absence of p53, for several targets the severe phenotypes observed following disruption of p53 were not observed in the presence of p53, even following an extended depletion (8 out of 30 targets; Figure 6C). This includes knockouts for genes with protein products involved in cytokinesis (PRC1), DNA replication (ORC1), and kinetochore function (KNL1) (Figures 6C and 6E). Therefore, we considered the possibility that these cells were undergoing a p53-mediated cell-cycle arrest that prevents the manifestation of mitotic defects. The cyclin-dependent kinase inhibitor p21 is a critical modulator of p53-induced cell-cycle arrest (Campisi and d’Adda di Fagagna, 2007), and we observed nuclear accumulation of p21 upon induction of the PRC1, ORC1, and KNL1 knockouts (Figure S4A). Therefore, we tested whether eliminating p21 was sufficient to restore cell cycling and the ensuing mitotic defects in these knockout cells. We found that knockout of p21 (CDKN1A) in conjunction with these diverse cell-cycle knockouts uncovered severe mitotic defects similar to those observed in p53 knockout cells or p53-compromised HeLa cells (Figures 2A, 6A, and 7A). These data extend previous reports of the critical role for p21 in overcoming arrests associated with cytokinesis failure (Ganem et al., 2014) and centriole duplication failure (Fong et al., 2016; Lambrus et al., 2016; Meitinger et al., 2016), and indicate that p21 is a critical effector of cell-cycle arrest in response to a variety of cellular assaults.
Figure 7. p53-Dependent Senescence Occurs through Distinct Mechanisms Depending on the Knockout in RPE1 Cells.

(A) Representative immunofluorescence images of defects observed in RPE1 knockout (KO) cell lines in the presence or absence of CDKN1A knockout following 4 days of induction. Numbers represent percentage of mitotic cells exhibiting defects; n = 100 cells ± SEM. Scale bar, 15 μm.
(B) Representative bright-field images of the indicated RPE1 knockout cells stained for SA-β-galactosidase after 4 days of Cas9 induction. Images were taken with a 20× objective for a total magnification of 500×.
(C) DNA content profile of the indicated RPE1 knockouts cells analyzed by flow cytometry. Numbers above the peaks indicate the proportion of cells in with 2c DNA content (G1-phase-like), 2 < c < 4 (S-phase-like), and 4c DNA content (G2/M-like or tetraploid G1) according to the Watson (pragmatic) model.
(D) Simplified schematic of the reported pathways that arrest cellular proliferation in response to distinct assaults.
(E) Representative immunofluorescence images of defects observed in RPE1 knockout cell lines following 4 days of induction and 2 days of treatment with the ATR inhibitor VE-821. Numbers represent percentage of mitotic cells exhibiting defects; n = 50 cells ± SEM unless designated by an asterisk, which indicates that insufficient mitotic cells were present to achieve this number. In these cases, n > 10. Scale bar, 15 μm.
(F) Quantification of fold increase in cell number in the indicated RPE1 knockouts and Centrinone-treated RPE1 cells over 48 hr. Error bars represent SD. Note that the ORC1 knockouts exhibit continued proliferation in this population-based assay due to reduced penetrance of this knockout.
(G) Representative immunofluorescence images of YAP localization in the indicated RPE1 knockouts and treatments. Scale bar, 15 μm.
(H) Quantification of the YAP nuclear/cytoplasmic ratio following immunofluorescence of the indicated RPE1 knockouts and Centrinone treatment. Contact inhibited cells are used as a positive control for Hippo pathway activation. Bars represent mean with SD. ***p < 0.001; ns, not significant.
(I) Quantification of centriole numbers per mitotic cell in the indicated RPE1 knockouts by immunofluorescence for centrin2. n = 25 cells; bars represent mean with SD. Note that these analyses were done in the presence of the p53 knockout to allow numbers of centrioles to be quantified in mitotic cells, to avoid confounding effects due to the cell-cycle stages in which the knockouts arrest.
(J) Representative bright-field images of RPE1 cells stained for SA-β-galactosidase after 4 days of treatment with the indicated pharmacological inhibitors. Images were taken with a 20× objective for a total magnification of 500×.
p21 plays central roles in the induction of a cell-cycle withdrawal termed senescence (Rufini et al., 2013). After 4 days of Cas9 induction, we found that the PRC1-, ORC1-, and _KNL1-_inducible knockouts displayed hallmarks of senescence including morphological changes characterized by a flattened and enlarged shape (Figure 7B) and β-galactosidase reactivity at pH 6.0 (senescence-associated β-galactosidase, SA-β-gal) (Figure 7B). Similarly, cells grown in the Plk4 inhibitor Centrinone, which induces a cell-cycle arrest due to centriole duplication failure (Wong et al., 2015), were also SA-β-gal positive (Figure 7B). By analyzing DNA content by flow cytometry, we found that these arrests occur with exhibited diverse DNA content (Figure 7C). Thus, diverse cell-cycle assaults result in p53-dependent senescence.
Distinct Molecular Players Activate the p53/p21 Pathway in Response to Cell-Cycle Defects
Recent work has identified several molecular players that activate the p53 pathway in response to cellular damage (Figure 7D). For example, the DNA damage response downstream of ATM and ATR kinases activates a p53-dependent cell-cycle arrest following DNA damage (Kastan et al., 1991). In addition, 53BP1, USP28, and TRIM37 were recently shown to contribute to the cell-cycle arrest that occurs in response to centriole duplication failure and prolonged mitotic duration (Fong et al., 2016; Lambrus et al., 2016; Meitinger et al., 2016). Finally, the Hippo pathway is required to arrest cells in response to cytokinesis defects (Ganem et al., 2014). We next sought to define the contributions of these pathways to the arrests we observed in each of our knockouts.
To test whether the elimination of these targets activated p53 signaling by inducing DNA damage, we first performed immunofluorescence for the DNA-damage marker, phosphorylated histone H2AX (Figures S4B and S4C). We observed a significant accumulation of DNA-damage foci in knockouts of genes associated with DNA replication, such as ORC1, or chromosome structure, such as cohesion and condensin subunits (Figures S4B and S4C). In contrast, we did not detect an increase in DNA damage in the other arrested knockouts (Figures S4B and S4C). In addition, we found that chemical inhibition of the DNA-damage response through caffeine treatment or the ATR inhibitor VE-821 was sufficient to uncover severe mitotic defects in the ORC1 knockout (Figures 7E and S4D), as well as cause severe interphase micronucleation (Figure S4E). In contrast, the other cell-cycle knockouts that we tested were unaffected by these treatments (Figures 7E, S4D, and S4E). Thus, the DNA-damage response plays a critical role in suppressing mitotic defects associated with DNA replication knockout, but not other cell-cycle defects.
Next, we tested the contributions of the 53BP1-USP28-TRIM37 pathway to the observed cell-cycle arrests. For these experiments, we introduced sgRNAs targeting the gene encoding 53BP1 (TP53BP1) into our inducible knockout cell lines. Knockout of TP53BP1 partially restored proliferation to Centrinone-treated cells, as reported previously (Figure 7F; Fong et al., 2016; Lambrus et al., 2016; Meitinger et al., 2016). In contrast, TP53BP1 knockout did not result in a growth enhancement for the PRC1, ORC1, or KNL1 knockout cells (Figure 7F). This indicates that the 53BP1 p53 activation pathway plays critical roles in the response to centriole duplication failure, but not the cell-cycle arrest caused by other defects.
Finally, we analyzed the contributions of the Hippo pathway to the arrest observed in the cell-cycle knockouts. Activation of the Hippo pathway suppresses proliferation by causing the transcriptional co-activators YAP and TAZ to be retained in the cytoplasm and degraded (Yu and Guan, 2013). Previous work found that the Hippo pathway plays a critical role in the cell-cycle arrest induced by cytokinesis failure (Ganem et al., 2014). Indeed, we observed Hippo pathway activation as detected by cytoplasmic retention of YAP following PRC1 knockout (Figures 7G and 7H). However, YAP remained nuclear following ORC1 or KNL1 knockout, or Centrinone treatment (Figure 7H). This indicates that the Hippo pathway controls the cell-cycle arrest associated with cytokinesis failure, but not the other cell-cycle arrests.
In contrast to the clear roles that we observed for the DNA-damage response, the Hippo pathway, and 53BP1 pathway in response to the ORC1, PRC1 knockouts, and centriole duplication failure, respectively, we did not detect contributions of these pathways to the arrest induced by the KNL1 knockout (Figures 7E–7H, S4D, and S4E). In addition, the KNL1 knockout did not display DNA damage (Figures S4B and S4C), tetraploidization (Figure 7C), or centriole number irregularities (Figure 7I). Thus, the arrest associated with the KNL1 knockout appears to be independent of the previously defined pathways for p53 activation following cell-cycle defects.
We therefore considered the possibility that the p53-dependent cell-cycle arrest reflects a specific aspect of KNL1 function. KNL1 plays critical roles in recruiting outer kinetochore proteins, including the Mis12 complex, protein phosphatase 1 (PP1), and components of the spindle assembly checkpoint (Caldas and DeLuca, 2014). To test whether kinetochore assembly defects trigger a p53-dependent cell-cycle arrest, we analyzed knockouts of the Mis12 complex subunits DSN1 and NSL1. However, we did not observe a cell-cycle arrest in the DSN1 or NSL1 knockouts, despite the presence of severe mitotic defects (Figure 6C). These data suggest that the defects in Mis12 recruitment are not sufficient to explain the senescence observed following KNL1 knockout.
As described above, knockouts generated by the CRISPR/Cas9 strategy typically eliminate all protein products of the targeted gene. However, this strategy permits the production of gene products generated by transcriptional start sites downstream of the Cas9 cut site. In analyzing the inducible KNL1 knockout by antibody staining, we found that epitopes at the N terminus of KNL1, corresponding to the region targeted by the sgRNA, were eliminated (Figure S4F). In contrast, we found that epitopes in the middle region of KNL1 persisted following Cas9 induction (Figure S4F). Based on cap analysis gene expression data from the ENCODE consortium in both humans and mice (Harrow et al., 2012), KNL1 has a series of downstream transcriptional start sites that result in a C-terminal fragment, in addition to the canonical transcriptional start site at the beginning of KNL1. As the C terminus of KNL1 contains both its kinetochore targeting and Mis12 recruitment domain (Caldas et al., 2013; Petrovic et al., 2014), the localization of the Mis12 complex and the associated Ndc80 complex also remain intact in this knockout (Figure S4G). This further suggests that senescence in the KNL1 knockout is not due to defects in Mis12 recruitment. In contrast, the eliminated KNL1 region binds to PP1 (Liu et al., 2010). PP1 has diverse cellular functions, including a reported role in reversing p53 phosphorylation (Haneda et al., 2004; Lu et al., 2013). Consistent with a potential role for reduced PP1 activity in mediating p53-dependent senescence, we found that p53 wild-type RPE1 cells grown in very-low-dose okadaic acid to inhibit PP1 and PP2A exhibited robust senescence based on both senescence-associated β-galactosidase and halted proliferation (Figures 7J and S4H; see also Milczarek et al., 1999).
Finally, we considered whether disrupting spindle assembly checkpoint signaling resulted in senescence. We did not observe senescence following knockouts of the spindle assembly checkpoint proteins BubR1 (BUB1B) or Bub3 (BUB3) based on senescence-associated β-galactosidase staining (Figure S4I), although tissues from a mouse carrying a hypomorphic allele of BubR1 exhibit senescence (Baker et al., 2004). Similarly, cells grown in the presence of an inhibitor for the checkpoint kinase Mps1 for 4 days were negative for senescence-associated β-galactosidase activity and proliferated efficiently (Figures 7J and S4J), despite exhibiting significant levels of chromosome mis-segregation (Figure S4K). These perturbations reveal that bypass of the spindle assembly checkpoint and the ensuing chromosome mis-segregation is not sufficient to induce widespread senescence in this time frame.
Overall, our parallel analyses of the role of p53 in response to a broad panel of knockouts underline the diverse molecular mechanisms that modulate the p53-dependent response to cell-cycle defects.
DISCUSSION
A Collection of Inducible and Stable CRISPR/Cas9 Knockout Cell Lines and Associated Analyses
Defining the mechanisms that ensure the accurate transmission of the cellular contents to daughter cells is a critical goal of biological research, as defects in this process contribute to developmental defects and disease (Hanahan and Weinberg, 2011; Holland and Cleveland, 2009). To facilitate these studies, we generated a collection of inducible CRISPR/Cas9-based knockout cell lines targeting 209 representative genes required for cell-cycle processes. As cell-cycle defects are readily visualized at the single-cell level, we analyzed this collection microscopically and report the phenotypes as categorical designations, with a complete collection of images available at http://cellcycleknockouts.wi.mit.edu/.
Our work generated 434 inducible HeLa knockout cell lines for the analysis of cell-cycle functions (Table S1). We also generated and characterized inducible Cas9 cell lines across several commonly used cell backgrounds: hTERT-RPE1, DLD1, and U2OS (Table S1). The use of CRISPR-based knockouts, as opposed to traditional RNAi-based approaches, will be of particular value in those cell lines where long-term robust depletion is necessary to observe the resulting phenotypes. Collectively, these inducible knockout cell lines (Table S1) will facilitate further targeted, in-depth analyses of the phenotypes of genes of interest, including for cell-based phenotypes that were not assessed in our analysis, such as spindle positioning or the localization of specific reporter proteins. In addition, the inducible knockouts can be modified with transgenes in which the sequence complementary to the sgRNA is mutated to prevent cutting. This will allow for the precise analysis of the molecular underpinnings of the reported phenotypes by facilitating a robust genetic replacement strategy (for example, see McKinley et al., 2015). Finally, our work generated several cell lines in which target proteins are stably eliminated, demonstrating that these proteins are not essential for viability or proliferation in cell culture. These cell lines will be broadly useful for further functional analyses of these targets.
The p53 Pathway Modulates Phenotypic Manifestation through Separable Mechanisms
By analyzing a panel of knockouts across numerous different cell lines, we found that the p53 pathway plays a critical role in modulating the phenotypic severity of a wide variety of cell-cycle defects. By analyzing the upstream and downstream effectors of p53 signaling across a panel of cell-cycle defects, we found that the signals and responses vary depending on the origin of the defect. Previous work has demonstrated that DNA damage, cytokinesis failure, centriole duplication failure, extended mitotic duration, and chromosome mis-segregation induced by transient pharmacological disruption of microtubules induce a p53-mediated cell-cycle arrest (Andreassen et al., 2001; Fujiwara et al., 2005; Hinchcliffe et al., 2016; Lambrus et al., 2015; Thompson and Compton, 2010; Uetake and Sluder, 2010; Wong et al., 2015). We found that a subset of our knockouts induces p53-dependent senescence through these pathways, and that the molecular players that effect these responses are separable. We also identified a unique arrest behavior in response to elimination of the kinetochore protein KNL1 that does not depend on these previously defined pathways. Additionally we defined a subset of knockouts for which p53 accelerates the manifestation of phenotypes by broadly affecting cellular proliferation rate, potentially enhancing the rate of protein depletion. Finally, we defined a subset of knockouts that displayed severe mitotic defects in our assays regardless of p53 proficiency (Figure 6C). We also found that pharmacological or genetic bypass of the spindle assembly checkpoint did not induce senescence, despite causing widespread chromosome mis-segregation (Figures S4I, S4J, and S4K). This suggests that chromosome mis-segregation alone is not sufficient to induce a strong arrest in this time frame. Taken together, these data not only underscore the biological function of p53 in suppressing specific defects that contribute to genomic instability, but also reveal the diversity of mechanisms by which this suppression occurs.
Together, these reagents and analyses provide a toolkit for defining the functional underpinnings of cell-cycle processes and a model for large-scale microscopic analyses using CRISPR/Cas9-mediated approaches, and reveal paradigms for the role of p53 signaling in monitoring and responding to cell-cycle defects.
STAR★METHODS
KEY RESOURCES TABLE
| Reagent or Resource | Source | Identifier |
|---|---|---|
| Antibodies | ||
| Tubulin (DM1a) Conjugated to FITC | Sigma | CAT#: F2168-.5ML |
| Tubulin (DM1a) Unconjugated | Sigma | CAT#: T9026-.5ML |
| Centrin2 | Cheeseman lab (Backer et al., 2012) | NA |
| EB1 | BD Biosciences | CAT#: 610535; RRID: AB_397892 |
| EB1 | Santa Cruz | CAT#: Sc-15347; RRID: AB_2141629 |
| Mis12 Complex | Cheeseman lab | NA |
| CENP-F | Abcam | CAT#: ab90; RRID: AB_306929 |
| P21 | Abcam | CAT#: ab109520; RRID: AB_10860537 |
| H2AX Phospho-S139 | Millipore | CAT#: Clone JBW309 |
| YAP | Santa Cruz | CAT#: Clone 63.7 |
| KNL1 N terminus | Yanagida lab (Kiyomitsu et al., 2007) | NA |
| KNL1 Central Region | (Cheeseman et al., 2008) | NA |
| Ndc80-Bonsai | Cheeseman lab (Schmidt et al., 2012) | NA |
| Anti-centromere Antibodies | Antibodies, Inc. | CAT#: 15-234-0001 |
| Chemicals, Peptides, and Recombinant Proteins | ||
| Centrinone | Oegema lab (Wong et al., 2015) | NA |
| Etoposide | EMD Millipore | CAT#: 341205 |
| VE-821 | Selleck | CAT#: S8007 |
| Caffeine | Sigma | CAT#: C0750 |
| AZ-3146 | Tocris | CAT#: 3994 |
| Okadaic acid | VWR | CAT#: AAJ60155-EXS |
| Nocodazole | Sigma | CAT#: M1404 |
| Doxycycline hyclate | Sigma | CAT#: D9891 |
| Critical Commercial Assays | ||
| CellTiter-Glo | Fisher | CAT#: PRG7572 |
| Experimental Models: Cell Lines | ||
| Please see Table S1 | ||
| Recombinant DNA | ||
| sgRNA plasmids and vectors used to generate cell lines in Table S1 are available at Addgene | This study | NA |
CONTACT FOR REAGENT AND RESOURCE SHARING
Further information and requests for resources and reagents should be directed to and will be fulfilled by the Lead Contact, Iain Cheeseman, icheese@wi.mit.edu.
EXPERIMENTAL MODEL AND SUBJECT DETAILS
Human tissue culture cell lines used in this study are described in Table S1. Cells were cultured in DMEM +10% tetracycline-free fetal bovine serum (FBS; Hyclone), penicillin/streptomycin and 2 mM L-glutamine.
METHOD DETAILS
Cell Culture and Small Molecules
We note that the inducible knockout cell lines can be maintained indefinitely in the absence of doxycycline, indicating that there is no appreciable spurious cutting through leakiness of the Cas9. The inducible Cas9 hTERT-RPE1, U2OS-lacO and DLD1-osTIR1 cell lines were generated by transposition as described previously for the inducible Cas9 HeLa cell line (McKinley et al., 2015), and are neomycin resistant. Single guide RNAs (sgRNAs) designed using crispr.mit.edu and cloned into pLenti-sgRNA (puromycin resistant) (McKinley et al., 2015) or pKM808 (blasticidin resistant) were introduced into inducible Cas9 cell lines by lentiviral transduction (Wang et al., 2015). The NDE1/NDEL1 Cas9 double inducible knockout cell line was created by cloning two single guide RNAs under U6 promoters from pLenti-sgRNA and GuideX (a gift from Chikdu Shivalila and Rudolf Jaenisch, WIBR/MIT) into HP138-puro, and introducing the construct into HeLa-Cas9 cells by transposition with HP137 as for Cas9. Cas9 was induced using 1 μg/mL doxycycline hyclate (Sigma) at 24 hr intervals for 3 days (with analysis on the fourth day) unless otherwise indicated. To generate stable cell lines eliminating non-essential genes, we induced the knockouts of interest with doxycycline as above for 4–12 days before single-cell sorting. Cells were then expanded in the absence of doxycycline to avoid the generation of any heterogeneity due to additional cutting, and clones screened by immunofluorescence and Western blotting.
For proliferation assays, cell counting was performed using a Z2 Coulter Counter (Beckman Coulter). For fluorescence cell viability assays, cells were plated in black-walled 96-well plates at 1,000 cells per well on day −1, and the indicated concentrations of no-codazole added at day 0. Viability was assayed at day 3 using CellTiter-Glo (Promega) according to manufacturer’s instructions, and detected using a SpectraMax M5 Microplate Reader (Molecular Devices).
Small molecules were added at the following concentrations: Centrinone (a gift from Karen Oegema and Arshad Desai; Wong et al., 2015): 200 nM (HeLa cells) or 150 nM (RPE1 cells), etoposide: 5 μM, caffeine: 5 mM, VE-821: 2 μM, AZ-3146 (Mps1 inhibitor): 2 μM, Okadaic acid: 4 nM, nocodazole: 330 nM unless otherwise specified.
Western Blotting, Immunofluorescence, Beta-Galactosidase Detection, Microscopy and Flow Cytometry Analysis
Antibodies used for Western blotting and immunofluorescence are described in Table S6. For Western blotting analysis of MAPRE1 knockout cells 12% SDS-PAGE gels were used, and for CENPF knockout cells 8% SDS-PAGE gels were used. Western blotting was performed after overnight transfer using 3% bovine serum albumin (BSA; Sigma) in TBS +0.5% Tween-20 as a blocking agent.
For immunofluorescence, fixation was performed for each antibody as described in Table S6. DNA was stained with 10 μg/mL Hoechst-33342 (Sigma). Immunofluorescence images were acquired on a DeltaVision Core deconvolution microscope (Applied Precision/General Electric) equipped with a CoolSnap HQ2 CCD camera and deconvolved where appropriate. In general, 25 Z-sections were acquired at 0.2 μm steps using a 60×, 1.42 NA Olympus U-PlanApo objective. For anti-centrin2 immunofluorescence, 40 0.2 μm steps were imaged using a 100×, 1.4 Numerical Aperture (NA) Olympus U-PlanApo objective. Quantification of fluorescence intensity was conducted on unprocessed images using Metamorph (Molecular Devices). The senescence-associated beta-galactosidase staining kit (Cell Signaling Technology) was utilized according to the manufacturer’s instructions.
For analysis of DNA content by flow cytometry, cells were fixed in 70% ethanol on ice for >15 min. Cells were subsequently incubated at 37°C for 40 min in 600 mL PBS +0.1% FBS +0.25 mg/mL RNaseA (Sigma) + 10 mg/mL propidium iodide (Life Technologies) before analysis using the BD FACSCanto II (BD Biosciences). Data were analyzed using FlowJo.
QUANTIFICATION AND STATISTICAL ANALYSIS
Details of statistical tests used to determine significance are provided in the figure legends.
ADDITIONAL RESOURCES
Representative micrographs of the HeLa inducible knockouts are provided at cellcycleknockouts.wi.mit.edu.
Supplementary Material
1
2
3
4
5
6
7
Highlights.
- Collection of inducible CRISPR knockout cell lines for analysis of cell-cycle genes
- Systematic analysis of the phenotypes associated with each knockout cell line
- Inducible knockout cell lines reveal diverse origins of spindle multipolarity
- The p53 pathway responds differentially to distinct cell-cycle defects
Acknowledgments
We thank members of the Cheeseman laboratory, Priya Budde, and Peter Reddien for critical consideration of the manuscript. We are grateful to Andy Nutter-Upham and Scott McCallum at the Whitehead Institute for creating the web interface to display the micrographs and Prat Thiru and George Bell of the Whitehead Institute Bioinformatics and Research Computing (BaRC) core for help with clustering and heatmaps. We thank Tonia Tsinman and Ian Whitney for technical assistance and Defne Yarar and Naama Kanarek for help with the CellTiter-Glo assay. This work was supported by a Scholar award to I.M.C. from the Leukemia & Lymphoma Society and grants from the NIH/National Institute of General Medical Sciences to I.M.C. (GM108718 and GM088313).
Footnotes
AUTHOR CONTRIBUTIONS
Conceptualization, K.L.M and I.M.C.; Investigation, K.L.M.; Writing, K.L.M and I.M.C.; Funding Acquisition and Supervision, I.M.C.
References
- Andreassen PR, Lohez OD, Lacroix FB, Margolis RL. Tetraploid state induces p53-dependent arrest of nontransformed mammalian cells in G1. Mol Biol Cell. 2001;12:1315–1328. doi: 10.1091/mbc.12.5.1315. [DOI] [PMC free article] [PubMed] [Google Scholar]
- Backer CB, Gutzman JH, Pearson CG, Cheeseman IM. CSAP localizes to polyglutamylated microtubules and promotes proper cilia function and zebrafish development. Mol Biol Cell. 2012;23:2122–2130. doi: 10.1091/mbc.E11-11-0931. [DOI] [PMC free article] [PubMed] [Google Scholar]
- Baker DJ, Jeganathan KB, Cameron JD, Thompson M, Juneja S, Kopecka A, Kumar R, Jenkins RB, de Groen PC, Roche P, et al. BubR1 insufficiency causes early onset of aging-associated phenotypes and infertility in mice. Nat Genet. 2004;36:744–749. doi: 10.1038/ng1382. [DOI] [PubMed] [Google Scholar]
- Bender A, Pringle JR. Use of a screen for synthetic lethal and multicopy suppressee mutants to identify two new genes involved in morphogenesis in Saccharomyces cerevisiae. Mol Cell Biol. 1991;11:1295–1305. doi: 10.1128/mcb.11.3.1295. [DOI] [PMC free article] [PubMed] [Google Scholar]
- Blomen VA, Majek P, Jae LT, Bigenzahn JW, Nieuwenhuis J, Staring J, Sacco R, van Diemen FR, Olk N, Stukalov A, et al. Gene essentiality and synthetic lethality in haploid human cells. Science. 2015;350:1092–1096. doi: 10.1126/science.aac7557. [DOI] [PubMed] [Google Scholar]
- Bomont P, Maddox P, Shah JV, Desai AB, Cleveland DW. Unstable microtubule capture at kinetochores depleted of the centromere-associated protein CENP-F. EMBO J. 2005;24:3927–3939. doi: 10.1038/sj.emboj.7600848. [DOI] [PMC free article] [PubMed] [Google Scholar]
- Brinkley BR. Managing the centrosome numbers game: from chaos to stability in cancer cell division. Trends Cell Biol. 2001;11:18–21. doi: 10.1016/s0962-8924(00)01872-9. [DOI] [PubMed] [Google Scholar]
- Caldas GV, DeLuca JG. KNL1: bringing order to the kinetochore. Chromosoma. 2014;123:169–181. doi: 10.1007/s00412-013-0446-5. [DOI] [PMC free article] [PubMed] [Google Scholar]
- Caldas GV, DeLuca KF, DeLuca JG. KNL1 facilitates phosphorylation of outer kinetochore proteins by promoting Aurora B kinase activity. J Cell Biol. 2013;203:957–969. doi: 10.1083/jcb.201306054. [DOI] [PMC free article] [PubMed] [Google Scholar]
- Campisi J, d’Adda di Fagagna F. Cellular senescence: when bad things happen to good cells. Nat Rev Mol Cell Biol. 2007;8:729–740. doi: 10.1038/nrm2233. [DOI] [PubMed] [Google Scholar]
- Carter SL, Eklund AC, Kohane IS, Harris LN, Szallasi Z. A signature of chromosomal instability inferred from gene expression profiles predicts clinical outcome in multiple human cancers. Nat Genet. 2006;38:1043–1048. doi: 10.1038/ng1861. [DOI] [PubMed] [Google Scholar]
- Cheeseman IM, Hori T, Fukagawa T, Desai A. KNL1 and the CENP-H/I/K complex coordinately direct kinetochore assembly in vertebrates. Mol Biol Cell. 2008;19:587–594. doi: 10.1091/mbc.E07-10-1051. [DOI] [PMC free article] [PubMed] [Google Scholar]
- Ferguson RL, Pascreau G, Maller JL. The cyclin A centrosomal localization sequence recruits MCM5 and Orc1 to regulate centrosome reduplication. J Cell Sci. 2010;123:2743–2749. doi: 10.1242/jcs.073098. [DOI] [PMC free article] [PubMed] [Google Scholar]
- Ferreira JG, Pereira AJ, Akhmanova A, Maiato H. Aurora B spatially regulates EB3 phosphorylation to coordinate daughter cell adhesion with cytokinesis. J Cell Biol. 2013;201:709–724. doi: 10.1083/jcb.201301131. [DOI] [PMC free article] [PubMed] [Google Scholar]
- Fong CS, Mazo G, Das T, Goodman J, Kim M, O’Rourke BP, Izquierdo D, Tsou MF. 53BP1 and USP28 mediate p53-dependent cell cycle arrest in response to centrosome loss and prolonged mitosis. Elife. 2016;5:e16270. doi: 10.7554/eLife.16270. [DOI] [PMC free article] [PubMed] [Google Scholar]
- Fujiwara T, Bandi M, Nitta M, Ivanova EV, Bronson RT, Pellman D. Cytokinesis failure generating tetraploids promotes tumorigenesis in p53-null cells. Nature. 2005;437:1043–1047. doi: 10.1038/nature04217. [DOI] [PubMed] [Google Scholar]
- Ganem NJ, Cornils H, Chiu SY, O’Rourke KP, Arnaud J, Yimlamai D, Thery M, Camargo FD, Pellman D. Cytokinesis failure triggers hippo tumor suppressor pathway activation. Cell. 2014;158:833–848. doi: 10.1016/j.cell.2014.06.029. [DOI] [PMC free article] [PubMed] [Google Scholar]
- Gascoigne KE, Takeuchi K, Suzuki A, Hori T, Fukagawa T, Cheeseman IM. Induced ectopic kinetochore assembly bypasses the requirement for CENP-A nucleosomes. Cell. 2011;145:410–422. doi: 10.1016/j.cell.2011.03.031. [DOI] [PMC free article] [PubMed] [Google Scholar]
- Godinho SA, Pellman D. Causes and consequences of centrosome abnormalities in cancer. Philos Trans R Soc Lond B Biol Sci. 2014;369 doi: 10.1098/rstb.2013.0467. pii: 20130467. [DOI] [PMC free article] [PubMed] [Google Scholar]
- Goshima G, Wollman R, Goodwin SS, Zhang N, Scholey JM, Vale RD, Stuurman N. Genes required for mitotic spindle assembly in Drosophila S2 cells. Science. 2007;316:417–421. doi: 10.1126/science.1141314. [DOI] [PMC free article] [PubMed] [Google Scholar]
- Hanahan D, Weinberg RA. Hallmarks of cancer: the next generation. Cell. 2011;144:646–674. doi: 10.1016/j.cell.2011.02.013. [DOI] [PubMed] [Google Scholar]
- Haneda M, Kojima E, Nishikimi A, Hasegawa T, Nakashima I, Isobe K. Protein phosphatase 1, but not protein phosphatase 2A, dephosphorylates DNA-damaging stress-induced phosphoserine 15 of p53. FEBS Lett. 2004;567:171–174. doi: 10.1016/j.febslet.2004.04.066. [DOI] [PubMed] [Google Scholar]
- Harrow J, Frankish A, Gonzalez JM, Tapanari E, Diekhans M, Kokocinski F, Aken BL, Barrell D, Zadissa A, Searle S, et al. GENCODE: the reference human genome annotation for the ENCODE Project. Genome Res. 2012;22:1760–1774. doi: 10.1101/gr.135350.111. [DOI] [PMC free article] [PubMed] [Google Scholar]
- Hart T, Chandrashekhar M, Aregger M, Steinhart Z, Brown KR, MacLeod G, Mis M, Zimmermann M, Fradet-Turcotte A, Sun S, et al. High-resolution CRISPR screens reveal fitness genes and genotype-specific cancer liabilities. Cell. 2015;163:1515–1526. doi: 10.1016/j.cell.2015.11.015. [DOI] [PubMed] [Google Scholar]
- Harvey M, Sands AT, Weiss RS, Hegi ME, Wiseman RW, Pantazis P, Giovanella BC, Tainsky MA, Bradley A, Donehower LA. In-vitro growth-characteristics of embryo fibroblasts isolated from p53-deficient mice. Oncogene. 1993;8:2457–2467. [PubMed] [Google Scholar]
- Hemerly AS, Prasanth SG, Siddiqui K, Stillman B. Orc1 controls centriole and centrosome copy number in human cells. Science. 2009;323:789–793. doi: 10.1126/science.1166745. [DOI] [PMC free article] [PubMed] [Google Scholar]
- Hinchcliffe EH, Day CA, Karanjeet KB, Fadness S, Langfald A, Vaughan KT, Dong Z. Chromosome missegregation during anaphase triggers p53 cell cycle arrest through histone H3.3 Ser31 phosphorylation. Nat Cell Biol. 2016;18:668–675. doi: 10.1038/ncb3348. [DOI] [PubMed] [Google Scholar]
- Holland AJ, Cleveland DW. Boveri revisited: chromosomal instability, aneuploidy and tumorigenesis. Nat Rev Mol Cell Biol. 2009;10:478–487. doi: 10.1038/nrm2718. [DOI] [PMC free article] [PubMed] [Google Scholar]
- Holland AJ, Fachinetti D, Han JS, Cleveland DW. Inducible, reversible system for the rapid and complete degradation of proteins in mammalian cells. Proc Natl Acad Sci USA. 2012;109:E3350–E3357. doi: 10.1073/pnas.1216880109. [DOI] [PMC free article] [PubMed] [Google Scholar]
- Holt SV, Vergnolle MA, Hussein D, Wozniak MJ, Allan VJ, Taylor SS. Silencing Cenp-F weakens centromeric cohesion, prevents chromosome alignment and activates the spindle checkpoint. J Cell Sci. 2005;118:4889–4900. doi: 10.1242/jcs.02614. [DOI] [PubMed] [Google Scholar]
- Hutchins JR, Toyoda Y, Hegemann B, Poser I, Heriche JK, Sykora MM, Augsburg M, Hudecz O, Buschhorn BA, Bulkescher J, et al. Systematic analysis of human protein complexes identifies chromosome segregation proteins. Science. 2010;328:593–599. doi: 10.1126/science.1181348. [DOI] [PMC free article] [PubMed] [Google Scholar]
- Janicki SM, Tsukamoto T, Salghetti SE, Tansey WP, Sachidanandam R, Prasanth KV, Ried T, Shav-Tal Y, Bertrand E, Singer RH, et al. From silencing to gene expression: real-time analysis in single cells. Cell. 2004;116:683–698. doi: 10.1016/s0092-8674(04)00171-0. [DOI] [PMC free article] [PubMed] [Google Scholar]
- Kastan MB, Onyekwere O, Sidransky D, Vogelstein B, Craig RW. Participation of p53 protein in the cellular response to DNA damage. Cancer Res. 1991;51:6304–6311. [PubMed] [Google Scholar]
- Kiyomitsu T, Obuse C, Yanagida M. Human Blinkin/AF15q14 is required for chromosome alignment and the mitotic checkpoint through direct interaction with Bub1 and BubR1. Dev Cell. 2007;13:663–676. doi: 10.1016/j.devcel.2007.09.005. [DOI] [PubMed] [Google Scholar]
- Lam C, Vergnolle MA, Thorpe L, Woodman PG, Allan VJ. Functional interplay between LIS1, NDE1 and NDEL1 in dynein-dependent organelle positioning. J Cell Sci. 2010;123:202–212. doi: 10.1242/jcs.059337. [DOI] [PubMed] [Google Scholar]
- Lambrus BG, Uetake Y, Clutario KM, Daggubati V, Snyder M, Sluder G, Holland AJ. p53 protects against genome instability following centriole duplication failure. J Cell Biol. 2015;210:63–77. doi: 10.1083/jcb.201502089. [DOI] [PMC free article] [PubMed] [Google Scholar]
- Lambrus BG, Daggubati V, Uetake Y, Scott PM, Clutario KM, Sluder G, Holland AJ. A USP28-53BP1-p53-p21 signaling axis arrests growth after centrosome loss or prolonged mitosis. J Cell Biol. 2016;214:143–153. doi: 10.1083/jcb.201604054. [DOI] [PMC free article] [PubMed] [Google Scholar]
- Lingle WL, Lutz WH, Ingle JN, Maihle NJ, Salisbury JL. Centrosome hypertrophy in human breast tumors: implications for genomic stability and cell polarity. Proc Natl Acad Sci USA. 1998;95:2950–2955. doi: 10.1073/pnas.95.6.2950. [DOI] [PMC free article] [PubMed] [Google Scholar]
- Liu D, Vleugel M, Backer CB, Hori T, Fukagawa T, Cheeseman IM, Lampson MA. Regulated targeting of protein phosphatase 1 to the outer kinetochore by KNL1 opposes Aurora B kinase. J Cell Biol. 2010;188:809–820. doi: 10.1083/jcb.201001006. [DOI] [PMC free article] [PubMed] [Google Scholar]
- Lu Z, Wan G, Guo H, Zhang X, Lu X. Protein phosphatase 1 inhibits p53 signaling by dephosphorylating and stabilizing Mdmx. Cell Signal. 2013;25:796–804. doi: 10.1016/j.cellsig.2012.12.014. [DOI] [PMC free article] [PubMed] [Google Scholar]
- Maiato H, Logarinho E. Mitotic spindle multipolarity without centrosome amplification. Nat Cell Biol. 2014;16:386–394. doi: 10.1038/ncb2958. [DOI] [PubMed] [Google Scholar]
- McKinley KL, Cheeseman IM. The molecular basis for centromere identity and function. Nat Rev Mol Cell Biol. 2016;17:16–29. doi: 10.1038/nrm.2015.5. [DOI] [PMC free article] [PubMed] [Google Scholar]
- McKinley KL, Sekulic N, Guo LY, Tsinman T, Black BE, Cheeseman IM. The CENP-L-N complex forms a critical node in an integrated meshwork of interactions at the centromere-kinetochore interface. Mol Cell. 2015;60:886–898. doi: 10.1016/j.molcel.2015.10.027. [DOI] [PMC free article] [PubMed] [Google Scholar]
- Meitinger F, Anzola JV, Kaulich M, Richardson A, Stender JD, Benner C, Glass CK, Dowdy SF, Desai A, Shiau AK, et al. 53BP1 and USP28 mediate p53 activation and G1 arrest after centrosome loss or extended mitotic duration. J Cell Biol. 2016;214:155–166. doi: 10.1083/jcb.201604081. [DOI] [PMC free article] [PubMed] [Google Scholar]
- Milczarek GJ, Chen W, Gupta A, Martinez JD, Bowden GT. Okadaic acid mediates p53 hyperphosphorylation and growth arrest in cells with wild-type p53 but increases aberrant mitoses in cells with non-functional p53. Carcinogenesis. 1999;20:1043–1048. doi: 10.1093/carcin/20.6.1043. [DOI] [PubMed] [Google Scholar]
- Moon HM, Youn YH, Pemble H, Yingling J, Wittmann T, Wynshaw-Boris A. LIS1 controls mitosis and mitotic spindle organization via the LIS1-NDEL1-dynein complex. Hum Mol Genet. 2014;23:449–466. doi: 10.1093/hmg/ddt436. [DOI] [PMC free article] [PubMed] [Google Scholar]
- Morgan DO. The Cell Cycle: Principles of Control. New Science Press; 2007. [Google Scholar]
- Neumann B, Held M, Liebel U, Erfle H, Rogers P, Pepperkok R, Ellenberg J. High-throughput RNAi screening by time-lapse imaging of live human cells. Nat Methods. 2006;3:385–390. doi: 10.1038/nmeth876. [DOI] [PubMed] [Google Scholar]
- Neumann B, Walter T, Heriche JK, Bulkescher J, Erfle H, Conrad C, Rogers P, Poser I, Held M, Liebel U, et al. Phenotypic profiling of the human genome by time-lapse microscopy reveals cell division genes. Nature. 2010;464:721–727. doi: 10.1038/nature08869. [DOI] [PMC free article] [PubMed] [Google Scholar]
- Nishimura K, Fukagawa T, Takisawa H, Kakimoto T, Kanemaki M. An auxin-based degron system for the rapid depletion of proteins in nonplant cells. Nat Methods. 2009;6:917–922. doi: 10.1038/nmeth.1401. [DOI] [PubMed] [Google Scholar]
- Nishino T, Takeuchi K, Gascoigne KE, Suzuki A, Hori T, Oyama T, Morikawa K, Cheeseman IM, Fukagawa T. CENP-T-W-S-X forms a unique centromeric chromatin structure with a histone-like fold. Cell. 2012;148:487–501. doi: 10.1016/j.cell.2011.11.061. [DOI] [PMC free article] [PubMed] [Google Scholar]
- Oka Y, Varmark H, Vitting-Seerup K, Beli P, Waage J, Hakobyan A, Mistrik M, Choudhary C, Rohde M, Bekker-Jensen S, et al. UBL5 is essential for pre-mRNA splicing and sister chromatid cohesion in human cells. EMBO Rep. 2014;15:956–964. doi: 10.15252/embr.201438679. [DOI] [PMC free article] [PubMed] [Google Scholar]
- Petrovic A, Mosalaganti S, Keller J, Mattiuzzo M, Overlack K, Krenn V, De Antoni A, Wohlgemuth S, Cecatiello V, Pasqualato S, et al. Modular assembly of RWD domains on the Mis12 complex underlies outer kinetochore organization. Mol Cell. 2014;53:591–605. doi: 10.1016/j.molcel.2014.01.019. [DOI] [PubMed] [Google Scholar]
- Pfaltzgraff ER, Roth GM, Miller PM, Gintzig AG, Ohi R, Bader DM. Loss of CENP-F results in distinct microtubule related defects without chromosomal abnormalities. Mol Biol Cell. 2016;27:1990–1999. doi: 10.1091/mbc.E15-12-0848. [DOI] [PMC free article] [PubMed] [Google Scholar]
- Quintyne NJ, Reing JE, Hoffelder DR, Gollin SM, Saunders WS. Spindle multipolarity is prevented by centrosomal clustering. Science. 2005;307:127–129. doi: 10.1126/science.1104905. [DOI] [PubMed] [Google Scholar]
- Rufini A, Tucci P, Celardo I, Melino G. Senescence and aging: the critical roles of p53. Oncogene. 2013;32:5129–5143. doi: 10.1038/onc.2012.640. [DOI] [PubMed] [Google Scholar]
- Salimian KJ, Ballister ER, Smoak EM, Wood S, Panchenko T, Lampson MA, Black BE. Feedback control in sensing chromosome biorientation by the Aurora B kinase. Curr Biol. 2011;21:1158–1165. doi: 10.1016/j.cub.2011.06.015. [DOI] [PMC free article] [PubMed] [Google Scholar]
- Schmidt JC, Arthanari H, Boeszoermenyi A, Dashkevich NM, Wilson-Kubalek EM, Monnier N, Markus M, Oberer M, Milligan RA, Bathe M, et al. The kinetochore-bound Ska1 complex tracks depolymerizing microtubules and binds to curved protofilaments. Dev Cell. 2012;23:968–980. doi: 10.1016/j.devcel.2012.09.012. [DOI] [PMC free article] [PubMed] [Google Scholar]
- Shaheen R, Faqeih E, Shamseldin HE, Noche RR, Sunker A, Alshammari MJ, Al-Sheddi T, Adly N, Al-Dosari MS, Megason SG, et al. POC1A truncation mutation causes a ciliopathy in humans characterized by primordial dwarfism. Am J Hum Genet. 2012;91:330–336. doi: 10.1016/j.ajhg.2012.05.025. [DOI] [PMC free article] [PubMed] [Google Scholar]
- Shalem O, Sanjana NE, Hartenian E, Shi X, Scott DA, Mikkelsen TS, Heckl D, Ebert BL, Root DE, Doench JG, et al. Genome-scale CRISPR-Cas9 knockout screening in human cells. Science. 2014;343:84–87. doi: 10.1126/science.1247005. [DOI] [PMC free article] [PubMed] [Google Scholar]
- Silio V, McAinsh AD, Millar JB. KNL1-Bubs and RZZ provide two separable pathways for checkpoint activation at human kinetochores. Dev Cell. 2015;35:600–613. doi: 10.1016/j.devcel.2015.11.012. [DOI] [PubMed] [Google Scholar]
- Stenson PD, Ball EV, Mort M, Phillips AD, Shiel JA, Thomas NS, Abeysinghe S, Krawczak M, Cooper DN. Human gene mutation database (HGMD): 2003 update. Hum Mutat. 2003;21:577–581. doi: 10.1002/humu.10212. [DOI] [PubMed] [Google Scholar]
- Sundaramoorthy S, Vazquez-Novelle MD, Lekomtsev S, Howell M, Petronczki M. Functional genomics identifies a requirement of pre-mRNA splicing factors for sister chromatid cohesion. EMBO J. 2014;33:2623–2642. doi: 10.15252/embj.201488244. [DOI] [PMC free article] [PubMed] [Google Scholar]
- Thomas GE, Bandopadhyay K, Sutradhar S, Renjith MR, Singh P, Gireesh KK, Simon S, Badarudeen B, Gupta H, Banerjee M, et al. EB1 regulates attachment of Ska1 with microtubules by forming extended structures on the microtubule lattice. Nat Commun. 2016;7:11665. doi: 10.1038/ncomms11665. [DOI] [PMC free article] [PubMed] [Google Scholar]
- Thompson SL, Compton DA. Proliferation of aneuploid human cells is limited by a p53-dependent mechanism. J Cell Biol. 2010;188:369–381. doi: 10.1083/jcb.200905057. [DOI] [PMC free article] [PubMed] [Google Scholar]
- Tsukada T, Tomooka Y, Takai S, Ueda Y, Nishikawa S, Yagi T, Tokunaga T, Takeda N, Suda Y, Abe S, et al. Enhanced proliferative potential in culture of cells from p53-deficient mice. Oncogene. 1993;8:3313–3322. [PubMed] [Google Scholar]
- Uetake Y, Sluder G. Prolonged prometaphase blocks daughter cell proliferation despite normal completion of mitosis. Curr Biol. 2010;20:1666–1671. doi: 10.1016/j.cub.2010.08.018. [DOI] [PMC free article] [PubMed] [Google Scholar]
- van der Lelij P, Stocsits RR, Ladurner R, Petzold G, Kreidl E, Koch B, Schmitz J, Neumann B, Ellenberg J, Peters JM. SNW1 enables sister chromatid cohesion by mediating the splicing of sororin and APC2 pre-mRNAs. EMBO J. 2014;33:2643–2658. doi: 10.15252/embj.201488202. [DOI] [PMC free article] [PubMed] [Google Scholar]
- Venoux M, Tait X, Hames RS, Straatman KR, Woodland HR, Fry AM. Poc1A and Poc1B act together in human cells to ensure centriole integrity. J Cell Sci. 2013;126:163–175. doi: 10.1242/jcs.111203. [DOI] [PMC free article] [PubMed] [Google Scholar]
- Wang T, Wei JJ, Sabatini DM, Lander ES. Genetic screens in human cells using the CRISPR-Cas9 system. Science. 2014;343:80–84. doi: 10.1126/science.1246981. [DOI] [PMC free article] [PubMed] [Google Scholar]
- Wang T, Birsoy K, Hughes NW, Krupczak KM, Post Y, Wei JJ, Lander ES, Sabatini DM. Identification and characterization of essential genes in the human genome. Science. 2015;350:1096–1101. doi: 10.1126/science.aac7041. [DOI] [PMC free article] [PubMed] [Google Scholar]
- Watrin E, Demidova M, Watrin T, Hu Z, Prigent C. Sororin pre-mRNA splicing is required for proper sister chromatid cohesion in human cells. EMBO Rep. 2014;15:948–955. doi: 10.15252/embr.201438640. [DOI] [PMC free article] [PubMed] [Google Scholar]
- Wong YL, Anzola JV, Davis RL, Yoon M, Motamedi A, Kroll A, Seo CP, Hsia JE, Kim SK, Mitchell JW, et al. Cell biology. Reversible centriole depletion with an inhibitor of Polo-like kinase 4. Science. 2015;348:1155–1160. doi: 10.1126/science.aaa5111. [DOI] [PMC free article] [PubMed] [Google Scholar]
- Yu FX, Guan KL. The Hippo pathway: regulators and regulations. Genes Dev. 2013;27:355–371. doi: 10.1101/gad.210773.112. [DOI] [PMC free article] [PubMed] [Google Scholar]
Associated Data
This section collects any data citations, data availability statements, or supplementary materials included in this article.
Supplementary Materials
1
2
3
4
5
6
7