Reevaluation and Reduction of a PCR Bias Caused by Reannealing of Templates (original) (raw)
Abstract
We reevaluated the bias toward a 1:1 ratio of products in multitemplate PCR used in ecological studies and showed that the template reannealing at the annealing step would not cause the bias; however, the preferential homoduplex formation during temperature decrease from denaturation to annealing step would cause the bias.
Multitemplate PCR has been frequently used in microbial ecology to determine the microbial community structure in environmental samples. However, it has been reported that the analysis of microbial communities based on multitemplate PCR can contain wrong information on the abundance and diversity of genes (3, 6, 21). This problem is classified into two categories: bias and artifact (6).
Artifact problems can be caused by the formation of a heteroduplex and a chimera. A heteroduplex is formed in PCR by the cross-hybridization of heterologous sequences (5, 16, 20) and can give data for nonexistent genes by further analysis using cloning and sequencing (22), denaturing gradient gel electrophoresis (8, 18, 23), terminal restriction fragment length polymorphism (T-RFLP) (12), and so on (1). Intrastrand reannealing of the PCR product can also cause additional gene diversity in T-RFLP analysis (2). A chimera is formed from an incompletely extended primer (13, 17) and template switching (11, 14) during multitemplate PCR and gives artificial gene diversity.
Bias can be caused in multitemplate PCR by differences in primer binding energy (4, 9, 15) and reannealing of templates (10, 19). Reannealing of templates has been reported to cause a strong bias toward 1:1 mixtures of genes in final PCR products, regardless of the initial ratio of the templates (10, 19). The mechanism of this bias has been explained as the amplification rate of more abundant PCR products declining faster with the reannealing of PCR products than that of less abundant products in the same tube; hence, the final product concentrations are biased toward a 1:1 ratio independent of the initial template concentrations (10, 19). However, in our preliminary experiments, we did not observe this 1:1 bias in several cases. Suzuki and Giovannoni (19) reported that the PCR with low amplification efficiencies and low PCR product yields did not show bias. This result was true in our case, but even with high PCR product yields we did not observe the bias in some cases.
In this study, we reevaluated the 1:1 bias by using a real-time quantitative PCR method to monitor amplification efficiencies and the amount of PCR product. We have found that the reannealing of products at the annealing step does not cause the bias, but the preferential homoduplex formation by reannealing of the products during the decrease in temperature from the denaturation to the annealing step does cause the bias.
We prepared fluorescently labeled PCR products of bacterial 16S rRNA genes as templates. The fluorescently labeled templates were required for T-RFLP analysis, described below. First, three bacterial strains, Microbacterium imperiale DSM 20530, Pseudomonas fluorescens DSM 50108, and Agromyces mediolanus DSM 20152, were purchased from Deutsche Sammlung von Mikroorganismen und Zellkulturen (Braunschweig, Germany), and they were cultured overnight at 30°C in test tubes containing 5 ml of a medium of the following composition: 1.0% (wt/vol) casein peptone, 0.5% (wt/vol) yeast extract, 0.5% (wt/vol) glucose, and 0.5% (wt/vol) NaCl. The genomic DNA of each microbe was extracted from the cultured cells by using a DNeasy Tissue kit (QIAGEN GmbH, Hilden, Germany) according to the manufacturer's instructions. The 16S rRNA genes were then amplified by PCR from the genomic DNA with the primer pair EC27f-BODIPY FL (5′-CAGAGTTTGATCCTGGCTCAG-3′) and E1389r (5′-ACGGGCGGTGTGTACAAG-3′). All primers were supplied by Espec Oligo Service Corp (Tsukuba, Japan). The primer EC27f-BODIPY FL was designed by adding a BODIPY FL-modified cytosine to the 5′ end of primer 27f. The PCR products were purified with Microcon PCR filters (Millipore Corp., Bedford, Mass.) and were used as templates in this study. The PCR products from M. imperiale DSM 20530, P. fluorescens DSM 50108, and A. mediolanus DSM 20152 were designated Mim, Pfl, and Ame, respectively. The concentrations of the purified PCR products were measured with a Pico Green dsDNA Quantification kit (Molecular Probes, Inc.). Accession numbers of 16S rDNA sequences of M. imperiale DSM 20530, P. fluorescens DSM 50108, and A. mediolanus DSM 20152 in GenBank were X77442, AF094728, and X77449, respectively.
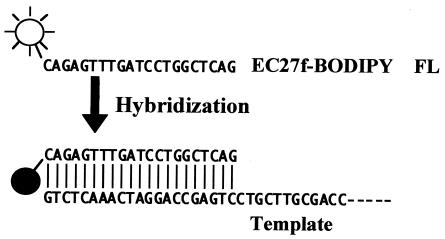
In PCR bias experiments, a quenching primer PCR method (7) was used for real-time monitoring of the amount of PCR product. This method uses a primer containing a BODIPY FL-modified cytosine at its 5′ end (Fig. 1). When such a primer is hybridized with target DNA, the fluorescence of BODIPY FL is quenched by guanine in the target complementary to modified cytosine, and the quenching rate is proportional to the amount of target DNA (7). Therefore, the amount of PCR product is calculated with the following formula: _C_product = (R/_R_max) × _C_primer, where _C_product (nanomolar concentration) is the concentration of PCR products, _C_primer (nanomolar concentration) is the initial concentration of the modified primer, R is the measured quenching rate, and _R_max is the maximum quenching rate when all primers are hybridized with the target.
FIG. 1.
Fluorescence quenching of a BODIPY FL-labeled primer.
In this study, primer EC27f-BODIPY FL was used as a quenching primer. The maximum quenching rate of this primer was determined with the LightCycler System (Roche Diagnostics) as follows. The mixture (20 μl) contained 0.5 μM primer EC27f-BODIPY FL, 2 μM complementary oligonucleotide DNA (5′-GGCAGCAGTGGGGAATATTG-3′), and 2 μl of buffer (10× rTaq buffer; Takara Shuzo Co., Ltd., Kyoto, Japan). The mixture was held at 30°C for 60 s, 72°C for 60 s, and then at 95°C for 60 s. The fluorescence intensity was 7.25, 31.6, and 26.8 (arbitrary units) at 30, 72, and 95°C, respectively. When free BODIPY FL (D-6140; Molecular Probes, Inc.) was added instead of primer EC27f-BODIPY FL, the fluorescence intensity was 46.8, 43.0, and 40.0 arbitrary units, respectively. When the target was omitted, the intensity was 17.1, 29.0, and 24.5 arbitrary units, respectively. From these values, the maximum quenching rate at 72°C at which the fluorescence intensity was measured in a real-time PCR was calculated as follows: [1 − (7.25/26.8) × (43.0/46.8) × (24.5/29.0)] × 100 = 79.0.
In PCR bias experiments, the quenching primer PCR was carried out with a LightCycler System with an initial denaturation at 95°C for 120 s followed by a cycle of denaturation at 95°C, primer annealing at 56°C, and extension at 72°C. The duration of each step and the ramp time are shown in Table 1. Templates Pfl and Ame were mixed at a ratio of 9:1, 3:1, 1:1, 1:3, or 1:9. Primers EC27f-BODIPY FL and E350r (5′-CAATATTCCCCACTGCTGCC-3′) were used in the experiments. The reaction mixture (20 μl) contained 107 molecules of mixed templates, 500 nM each primer, 2 mM MgCl2, 0.25 mg of bovine serum albumin/ml, 2 μl of reaction buffer (10× rTaq buffer), 1.6 μl of deoxynucleoside triphosphate mixture (2.5 mM each), 0.5 U of DNA polymerase (rTaq), and 0.32 μl of TaqStart antibody (Clontech Laboratories Inc., Palo Alto, Calif.). The fluorescence was measured after denaturation at 95°C and extension at 72°C in each cycle. The fluorescence quenching rate was calculated with the following formula: Rn = [1 − (_F_72, n/_F_95, n)/(_F_72, 10/_F_95, 10)] × 100, where Rn is the quenching rate in cycle n, _F_72, n is the fluorescence intensity at 72°C in cycle n, and _F_95, n is the fluorescence intensity at 95°C in cycle n. The amount of PCR product at each cycle was calculated with this quenching rate. The PCR was stopped at 40 cycles if the reaction had reached a plateau phase, because the bias has been reported to be observed in late PCR cycles (19). Otherwise, the reaction was stopped at 80 cycles, at which time the reaction had already reached a plateau phase. In separate experiments, PCR was stopped at 15, 17, 20, 24, 29, and 40 cycles, and the amount of PCR product was determined by a Pico Green dsDNA Quantification kit. The value was compared to that calculated from the quenching rate, and as a result they were almost identical (data not shown), indicating that we can know the amount of product by the quenching rate.
TABLE 1.
PCR conditions
| Condition | Denaturation at 95°C (s) | Ramp time from 95 to 56°C (s) | Annealing at 56°C (s) | Ramp time from 56 to 72°C (s) | Extension at 72°C (s) | Ramp time from 72 to 95°C (s) | Stop cycle no. | Concn of PCR producta (nM) | Biasb |
|---|---|---|---|---|---|---|---|---|---|
| A | 60 | 39 | 60 | 16 | 180 | 23 | 40 | 91.9-98.1 | + |
| B | 15 | 1.95 | 5 | 0.8 | 12 | 1.15 | 80 | 134.7-155.4 | − |
| C | 15 | 39 | 5 | 0.8 | 12 | 1.15 | 80 | 107.9-131.6 | + |
| D | 15 | 1.95 | 60 | 0.8 | 12 | 1.15 | 40 | 184.4-189.4 | − |
| E | 15 | 1.95 | 5 | 16 | 12 | 1.15 | 80 | 130.2-154.3 | − |
| F | 15 | 1.95 | 5 | 0.8 | 180 | 1.15 | 40 | 144.8-155.9 | + |
| G | 15 | 1.95 | 5 | 0.8 | 12 | 23 | 80 | 134.0-150.5 | − |
To determine the product ratio, a portion of the BODIPY FL-labeled template mixture which had been prepared for the PCR and the PCR products were subjected to T-RFLP analysis. The PCR products purified by using Microcon PCR filters and the template mixture were digested with 20 U of HhaI (Takara Shuzo Co., Ltd.) in 20 μl of reaction mixture (8 h, 37°C). After digestion, labeled fragments were separated with a PE Applied Biosystems ABI 310 (Foster City, Calif.) in GeneScan mode, which estimated the fragment size, the peak height, and the peak area of individual bands. Product ratios after amplification of mixtures containing two templates were determined by the following equation: product ratio = _M_0(h/_h_sum)/(_h_0/_h_0, sum), where _M_0 is the initial molar ratio of one template, h is the peak height of the corresponding PCR product, _h_sum is the sum of the peak heights of the two products, _h_0 is the peak height of the corresponding template in the template mixture before PCR, and _h_0, sum is the sum of the peak heights of the two templates.
Before T-RFLP analysis we examined the accuracy of this analysis, because in an ABI 310, different fragments will be differentially loaded into capillaries by electroinjection, and this may affect the quantification. We prepared an equimolar mixture of six BODIPY FL-labeled fragments having various lengths (22 to 531 bp) and applied it to the ABI 310. As a result, the longer fragment showed a greater peak area, but the peak height was nearly the same for all fragments (data not shown), as has been reported by other researchers (9). Therefore, we used the peak height for the calculation of PCR product ratios and verified the linear relationship between the molar ratio and the peak height ratio by using a mixture of the fragments at various ratios (data not shown).
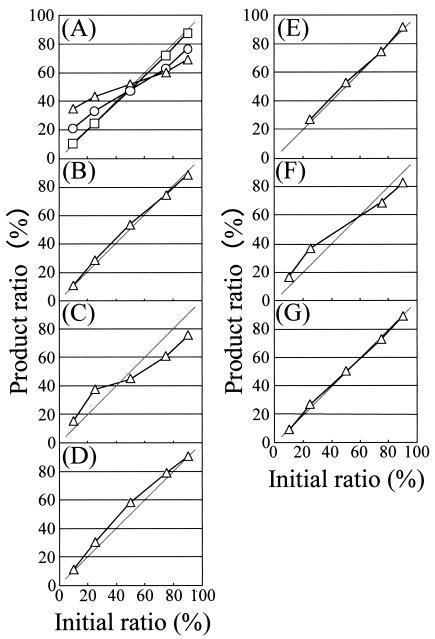
To reevaluate a PCR bias toward 1:1, we performed PCR with templates Pfl and Ame in various conditions (shown in Table 1). Condition A was similar to that in which Suzuki and Giovannoni observed PCR bias (19). The temperature ramp time in condition A is the usual time that is used when PCR is carried out in a conventional Peltier cycler with an aluminum block and plastic tubes. In condition A, the amount of PCR products increased until the 26th cycle, at which time it showed stable values (Fig. 2). PCR was carried out with several replicates and was stopped after the 13th, 19th, or 40th cycle, and then the product ratio was determined by T-RFLP (Fig. 3A). The product ratio in the 13th cycle was the same as the initial ratio. In the 19th cycle, the product ratio was biased toward a 1:1 ratio, and in the 40th cycle, the product ratio was even more biased. Thus, the PCR bias to a 1:1 ratio appeared in the late PCR cycles, as has been shown by other researchers (10, 19). The same experiment was carried out with plastic tubes and a conventional Peltier cycler. As a result, almost the same bias was observed after the 40th cycle (data not shown), indicating that the difference in reaction tubes and heating-cooling systems did not affect PCR bias.
FIG. 2.
Real-time monitoring of the amount of PCR products in condition A. PCR was carried out with several replicates and was stopped after the 13th (open square), 19th (open circle), or 40th cycle (open triangle).
FIG. 3.
Relation between initial template ratio and product ratio after PCR under various conditions. (A to G) PCR was carried out in conditions A to G, which are described in Table 1. The template for PCR was a mixture of the templates Ami and Pfl, and the ratio of Pfl to Ami is shown. (A) PCR was stopped after the 13th (open square), 19th (open circle), and 40th (open triangle) cycle, and the product ratio was analyzed.
PCR condition B is a typical condition in PCR that uses capillary glass tubes, and no bias was observed under this set of conditions (Fig. 3B). The main differences between conditions A and B are the temperature ramp time and the duration of each step, which were longer in condition A than in condition B. To identify the PCR steps causing the bias in condition A, the ramp time and duration of each step in PCR condition B were replaced one by one with those used in PCR condition A (conditions C to G in Table 1). The final amount of PCR product was almost the same in every experiment (Table 1). The PCR bias was observed in condition C when the ramp time from denaturation to annealing was longer (Fig. 3C), while no bias was observed when the ramp time from the other steps was changed (Fig. 3E and G). The amplification efficiency and the amount of PCR product were the same or slightly greater in conditions B, D, and E (Table 1) than in condition C, but there was no bias in conditions B, D, and E. This indicates that the model shown by Suzuki and Giovannoni (19) would not be sufficient to explain the bias.
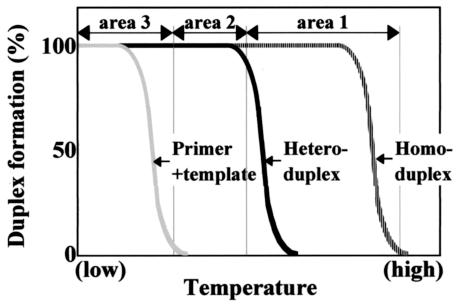
Our results indicate that the ramp time from the denaturation step to the annealing step was one of the factors behind the bias. The mechanism of this bias can be explained as follows: during the decrease in temperature from the denaturation step to the annealing step, three kinds of duplexes begin to form in the order of homoduplexes, heteroduplexes, and duplexes between primers and templates, because the thermodynamic stability of these duplexes is in this order. Here we divided the temperature area into areas 1, 2, and 3 (Fig. 4). We defined each area as follows: in area 1, homoduplexes are preferentially formed; in area 2, both homoduplexes and heteroduplexes are formed at similar rates of possibility; in area 3, three kinds of duplexes are formed. In PCR condition C (Table 1), the ramp time from the denaturation step to the annealing step was 20 times longer than that in condition B. This means that the reaction mixture stayed 20 times longer in area 1 in condition C, and therefore higher amounts of homoduplexes were formed in condition C. The homoduplex formation occurs more frequently within more abundant PCR products than within less abundant products, and therefore the decreasing rate of single strands is be higher in more abundant products, as suggested by Suzuki and Giovannoni (19). This leads to the bias toward a 1:1 ratio. In areas 2 and 3, both homoduplexes and heteroduplexes are formed at similar rates of possibility, and the decreasing rate of single strands is the same for all PCR products. Therefore, it is not likely that homoduplex and heteroduplex formation in areas 2 and 3 cause the bias.
FIG. 4.
Conceptional diagram of temperature areas 1, 2, and 3.
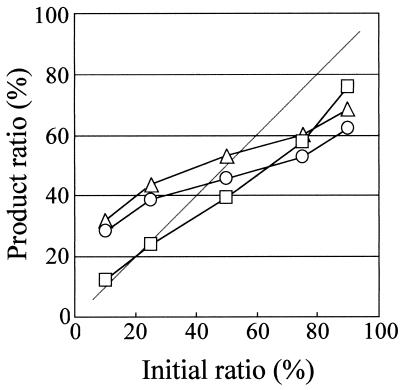
To verify this hypothesis, we chose two templates among Ame, Pfl, and Mim and amplified them in PCR condition A. The sequence similarity between Ame and Pfl, Pfl and Mim, and Ame and Min were 64.3, 65.4, and 87.6%, respectively. This means that the temperature for heteroduplex formation in Ame plus Pfl and Pfl plus Mim is lower than that in Ame plus Min; hence, the duration spent in area 1 during temperature decrease from the denaturation step to the annealing step is longer for Ame plus Pfl and Pfl plus Mim. As a result, the bias in the amplification of Ame plus Pfl and Pfl plus Mim was greater than that of Ame plus Min, as expected (Fig. 5). This result supports our hypothesis.
FIG. 5.
Relation between initial template ratio and product ratio when the pair of templates were Ame plus Pfl (open triangle), Min plus Pfl (open circle), and Ame plus Min (open square).
The PCR bias was also observed in condition F, in which the extension time was long (180 s). The mechanism of this bias is puzzling.
Our experimental results showed that reannealing of PCR products at the annealing step would not cause the bias. Rather, preferential homoduplex formation due to reannealing of PCR products during the decrease in temperature from the denaturation step to the annealing step caused this bias.
Our experiments suggest that the way to minimize PCR bias toward a 1:1 ratio is to set the fastest ramp rate from the denaturation step to the annealing step, using PCR machines with a fast ramp rate. However, this may enhance the formation of heteroduplexes when PCR reaches plateau phase (16). The heteroduplexes will not cause bias in PCR but will give artificial gene diversity by further analysis (6). In such cases, elimination of heteroduplexes after PCR will be needed (16, 20).
The elucidation of the mechanism of PCR bias and artifact would be very important for improving the accuracy of microbial community analysis based on multitemplate PCR. Our findings will contribute to reducing PCR bias toward a 1:1 ratio.
REFERENCES
- 1.Chandler, D. P., J. K. Fredrickson, and F. J. Brockman. 1997. Effect of PCR template concentration on the composition and distribution of total community 16s rDNA clone libraries. Mol. Ecol. 6**:**475-482. [DOI] [PubMed] [Google Scholar]
- 2.Egert, M., and M. W. Friedrich. 2003. Formation of pseudo-terminal restriction fragments, a PCR-related bias affecting terminal restriction fragment length polymorphism analysis of microbial community structure. Appl. Environ. Microbiol. 69**:**2555-2562. [DOI] [PMC free article] [PubMed] [Google Scholar]
- 3.Head, I. M., J. R. Saunders, and R. W. Pickup. 1998. Microbial evolution, diversity, and ecology: a decade of ribosomal RNA analysis of uncultivated microorganisms. Microb. Ecol. 35**:**1-21. [DOI] [PubMed] [Google Scholar]
- 4.Ishii, K., and M. Fukui. 2001. Optimization of annealing temperature to reduce bias caused by a primer mismatch in multitemplate PCR. Appl. Environ. Microbiol. 67**:**3753-3755. [DOI] [PMC free article] [PubMed] [Google Scholar]
- 5.Jensen, M. A., and N. Straus. 1993. Effect of PCR conditions on the formation of heteroduplex and single-stranded DNA products in the amplification of bacterial ribosomal DNA spacer regions. PCR Methods Appl. 3**:**186-194. [DOI] [PubMed] [Google Scholar]
- 6.Kanagawa, T. 2003. Bias and artifacts in multitemplate polymerase chain reactions (PCR). J. Biosci. Bioeng. 96**:**317-323. [DOI] [PubMed] [Google Scholar]
- 7.Kurata, S., T. Kanagawa, K. Yamada, M. Torimura, T. Yokomaku, Y. Kamagata, and R. Kurane. 2001. Fluorescent quenching-based quantitative detection of specific DNA/RNA using a BODIPY FL-labeled probe or primer. Nucleic Acids Res. 29**:**E34. [DOI] [PMC free article] [PubMed] [Google Scholar]
- 8.Liu, W.-T., C.-L. Huang, J. Y. Hu, L. Song, S. L. Ong, and W. J. Ng. 2002. Denaturing gradient gel electrophoresis polymorphism for rapid 16s rDNA clone screening and microbial diversity study. J. Biosci. Bioeng. 93**:**101-103. [Google Scholar]
- 9.Lueders, T., and M. W. Friedrich. 2003. Evaluation of PCR amplification bias by terminal restriction fragment length polymorphism analysis of small-subunit rRNA and mcrA genes by using defined template mixtures of methanogenic pure cultures and soil DNA extracts. Appl. Environ. Microbiol. 69**:**320-326. [DOI] [PMC free article] [PubMed] [Google Scholar]
- 10.Mathieu-Daude, F., J. Welsh, T. Vogt, and M. McClelland. 1996. DNA rehybridization during PCR: the 'Cot effect' and its consequences. Nucleic Acids Res. 24**:**2080-2086. [DOI] [PMC free article] [PubMed] [Google Scholar]
- 11.Odelberg, S. J., R. B. Weiss, A. Hata, and R. White. 1995. Template-switching during DNA synthesis by Thermus aquaticus DNA polymerase I. Nucleic Acids Res. 23**:**2049-2057. [DOI] [PMC free article] [PubMed] [Google Scholar]
- 12.Osborn, A. M., E. R. B. Moore, and K. N. Timmis. 2000. An evaluation of terminal-restriction fragment length polymorphism (T-RFLP) analysis for the study of microbial community structure and dynamics. Environ. Microbiol. 2**:**39-50. [DOI] [PubMed] [Google Scholar]
- 13.Pääbo, S., D. M. Irwin, and A. C. Wilson. 1990. DNA damage promotes jumping between templates during enzymatic amplification. J. Biol. Chem. 265**:**4718-4721. [PubMed] [Google Scholar]
- 14.Patel, R., C. Lin, M. Laney, N. Kurn, S. Rose, and E. F. Ullman. 1996. Formation of chimeric DNA primer extension products by template switching onto an annealed downstream oligonucleotide. Proc. Natl. Acad. Sci. USA 93**:**2969-2974. [DOI] [PMC free article] [PubMed] [Google Scholar]
- 15.Polz, M. F., and C. M. Cavanaugh. 1998. Bias in template-to-product ratios in multitemplate PCR. Appl. Environ. Microbiol. 64**:**3724-3730. [DOI] [PMC free article] [PubMed] [Google Scholar]
- 16.Qiu, X., L. Wu, H. Huang, P. E. McDonel, A. V. Palumbo, J. M. Tiedje, and J. Zhou. 2001. Evaluation of PCR-generated chimeras, mutations, and heteroduplexes with 16S rRNA gene-based cloning. Appl. Environ. Microbiol. 67**:**880-887. [DOI] [PMC free article] [PubMed] [Google Scholar]
- 17.Shuldiner, A. R., A. Nirula, and J. Roth. 1989. Hybrid DNA artifact from PCR of closely related target sequences. Nucleic Acids Res. 17**:**4409. [DOI] [PMC free article] [PubMed] [Google Scholar]
- 18.Speksnijder, A. G., G. A. Kowalchuk, S. De Jong, E. Kline, J. R. Stephen, and H. J. Laanbroek. 2001. Microvariation artifacts introduced by PCR and cloning of closely related 16S rRNA gene sequences. Appl. Environ. Microbiol. 67**:**469-472. [DOI] [PMC free article] [PubMed] [Google Scholar]
- 19.Suzuki, M. T., and S. J. Giovannoni. 1996. Bias caused by template annealing in the amplification of mixtures of 16S rRNA genes by PCR. Appl. Environ. Microbiol. 62**:**625-630. [DOI] [PMC free article] [PubMed] [Google Scholar]
- 20.Thompson, J. R., L. A. Marcelino, and M. F. Polz. 2002. Heteroduplexes in mixed-template amplifications: formation, consequence and elimination by ‘reconditioning PCR’. Nucleic Acids Res. 30**:**2083-2088. [DOI] [PMC free article] [PubMed] [Google Scholar]
- 21.von Wintzingerode, F., U. B. Gobel, and E. Stackebrandt. 1997. Determination of microbial diversity in environmental samples: pitfalls of PCR-based rRNA analysis. FEMS Microbiol. Rev. 21**:**213-229. [DOI] [PubMed] [Google Scholar]
- 22.Wu, J.-H., W.-T. Liu, I.-C. Tseng, and S.-S. Cheng. 2001. Characterization of a 4-methylbenzoate-degrading methanogenic consortium as determined by small-subunit rDNA sequence analysis. J. Biosci. Bioeng. 91**:**449-455. [DOI] [PubMed] [Google Scholar]
- 23.Yoshie, S., N. Noda, T. Miyano, S. Tsuneda, A. Hirata, and Y. Inamori. 2001. Microbial community analysis in the denitrification process of saline-wastewater by denaturing gradient gel electrophoresis of PCR-amplified 16s rDNA and the cultivation method. J. Biosci. Bioeng. 92**:**346-353. [DOI] [PubMed] [Google Scholar]


