Lack of delta waves and sleep disturbances during non-rapid eye movement sleep in mice lacking α1G-subunit of T-type calcium channels (original) (raw)
Abstract
T-type calcium channels have been implicated as a pacemaker for brain rhythms during sleep but their contribution to behavioral states of sleep has been relatively uncertain. Here, we found that mice lacking α1G T-type Ca2+ channels showed a loss of the thalamic delta (1–4 Hz) waves and a reduction of sleep spindles (7–14 Hz), whereas slow (<1 Hz) rhythms were relatively intact, when compared with the wild-type during urethane anesthesia and non-rapid eye movement (NREM) sleep. Analysis of sleep disturbances, as defined by the occurrence of brief awakening (BA) episodes during NREM sleep, revealed that mutant mice exhibited a higher incidence of BAs of >16 sec compared with the wild-type, whereas no difference was seen in BAs of <16 sec between the two genotypes. These results are consistent with the previous idea of the distinct nature of delta oscillations and sleep spindles from cortically generated slow waves. These results also suggest that the α1G-subunit of T-type calcium channels plays a critical role in the genesis of thalamocortical oscillations and contributes to the modulation of sleep states and the transition between NREM sleep and wake states.
Keywords: electroencephalogram, oscillations, thalamus
The enhanced excitability of thalamic neurons after membrane hyperpolarization, so-called low-threshold spikes (LTS), was demonstrated as an intrinsic property of the neurons (1–4). Studies using thalamic slices showed that Ca2+-dependent low-threshold currents (IT) mediated by T-type Ca2+ channels underlie the LTS (5–7). The possible role of T-type Ca2+ channels to sleep regulation has been suggested because the LTS are predominantly found in the thalamus during non-rapid eye movement (NREM) sleep, but absent during wakefulness and rapid eye movement (REM) sleep (8).
It has been an open question as to what extent T-type Ca2+ channels contribute to the heterogeneity of NREM sleep, which consists of multiple electroencephalogram (EEG) components such as slow waves (<1 Hz), delta waves (1–4 Hz), and sleep spindles (7–14 Hz). The genesis of spindle waves is known to be modulated by the LTS in the reciprocal networks between inhibitory thalamic reticular (nRT) neurons and excitatory thalamic relay (TC) neurons (9–11). The delta waves originating from the thalamus have a clock-like pattern and are mediated by the interaction between IT and hyperpolarization-induced inward currents (IH) in TC neurons (12–15). There have also been cortically generated delta waves found in thalamectomized cats (16), which are known to be associated with firing probability, depending on afterhyperpolarizations in pyramidal neurons (17–19). The slow waves, on the other hand, have a distinct nature that is different from the other two sleep oscillations, because they are cortically initiated during anesthesia and natural sleep (10, 11, 16, 20) and can be induced in cortical slices without thalamus in vitro (21).
Another issue on T-type Ca2+ channels in sleep regulation is their role in controlling the level of vigilance to external sensory stimuli (22). It has been suggested that the LTS causes longer refractoriness and spike adaptations (5), thereby leading to the deprivation of sensory signals from the outside world (23, 24). This idea is supported by the fact that the increase of burst sequences in TC neurons inhibits the flow of sensory signals to the cortex in vitro and in vivo (25–28). However, it has been uncertain whether the T-type Ca2+ channels are involved in the control of sleep–wake transition that could affect the quality of sleep.
To confirm the role of T-type Ca2+ channels in vivo in the genesis of heterogeneous sleep oscillations and the regulation of behavioral sleep states, we used mice lacking the α1G-subunit of T-type calcium channels, in which we previously reported that LTS of the TC neurons were absent (29). Here, we demonstrate that by using these mutant mice the α1G-subunit of T-type calcium channels is critical for the genesis of sleep spindles and delta oscillations in the natural NREM sleep without affecting slow oscillations. Furthermore, the mutant experiences sleep disturbances, as defined by the increased occurrence of brief awakenings (BAs) during NREM sleep, while their REM sleep remains normal.
Methods
Breeding of T-type Ca2+ Channel α1G–/–-Deficient Mice. α1G null mutation was maintained in two genetic backgrounds, either 129/sv or C57BL/6J. Heterozygote mutants obtained from chimera were backcrossed into each genetic background more than eight times (≥ N8). The hybrid F1 α1G–/– and their wild-type littermate control mice were generated by mating heterozygotes from each of the two genetic backgrounds (129/sv and C57BL/6J). Mice were maintained with free access to food and water under a 12-h light/12-h dark cycle, with the light cycle beginning at 6:00 a.m. Animal care and handling were carried out following Korea Institute of Science and Technology guidelines.
Thalamic Slice Experiments. Intracellular recording to examine the intrinsic firing patterns and refractoriness was performed in the ventral posterior lateral/ventral posterior medial neurons as described (29). (For detailed methodology, see Supporting Methods, which is published as supporting information on the PNAS web site.)
Acute EEG Monitoring Under Anesthesia. Twelve- to 14-week-old male mice were prepared for acute monitoring of EEG signals. The implantation procedure was performed under 0.2% avertin anesthesia (20 ml/kg, i.p.). An epidural electrode for EEG recording was implanted in the parietal lobe and a grounding electrode was implanted in the occipital region of the skull. Urethane was administrated systemically at high dose (2 mg/kg) or low dose (1 mg/kg) into the peritoneal cavity of the animals. Four animals for each genotype were used at high and low dose, respectively.
Chronic EEG/Electromyogram (EMG) Monitoring. Twelve- to 14-week-old male mice (n = 7 for each genotype) were used for chronic monitoring of EEG/EMG signals. The surgical procedure for electrode implantation was identical as described in acute EEG monitoring. For EMG signal recording, a Tefloncoated tungsten electrode was inserted into the nuchal musculature and grounded with a wound clip for the suture. After a 1-week recovery, mice were placed in unrestraining, chronic recording environments on a 12-h light/12-h dark schedule. A light-weight cable was attached to the animal's connector, and mice were adapted to the recording systems for 10–14 days. EEG and EMG signals were amplified (F14-EET, Data Science International, Arden Hills, MN) and low-pass-filtered at 100 Hz for EEG and high-pass-filtered at 10 Hz for EEG and digitized at a sampling rate of 250 Hz. Data were continuously acquired for a period of 48 h on by using dataquest a.r.t. 2.2 (Data Science International). After collection, EEG/EMG records were scored semiautomatically by using a sleepsign software sleep scoring system (Kissei Comtec America, Irvine, CA) into 4-sec epochs as Awake, REM, and NREM on the basis of standard criteria of rodent sleep (30). This preliminary scoring was visually inspected and corrected when appropriate.
Power Spectral Analysis. EEG spectral power was calculated in 0.25-Hz bins by using fast Fourier transformation (Hamming window) of each 4-sec epoch. Sets of 36 consecutive epochs, 18 from the second hour after lights on, and 18 from the second hour after lights off, chosen to represent each state of arousal and consisted of uncontaminated Awake, REM, or NREM sleep. Power in the 0.25–25 Hz range of artifact-free epochs was averaged in groups across each behavioral state, and the mean values were plotted in 0.25-Hz bins.
Statistical Analysis. Differences between vigilance-state data for the mutant and the wild-type mice were analyzed by repeated measure ANOVA, followed by Tukey's post hoc test (sas version 8, SAS Institute, Cary, NC) was used to analyze the data for differences between genotypes. Student's t test was performed for other data analysis.
Results
Effect of α1G Null Mutation on Intrinsic Firing Patterns and Refractoriness. In the previous study, we showed that loss of IT caused the absence of LTS bursts in α1G–/– TC neurons (29). Hyperpolarization/LTS-sequences are known to induce a refractory period (170–200 ms), which is relevant to patterning oscillations in thalamocortical networks (5). Therefore, we examined the effect of hyperpolarization on intrinsic properties of neurons in thalamic slices. Arbitrary single spikes were tonically evoked by increasing the membrane potential with a DC (+) current injection. Then hyperpolarizing currents were injected to evoke burst firings that were followed by a refractory period in the thalamocortical relay neurons. In wild-type neurons, we observed a longer refractory period before the appearance of tonic spikes, compared with the α1G–/– neurons (see Fig. 6_A_, which is published as supporting information on the PNAS web site). In addition, when we compared the interspike intervals of the first three spikes after a refractory period, we observed significantly longer interspike intervals in the wild-type compared with the α1G–/– neurons (ANOVA, P < 0.01) (see Fig. 6_B_). These results indicate that α1G T-type Ca2+ channels are responsible for the generation of refractory period (<400 msec) in TC neurons.
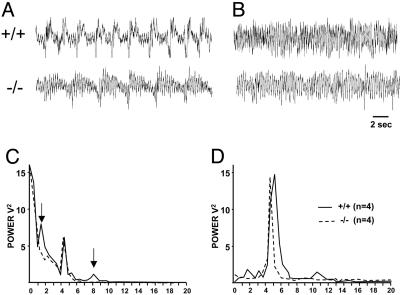
Lack of Delta and Spindle Oscillations in α1G–/– Mice Under Urethane Anesthesia. To examine the effect of the α1G null mutation on brain rhythms, we first measured EEG patterns from a mouse under urethane anesthesia (1 or 2 mg/kg, i.p.), which is known to generate sleep oscillations (31). The high dose of urethane (2 mg/kg) evoked sleep oscillations such as slow rhythms, delta waves, and spindles in wild-type animals (Fig. 1_A_). In the α1G–/– mice, however, the administration of urethane did not induce the delta band activities, 1–4 Hz (Fig. 1_C_). The higher frequency waves (8–10 Hz), corresponding to spindle waves, were also absent in the power spectral density in the mutant animals (Fig. 1_C_). Under a systemic injection of low-dose urethane (1 mg/kg) or after a physical stimulation by tail pinching at the high dose (2 mg/kg), EEG displayed turned to higher-frequency activities, prominently at the frequency of 4–7 Hz (Fig. 1_D_), as those shown in natural REM sleep. These results indicate that the genesis of delta and spindle waves under anesthesia was affected by the null mutation of α1G.
Fig. 1.
Power spectral density at delta waves are diminished in α1G–/– mice compared with α1G+/+ mice under urethane anesthesia. Sample traces illustrate EEG under a systemic injection of a high dose (2 mg/kg, i.p.) (A) and after tail pinch or a low dose (1 mg/kg, i.p.) of urethane (B) in α1G+/+ (Upper) and α1G–/– (Lower) mice. Power spectral densities of EEG for each condition (C and D) are expressed as mean ± SEM (mV2/Hz), averaged for wild-type mice (n = 4) and mutant mice (n = 4) at 0.25-Hz bins. Note that the power density at the low frequencies (1–4 Hz) and the higher frequencies (8–10 Hz) in α1G–/– mice (dotted line), indicated by the arrows is significantly reduced under highdose administration of urethane compared with the wild-type animals (solid line) (C).
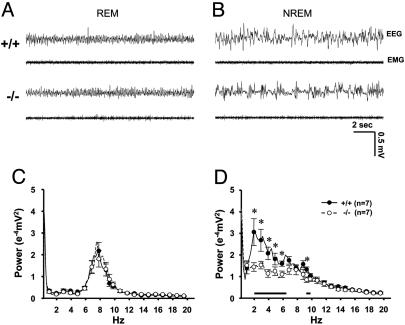
Loss of Delta Band Oscillations in NREM Sleep States of the α1G Mutant. Next, we examined the effect of the α1G mutation on EEG during natural sleep. EEG recordings obtained from mice were analyzed according to two different sleep states, REM and NREM, as described (32). Fig. 2 A and B shows sample traces of EEG during REM and NREM sleep states, respectively, from wild-type and α1G–/– mice. The absolute EEG power spectral density values in the range of 0.25–20 Hz computed for REM and wake states did not significantly differ between α1G–/– mice and wild-type littermates (Fig. 2_C_ and data not shown for wake states). Power spectral density at 6–9 Hz, the frequency range of the theta band, was prevalent in REM sleep, and the 4–9 Hz broad theta band was dominant in wake states in both genotypes (data not shown). During NREM sleep, however, a clear difference in the EEG power spectra was observed between the two genotypes. In α1G–/– mice, the power density in the low frequencies, including the delta band (2–6.5 Hz), was significantly reduced when compared with those in wild-type littermates (P < 0.05 by Student's t test) (Fig. 2D), whereas both α1G–/– and wild-type mice showed similar power in the range of slow frequencies, <1 Hz (Fig. 2_D_). In addition, the higher frequencies around spindles (9.5–10 Hz) was significantly reduced in α1G–/– mice (P < 0.05 by Student's t test).
Fig. 2.
EEG power density at delta waves was decreased in α1G–/– mice compared with α1G+/+ mice during NREM sleep. Sample traces shows the EEG and EMG signals recorded from REM (A) and NREM (B) sleep states in α1G+/+ (Upper) and α1G–/– (Lower) mice. Data include 36 consecutive artifact-free epochs for each state during a 24-h period (See Methods for details). Power spectral densities of EEG from REM (C) and NREM (D) sleep states are expressed as mean ± SEM (mV2/Hz), averaged for wild-type mice (n = 7) and mutant mice (n = 7) at 0.25-Hz bins. Error bars are plotted at every fourth bin. Asterisks and horizontal black bars in the graph of the NREM power spectrum indicate the frequencies with significant difference (2–6.5 and 9.5–10 Hz, respectively) between genotypes (P < 0.05 by Student's t test) (D).
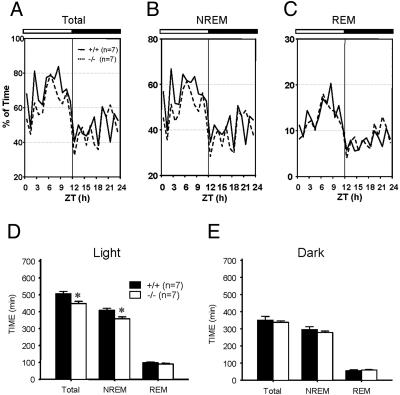
Decrease of NREM Sleep and Increase of Wake Time During the Light Period in α1G–/– Mice. We next investigated the physiological effect of the altered sleep oscillations on the pattern of sleep–wake cycle in α1G–/– mice. Vigilance states were assigned as Awake, REM, and NREM sleep based on the predominant EEG/EMG activities according to the standard criteria for rodent sleep analysis (30). Both wild-type and α1G–/– mice exhibited diurnal preference for sleep under the 12-h light/12-h dark condition (P < 0.0001) (Fig. 3 A–C and Table 1). Total sleep amount, however, was significantly reduced in the mutant animals (P < 0.05). Analysis of vigilance-state parameters in the light period showed that α1G–/– mice spent significantly less time for NREM sleep (P < 0.05) compared with the wild-type. The amount of REM sleep, however, remained unaltered (Table 1 and Fig. 3_D_). Sleep latency as defined by the time from lights on or lights off to the onset of NREM sleep, did not differ between the two genotypes. The latency from the onset of NREM sleep to REM sleep was not different, either. There was no significant difference in the sleep pattern in the dark period between the two genotypes.
Fig. 3.
The amount of NREM sleep decreased in α1G–/– mice during the lights-on period. (A_–_C) Mean hourly values for NREM and REM sleep are expressed as percent of time in total sleep time (A), NREM sleep time (B), and REM sleep time (C) over the total time for wild-type (solid line) and mutant (dotted line) mice. The horizontal bars at the top of the graphs in A–C mark the 12-h light/12-h dark cycle (n = 7 for each genotype). (D and E) The bar graphs depict the cumulative sum of mean hourly values for NREM and REM sleep over a 12-h light (D) and 12-h dark (E) period, averaged for wild-type mice (n = 7) and mutant mice (n = 7). Values are presented as mean ± SEM in min. *, P < 0.05 between wild-type and mutant mice (ANOVA followed by post hoc test).
Table 1. Parameters of vigilance states from α1G knockout (-/-) and wild-type (+/+) mice.
| NREM | REM | Awake | ||||
|---|---|---|---|---|---|---|
| +/+ | -/- | +/+ | -/- | +/+ | -/- | |
| Light period | ||||||
| Total time, min | 408 ± 12.0 | 358 ± 12.1* | 97.8 ± 4.8 | 89.9 ± 5.1 | 214 ± 13.5 | 272 ± 13.5* |
| Episode duration, min | 1.5 ± 0.2 | 1.5 ± 0.1 | 1.7 ± 0.1 | 6.7 ± 0.8* | ||
| Sleep latency | 6.2 ± 3.4 | 1.1 ± 0.1 | 11.7 ± 1.7 | |||
| REM/TST, % | 12.6 ± 8.8 | 19.3 ± 0.8 | 20.1 ± 1.0 | |||
| REM latency | 9.7 ± 4.2 | 20.2 ± 12.3 | ||||
| Dark period | ||||||
| Total time, min | 296 ± 17.4 | 279 ± 8.4 | 54.8 ± 6.7 | 59.0 ± 3.7 | 370 ± 22.0 | 382 ± 8.8 |
| Episode duration, min | 1.3 ± 0.1 | 1.0 ± 0.1 | 1.3 ± 0.1 | 1.5 ± 0.1 | 12.9 ± 1.8 | |
| Sleep latency | 7.8 ± 6.5 | 11.5 ± 7.4 | 13.9 ± 1.7 | |||
| REM/TST, % | 15.5 ± 1.5 | 17.5 ± 1.0 | ||||
| REM latency | 5.5 ± 0.8 | 21.0 ± 10.4 |
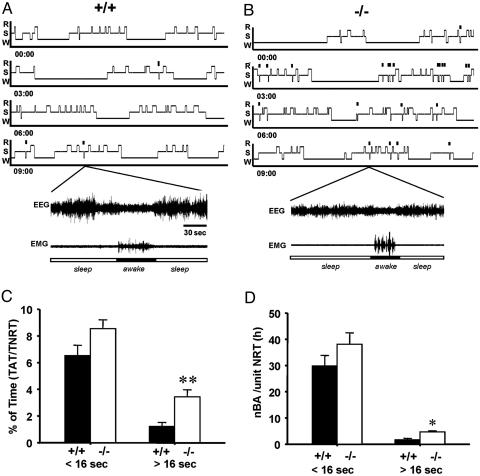
Sleep Disturbances Were Significantly Increased During NREM Sleep inα1G–/– Mice. Fragmentation of sleep by BAs (typically <16 sec) during NREM sleep has been previously reported in rodents (33, 34). We have examined the degree of fragmentation of NREM sleep in the α1G mutant. BAs were defined by an increase of EMG tone accompanied by a high-frequency low-amplitude EEG for a brief period (<16 sec) during NREM sleep. The incidence of BAs, calculated by the number of BAs per hour of NREM sleep and the percentage of the accumulated time for BAs over the total NREM sleep time showed no difference between wild-type and α1G–/– mice (Fig. 4 C and D). However, we have observed that awakenings of >16 sec occur in the NREM sleep in both wild-type and mutant animals (Fig. 4 A and B), and such BAs (>16 sec) occurred more abundantly in the α1G–/– mice compared with wild-type littermates (P < 0.05) (Fig. 3).
Fig. 4.
BAs of >16 sec were more abundant in α1G–/– mice in an NREM sleep state compared with α1G+/+ mice. (A and B) Representatives of hypnograms (Upper) and sample EEG/EMG traces (Lower) from each genotypes display BAs with a >16-sec duration occurred during NREM sleep in the 12-h light period. The small vertical bars indicate longer BAs occurred during NREM sleep. R, REM; S, NREM; W, Awake. (C and D) The bar graphs depict BAs with a duration of <16 sec and >16 sec as the percent of total BA time in the total time for NREM sleep (C) and the number of BAs per hour of total NREM sleep (D). nBA, the number of BAs; NRT, NREM sleep time. Values are expressed as mean ± SEM for 24 h (n = 7 for each genotype). **, P < 0.001; *, P < 0.005.
Discussion
The present study reveals that the α1G-subunit of T-type Ca2+ channels plays a critical role in the genesis of the delta and spindle oscillations and the lack of this subunit results in a reduced threshold for the transition between NREM sleep and wake states.
The delta and spindle waves that are affected by α1G null mutation have been known to depend highly on the properties of thalamic neurons. The delta oscillations are preserved in TC neurons in decorticated animals (15) and in isolated thalamic slices (35, 36). Thus, the changes in intrinsic properties of TC neurons in α1G–/– mice, such as the absence of T-currents resulting in the lack of LTS, could be lead to a defect in the genesis of delta oscillations. The lack of EEG delta oscillations in α1G–/– mice suggests that the thalamic component plays an essential role in producing delta waves at the EEG level. The spindle oscillations have also been well reproduced in isolated thalamic slices in vitro (11, 37). Spindles arise in GABAergic nRT neurons with rhythmic spike-burst activities, and induce inhibitory postsynaptic potentials in target TC cells. Thus, the loss of rebound bursts of TC neurons in α1G–/– mice would prevent spindle waves from being transmitted to the cortex. However, episodes of spindle oscillations with reduced amplitudes were still remaining in the envelope of slow waves in NREM sleep in α1G–/– mice. It was previously shown (10) that nRT neurons could generate spindle oscillations after disconnection of TC neurons from nRT neurons in vivo. On the other hand, TC neurons were shown to be essential for the propagation of spindles generated in nRT neurons (37). Because α1G is not expressed in nRT neurons (38), LTS should not have been abolished in these neurons in the mutant. Therefore, it remains to be further studied how spindle waves could be observed in the cortical EEG of α1G–/– mice without LTS of TC neurons.
In contrast to the impaired delta and spindle waves, the slow (<1 Hz) rhythms were intact in the α1G–/– mice. Whereas the delta and spindle waves are known to depend on thalamic neurons, the slow waves originate from cortical neurons and can be generated in isolated cortical slices in vitro by recurring sequences of synaptic barrages of depolarizing and hyperpolarizing phases (20, 21). Thus, the present results suggest that α1G T-type channels are not required for the cortical mechanisms underlying slow waves. It is interesting to note that the α1G–/– mice were resistant to GABAB agonist-induced spike-and-wave (SWD) seizures but were still susceptible to cortically originated (29, 39) SWD seizures induced by GABAA antagonists (29, 39).
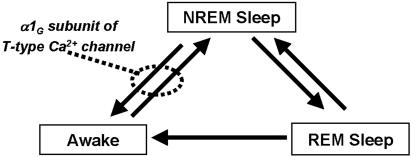
The higher incidence of BAs with a prolonged duration during NREM sleep state of the α1G mutant suggests that α1G T-type channels play an inhibitory role in the transition from sleep to wake states (Fig. 5). The lack of LTS in TC neurons could, at least in part, contribute to the reduction of threshold for the transition, because LTS are involved in the reduction of sensory response of thalamic neurons during sleep and anesthesia (24, 25). During the transition from NREM sleep to wake state, brainstem cholinergic neurons depolarize TC neurons (40) and thereby decrease LTS, whereas a reduced brainstem activity leads to hyperpolarization of TC neurons and disinhibition of nRT neurons (41). Because α1G is also expressed in other brain regions associated with sleep, such as cortex, midbrain, and hypothalamus (38, 42), it is conceivable that the deletion of α1G in brain regions other than TC neurons may have contributed to the modification of NREM sleep.
Fig. 5.
Schematic diagram for the possible role of the α1G-subunit of T-type Ca2+ channels that might inhibit the transition of the sleep–wake cycle. This inhibition appears to involve in the stabilization of sleep. Arrows indicate the direction of possible stage transition during normal sleep–wake cycle.
BAs during NREM sleep states are also seen in humans. These awakenings are called microarousal (MA) (43). MA during NREM has been reported to decrease with deepening of sleep, as evidenced by prevalent delta and slow waves (44). An increase in sleep instability and MA was shown to be a typical feature of delta sleep-related parasomnia such as sleepwalking, sleep terror, and sleep enuresis, which are considered arousal disorders (45). Our results suggest that an increase in BAs in α1G–/– mice are related to the loss of delta oscillations in the animal. Arousal during NREM sleep has been proposed to connect the sleeper with surrounding world, maintaining the selection of relevant incoming information, and adapting to the dangers and demands of the outer world (46). Studying the behavioral consequences of sleep disorders in the mutants may shed light on the physiological roles of delta waves not only in sleep states but also in wake states.
Supplementary Material
Supporting Information
Acknowledgments
We thank C. Justin Lee for critical comments on the manuscript and J. Park for mouse care. This work was supported by the Chemoinformatics Program at the Korea Institute of Science and Technology.
Author contributions: H.-S.S. designed research; and J.L. and D.K. performed research.
Abbreviations: REM, rapid eye movement; NREM, non-REM; LTS, low-threshold spikes; EEG, electroencephalogram; EMG, electromyogram; nRT, thalamic reticular; TC, thalamic relay; BA, brief awakening.
References
- 1.Llinas, R. & Jahnsen, H. (1982) Nature 297**,** 406–408. [DOI] [PubMed] [Google Scholar]
- 2.Deschenes, M., Roy, J. P. & Steriade, M. (1982) Brain Res. 239**,** 289–293. [DOI] [PubMed] [Google Scholar]
- 3.Huguenard, J. R. (1996) Annu. Rev. Physiol. 58**,** 329–348. [DOI] [PubMed] [Google Scholar]
- 4.Llinas, R. R. (1988) Science 242**,** 1654–1664. [DOI] [PubMed] [Google Scholar]
- 5.Jahnsen, H. & Llinas, R. (1984) J. Physiol. (London) 349**,** 205–226. [DOI] [PMC free article] [PubMed] [Google Scholar]
- 6.Jahnsen, H. & Llinas, R. (1984) Arch. Ital. Biol. 122**,** 73–82. [PubMed] [Google Scholar]
- 7.Coulter, D. A., Huguenard, J. R. & Prince, D. A. (1989) J. Physiol. (London) 414**,** 587–604. [DOI] [PMC free article] [PubMed] [Google Scholar]
- 8.Steriade, M., McCormick, D. A. & Sejnowski, T. J. (1993) Science 262**,** 679–685. [DOI] [PubMed] [Google Scholar]
- 9.Contreras, D. & Steriade, M. (1996) J. Physiol. (London) 490**,** 159–179. [DOI] [PMC free article] [PubMed] [Google Scholar]
- 10.Steriade, M., Domich, L., Oakson, G. & Deschenes, M. (1987) J. Neurophysiol. 57**,** 260–273. [DOI] [PubMed] [Google Scholar]
- 11.von Krosigk, M., Bal, T. & McCormick, D. A. (1993) Science 261**,** 361–364. [DOI] [PubMed] [Google Scholar]
- 12.Pape, H. C. (1996) Annu. Rev. Physiol. 58**,** 299–327. [DOI] [PubMed] [Google Scholar]
- 13.Pape, H. C. & Mager, R. (1992) Neuron 9**,** 441–448. [DOI] [PubMed] [Google Scholar]
- 14.Pape, H. C. & McCormick, D. A. (1989) Nature 340**,** 715–718. [DOI] [PubMed] [Google Scholar]
- 15.Dossi, R. C., Nunez, A. & Steriade, M. (1992) J. Physiol. (London) 447**,** 215–234. [DOI] [PMC free article] [PubMed] [Google Scholar]
- 16.Steriade, M., Nunez, A. & Amzica, F. (1993) J. Neurosci. 13**,** 3266–3283. [DOI] [PMC free article] [PubMed] [Google Scholar]
- 17.Schwindt, P. C., Spain, W. J., Foehring, R. C., Chubb, M. C. & Crill, W. E. (1988) J. Neurophysiol. 59**,** 450–467. [DOI] [PubMed] [Google Scholar]
- 18.Schwindt, P. C., Spain, W. J., Foehring, R. C., Stafstrom, C. E., Chubb, M. C. & Crill, W. E. (1988) J. Neurophysiol. 59**,** 424–449. [DOI] [PubMed] [Google Scholar]
- 19.Steriade, M. B. & Biesold, D, eds. (1990) in Brain Cholinergic Systems (Oxford Univ. Press, Oxford), pp. 3–63.
- 20.Steriade, M., Nunez, A. & Amzica, F. (1993) J. Neurosci. 13**,** 3252–3265. [DOI] [PMC free article] [PubMed] [Google Scholar]
- 21.Sanchez-Vives, M. V. & McCormick, D. A. (2000) Nat. Neurosci. 3**,** 1027–1034. [DOI] [PubMed] [Google Scholar]
- 22.Steriade, M. (2001) Nat. Neurosci. 4**,** 671. [DOI] [PubMed] [Google Scholar]
- 23.Steriade, M., Jones, E. G. & McCormick, D. A. eds. (1997) Thalamus (Elsevier, New York). Vol. 2.
- 24.Steriade, M. & Llinas, R. R. (1988) Physiol. Rev. 68**,** 649–742. [DOI] [PubMed] [Google Scholar]
- 25.Kim, D., Park, D., Choi, S., Lee, S., Sun, M., Kim, C. & Shin, H. S. (2003) Science 302**,** 117–119. [DOI] [PubMed] [Google Scholar]
- 26.McCormick, D. A. & Feeser, H. R. (1990) Neuroscience 39**,** 103–113. [DOI] [PubMed] [Google Scholar]
- 27.Weyand, T. G., Boudreaux, M. & Guido, W. (2001) J. Neurophysiol. 85**,** 1107–1118. [DOI] [PubMed] [Google Scholar]
- 28.Steriade, M. & Contreras, D. (1995) J. Neurosci. 15**,** 623–642. [DOI] [PMC free article] [PubMed] [Google Scholar]
- 29.Kim, D., Song, I., Keum, S., Lee, T., Jeong, M. J., Kim, S. S., McEnery, M. W. & Shin, H. S. (2001) Neuron 31**,** 35–45. [DOI] [PubMed] [Google Scholar]
- 30.Radulovacki, M., Virus, R. M., Djuricic-Nedelson, M. & Green, R. D. (1984) J. Pharmacol. Exp. Ther. 228**,** 268–274. [PubMed] [Google Scholar]
- 31.Contreras, D. & Steriade, M. (1995) J. Neurosci. 15**,** 604–622. [DOI] [PMC free article] [PubMed] [Google Scholar]
- 32.Deboer, T., Franken, P. & Tobler, I. (1994) J. Comp. Physiol. A 174**,** 145–155. [DOI] [PubMed] [Google Scholar]
- 33.Franken, P., Dijk, D. J., Tobler, I. & Borbely, A. A. (1991) Am. J. Physiol. 261**,** R198–R208. [DOI] [PubMed] [Google Scholar]
- 34.Tobler, I., Deboer, T. & Fischer, M. (1997) J. Neurosci. 17**,** 1869–1879. [DOI] [PMC free article] [PubMed] [Google Scholar]
- 35.Leresche, N., Jassik-Gerschenfeld, D., Haby, M., Soltesz, I. & Crunelli, V. (1990) Neurosci. Lett. 113**,** 72–77. [DOI] [PubMed] [Google Scholar]
- 36.Timofeev, I. & Steriade, M. (1996) J. Neurophysiol. 76**,** 4152–4168. [DOI] [PubMed] [Google Scholar]
- 37.Kim, U., Bal, T. & McCormick, D. A. (1995) J. Neurophysiol. 74**,** 1301–1323. [DOI] [PubMed] [Google Scholar]
- 38.Talley, E. M., Cribbs, L. L., Lee, J. H., Daud, A., Perez-Reyes, E. & Bayliss, D. A. (1999) J. Neurosci. 19**,** 1895–1911. [DOI] [PMC free article] [PubMed] [Google Scholar]
- 39.Steriade, M. & Contreras, D. (1998) J. Neurophysiol. 80**,** 1439–1455. [DOI] [PubMed] [Google Scholar]
- 40.Curro Dossi, R., Pare, D. & Steriade, M. (1991) J. Neurophysiol. 65**,** 393–406. [DOI] [PubMed] [Google Scholar]
- 41.Steriade, M. (2000) Neuroscience 101**,** 243–276. [DOI] [PubMed] [Google Scholar]
- 42.Yunker, A. M., Sharp, A. H., Sundarraj, S., Ranganathan, V., Copeland, T. D. & McEnery, M. W. (2003) Neuroscience 117**,** 321–335. [DOI] [PubMed] [Google Scholar]
- 43.Halasz, P., Kundra, O., Rajna, P., Pal, I. & Vargha, M. (1979) Acta Physiol. Acad. Sci. Hung. 54**,** 1–12. [PubMed] [Google Scholar]
- 44.Evans, B. M. (1993) Electroencephalogr. Clin. Neurophysiol. 86**,** 123–131. [DOI] [PubMed] [Google Scholar]
- 45.Zucconi, M., Oldani, A., Ferini-Strambi, L. & Smirne, S. (1995) J. Clin. Neurophysiol. 12**,** 147–154. [PubMed] [Google Scholar]
- 46.Halasz, P., Terzano, M., Parrino, L. & Bodizs, R. (2004) J. Sleep Res. 13**,** 1–23. [DOI] [PubMed] [Google Scholar]
Associated Data
This section collects any data citations, data availability statements, or supplementary materials included in this article.
Supplementary Materials
Supporting Information
