Differential effects of the dynein-regulatory factor Lissencephaly-1 on processive dynein-dynactin motility (original) (raw)
Abstract
Cytoplasmic dynein is the primary minus-end–directed microtubule motor protein in animal cells, performing a wide range of motile activities, including transport of vesicular cargos, mRNAs, viruses, and proteins. Lissencephaly-1 (LIS1) is a highly conserved dynein-regulatory factor that binds directly to the dynein motor domain, uncoupling the enzymatic and mechanical cycles of the motor and stalling dynein on the microtubule track. Dynactin, another ubiquitous dynein-regulatory factor, releases dynein from an autoinhibited state, leading to a dramatic increase in fast, processive dynein motility. How these opposing activities are integrated to control dynein motility is unknown. Here, we used fluorescence single-molecule microscopy to study the interaction of LIS1 with the processive dynein-dynactin-BicD2N (DDB) complex. Surprisingly, in contrast to the prevailing model for LIS1 function established in the context of dynein alone, we found that binding of LIS1 to DDB does not strongly disrupt processive motility. Motile DDB complexes bound up to two LIS1 dimers, and mutational analysis suggested that LIS1 binds directly to the dynein motor domains during DDB movement. Interestingly, LIS1 enhanced DDB velocity in a concentration-dependent manner, in contrast to observations of the effect of LIS1 on the motility of isolated dynein. Thus, LIS1 exerts concentration-dependent effects on dynein motility and can synergize with dynactin to enhance processive dynein movement. Our results suggest that the effect of LIS1 on dynein motility depends on both LIS1 concentration and the presence of other regulatory factors such as dynactin and may provide new insights into the mechanism of LIS1 haploinsufficiency in the neurodevelopmental disorder lissencephaly.
Keywords: cytoskeleton, dynein, microtubule, molecular motor, single-molecule biophysics
Introduction
Cytoplasmic dynein (dynein, DYNC1H1) performs a diverse range of processive minus-end transport functions in animal cells (1, 2). Dynein is also integral in the construction and positioning of the mitotic spindle (3–5). In contrast to the single dynein isoform in the cytoplasm, there are ∼15 kinesins that transport various intracellular cargos (6). Specialization of dynein function is thought to arise through distinct dynein subunits and the interplay between various conserved dynein regulatory factors. Dynein motor activity in cells is predominantly regulated by the LIS1-NudEL2 complex and the giant ∼1-MDa dynactin complex (6–8). Mutations in LIS1 and NudEL cause neurodevelopmental diseases, whereas mutations in dynactin cause neurodegenerative diseases, highlighting the diverse roles dynein regulation plays in human neurophysiology (9–11).
Haploinsufficency of the LIS1 gene is the primary cause of the neurodevelopmental disease type 1 lissencephaly (12, 13). This phenotype is thought to arise from a failure of neuronal precursor cell division and migration, largely because of the loss of dynein-driven intracellular nuclear migration (9, 14). The lissencephalic phenotype that arises from haploinsufficency of the LIS1 gene suggests that the intracellular concentration of LIS1 is important for proper regulation of dynein motility. Studies of metazoan dynein and LIS1 showed that LIS1 bound directly to the dynein motor domain only when the linker domain was forced into the prepowerstroke conformation (15). LIS1 induced pauses during unloaded dynein motility and strongly enhanced dynein MT affinity when external load was applied via optical trap, leading to greater coordination of force production for teams of dyneins on a single cargo (15). Structural and single molecule studies using yeast proteins confirmed that LIS1 controls dynein affinity for the MT track, greatly slowing dynein motility through a direct interaction with the dynein motor domain, near the AAA3/4 interface (16). When bound in this position on the motor domain, LIS1 sterically blocked the recovery stroke of the linker domain of dynein, preventing processive movement along the MT (16, 17). NudEL enhances the interaction of dynein with LIS1 by interacting with the dynein tail domain and recruiting LIS1 to dynein (15, 16, 18). Thus, the prevailing molecular model from these studies is that LIS1 negatively regulates dynein motility by sterically hindering the remodeling of the linker domain during the mechanochemical cycle of dynein (6, 17). This molecular model presents a conundrum for the cellular role of LIS1 in neurons, where LIS1 is required for dynein-mediated movement of neuronal cell nuclei (14). The effect of LIS1 on dynein motility is, however, beneficial to cargo transport by teams of motors, leading to the idea that LIS1 is crucial for dynein transport of large, high-load intracellular cargos (15, 19, 20).
Dynactin was originally isolated as a factor required for dynein transport of vesicles in vitro (21, 22) and was reported to modestly enhance dynein processivity in vitro (23, 24). Dynactin seems to be required for most, if not all, dynein motility in cells and acts as a recruitment, initiation and processivity factor for dynein motility both in vitro and in vivo (25–29). The CAP-Gly domain of the p150_Glued_ subunit of dynactin recruits dynactin to dynamic MT plus-ends and is sensitive to the tyrosination state of the MT lattice (26, 30). Point mutations in this domain lead to adult-onset neurodegenerative disease (31).
Recently, it was discovered that a robust interaction between dynein and dynactin requires the presence of a third, cargo-specific adapter molecule to mediate the interaction between the N terminus of the dynein heavy chain and the dynactin arp filament (25, 32). The most characterized adapter molecule is the N-terminal coiled-coil domain of the Bicaudal D2 protein, a mammalian homolog of the Drosophila mRNA transport factor Bicuadal D (33). The formation of this tripartite complex is proposed to force dynein out of an autoinhibited conformation, strongly stimulating processive dynein motility (2, 34). Thus, the binding of LIS1 to the motor domain and of dynactin to the tail domain of dynein (mediated through an adapter protein), have opposing effects on the mechanochemistry of dynein, raising the important question of how the activities of these two regulators are coordinated in the cell for spatiotemporal control of dynein activity.
Here we have examined the interplay between LIS1 and dynactin using purified components in single molecule assays. Surprisingly, we readily observe LIS1 binding to motile DDB complexes. Strikingly, LIS1-bound DDB complexes maintained processive movement, in contradiction to predictions made by the current model for LIS1 function (16, 17). Single LIS1 dimers remain stably bound to DDB over many microns of travel distance, representing hundreds of cycles through the mechanochemical cycle of the motor. Mutations in LIS1 that abolish binding to the dynein motor domain also prevent LIS1 binding to motile DDB. These results suggest that the binding of LIS1 to the motor domain of a dynein molecule that is also activated by dynactin does not inhibit remodeling of the linker domain during the powerstroke of dynein (17). In striking contrast, titration to higher LIS1 concentrations leads to an enhancement of DDB velocity, suggesting that LIS1 may have concentration-dependent regulatory effects on the mechanochemical cycle of dynein. Our results raise new questions about the mechanism of haploinsufficiency found in lissencephalic patients and suggest that the regulatory effects of LIS1 on dynein motility depends on the both the concentration of LIS1 and the presence of other regulatory factors such as dynactin.
Results
Single molecule observation of the interaction of LIS1 with DDB
To directly observe the effects of LIS1 on DDB motility, we utilized multicolor single molecule total internal reflection fluorescence (TIRF) microscopy. DDB complexes formed with SNAP-TMR-labeled BicD2N (Fig. 1A) moved either processively or diffused along surface-immobilized taxol MTs with ratios similar to what has been previously described (25, 32, 35). When we mixed 15 nm purified, SNAP-647-labeled LIS1 with ∼5 nm DDB, we readily observed LIS1 bound to both processively moving and diffusing DDB complexes (Fig. 1B and supplemental Movie S1). We found that this concentration of LIS1 provided an optimal signal-to-noise ratio in our assays, because higher LIS1 concentrations led to high background that obscured the LIS1 signal on the MTs, and lower concentrations led to few LIS1 molecules bound to DDB. At this concentration, 17.5% (n = 107 of 612 complexes) of processive DDB complexes contained a bound LIS1, whereas 33.8% (n = 108 of 320 complexes) of diffusive DDB complexes bound LIS1. It is notable that LIS1 associates with diffusive DDBs ∼2-fold more frequently than with processively moving complexes under our conditions (p < 0.0001, Fisher's exact test). These values are likely an underestimate of DDB occupancy by LIS1 because not all LIS1 molecules are fluorescently labeled in our assay (typical SNAP tag labeling efficiency was 60–80% in our conditions). From these data, we estimate the Kd of dimeric LIS1 for DDB to be ∼71 and ∼29 nm for processive and diffusive DDBs, respectively, in our conditions. We also observed strong accumulation of LIS1 and DDB at the minus-ends of all MTs in the imaging chamber (Fig. 1B and supplemental Movie S1) (25).
Figure 1.

Single molecule observation of LIS1-DDB interactions. A, cartoon schematic of the proteins/complexes used in the in vitro reconstitution. LIS1 and DDB are labeled fluorescently via covalent dye conjugation to the SNAP tag on LIS1 and BicD2N, respectively. B, kymographs from individual fluorescent channels showing the movement of SNAP-TMR-labeled DDB and SNAP-647-labeled LIS1. Examples of three types of interactions between LIS1 and DDB are highlighted by arrows: continuous processive motility (green), continuous diffusive motility (pink), and conversion from diffusive to processive motility upon loss of LIS1 signal (yellow). The strong accumulation of DDB and LIS1 signal at MT minus-ends is highlighted as well (teal arrow). Scale bars, 5 μm, 10 s. C, left panel, quantification of the average velocity of processive DDB or DDB-L complexes. n = 874 and 475, respectively, in two independent trials. p = 0.7411, unpaired t test. Error bars, S.D. The means from each experimental chamber are shown. Right panel, quantification of the fraction of DDB-L complexes that are processive (column P) versus diffusive (column D). Error bars, S.D., fractions from each experimental chamber are shown. D, kymographs from individual fluorescent channels showing examples of transient (green arrows) or stable (yellow arrows) LIS1 binding to diffusing DDBs. Scale bars, 5 μm, 10 s. E, example kymographs for rare LIS1 binding/unbinding events and their effects on DDB motility. Yellow arrows highlight LIS1 dynamics. Scale bars, 5 μm, 5 s. F, quantification of observed LIS1 dynamics on DDB motility. Note that LIS1 binding was never observed to enhance velocity, and unbinding was never observed to slow or stop motility. The data are a summary of 35 total binding/dissociation events from seven different experimental chambers and ∼29 min of total imaging. G, quantification of the effects of LIS1 binding/dissociation on DDB velocity from the events described in E and F. Graphs show the means, and error bars represent S.E. Individual data points for all events are shown.
Surprisingly, the velocity of processive DDB complexes with stably bound LIS1 molecules (DDB-L) was not different from that of DDB complexes lacking a LIS1 signal (Fig. 1C, p = 0.7411, unpaired t test). This is in striking contrast to the effect of LIS1 association with processively moving yeast dynein (16) or metazoan dynein lacking dynactin (15, 36, 37). The ratio of processive to diffusive DDB-L complexes was also similar to that previously observed for DDB complexes in several studies (Fig. 1C) (25, 32, 35).
The majority of LIS1 remained stably bound to processive DDB during the entire observation period, often for DDB travel distance up to tens of microns (Fig. 1B and supplemental Movie S1). However, we also observed much more rare events of LIS1 binding or unbinding to DDB complexes (Fig. 1, B and D–F, and supplemental Movie S1). For processively moving DDBs, we classified LIS1 binding/unbinding events as having no effect, enhancing, or retarding processive DDB velocity (Fig. 1, D–F). LIS1 binding was approximately as likely to have no discernable effect on DDB motility as to slow the velocity of DDB (Fig. 1, E and F). Dissociation of LIS1 appeared more likely to enhance DDB velocity than to have no observable effect, although the low number of total events precluded statistical analysis (Fig. 1, E and F). In this subset of events, the binding or dissociation of LIS1 altered the velocity of DDB ∼20-fold, although the magnitude varied considerably (Fig. 1G).
We also observed stable LIS1 association with diffusing DDB (Fig. 1, B and D, and supplemental Movie S1) and more rarely observed dynamic association/dissociation events (Fig. 1D). We observed that loss of LIS1 signal could correspond to an apparent conversion from diffusive to processive motility (Fig. 1B and supplemental Movie S1), although this was not always the case (Fig. 1D). Association of LIS1 to a diffusing DDB never caused obvious switching between diffusive and processive motility of DDB, unlike dissociation of LIS1. The activation of motility upon LIS1 dissociation is reminiscent of a LIS1-induced initiation of dynein motility in vivo (38, 67). These rare dynamic association/dissociation events provide insight into the multiple effects of LIS1 interactions with the dynein-dynactin complex. We conclude that when stably bound, LIS1 does not overtly affect DDB motility. However, dynamic association/dissociation of LIS1 can exert control over DDB motility characteristics, suggesting multiple modes of LIS1 regulation of dynein motility.
LIS1 binds to the dynein motor domains during processive DDB motility
In addition to the previously characterized direct interaction between LIS1 and the dynein motor domain (15–17, 39, 40), LIS1 has also been reported to interact with the tail domain of the dynein heavy chain, the intermediate chain of dynein, and the p50 subunit of dynactin (40). Because the DDB complex contains all of these potential interaction sites, we therefore set out to map the molecular interaction between DDB and LIS1. LIS1 contains highly conserved residues on one face of its WD40 β-propeller domain (41) that were previously shown to mediate the direct interaction between the Saccharomyces cerevisiae homologs of LIS1 and the dynein motor domain (17). We mutated two of these conserved residues, Arg-316 and Trp-340 in Rattus norvegicus LIS1, to alanine. The mutant LIS1 proteins assumed a similar three-dimensional shape as WT LIS1 as judged by size-exclusion chromatography (Fig. 2A). In contrast, the missense mutation D317H, which causes lissencephaly and leads to aberrant LIS1 folding (42), showed a large shift in elution volume (Fig. 2A). Thus, we conclude that the R316A and W340A mutations do not dramatically disrupt LIS1 structure.
Figure 2.

LIS1 binds directly to the dynein motor domain during processive DDB motility. A, schematic of the protein constructs used. Note the GST-hDyn contains only the dynein motor domain. Right, Coomassie-stained gel showing recombinant LIS1 constructs used and gel filtration profiles for WT and mutant LIS1 proteins. Note that the lissencephaly causing mutation D317H greatly destabilizes LIS1 structure, leading to an aberrant gel filtration profile. B, images from individual fluorescent channels showing Dylight-405-labeled MTs, TMR-SNAP-GST-hDyn, and 647-SNAP-LIS1 signals. Note the mutant LIS1 proteins are not recruited to MTs by SNAP-GST-hDyn. Scale bar, 5 μm. Right panel, quantification of LIS1 fluorescence intensity along MTs for WT and mutant LIS1 molecules (n = 60 MTs quantified for each condition, in two independent trials). Error bars, S.D. The means from each experimental trial are shown (at least four experimental chambers per trial). C, example kymographs from each fluorescent channel showing WT 647-LIS1 association with processive TMR-DDB molecules, but no association is observed for either mutant LIS1 constructs, even at high DDB concentrations (∼10 nm DDB, 15 nm labeled LIS1). Scale bars, 5 μm, 10 s.
We next used TIRF microscopy to examine the interaction of LIS1 proteins with recombinant, SNAP-TMR-labeled, truncated human dynein (GST-hDyn (25)). In the absence of nucleotide, TMR-GST-hDyn strongly recruited WT LIS1 to surface immobilized MTs (Fig. 2, A and B). This is in contrast to the nucleotide-dependent interaction of purified dynein with LIS1 reported previously in solution binding assays (15). This result is particularly notable given that structural data suggest that the linker remains in its unprimed position, sterically incompatible with LIS1 binding (17), when dynein is bound to the MT (43). Further experiments to determine the structural conformation of the dynein-LIS1-MT complex will be needed to determine the position of the linker and LIS1 in this co-complex.
We next use this assay to probe the interaction of dynein with mutant LIS1. We observed that neither LIS1R316A nor LIS1W340A were significantly recruited to MTs by GST-hdyn, suggesting that both mutants lost the ability to interact with the dynein construct (Fig. 2B). Because GST-hdyn contains only one confirmed LIS1 binding site, we conclude that, similar to the yeast homologs, both LIS1 mutants abolish binding to the dynein motor domain. We then examined the interaction of the LIS1 mutants with processive DDB complexes. Remarkably, under conditions where we observe robust interaction of WT LIS1 with DDB, we detected no interaction of either mutant with processive DDB complexes, even at high densities of DDB (Fig. 2C). Although we cannot rule out that these mutations also affect the reported interactions of LIS1 with dynactin and the dynein tail domain, the most parsimonious conclusion from these experiments is that LIS1 binds directly to the dynein motor domain during processive DDB motility.
Stoichiometry and stability of LIS1 binding to DDB
Because both LIS1 and dynein are homodimers, it is possible that the stoichiometry of a LIS1-dynein co-complex is 1:1 (dimer:dimer), with each LIS1 β-propeller interacting with a single dynein motor domain. In this configuration, the dynein motor domains would be effectively bridged together through the dimeric LIS1 molecule, possibly restricting the motors conformational space. Alternatively, it is possible that each dynein motor domain binds to one LIS1 homodimer in a 1:2 (dimer:dimer) stoichiometry.
To distinguish these possibilities, we mixed equal molar amounts of two LIS1 preparations, differentially labeled with fluorescent SNAP ligands, with DDB (Fig. 3A). In these conditions, the total dimeric LIS1 concentration (30 nm) was twice that in our previous single color assay (Fig. 1). We observed similar ratios of LIS1 molecules in each fluorescent channel (647- or 488-SNAP) bound to DDB complexes (∼23 and 21% of total DDB complexes contained LIS1 signal in either fluorescent channel, n = 323 DDB complexes).
Figure 3.
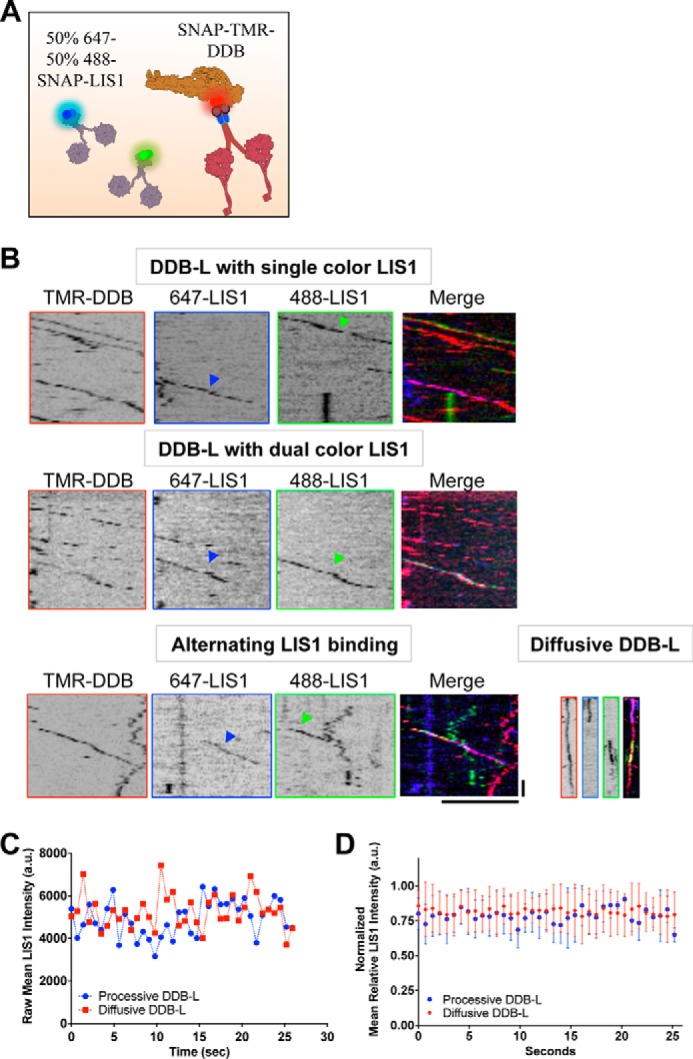
Stoichiometry of processive DDB-LIS1 complexes. A, schematic of the proteins used in the multicolor experiment. 15 nm of each color LIS1 was used. B, kymographs from individual fluorescent channels showing both SNAP-647 and -488 LIS1 molecules (blue and green arrows) and SNAP-TMR-DDB. Examples of individual DDB-L complexes with single-color LIS1 (n = 267) or dual-color LIS1 are shown (n = 14, two independent trials). Also shown are examples of single processive, or diffusive, DDB complexes alternating between bound differentially labeled LIS1 molecules. Scale bars, 5 μm, 5 s. C, example traces from single DDB-L complexes showing the mean LIS1 fluorescent intensity over the entire time course of the recording. D, average LIS1 fluorescent signals from processive or diffusive tracked DDB-L complexes were normalized to the highest intensity during the entire trace (n = 10 tracked complexes for each trace, two independent trials). Note the fluorescence intensity stays relatively constant during the entire recording, suggesting that LIS1 is stably bound to DDB. Error bars, S.D.
Within the subpopulation of processive DDB molecules that bound LIS1 (DDB-L), the large majority (91.8%, 245 of 267 complexes) of complexes contained only singly labeled (either 647- or 488-SNAP) LIS1 molecules, in approximately equal proportions (647:488 ratio = 0.91; Fig. 3B). However, a minority (8.2%, 22 of 267 complexes) of processive DDB-L complexes clearly contained both 647- and 488-SNAP LIS1 molecules during processive movement (Fig. 3B). In this assay, it is possible that a single DDB complex could be bound by two LIS1 dimers containing the same SNAP label, and thus we conclude that under our conditions, up to ∼25% of processive DDB-L complexes contained two LIS1 dimers during movement. In addition, we observed rare dynamic events where single DDB-L complexes bound differentially labeled LIS1 molecules at different times during processive or diffusive movement (Fig. 3B), further suggesting that most DDB molecules bind single LIS1 dimers in our conditions.
Within the entire population of DDB molecules in the assay (those with and without LIS1 signal), we observed ∼3% bound differentially labeled LIS1 molecules (n = 10 of 323 DDB complexes) and calculate from this a maximum of 9% of total DDB complexes bound two LIS1 dimers. From this observation, we estimate that the Kd for binding of the second LIS1 molecule to a single DDB complex is ∼303 nm, approximately four times higher than the dissociation constant for binding a single LIS1 molecule (∼71 nm, see above).
In addition to the experiments described above, we tracked the fluorescence intensity of LIS1 over time for both processive and diffusive DDB-L complexes. Fig. 3C shows typical example intensity traces of individual DDB-L complexes in both categories. The narrow range of LIS1 intensities strongly suggest that the number of fluorescent LIS1 molecules bound to DDB does not change over the course of the track. Normalized averages of many such tracks also show little intensity variation over the observation time (Fig. 3D), further suggesting that most LIS1 remains stably bound to DDB. These results suggest that in our experimental conditions, most DDB complexes stably bind a single LIS1 dimer. However, our observations also make it explicitly clear that single DDB complexes are capable of binding two LIS1 dimers simultaneously, a mode of interaction that requires further investigation. This type of interaction is dependent on LIS1 concentration and occupancy of DDB and possibly other factors that may affect the molecular interaction between LIS1 and dynein, such as post-translational modifications or the presence of other accessory factors such as NudE/L (7, 8).
Concentration-dependent activation of DDB velocity by LIS1
The observation of unhindered processive motility even after association of LIS1 with the dynein motor domain challenges the current model for how LIS1 functions to sterically block the dynein powerstroke. At low nanomolar concentrations that facilitate single molecule visualization of this interaction, we do not observe strong effects of bound LIS1 on DDB velocity (Fig. 1C). However, haploinsufficiency of LIS1 causes lissencephaly, suggesting that dynein function may be sensitive to total intracellular LIS1 concentration.
To test the effects of LIS1 concentration on DDB motility, we performed single molecule observations of DDB motility in the presence of increasing amounts of LIS1 protein, with LIS1 concentrations much higher than used in the single molecule assays described previously. Strikingly, the addition of up to 500 nm LIS1, approximately a 100-fold molar excess over DDB, did not impede processive DDB movement along MTs (Fig. 4A). The addition of excess LIS1 significantly shifted the mean velocity of the entire population toward faster movement compared with the absence of LIS1 (Fig. 4B), with a stronger effect seen at 500 nm LIS1, above the Kd for binding two LIS1 dimers to each DDB complex.
Figure 4.

Concentration-dependent effects of LIS1 on DDB velocity. A, example kymographs showing continued processive DDB movement at a range of LIS1 concentrations. Note processive movement continues even at high concentrations of LIS1. Scale bars, 5 μm, 10 s. B, box plots showing DDB velocities at indicated LIS1 concentrations. Whiskers show minimum to maximum values in data set. Addition of LIS1 shifts the population mean significantly compared with 0 nm LIS1. *, p ≤ 0.05; ***, p ≤ 0.0001, Kruskal–Wallis test, with Dunn's multiple comparison test. C, velocity distribution histograms for each concentration of LIS1 added. Each distribution was best fit by a sum of two Gaussians (data are pooled from three independent trials). Mode velocities for each Gaussian component as well as respective uncertainties (here: bias-corrected and accelerated bootstrap confidence intervals) are shown. D, empirical cumulative distribution functions show a clear shift to higher DDB velocities at 500 nm LIS1. E, the fraction of the total population found in each velocity category, calculated as the area under each Gaussian fit. F, box plot of the number of DDB complexes per μm of MT per s. No statistical difference is observed, p = 0.0619, one-way ANOVA. n = 10 MTs and >200 DDB complexes per condition from at least two independent trials. Whiskers show minimum to maximum values in data set. n.s., not significant. G, plot showing processive (columns P), diffusive (columns D), or static (columns S) DDB behavior with or without LIS1. n = 10 MTs and >200 DDB complexes quantified per condition from at least two independent trials. Data from individual MTs are shown color-coded to correspond to concentrations of LIS1 as in F. *, p ≤ 0.05; ***, p ≤ 0.0001 compared with 0 nm LIS1, two-way ANOVA with Dunnett's multiple comparison test.
We quantified a larger number of processive complexes than in previous reports and noted that the resulting DDB velocity distribution histogram was best fit with a sum of two Gaussians (Fig. 4C), resulting in two velocity population means (Fig. 4, C and D). A similar finding was recently reported for the distribution of velocities of dynein-dynactin complexes formed with another adapter protein, Hook3 (44). These observations suggest that activation of dynein by adapter proteins results in a complex distribution of motor velocities, the mechanism of which requires further study. The slower mean velocity within the total population was similar to previously reported values for DDB motility, whereas the larger mean velocity was nearly 2-fold faster (Fig. 4, C and D).
The addition of 125 nm LIS1 to DDB, above the calculated Kd for binding of single LIS1 to DDB, did not change the velocity of either slower or faster populations significantly (Fig. 4C), similar to our results at lower LIS1 concentrations (Fig. 1C). This result suggests that the binding of a single LIS1 to DDB does not have a strong effect on the velocity of the complex. Strikingly, the addition of 500 nm LIS1, above the calculated Kd for binding two LIS1 molecules, shifted both slower and faster DDB populations to higher velocities (Fig. 4, C and D). The total fraction of complexes found in each velocity population was not substantially changed by LIS1 addition, indicating that LIS1 affects the velocity of both slower and faster complexes equally (Fig. 4E). These results show that LIS1 modulates DDB velocity through concentration-dependent changes in the binding occupancy of dynein motor domains.
The amount of LIS1 did not affect the total number of DDB complexes moving along the MT lattice (Fig. 4F). However, LIS1 did shift the percentages of DDB complexes that displayed processive, diffusive, or stationary interactions with the MT lattice (Fig. 4G). Increasing LIS1 concentration led to a decrease of processive DDB complexes (65–48%) and increased the number of stationary complexes (3–15%; Fig. 4G). Thus, high levels of LIS1 facilitate faster DDB velocities at a modest expense of total numbers of processive complexes.
Discussion
We have used single molecule assays to examine the molecular interactions between two of the most ubiquitous dynein regulatory factors found in cells, dynactin and LIS1. Previous data have suggested that dynactin and LIS1 have opposing effects on dynein motility (15, 16, 23, 24, 32, 45). Dynactin binding to the tail domain of dynein, mediated through an adapter protein, relieves autoinhibition of the motor and activates fast, extremely processive motility. On the other hand, LIS1 binding directly to the motor domain of dynein blocks the structural rearrangement of the mechanical element of dynein, uncoupling ATP hydrolysis from the mechanical cycle and locking the motor into a high-affinity state on MTs. It is therefore surprising that we observed direct association of single LIS1 molecules with processively moving DDB complexes. A stable association of LIS1 with DDB does not appear to induce dramatic changes to the mechanochemical cycle of dynein, as has been observed in prior studies on dynein in the absence of dynactin (15–17). However, we observed more rare dynamic binding events that do appear to negatively influence DDB velocity, as predicted by the current model for LIS1 function. These results suggest that the effects of LIS1 on dynein motility are multifaceted, and the current understanding of LIS1 molecular activity (reviewed in Ref. 6) does not encompass the full range of possible LIS1 effects. One possible reason for these observations is that the effect of LIS1 on DDB motility may be sensitive to the nucleotide state of the dynein motor domains, including the nucleotide state of AAA3, which gates the MT affinity of dynein and lies near the LIS1 binding site (15, 16, 46, 47).
In addition to slowing the advance of dynein along the MT, LIS1 association greatly enhanced the ability of dynein to remain bound to the MT under opposing load in vitro (15) and has been reported to be necessary for the motility of larger, presumably high-load cargos in vivo (19, 20). In addition, isolated lipid droplets were recently shown to retain stably bound dynein, dynactin, and LIS1 proteins. Intriguingly, these droplets dynamically adapt their force output in the response to opposing external load in a LIS1-dependent manner (48). We cannot determine the effects of opposing load on DDB-L complex motility in our current fluorescence-based assays, but future experiments should focus on exploring the role of load in modulating the effects of LIS1 on DDB motility.
How does DDB move processively with LIS1 bound to dynein? Our data with LIS1 mutants suggests that LIS1 is indeed bound directly to the dynein motor domain during DDB motility, likely at the previously mapped interaction site near the AAA3/4 interface (16). At this site, LIS1 may play a role in regulating the recently identified AAA3 hydrolysis “gate” that switches dynein between slow and fast motility (46). The position of LIS1 at this site is sterically incompatible with the swing of the linker domain of dynein during ATP hydrolysis (17). However, in the DDB complex, it is currently unknown how dynactin binding to the distal tail domain of dynein, which is an extension of the linker, affects the linker position near the dynein motor domain. Conceivably dynactin binding may reposition the linker domain in such a way that allows LIS1 binding near AAA3/4. Intriguingly, tension applied to the linker appears to alter the AAA3 gating mechanism (49), suggesting a possible mechanism for dynactin-induced changes to linker function. Alternatively, LIS1 has been proposed to enhance the affinity of dynein for dynactin, possibly by relieving an autoinhibited conformation of dynein (37, 50, 51). Further work is required to distinguish these possibilities.
Recent cryo-EM data of DDB on MTs (52) suggests that the linker domain crosses the dynein motor domain, as previously observed in high-resolution structures of isolated dynein in solution (53–55). After crossing the motor domain, the linker appears to undergo a pronounced kink, before continuing into the distal tail domain (52), and a similar kink is also observed in isolated flagellar dynein (56). We speculate that this kink may provide flexibility to the linker position during DDB motility and may allow LIS1 association with processive DDB. This structure is likely the same as the “neck” region identified in yeast dynein, which, when artificially extended, enhances LIS1 association with yeast dynein (51). Further high-resolution structural work will be required to elucidate the arrangement of the DDB-L complex on MTs.
The concentration-dependent effects on DDB motility we observe provide insight into the mechanism of dynein deregulation by loss of a single copy of the LIS1 gene in vivo. At low LIS1 concentrations, stable association of single LIS1 molecules does not affect DDB velocity. However, higher LIS1 concentrations favor the binding of two LIS1 molecules to DDB, leading to activation of DDB velocity in our assays. Haploinsufficiency of LIS1 may lower the intracellular LIS1 concentration below the threshold needed to fully occupy both binding sites on the dynein dimer and activate the movement of the motor (Fig. 5). Further, it is not known how single or doubly occupied DDB complexes respond to load, a question that requires further investigation.
Figure 5.
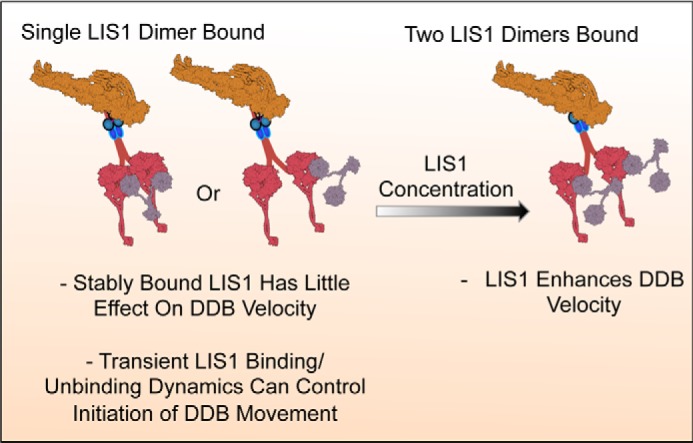
Model for LIS1 effects on DDB motility. Cartoon schematic showing the effects of LIS1 stoichiometry on DDB motility. A single LIS1 dimer (gray) could conceivably bind to one or both dynein motor domains (red) within a single DDB complex. Once stably bound, LIS1 does not exert strong effects on DDB motility in our assays. However, more rare binding/unbinding dynamics of LIS1 do regulate the initiation (LIS1 unbinding) or velocity (LIS1 binding) of DDB motility. Higher LIS1 concentrations favor binding of two LIS1 dimers to single DDB complexes. Each LIS1 most likely binds a single dynein motor domain, leading to activation of DDB velocity. LIS1 occupancy of dynein may be related to lissencephaly, a disease caused by haploinsufficiency of the LIS1 gene.
During review of this manuscript, Baumbach et al. (57) and Jha et al. (58) examined the effects of LIS1 on DDB recruitment to dynamic plus-ends of MTs and DDB motility along dynamic MTs. Both studies observed LIS1 facilitates the plus-end tracking of dynein but notably also did not significantly inhibit DDB motility along MTs, consistent with the results reported here. Interestingly, Baumbach et al. also observed co-localization of processive DDB and LIS1 proteins and the addition of LIS1 strongly enhanced the frequency and velocity of DDB movement, also consistent with our results. A broad consensus from these works, as well as our own, is that LIS1 does not strongly inhibit processive dynein-dynactin movement in vitro.
In sum, our data challenge the current molecular model for LIS1 function by demonstrating that LIS1 binding to the dynein motor domain does not sterically impede the powerstroke of dynein when it is complexed with an orthogonal regulatory factor dynactin (mediated through an adapter molecule, BicD2). Intriguingly, LIS1 forms a tight complex with the dynein regulatory factors, NudE/L (39, 59–61), which have been shown to compete with dynactin for binding to the dynein tail domain (62, 63). NudE/L act to stably recruit LIS1 to dynein (15, 18), and in contrast to LIS1 alone, the NudE/L-LIS1 complex does not induce pausing of processive movement of metazoan dynein along MTs but retains the ability to induce force-dependent attachment to the MT (15). How the presence of NudE/L affects the ability of LIS1 to interact with DDB will be of particular interest in future experiments.
Thus the effects of allosteric dynein regulatory factors are diverse and dependent on factor concentration and occupancy of individual dynein motors by orthogonal regulators. Our results provide a framework for future experiments to explore how dynein regulators may simultaneously exert effects on the mechanochemistry of the motor. How these regulatory factors interact with each other for proper spatiotemporal control of intracellular dynein activity is an outstanding question for future research in vivo, and in vitro reconstitutions such as ours will guide new hypotheses about dynein regulation that can be further examined in living cells.
Experimental procedures
DNA constructs
The N-terminal coiled-coil domain of mouse BicD2 (amino acids 25–425) and the SNAP-tagged and GST-dimerized human dynein motor domain were previously described (25). R. norvegicus LIS1 (PAFAH1b1, NP_113951.1) cDNA was obtained from GE Dharmacon and cloned into a modified pFastbacHTA vector containing an N-terminal StrepII-SNAPf tag using Gibson assembly. Mutations in LIS1 were made by site-directed mutagenesis using PCR (Q5 polymerase, NEB) and Gibson assembly. Protein sequences were validated by DNA sequencing (Quintara Biosciences).
Protein biochemistry
Porcine brain tubulin was isolated using the high-molarity PIPES procedure as described (64) and then labeled with biotin- or Dylight-405 NHS-ester (Invitrogen) as described (68). Microtubules were prepared by incubation of tubulin with 1 mm GTP for 10 min at 37 °C, followed by dilution into 20 μm taxol for an additional 20 min. Microtubules were pelleted at 80,000 rpm in a TLA-100 rotor, and the pellet was resuspended in 50 μl of BRB80 with 10 μm taxol. StrepII-SNAPf-BicD2N was isolated from bacteria as described (25). Purified BicD2N was used to isolate DDB complexes from rat brain cytosol as previously described (25). DDB complexes were labeled with 5 μm SNAP-TMR dye during the isolation procedure, were frozen in small aliquots, and stored at −80 °C.
Baculoviruses for LIS1 constructs were made according to the Bac-to-Bac protocol using SF9 cells (Invitrogen). SF9 cells were infected at 1–2 × 10⁶/ml, and typically P2 virus was used for protein expression at a 1:100 dilution. Infections were allowed to proceed for ∼60 h; cells were harvested; and the cell pellet was frozen and stored at −80 °C. The cells were thawed and resuspended in lysis buffer (50 mm Tris, pH 8.0, 150 mm potassium acetate, 2 mm MgCl2, 1 mm EGTA, 10% glycerol, 1 mm PMSF, 1 mm DTT). The cells were lysed by incubation with 1% Triton X-100 for 15 min on ice and five passages through a Dounce homogenizer. The cell pellet was centrifuged at 16,000 × g, and the supernatant was passed over a column packed with Streptactin Superflow resin (Qiagen). The column was washed with four column volumes of lysis buffer, and bound proteins were eluted in lysis buffer containing 3 mm desthiobiotin (Sigma). Eluted proteins were concentrated on Amicon filters and passed through an EnRich650 (Bio-Rad) or Superpose 6 (GE Healthcare) gel-filtration column, in lysis buffer, using a Bio-Rad NGC system. Peak fractions were collected, concentrated again, and frozen in small working aliquots. For labeling with SNAP dyes, proteins were labeled with 2–5 molar excess of SNAP dye (SNAP-Alexa 647 or SNAP-Surface 488) for 2–4 h on ice. The unbound dye was removed using Zebaspin columns (Thermo Fisher). The stoichiometry of labeling was assessed using a Nanodrop One (Thermo Fisher) and comparing the absorbance of total protein at 280 nm to the absorbance at the SNAP-dye wavelength. For TIRF experiments, we only used preparations at least 60% of LIS1 dimers contained at least one fluorophore. Concentrations given are for the total labeled amount of protein in the assay and are calculated for the dimeric forms of the proteins. All buffers and chemicals were from Sigma-Aldrich.
TIRF microscopy and data analysis
All microscopy was performed on a custom built through the objective TIRF microscope (Technical Instruments, Burlingame, CA) based on a Nikon Ti-E stand, motorized ASI stage, quad-band filter cube (Chroma), Andor laser launch (100 milliwatt 405 nm, 150 milliwatt 488 nm, 100 milliwatt 560 nm, 100 milliwatt 642 nm), EMCCD camera (iXon Ultra 897), and high-speed filter wheel (Finger Lakes Instruments). Emitted light passed through an Andor TuCam (Andor) in bypass mode and an XT2 Collimating Emission-Port Adapter (Photometrics). All imaging was done using a 100× 1.45NA objective (Nikon) and the 1.5× tube lens setting on the Ti-E. Laser power was set to 5%, and the camera EM gain was set to 300. Typical integration time was 0.5–0.7 s/frame. Experiments were conducted at room temperature. The microscope was controlled with Micro-manager software (65).
TIRF chambers were assembled from acid-washed coverslips (25) and double-sided sticky tape. Taxol-stabilized MTs were assembled with incorporation of ∼10% Dylight-405- and biotin-labeled tubulin. Chambers were first incubated with 0.5 mg/ml PLL-PEG-Biotin (Surface Solutions) for 10 min, followed by 0.5 mg/ml streptavidin for 5 min. Unbound streptavidin was washed away with 40 μl of BC buffer (80 mm Pipes, pH 6.8, 1 mm MgCl2, 1 mm EGTA, 1 mg/ml BSA, 1 mg/ml casein, 10 μm taxol). MTs diluted into BC buffer were then incubated in the chamber and allowed to adhere to the streptavidin-coated surface. Unbound MTs were washed away with TIRF assay buffer (60 mm Hepes, pH 7.4, 50 mm potassium acetate, 2 mm MgCl2, 1 mm EGTA, 10% glycerol, 0.5% Pluronic F-127, 0.1 mg/ml Biotin-BSA, 0.2 mg/ml κ-casein, 10 μm taxol). Typically ∼ 5 nm DDB and 15 nm labeled LIS1 was then diluted into TIRF assay buffer containing 2 mm Mg-ATP and introduced into the chamber. Images were acquired every ∼0.5–0.7 s. For binding to GST-hDyn, ∼10 nm purified and TMR-labeled motor was incubated with 0.1 unit/ml apyrase (Sigma) to induce rigor binding to the MTs, and 15 nm each LIS1 species in the TIRF chamber for 10 min before images were acquired.
The resulting data were analyzed manually using kymograph analysis in ImageJ (FIJI). For velocity analysis, the velocity of an uninterrupted run segment from a kymograph was used. Approximately 10–20% of the DDB complexes paused or changed velocity during the run and the velocity of the initial run segment before the change was used. Velocity analysis in Fig. 4 was performed by calculating the positions of the peaks in all data sets through fitting the data to a Gaussian Mixture Model (Matlab, Statistics toolbox; Mathworks, Natick, MA). The error bars were calculated via bias-corrected and accelerated bootstrap procedure (105 iterations for each case, with GMM parametric approach used for all iteration estimates) (66).
The TrackMate plugin (version 3.4.2) with LOG detector was used to analyze mean fluorescence intensity over time (Fig. 3, C and D). For all images displayed in figures, background was subtracted in FIJI using the “subtract background” function with a rolling ball radius of 25 and brightness, and contrast settings were modified linearly. The dissociation constant for LIS1 binding was calculated using the Hill equation, where [A] represents the concentration of LIS1 dimer in the assay, and fraction bound was the observed percentage of DDB particles bound to LIS1 molecules in the assay, assuming noncooperative binding:
| fraction bound=[A]Kd+[A] | (Eq. 1) |
|---|
Graphs were created using GraphPad Prism 7.0a, and statistical tests were performed using this program. All results are pooled from at least two independent experiments, which we define as experiments conducted on different days. Each experiment consisted of at least two or more technical replicates (individual TIRF chambers with independent protein mixtures) on a given day.
Author contributions
P. A. G., B. E. A., and R. J. M. designed and executed the experiments. All authors analyzed the data, and R. J. M. wrote the manuscript. M. V. provided analysis of velocity changes caused by LIS1 concentration. All authors approved the final manuscript.
Supplementary Material
Supplemental Data
Acknowledgments
We thank members of the McKenney and Ori-McKenney labs for helpful feedback during this project. We thank Julian Scherer and Frank McNally for helpful discussions.
This work was supported by National Science Foundation Grant ENG-1563280 (to M.V.), National Institutes of Health Grant R00 4R00NS089428-03 (to R. J. M.), and lab start-up funding from University of California-Davis (to R. J. M.). The authors declare that they have no conflicts of interest with the contents of this article. The content is solely the responsibility of the authors and does not necessarily represent the official views of the National Institutes of Health.
2
The abbreviations used are:
LIS1
Lissencephaly-1
MT
microtubule
DDB
dynein-dynactin-BicD2N
TIRF
total internal reflection fluorescence
SNAP
_O_6-alkylguanine-DNA alkyltransferase
TMR
6-carboxytetramethylrhodamine.
References
- 1.Allan V. J. (2011) Cytoplasmic dynein. Biochem. Soc. Trans. 39, 1169–1178 [DOI] [PubMed] [Google Scholar]
- 2.Carter A. P., Diamant A. G., and Urnavicius L. (2016) How dynein and dynactin transport cargos: a structural perspective. Curr. Opin. Struct. Biol. 37, 62–70 [DOI] [PubMed] [Google Scholar]
- 3.Heald R., Tournebize R., Blank T., Sandaltzopoulos R., Becker P., Hyman A., and Karsenti E. (1996) Self-organization of microtubules into bipolar spindles around artificial bipolar spindles around artifical chromosomes in Xenopus egg extracts. Nature 382, 420–425 [DOI] [PubMed] [Google Scholar]
- 4.Goshima G., Nédélec F., and Vale R. D. (2005) Mechanisms for focusing mitotic spindle poles by minus end-directed motor proteins. J. Cell Biol. 171, 229–240 [DOI] [PMC free article] [PubMed] [Google Scholar]
- 5.Merdes A., Ramyar K., Vechio J. D., and Cleveland D. W. (1996) A complex of NuMA and cytoplasmic dynein is essential for mitotic spindle assembly. Cell 87, 447–458 [DOI] [PubMed] [Google Scholar]
- 6.Cianfrocco M. A., DeSantis M. E., Leschziner A. E., and Reck-Peterson S. L. (2015) Mechanism and regulation of cytoplasmic dynein. Annu. Rev. Cell Dev. Biol. 31, 83–108 [DOI] [PMC free article] [PubMed] [Google Scholar]
- 7.Kardon J. R., and Vale R. D. (2009) Regulators of the cytoplasmic dynein motor. Nat. Rev. Mol. Cell Biol. 10, 854–865 [DOI] [PMC free article] [PubMed] [Google Scholar]
- 8.Vallee R. B., McKenney R. J., and Ori-McKenney K. M. (2012) Multiple modes of cytoplasmic dynein regulation. Nat. Cell Biol. 14, 224–230 [DOI] [PubMed] [Google Scholar]
- 9.Vallee R. B., and Tsai J. W. (2006) The cellular roles of the lissencephaly gene LIS1, and what they tell us about brain development. Genes Dev. 20, 1384–1393 [DOI] [PubMed] [Google Scholar]
- 10.Perlson E., Maday S., Fu M. M., Moughamian A. J., and Holzbaur E. L. (2010) Retrograde axonal transport: pathways to cell death? Trends Neurosci. 33, 335–344 [DOI] [PMC free article] [PubMed] [Google Scholar]
- 11.Lipka J., Kuijpers M., Jaworski J., and Hoogenraad C. C. (2013) Mutations in cytoplasmic dynein and its regulators cause malformations of cortical development and neurodegenerative diseases. Biochem. Soc. Trans. 41, 1605–1612 [DOI] [PubMed] [Google Scholar]
- 12.Cardoso C., Leventer R. J., Dowling J. J., Ward H. L., Chung J., Petras K. S., Roseberry J. A., Weiss A. M., Das S., Martin C. L., Pilz D. T., Dobyns W. B., and Ledbetter D. H. (2002) Clinical and molecular basis of classical lissencephaly: mutations in the LIS1 gene (PAFAH1B1). Hum. Mutat. 19, 4–15 [DOI] [PubMed] [Google Scholar]
- 13.Dobyns W. B., Reiner O., Carrozzo R., and Ledbetter D. H. (1993) Lissencephaly: a human brain malformation associated with deletion of the LIS1 gene located at chromosome 17p13. JAMA 270, 2838–2842 [DOI] [PubMed] [Google Scholar]
- 14.Vallee R. B., Seale G. E., and Tsai J. W. (2009) Emerging roles for myosin II and cytoplasmic dynein in migrating neurons and growth cones. Trends Cell Biol. 19, 347–355 [DOI] [PMC free article] [PubMed] [Google Scholar]
- 15.McKenney R. J., Vershinin M., Kunwar A., Vallee R. B., and Gross S. P. (2010) LIS1 and NudE induce a persistent dynein force-producing state. Cell 141, 304–314 [DOI] [PMC free article] [PubMed] [Google Scholar]
- 16.Huang J., Roberts A. J., Leschziner A. E., and Reck-Peterson S. L. (2012) Lis1 acts as a “clutch” between the ATPase and microtubule-binding domains of the dynein motor. Cell 150, 975–986 [DOI] [PMC free article] [PubMed] [Google Scholar]
- 17.Toropova K., Zou S., Roberts A. J., Redwine W. B., Goodman B. S., Reck-Peterson S. L., and Leschziner A. E. (2014) Lis1 regulates dynein by sterically blocking its mechanochemical cycle. Elife 3, 03372 [DOI] [PMC free article] [PubMed] [Google Scholar]
- 18.Zylkiewicz E., Kijańska M., Choi W. C., Derewenda U., Derewenda Z. S., and Stukenberg P. T. (2011) The N-terminal coiled-coil of Ndel1 is a regulated scaffold that recruits LIS1 to dynein. J. Cell Biol. 192, 433–445 [DOI] [PMC free article] [PubMed] [Google Scholar]
- 19.Yi J. Y., Ori-McKenney K. M., McKenney R. J., Vershinin M., Gross S. P., and Vallee R. B. (2011) High-resolution imaging reveals indirect coordination of opposite motors and a role for LIS1 in high-load axonal transport. J. Cell Biol. 195, 193–201 [DOI] [PMC free article] [PubMed] [Google Scholar]
- 20.Pandey J. P., and Smith D. S. (2011) A Cdk5-dependent switch regulates Lis1/Ndel1/dynein-driven organelle transport in adult axons. J. Neurosci. 31, 17207–17219 [DOI] [PMC free article] [PubMed] [Google Scholar]
- 21.Gill S. R., Schroer T. A., Szilak I., Steuer E. R., Sheetz M. P., and Cleveland D. W. (1991) Dynactin, a conserved, ubiquitously expressed component of an activator of vesicle motility mediated by cytoplasmic dynein. J. Cell Biol. 115, 1639–1650 [DOI] [PMC free article] [PubMed] [Google Scholar]
- 22.Schroer T. A., and Sheetz M. P. (1991) Two activators of microtubule-based vesicle transport. J. Cell Biol. 115, 1309–1318 [DOI] [PMC free article] [PubMed] [Google Scholar]
- 23.Kardon J. R., Reck-Peterson S. L., and Vale R. D. (2009) Regulation of the processivity and intracellular localization of Saccharomyces cerevisiae dynein by dynactin. Proc. Natl. Acad. Sci. U.S.A. 106, 5669–5674 [DOI] [PMC free article] [PubMed] [Google Scholar]
- 24.King S. J., and Schroer T. A. (2000) Dynactin increases the processivity of the cytoplasmic dynein motor. Nat. Cell Biol. 2, 20–24 [DOI] [PubMed] [Google Scholar]
- 25.McKenney R. J., Huynh W., Tanenbaum M. E., Bhabha G., and Vale R. D. (2014) Activation of cytoplasmic dynein motility by dynactin-cargo adapter complexes. Science 345, 337–341 [DOI] [PMC free article] [PubMed] [Google Scholar]
- 26.McKenney R. J., Huynh W., Vale R. D., and Sirajuddin M. (2016) Tyrosination of α-tubulin controls the initiation of processive dynein-dynactin motility. EMBO J. 35, 1175–1185 [DOI] [PMC free article] [PubMed] [Google Scholar]
- 27.Moughamian A. J., Osborn G. E., Lazarus J. E., Maday S., and Holzbaur E. L. (2013) Ordered recruitment of dynactin to the microtubule plus-end is required for efficient initiation of retrograde axonal transport. J. Neurosci. 33, 13190–13203 [DOI] [PMC free article] [PubMed] [Google Scholar]
- 28.Nirschl J. J., Magiera M. M., Lazarus J. E., Janke C., and Holzbaur E. L. (2016) α-Tubulin tyrosination and CLIP-170 phosphorylation regulate the initiation of dynein-driven transport in neurons. Cell Reports 14, 2637–2652 [DOI] [PMC free article] [PubMed] [Google Scholar]
- 29.Lloyd T. E., Machamer J., O'Hara K., Kim J. H., Collins S. E., Wong M. Y., Sahin B., Imlach W., Yang Y., Levitan E. S., McCabe B. D., and Kolodkin A. L. (2012) The p150(Glued) CAP-Gly domain regulates initiation of retrograde transport at synaptic termini. Neuron 74, 344–360 [DOI] [PMC free article] [PubMed] [Google Scholar]
- 30.Duellberg C., Trokter M., Jha R., Sen I., Steinmetz M. O., and Surrey T. (2014) Reconstitution of a hierarchical +TIP interaction network controlling microtubule end tracking of dynein. Nat. Cell Biol. 16, 804–811 [DOI] [PubMed] [Google Scholar]
- 31.Levy J. R., Sumner C. J., Caviston J. P., Tokito M. K., Ranganathan S., Ligon L. A., Wallace K. E., LaMonte B. H., Harmison G. G., Puls I., Fischbeck K. H., and Holzbaur E. L. (2006) A motor neuron disease-associated mutation in p150_Glued_ perturbs dynactin function and induces protein aggregation. J. Cell Biol. 172, 733–745 [DOI] [PMC free article] [PubMed] [Google Scholar]
- 32.Schlager M. A., Hoang H. T., Urnavicius L., Bullock S. L., and Carter A. P. (2014) In vitro reconstitution of a highly processive recombinant human dynein complex. EMBO J. 33, 1855–1868 [DOI] [PMC free article] [PubMed] [Google Scholar]
- 33.Hoogenraad C. C., and Akhmanova A. (2016) Bicaudal D family of motor adaptors: linking dynein motility to cargo binding. Trends Cell Biol. 26, 327–340 [DOI] [PubMed] [Google Scholar]
- 34.Urnavicius L., Zhang K., Diamant A. G., Motz C., Schlager M. A., Yu M., Patel N. A., Robinson C. V., and Carter A. P. (2015) The structure of the dynactin complex and its interaction with dynein. Science 347, 1441–1446 [DOI] [PMC free article] [PubMed] [Google Scholar]
- 35.Hoang H. T., Schlager M. A., Carter A. P., and Bullock S. L. (2017) DYNC1H1 mutations associated with neurological diseases compromise processivity of dynein-dynactin-cargo adaptor complexes. Proc. Natl. Acad. Sci. U.S.A. 114, E1597–E1606 [DOI] [PMC free article] [PubMed] [Google Scholar]
- 36.Yamada M., Toba S., Yoshida Y., Haratani K., Mori D., Yano Y., Mimori-Kiyosue Y., Nakamura T., Itoh K., Fushiki S., Setou M., Wynshaw-Boris A., Torisawa T., Toyoshima Y. Y., and Hirotsune S. (2008) LIS1 and NDEL1 coordinate the plus-end-directed transport of cytoplasmic dynein. EMBO J. 27, 2471–2483 [DOI] [PMC free article] [PubMed] [Google Scholar]
- 37.Wang S., Ketcham S. A., Schön A., Goodman B., Wang Y., Yates J. 3rd, Freire E., Schroer T. A., and Zheng Y. (2013) Nudel/NudE and Lis1 promote dynein and dynactin interaction in the context of spindle morphogenesis. Mol. Biol. Cell 24, 3522–3533 [DOI] [PMC free article] [PubMed] [Google Scholar]
- 38.Egan M. J., Tan K., and Reck-Peterson S. L. (2012) Lis1 is an initiation factor for dynein-driven organelle transport. J. Cell Biol. 197, 971–982 [DOI] [PMC free article] [PubMed] [Google Scholar]
- 39.Sasaki S., Shionoya A., Ishida M., Gambello M. J., Yingling J., Wynshaw-Boris A., and Hirotsune S. (2000) A LIS1/NUDEL/cytoplasmic dynein heavy chain complex in the developing and adult nervous system. Neuron 28, 681–696 [DOI] [PubMed] [Google Scholar]
- 40.Tai C. Y., Dujardin D. L., Faulkner N. E., and Vallee R. B. (2002) Role of dynein, dynactin, and CLIP-170 interactions in LIS1 kinetochore function. J. Cell Biol. 156, 959–968 [DOI] [PMC free article] [PubMed] [Google Scholar]
- 41.Tarricone C., Perrina F., Monzani S., Massimiliano L., Kim M. H., Derewenda Z. S., Knapp S., Tsai L. H., and Musacchio A. (2004) Coupling PAF signaling to dynein regulation: structure of LIS1 in complex with PAF-acetylhydrolase. Neuron 44, 809–821 [DOI] [PubMed] [Google Scholar]
- 42.Caspi M., Coquelle F. M., Koifman C., Levy T., Arai H., Aoki J., De Mey J. R., and Reiner O. (2003) LIS1 missense mutations: variable phenotypes result from unpredictable alterations in biochemical and cellular properties. J. Biol. Chem. 278, 38740–38748 [DOI] [PubMed] [Google Scholar]
- 43.Imai H., Shima T., Sutoh K., Walker M. L., Knight P. J., Kon T., and Burgess S. A. (2015) Direct observation shows superposition and large scale flexibility within cytoplasmic dynein motors moving along microtubules. Nat. Commun. 6, 8179. [DOI] [PMC free article] [PubMed] [Google Scholar]
- 44.Olenick M. A., Tokito M., Boczkowska M., Dominguez R., and Holzbaur E. L. (2016) Hook adaptors induce unidirectional processive motility by enhancing the dynein-dynactin interaction. J. Biol. Chem. 291, 18239–18251 [DOI] [PMC free article] [PubMed] [Google Scholar]
- 45.Torisawa T., Nakayama A., Furuta K., Yamada M., Hirotsune S., and Toyoshima Y. Y. (2011) Functional dissection of LIS1 and NDEL1 towards understanding the molecular mechanisms of cytoplasmic dynein regulation. J. Biol. Chem. 286, 1959–1965 [DOI] [PMC free article] [PubMed] [Google Scholar]
- 46.DeWitt M. A., Cypranowska C. A., Cleary F. B., Belyy V., and Yildiz A. (2015) The AAA3 domain of cytoplasmic dynein acts as a switch to facilitate microtubule release. Nat. Struct. Mol. Biol. 22, 73–80 [DOI] [PMC free article] [PubMed] [Google Scholar]
- 47.Bhabha G., Cheng H. C., Zhang N., Moeller A., Liao M., Speir J. A., Cheng Y., and Vale R. D. (2014) Allosteric communication in the dynein motor domain. Cell 159, 857–868 [DOI] [PMC free article] [PubMed] [Google Scholar]
- 48.Reddy B. J., Mattson M., Wynne C. L., Vadpey O., Durra A., Chapman D., Vallee R. B., and Gross S. P. (2016) Load-induced enhancement of Dynein force production by LIS1-NudE in vivo and in vitro. Nat. Commun. 7, 12259. [DOI] [PMC free article] [PubMed] [Google Scholar]
- 49.Nicholas M. P., Berger F., Rao L., Brenner S., Cho C., and Gennerich A. (2015) Cytoplasmic dynein regulates its attachment to microtubules via nucleotide state-switched mechanosensing at multiple AAA domains. Proc. Natl. Acad. Sci. U.S.A. 112, 6371–6376 [DOI] [PMC free article] [PubMed] [Google Scholar]
- 50.Dix C. I., Soundararajan H. C., Dzhindzhev N. S., Begum F., Suter B., Ohkura H., Stephens E., and Bullock S. L. (2013) Lissencephaly-1 promotes the recruitment of dynein and dynactin to transported mRNAs. J. Cell Biol. 202, 479–494 [DOI] [PMC free article] [PubMed] [Google Scholar]
- 51.Markus S. M., and Lee W. L. (2011) Regulated offloading of cytoplasmic dynein from microtubule plus ends to the cortex. Dev. Cell 20, 639–651 [DOI] [PMC free article] [PubMed] [Google Scholar]
- 52.Chowdhury S., Ketcham S. A., Schroer T. A., and Lander G. C. (2015) Structural organization of the dynein-dynactin complex bound to microtubules. Nat. Struct. Mol. Biol. 22, 345–347 [DOI] [PMC free article] [PubMed] [Google Scholar]
- 53.Schmidt H., Zalyte R., Urnavicius L., and Carter A. P. (2015) Structure of human cytoplasmic dynein-2 primed for its power stroke. Nature 518, 435–438 [DOI] [PMC free article] [PubMed] [Google Scholar]
- 54.Kon T., Oyama T., Shimo-Kon R., Imamula K., Shima T., Sutoh K., and Kurisu G. (2012) The 2.8 A crystal structure of the dynein motor domain. Nature 484, 345–350 [DOI] [PubMed] [Google Scholar]
- 55.Carter A. P., Cho C., Jin L., and Vale R. D. (2011) Crystal structure of the dynein motor domain. Science 331, 1159–1165 [DOI] [PMC free article] [PubMed] [Google Scholar]
- 56.Burgess S. A., Walker M. L., Sakakibara H., Knight P. J., and Oiwa K. (2003) Dynein structure and power stroke. Nature 421, 715–718 [DOI] [PubMed] [Google Scholar]
- 57.Baumbach J., Murthy A., McClintock M. A., Dix C. I., Zalyte R., Hoang H. T., and Bullock S. L. (2017) Lissencephaly-1 is a context-dependent regulator of the human dynein complex. Elife 6, e21768. [DOI] [PMC free article] [PubMed] [Google Scholar]
- 58.Jha R., Roostalu J., Trokter M., and Surrey T. (2017) Combinatorial regulation of the balance between dynein microtubule end accumulation and initiation of directed motility. bioRxiv, 10.1101/126508 [DOI] [PMC free article] [PubMed] [Google Scholar]
- 59.Niethammer M., Smith D. S., Ayala R., Peng J., Ko J., Lee M. S., Morabito M., and Tsai L. H. (2000) NUDEL is a novel Cdk5 substrate that associates with LIS1 and cytoplasmic dynein. Neuron 28, 697–711 [DOI] [PubMed] [Google Scholar]
- 60.Feng Y., Olson E. C., Stukenberg P. T., Flanagan L. A., Kirschner M. W., and Walsh C. A. (2000) LIS1 regulates CNS lamination by interacting with mNudE, a central component of the centrosome. Neuron 28, 665–679 [DOI] [PubMed] [Google Scholar]
- 61.Derewenda U., Tarricone C., Choi W. C., Cooper D. R., Lukasik S., Perrina F., Tripathy A., Kim M. H., Cafiso D. S., Musacchio A., and Derewenda Z. S. (2007) The structure of the coiled-coil domain of Ndel1 and the basis of its interaction with Lis1, the causal protein of Miller-Dieker lissencephaly. Structure 15, 1467–1481 [DOI] [PubMed] [Google Scholar]
- 62.Nyarko A., Song Y., and Barbar E. (2012) Intrinsic disorder in dynein intermediate chain modulates its interactions with NudE and dynactin. J. Biol. Chem. 287, 24884–24893 [DOI] [PMC free article] [PubMed] [Google Scholar]
- 63.McKenney R. J., Weil S. J., Scherer J., and Vallee R. B. (2011) Mutually exclusive cytoplasmic dynein regulation by NudE-Lis1 and dynactin. J. Biol. Chem. 286, 39615–39622 [DOI] [PMC free article] [PubMed] [Google Scholar]
- 64.Castoldi M., and Popov A. V. (2003) Purification of brain tubulin through two cycles of polymerization-depolymerization in a high-molarity buffer. Protein Expr. Purif. 32, 83–88 [DOI] [PubMed] [Google Scholar]
- 65.Edelstein A., Amodaj N., Hoover K., Vale R., and Stuurman N. (2010) Computer control of microscopes using microManager. Curr. Protoc. Mol. Biol. Chapter 14, Unit 14.20 [DOI] [PMC free article] [PubMed] [Google Scholar]
- 66.Nicholls A. (2014) Confidence limits, error bars and method comparison in molecular modeling: Part 1. the calculation of confidence intervals. J. Comput. Aided Mol. Des. 28, 887–918 [DOI] [PMC free article] [PubMed] [Google Scholar]
- 67.Lammers L. G., and Markus S. M. (2015) The dynein cortical anchor Num1 activates dynein motility by relieving Pac1/LIS1-mediated inhibition. J Cell Biol. 211, 309–322 [DOI] [PMC free article] [PubMed] [Google Scholar]
- 68.Al-Bassam J. (2014) Reconstituting dynamic microtubule polymerization regulation by TOG domain proteins. Methods Enzymol. 540, 131–148 [DOI] [PubMed] [Google Scholar]
Associated Data
This section collects any data citations, data availability statements, or supplementary materials included in this article.
Supplementary Materials
Supplemental Data