CDK4/6 inhibition triggers anti-tumor immunity (original) (raw)
. Author manuscript; available in PMC: 2018 Feb 16.
Published in final edited form as: Nature. 2017 Aug 16;548(7668):471–475. doi: 10.1038/nature23465
Abstract
Cyclin-dependent kinases 4 and 6 (CDK4/6) are fundamental drivers of the cell cycle and are required for the initiation and progression of various malignancies1,2. Pharmacologic inhibitors of CDK4/6 have shown significant activity against several solid tumors3,4. Their primary mechanism of action is thought to be the inhibition of phosphorylation of the retinoblastoma (RB) tumor suppressor, inducing G1 cell cycle arrest in tumor cells5. Here, we use murine models of breast carcinoma and other solid tumors to show that selective CDK4/6 inhibitors not only induce tumor cell cycle arrest, but also promote anti-tumor immunity. We confirm this phenomenon through transcriptomic analysis of serial biopsies from a clinical trial of CDK4/6 inhibitor treatment for breast cancer. The enhanced anti-tumor immune response has two underpinnings. First, CDK4/6 inhibitors activate tumor cell expression of endogenous retroviral elements, thus increasing intracellular levels of double-stranded RNA. This in turn stimulates production of type III interferons and hence enhances tumor antigen presentation. Second, CDK4/6 inhibitors markedly suppress the proliferation of regulatory T cells (Tregs). Mechanistically, the effects of CDK4/6 inhibitors on both tumor cells and Tregs are associated with reduced activity of the E2F target, DNA methyltransferase 1. Ultimately, these events promote cytotoxic T cell-mediated clearance of tumor cells, which is further enhanced by the addition of immune checkpoint blockade. Our findings indicate that CDK4/6 inhibitors increase tumor immunogenicity and provide rationale for new combination regimens comprising CDK4/6 inhibitors and immunotherapies as anti-cancer treatment.
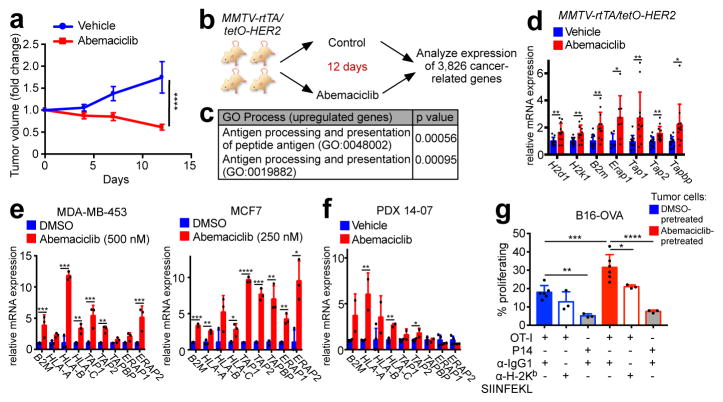
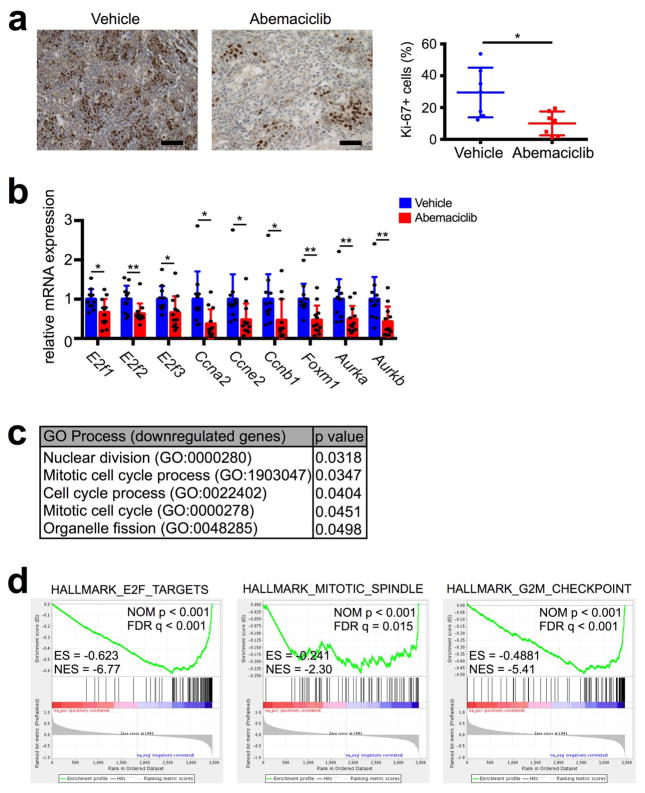
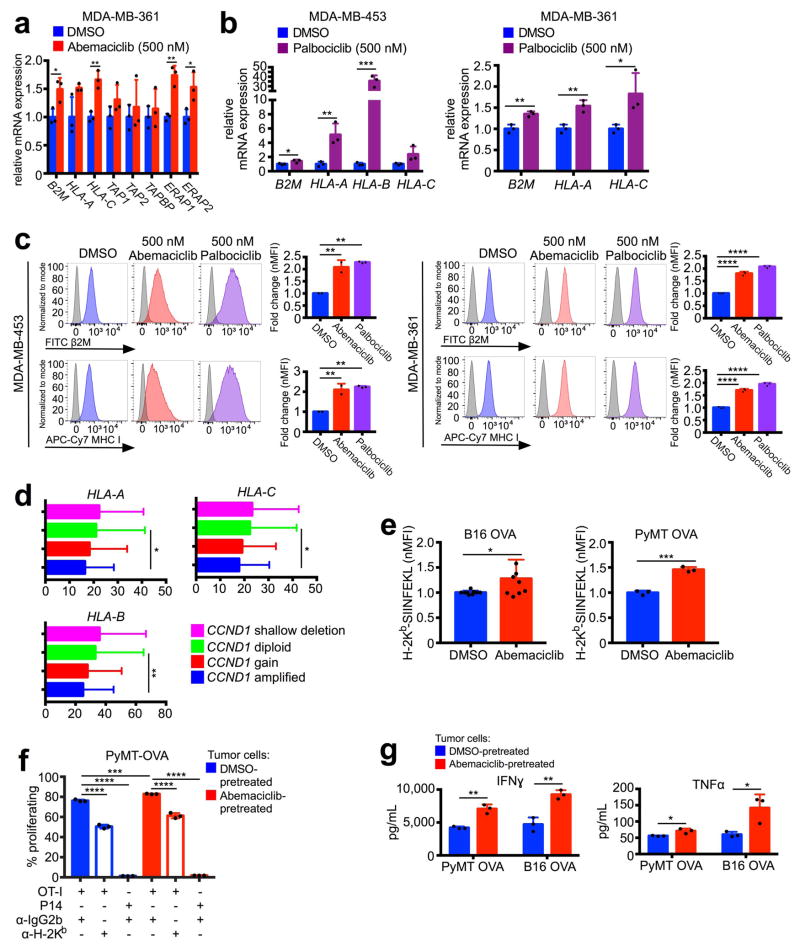
We first assessed the impact of CDK4/6 inhibition in vivo using our recently described MMTV-rtTA/tetO-HER2 transgenic mouse model of mammary carcinoma6. Cells derived from these tumors express RB and arrest in response to CDK4/6 inhibition6. In three independent experiments, the CDK4/6 inhibitor abemaciclib caused regression of bulky tumors, evidenced by a ~40% reduction in tumor volume at the 12-day end-point (Fig. 1a). As expected, abemaciclib reduced tumor cell proliferation (Extended Data Fig. 1a). Expression analysis across a panel of 3,826 cancer-related genes from MMTV-rtTA/tetO-HER2 tumors (Fig. 1b) showed that abemaciclib downregulated genes within Gene Ontology (GO) and Gene Set Enrichment Analysis (GSEA) terms relating to cell cycle, mitosis, and E2F targets (Extended Data Fig. 1b–d). Strikingly, only two GO process terms were significantly enriched for genes upregulated by abemaciclib: “antigen processing and presentation of peptide antigen” and “antigen processing and presentation” (Fig. 1c). Specifically, genes encoding murine major histocompatibility complex (MHC) class I molecules were upregulated in abemaciclib-treated tumors (H2d1, H2k1, and B2m), as were genes directing peptide cleavage (Erap1), peptide transporters (Tap1 and Tap2), and transporter-MHC interactions (Tapbp) (Fig. 1d). Moreover, abemaciclib treatment in vitro increased expression of homologous genes in human breast cancer cell lines (MDA-MB-453, MCF7, and MDA-MB-361) (Fig. 1e; Extended Data Fig. 2a) and palbociclib, another CDK4/6 inhibitor, yielded similar results (Extended Data Fig. 2b). Importantly, treatment with either agent increased cell-surface expression of β2M and MHC class I proteins (Extended Data Fig. 2c). The CDK4/6 inhibitor-induced increase in expression of antigen processing and presentation genes was also observed in a patient-derived breast cancer xenograft of a treatment-refractory breast cancer (PDX 14-07, previously described6) (Fig. 1f). Furthermore, analysis of The Cancer Genome Atlas (TCGA) data7 revealed that breast cancers harboring cyclin D1 amplification (i.e., enhanced CDK4/6 activity) display significantly lower expression of HLA-A, HLA-B, and HLA-C than non-amplified tumors (Extended Data Fig. 2d).
Figure 1. CDK4/6 inhibitors induce tumor regression and increase antigen presentation.
a, Impact of abemaciclib treatment on MMTV-rtTA/tetO-HER2 tumor volume (two-way ANOVA, vehicle, n=17; abemaciclib, n=22 tumors). b–d, In vivo experimental schema depicted in (b) (vehicle, n=11; abemaciclib, n=12 tumors). Gene ontology terms with p<0.05 (c) and expression of antigen presentation genes (d) are shown. e–f, Antigen presentation gene expression in cells (e) (7d, n=3) and PDX tumors (f) (21–28d, vehicle, n=4; abemaciclib, n=2 tumors) after abemaciclib treatment. g, CD8+ T cell proliferation in response to abemaciclib-pretreated B16-OVA cells (OT-I + anti-IgG1, n=6; other conditions, n=3; one-way ANOVA adjusted for multiple comparisons) Unpaired two-tailed t-tests (d–f). Error bars SD; except (a), SEM. *p<0.05, **p<0.01, ***p<0.001, ****p<0.0001. For source data, see Supplementary Table 2.
To determine the functional consequences of increased antigen presentation gene expression, we treated ovalbumin (OVA) expressing murine cancer cell lines (_MMTV-PyMT_-S2WTP3-OVA and B16-OVA) with abemaciclib. Abemaciclib increased expression of MHC class I-bound SIINFEKL, an 8 amino acid peptide derived from OVA (Extended Data Fig. 2e), confirming enhanced antigen processing and presentation. Co-culture of abemaciclib-pretreated tumor cells with MHC class I-restricted OVA-specific CD8+ T cells (OT-I cells) significantly increased OT-I cell proliferation, IFN-gamma production, and TNF-alpha production (Fig. 1g; Extended Data Figs. 2f, g). CD8+ T cell proliferation was both antigen-specific (P14 CD8+ T cells, which recognize an irrelevant antigen, did not increase their proliferation) and MHC class I-specific (MHC class I blocking antibody partially suppressed OT-I T cell proliferation) (Fig. 1g; Extended Data Fig. 2f).
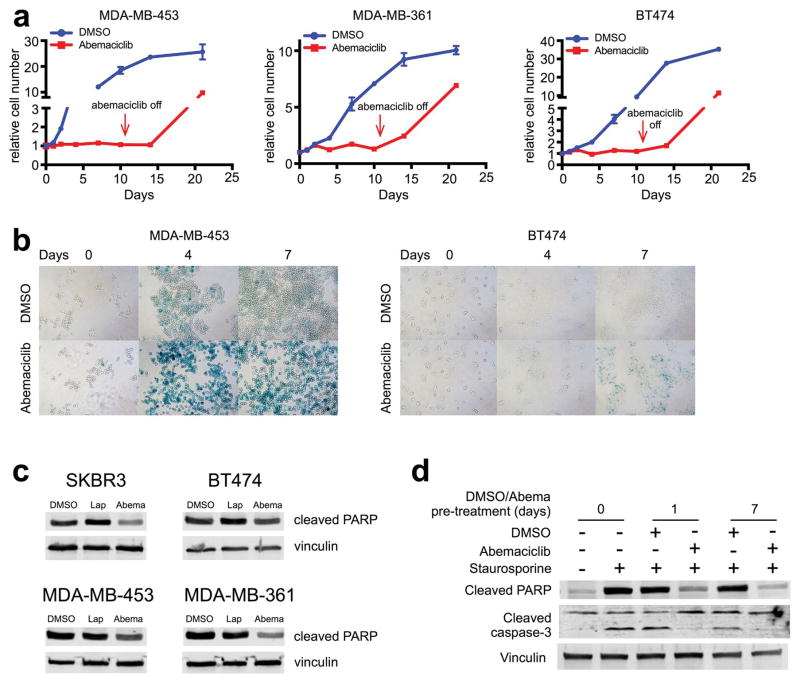
In agreement with other reports2,6, abemaciclib did not directly induce breast cancer cell apoptosis; rather, it caused cell cycle arrest and induced cellular phenotypes consistent with senescence (Extended Data Fig. 3a, b). Cellular senescence has been associated with apoptosis resistance8; indeed, abemaciclib reduced tumor cell Poly ADP-ribose polymerase cleavage and suppressed the apoptotic response to staurosporine (Extended Data Fig. 3c, d). Collectively, these results establish that CDK4/6 inhibitors induce breast cancer cell cytostasis without directly causing their apoptosis, and enhance their capacity to present antigen and stimulate cytotoxic T cells.
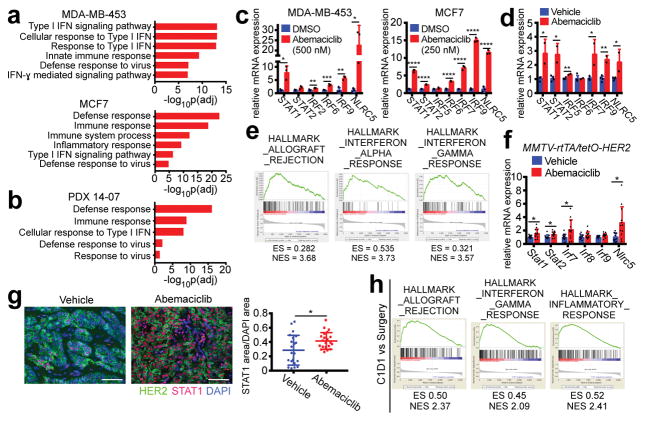
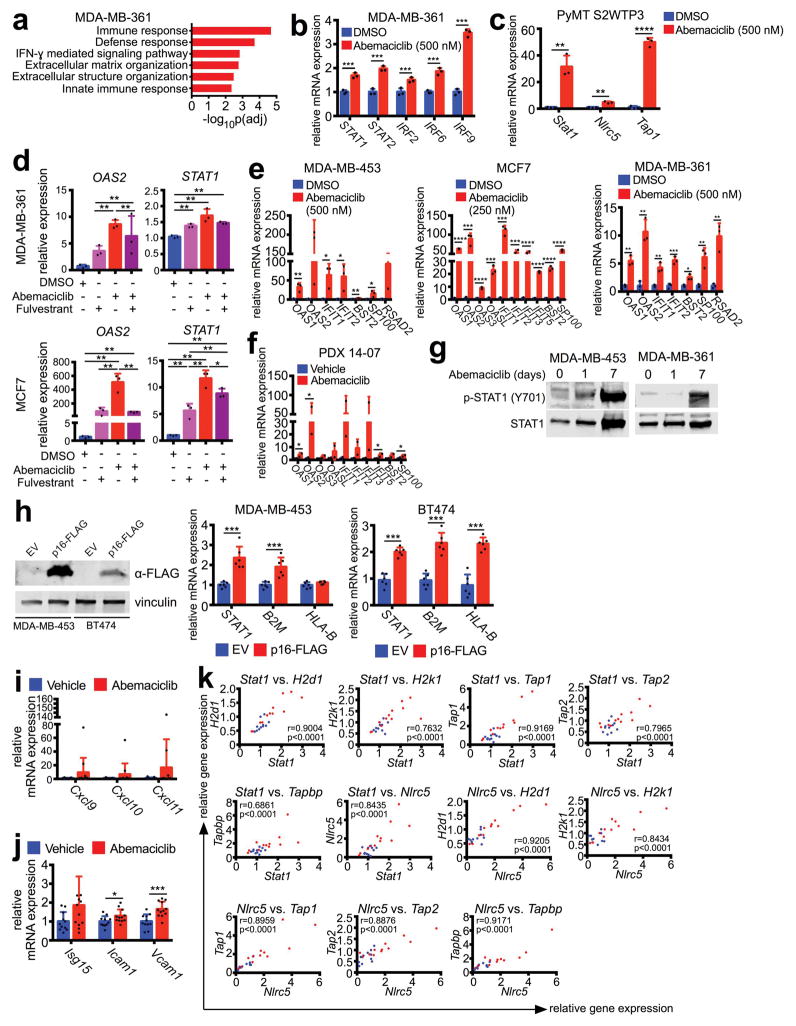
We next sought mechanistic insight for the increase in antigen presentation after CDK4/6 inhibition. Genome-wide transcriptomic analysis of three human breast cancer cell lines and PDX 14-07 tumors revealed that abemaciclib upregulated expression of genes within GO terms related to interferon signaling and cellular defense response to virus (Fig. 2a, b; Extended Data Fig. 4a). Several interferon-sensitive transcription factors (e.g., STAT1, STAT2, IRF2, IRF6, IRF9, and NLRC5) were upregulated in all three cell lines, PDX 14-07 tumors, and _MMTV-PyMT_-S2WTP3 cells (Figs. 2c, d; Extended Data Figs. 4b, c). Similar trends were observed when abemaciclib was given in conjunction with anti-estrogen therapy - the current standard in luminal breast cancer treatment (Extended Data Fig. 4d). Expression of other interferon-sensitive genes (ISGs) - OAS1, OAS2, IFIT1, IFIT2, BST2, SP100, RSAD2 - was also enhanced in cell lines and PDX tumors, suggesting global upregulation of an interferon-driven transcriptional program (Extended Data Figs. 4e, f). Consistent with active interferon signaling, both phosphorylated and total STAT1 protein were increased after abemaciclib treatment (Extended Data Fig. 4g). Furthermore, forced overexpression of the endogenous CDK4/6 inhibitor CDKN2A (encoding p16INK4a) increased expression of STAT1, B2M, and MHC class I genes (Extended Data Fig. 4h), suggesting that these are “on-target” effects.
Figure 2. CDK4/6 inhibition stimulates interferon signaling.
a–b, Top ranked GO terms in abemaciclib-treated tumor cells (a) (7d, n=3) or PDX tumors (b) (21–28d, vehicle, n=4; abemaciclib, n=2 tumors). c–d, Interferon-responsive gene expression from samples in (a) and (b). e–f, Upregulated GO terms (e) and expression of interferon-responsive transcription factors (f) in abemaciclib-treated MMTV-rtTA/tetO-HER2 tumors (12d, vehicle, n=11; abemaciclib, n=12 tumors). g, MMTV-rtTA/tetO-HER2 tumor STAT1 staining (12d, scale bar=100 μm, n=21). h, Upregulated GSEA signatures after 12wk of palbociclib in NeoAnaPal trial. (C1D1, n=34; surgery, n=23). Unpaired two-tailed tests (c, d, f); Mann-Whitney test (h); Error bars, SD. *p<0.05, **p<0.01, ***p<0.001, ****p<0.0001. For all GSEA, nom p<0.001, FDR q<0.001.
Importantly, we made similar observations in MMTV-rtTA/tetO-HER2 tumor tissues after abemaciclib treatment. Enriched GSEA expression signatures included “allograft rejection”, “interferon alpha response”, and “interferon gamma response” (Fig. 2e). Specifically, abemaciclib also significantly increased tumor expression of interferon-responsive transcription factors in these tumors (Fig. 2f), as well as that of interferon-inducible T cell chemoattractants and other ISGs involved in lymphocyte adhesion and co-stimulation (Extended Data Figs. 4i, j). STAT1 protein levels were also higher within tumor cells of the abemaciclib-treated cohort (Fig. 2g). In keeping with their roles in regulating antigen presentation via MHC class I, in vivo expression of transcription factors Stat1 and Nlrc5 was tightly correlated with that of H2d1, H2k1, Tap1, Tap2, and Tapbp in MMTV-rtTA/tetO-HER2 tumors (Extended Data Fig. 4k). Thus, CDK4/6 inhibition directly induces ISG expression in tumor cells, likely explaining their enhanced capacity for antigen presentation.
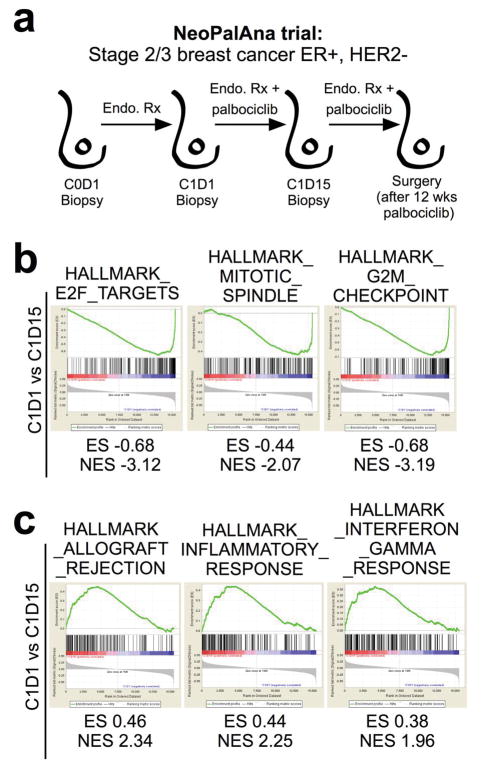
We next interrogated genome-wide expression data from the NeoPalAna trial, in which patients with primary ER-positive breast cancer underwent tumor biopsies before commencing palbociclib and serially after 2 and 12 weeks of treatment (Extended Data Fig. 5a)9. As expected, palbociclib treatment significantly downregulated genes within the “E2F target” and other cell cycle-related signatures (Extended Data Fig. 5b). When we compared upregulated genes from biopsies taken before initiation of palbociclib to those after 12 weeks of treatment, 3 of the top 5 ranked “Hallmarks” GSEA signatures were “allograft rejection”, “inflammatory response” and “interferon gamma response” (Fig. 2h) and these gene sets were already significantly upregulated after 2 weeks of palbociclib treatment (Extended Data Fig. 5c). These signatures are the same as those we observed to be upregulated in the tumors from abemaciclib-treated MMTV-rtTA/tetO-HER2 mice (Fig. 2e), and demonstrate the clinical relevance of our findings.
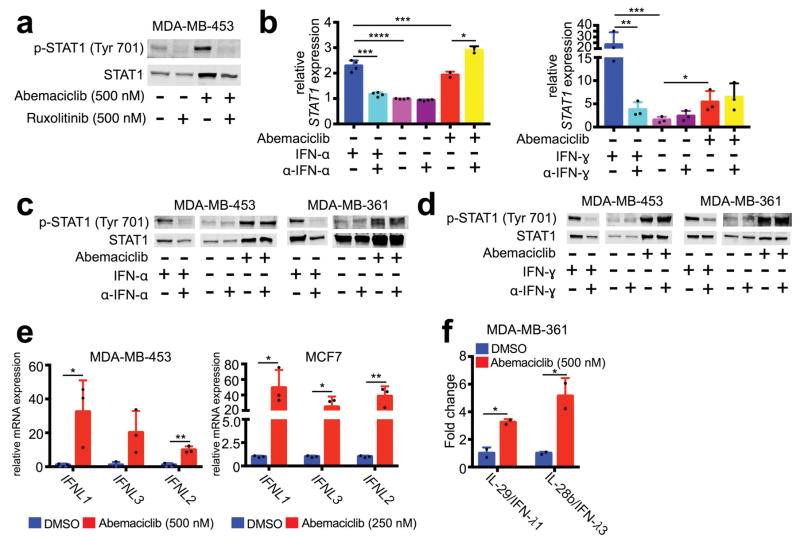
We speculated that heightened ISG expression after CDK4/6 inhibition might be caused by enhanced tumor cell interferon production. The Janus Kinases (JAKs) mediate intracellular signaling after ligand-dependent activation of interferon receptor, and the JAK inhibitor ruxolitinib completely mitigated abemaciclib-induced increases in tumor cell p-STAT1 and total STAT1 (Extended Data Fig. 6a), suggesting that CDK4/6 inhibition stimulates tumor cell interferon production. Notably, ELISA did not detect interferons alpha, beta, or gamma in conditioned medium of abemaciclib-treated tumor cells (not shown), and neutralizing antibodies against interferons alpha and gamma did not mitigate interferon signaling (Extended Data Fig. 6b–d). However, gene expression and protein secretion of type III interferons (IL-29, IL-28a, and IL-28b) were significantly increased in abemaciclib-treated tumor cells (Fig. 3a; Extended Data Figs. 6e, f). Neutralizing antibodies to type III interferons reversed abemaciclib-induced increases in tumor cell p-STAT1 and total STAT1 (Fig. 3b). Collectively, these data suggest that CDK4/6 inhibition increases tumor cell production of type III interferons to drive ISG expression in an autocrine fashion.
Figure 3. CDK4/6 inhibitors suppress DNMT1, inducing viral mimicry.
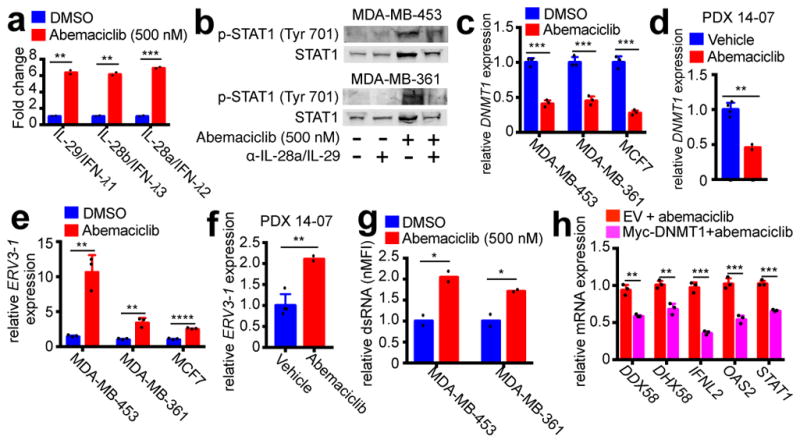
a, Tumor cell type III interferon secretion measured by ELISA (7d). b, Impact of Type III IFN neutralization on phospho- and total STAT1 protein (7d). c–d, DNMT1 expression after abemaciclib or control in cells (b) (7d, n=3) or PDX tumors (d) (21–28d, vehicle, n=4; abemaciclib, n=2 tumors). e–f, ERV3-1 expression in samples from (c) and (d). g, dsRNA levels in abemaciclib-treated tumor cells (7d, n=2). h, Effect of DNMT1 overexpression on gene expression in MDA-MB-453 cells after 7d abemaciclib (50nM) (n=3). Abemaciclib at 500nM in vitro, unless noted, except MCF-7, 250nM. Unpaired two-tailed t-tests (a, c–h). Error bars, SD. *p<0.05, **p<0.01, ***p<0.001, ****p<0.0001. For western blot source images, see Supplementary Figure 1.
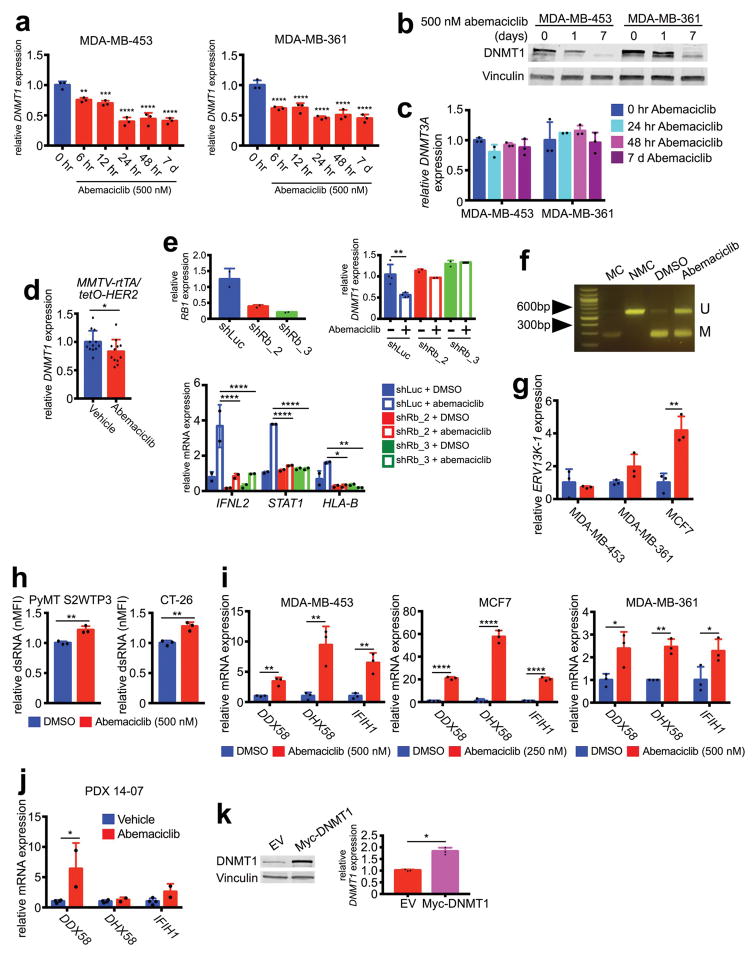
Increased tumor cell interferon signaling via type III interferon production has previously been shown to occur in response to DNA demethylation caused by agents such as 5-azacytidine, which inhibits DNA methyltransferases (DNMTs)10. In that context, DNMT inhibition reduces methylation of endogenous retroviral genes (ERVs), triggering “viral mimicry” and a double-stranded RNA (dsRNA) response, in turn stimulating type III interferon production to activate ISGs10. Notably, the mammalian DNA methyltransferase DNMT1 is a bona fide E2F target gene, and CDK4/6 enzyme activity can enhance DNMT1 gene expression in an RB-E2F dependent fashion11. Strikingly, tumor cell levels of DNMT1 (but not DNMT3A) mRNA and protein fell markedly and rapidly in abemaciclib-treated cell lines (Fig. 3c; Extended Data Figs. 7a–c). Similarly, abemaciclib reduced DNMT1 mRNA levels in vivo in both PDX 14-07 and MMTV-rtTA/tetO-HER2 tumors (Fig. 3d; Extended Data Fig. 7d). These were on-target effects, as abemaciclib did not reduce DNMT1 levels in tumor cells expressing shRNA targeting RB1 (Extended Data Fig. 7e). The abemaciclib-related increases in IFNL2, STAT1, and HLA-B expression were also mitigated in shRNA-RB1 cells (Extended Data Fig. 7e), supporting the concept that the RB-E2F-DNMT1 axis mediates type III interferon production and its downstream consequences.
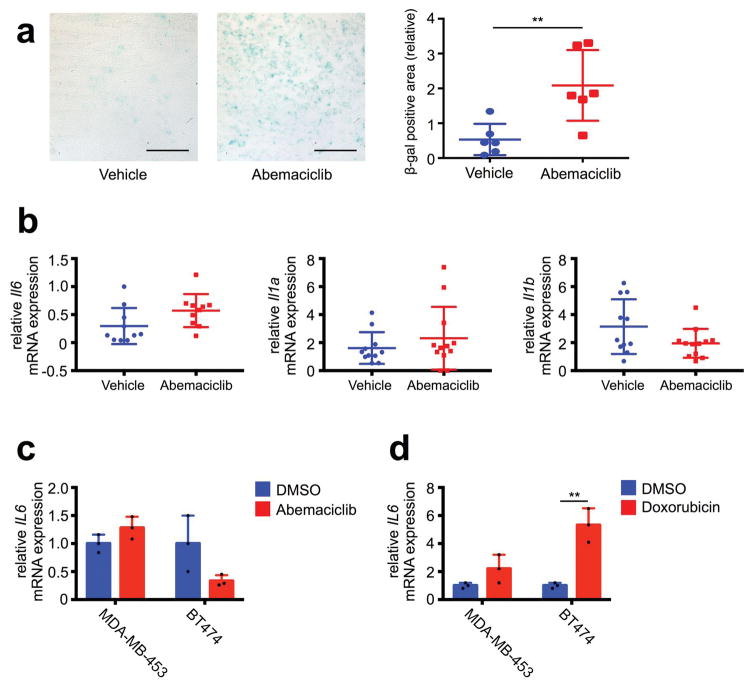
Consistent with previous studies10,12, suppression of DNMT1 was associated with reduced DNA methylation at ERV sequences; combined bisulfite restriction analysis (COBRA) showed that abemaciclib decreased tumor cell DNA methylation at the 5′-LTR of ERV3-1 (Extended Data Fig. 7f). Accordingly, expression of certain ERVs was increased in vitro and in vivo (Fig. 3e, f; Extended Data Fig. 7g), accompanied by significantly higher levels of dsRNA within tumor cells (Fig. 3g; Extended Data Fig. 7h). In turn, expression of the dsRNA pattern recognition receptors, RIG-1 (DDX58), LGP2 (DHX58), and MDA5 (IFIH1), was significantly increased in cell lines and PDX tumors (Extended Data Fig. 7i, j). In further support of abemaciclib-mediated DNMT1 suppression as the trigger for this cascade of events, overexpression of DNMT1 in tumor cells attenuated the abemaciclib-induced increase in expression of dsRNA response genes, type III interferon, and ISGs (Fig. 3h; Extended Data Fig. 7k). Independent of altered ERV expression, CDK4/6 inhibitors could theoretically increase tumor cell immunogenicity by inducing a “senescence associated secretory phenotype” (SASP)13. Although abemaciclib increased tumor cell beta-galactosidase activity (Extended Data Fig. 3b, 8a), expression of key SASP factors was not increased (Extended Data Fig. 8b, c and Supplementary Table 1). In contrast, doxorubicin increased tumor cell expression of SASP genes (Extended Data Fig. 8d), consistent with the notion that the SASP is more pertinent to DNA damage response-associated senescence13 and does not explain tumor immunogenicity after CDK4/6 inhibition.
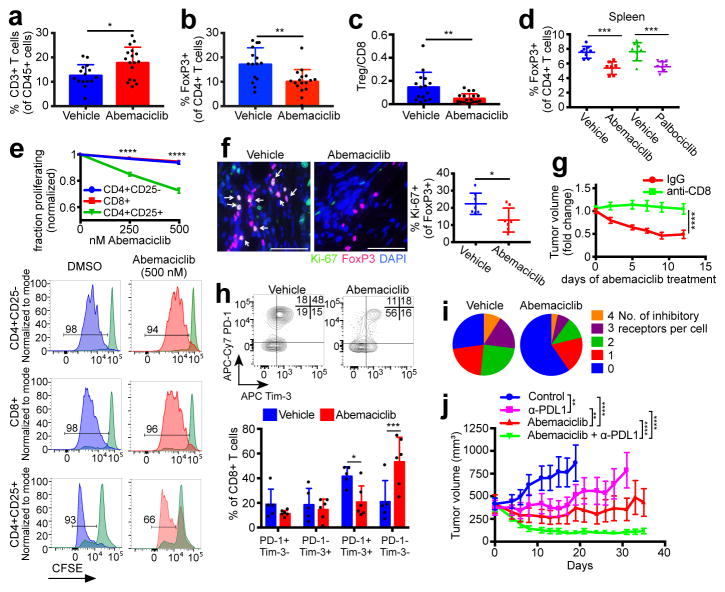
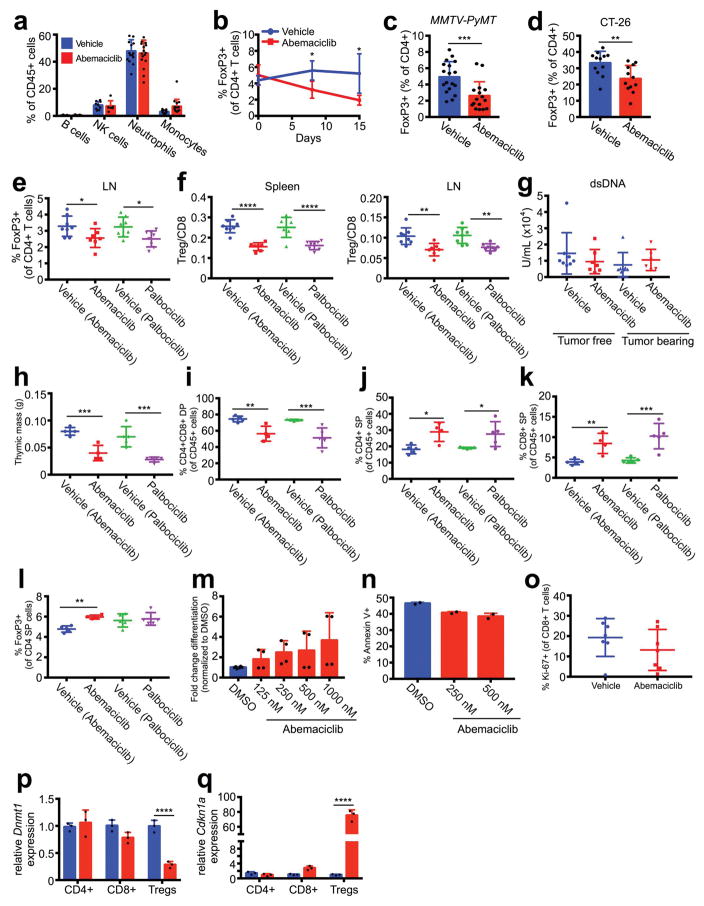
Our observation that CDK4/6 inhibition enhances the efficiency of tumor cell antigen presentation prompted us to examine the tumor immune microenvironment. Flow cytometric analysis of MMTV-rtTA/tetO-HER2 tumors revealed that abemaciclib did not alter fractions of most types of tumor-infiltrating leukocytes (Extended Data Fig. 9a). Strikingly, however, there were significant increases in CD3+ T cells (Fig. 4a) and reductions in CD4+FOXP3+ regulatory T cells (Tregs, Fig. 4b). Circulating Treg numbers were also significantly lower (Extended Data Fig. 9b). These results were upheld in MMTV-PyMT mammary and CT-26 colorectal carcinomas (Extended Data Fig. 9c, d). Moreover, the Treg:CD8 T cell ratio decreased significantly in abemaciclib-treated tumors, further suggesting a tipping of the immune balance in favor of anti-tumor immunity (Fig. 4c).
Figure 4. CDK4/6 inhibition modulates the immune milieu.
a–c, Intratumoral T cells (a), Tregs (b), and Treg:CD8 ratios (c) in MMTV-rtTA/tetO-HER2 tumors (12d treatment, vehicle, n=15; abemaciclib, n=17 tumors). d, Tregs in spleens of tumor-free mice (12d, vehicle and palbociclib, n=8; abemaciclib, n=7 mice). e, T cell proliferation in vitro. f, Ki-67/FoxP3 staining of MMTV-rtTA/tetO-HER2 tumors (12d, scale bar=50 μm, n=7). g, MMTV-rtTA/tetO-HER2 tumor volume after treatment with abemaciclib +−/ anti-CD8 neutralizing antibody (n=17 tumors). h, Inhibitory co-receptors on MMTV-rtTA/tetO-HER2 intratumoral CD8+ T cells (6d, vehicle, n=5; abemaciclib, n=6 tumors). i, Number of inhibitory receptors per cell on CD8+ T cells from (h). j, MMTV-rtTA/tetO-HER2 tumor volume after treatment with abemaciclib +/− anti-PDL1 (control and anti-PD-L1, n=18; abemaciclib and combination, n=19 tumors). Unpaired two-tailed t-tests (a–c,f), one-way ANOVA corrected for multiple comparisons (d, j), two-way ANOVA (g) corrected for multiple comparisons (e,h). Error bars, SD; except (g,j), SEM. *p<0.05, **p<0.01, ***p<0.001, ****p<0.0001. For source data, see Supplementary Table 2.
In tumor-free mice, both abemaciclib and palbociclib significantly reduced Treg numbers and the Treg:CD8 ratio in the spleen and lymph nodes, demonstrating tumor-independent effects of these agents (Fig. 4d; Extended Data Fig. 9e, f). Plasma levels of anti-nuclear and anti-double stranded DNA antibodies were unchanged (not shown; Extended Data Fig. 9g), indicating no significant accompanying autoimmune phenotype. To understand why Tregs were reduced in number, we analyzed the impact of CDK4/6 inhibitors on various aspects of Treg biology. Palbociclib and abemaciclib each significantly reduced total thymic mass, decreased immature CD4+CD8+ double-positive thymocytes, and increased the fractions of CD4+ and CD8+ single-positive thymocytes (Extended Data Fig. 9h–k), consistent with previous reports of CDK6 inhibition14. However, proportions of thymic Tregs were unchanged, arguing against a defect in natural Treg production (Extended Data Fig. 9l). Similarly, CDK4/6 inhibitors did not prevent in vitro differentiation of naïve CD4+ T cells into Tregs, and did not affect rates of Treg apoptosis (Extended Data Fig. 9m, n). We then turned our attention to Treg proliferation. In vitro, abemaciclib markedly reduced the proliferation of CD4+CD25+ Tregs isolated from spleens and lymph nodes of wild-type mice, but had a weaker effect on the proliferation of CD4+CD25− and CD8+ T cells (Fig. 4e). Likewise, the fraction of proliferating Tregs, but not CD8+ T cells, within abemaciclib-treated tumor tissue was significantly reduced (Fig. 4f; Extended Data Fig. 9o). DNMT1 inhibition in Tregs has previously been reported to suppress their proliferation, ostensibly via hypomethylation of the Cdkn1a promoter, thus increasing expression of the Cdkn1a protein, p21 - a potent and promiscuous cell cycle inhibitor15. In tumor-free mice treated with abemaciclib for 12 days, Dnmt1 expression was reduced in Tregs by ~70%; in contrast, Dnmt1 mRNA was unchanged in naïve CD4+ T cells and fell by only 20% in CD8+ T cells (Extended Data Fig. 9p). Mirroring the magnitude of these changes, expression of Cdkn1a increased 75-fold in Tregs, 2.8-fold in CD8+ T cells, and was unchanged in naïve CD4+ T cells (Extended Data Fig. 9q). Therefore, the relatively selective suppression of Treg proliferation after CDK4/6 inhibition could relate to enhanced cell cycle inhibition due to overexpression of p21, associated with reduced levels of DNMT1.
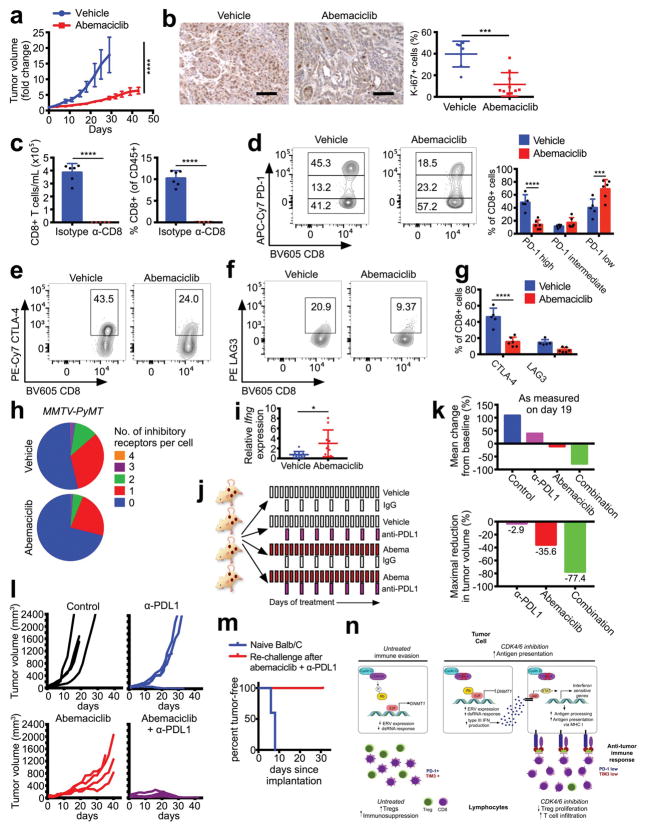
Tumor cells presenting antigen via MHC class I can be recognized by cytotoxic T lymphocytes (CTLs), and Tregs suppress CTL responses, in part by promoting their exhaustion16. Therefore, to determine whether CTLs were involved in abemaciclib-mediated therapeutic efficacy, we implanted MMTV-rtTA/tetO-HER2 tumor fragments orthotopically into athymic Foxn1nu mice maintained on doxycycline, and treated them once tumors were established. In contrast to tumors in immunocompetent mice, abemaciclib-treated tumors in nude mice continued to grow, albeit at a significantly slower rate than vehicle-treated tumors, and in no case did tumors regress (Extended Data Fig. 10a, b). We therefore treated MMTV-rtTA/tetO-HER2 tumor-bearing mice with an anti-CD8 antibody prior to abemaciclib administration. Abemaciclib-induced tumor regression, which was observed in control IgG treated mice, was significantly mitigated by CD8 neutralization (Fig. 4g and Extended Data Fig. 10c). Hence, tumor regression mediated by CDK4/6 inhibition is, at least in part, dependent on the presence of CTLs.
Intratumoral CD8+ T cells in abemaciclib-treated mice displayed markedly reduced expression of PD-1, Tim-3, CTLA-4, and LAG3 (Fig. 4h and Extended Data Fig. 10d–g), markers typically indicative of T cell exhaustion17. The number of inhibitory receptors detected on any given CTL was lower in abemaciclib-treated MMTV-rtTA/tetO-HER2 and MMTV-PyMT tumors (Fig. 4i, Extended Data Fig. 10h). Specifically, the fractions of both PD-1high and PD-1+/TIM-3+ CTLs were significantly reduced (Fig. 4h; Extended Data Fig. 10d). Levels of Ifng mRNA (the main effector cytokine of CTLs) were more than 4-fold higher in abemaciclib-treated bulk tumor tissues (Extended Data Fig. 10i). Collectively, these results indicated that CDK4/6 inhibition results in activation of CTLs, which are necessary for abemaciclib-induced tumor regression.
Increased tumor cell antigen presentation coupled with anti-tumor T cell responses suggested that immune checkpoint blockade might further enhance the efficacy of abemaciclib. We treated MMTV-rtTA/tetO-HER2 tumor-bearing mice with either vehicle or abemaciclib, and a control IgG or an anti-PDL1 antibody (Extended Data Fig. 10j). In agreement with our initial experiments, abemaciclib-treated tumors initially decreased in volume before stabilizing and ultimately resuming growth by day 21 (Fig. 4j). In contrast, tumors in mice treated with abemaciclib and anti-PDL1 combination therapy regressed to the greatest degree (~70% reduction in tumor volume by day 13), and did not resume growth by day 35 (Fig. 4j; Extended Data Fig. 10k). Similar results were obtained for the CT-26 colorectal carcinoma model, wherein combination therapy induced complete tumor regression in all cases, and rendered mice disease-resistant when re-challenged with a subsequent injection of CT-26 tumor cells 5 weeks after stopping therapy (Extended Data Fig. 10l, m).
Collectively, our data in cell lines, animal models, and breast cancer patients demonstrate that CDK4/6 inhibitors enhance anti-tumor immunity by overcoming two central mechanisms of tumor immune evasion (Extended Data Fig. 10n). First, they increase tumor cells’ functional capacity to present antigen. Second, they reduce the immunosuppressive Treg population by suppressing their proliferation. Intriguingly, these phenomena might not only cooperate to enhance tumor immunogenicity, but could also have the same mechanistic underpinning – suppression of the Rb-E2F axis, leading to reduced DNMT1 expression and thus hypomethylation of genes that regulate immune function10,12,15. The selective suppression of Treg proliferation (and not that of CD8+ or naïve CD4+ T cells) might relate to the fact that Tregs express higher levels of Rb1, a key mediator of CDK4/6 pathway modulation18 (e.g. Rb1 expression is 3.1-fold higher in Tregs than CD8+ T cells19). With respect to breast cancer specifically, we note that the majority of human breast cancers are estrogen-receptor positive – these tumors generally retain Rb function and are considered inherently less immunogenic. Interestingly, a high number of Tregs in these tumors also predicts a poor clinical outcome20. Our findings therefore suggest that CDK4/6 inhibitors might enhance the susceptibility of such tumors to immune checkpoint blockade.
Methods
Animal experiments
MMTV-rtTA/tetO-HER2 mice6 were maintained in house. Female FVB MMTV-PyMT, Balb/c (6–7 weeks old), and Foxn1nu (8 weeks old) mice were purchased from Jackson Labs. Female FVB mice (7 weeks old) were purchased from Taconic Biosciences. P14-TCR transgenic mice (gift from Dr. Kai Wucherpfennig, Harvard Medical School), and OT-I mice (C57BL/6 Tg(TcraTcrb)1100Mjb/J; Jackson Labs) were used as a source of CD8+ T cells for in vitro co-culture assays. FVB CD45.2+ mice (gift from Dr. Daniel Tenen, Harvard Medical School) were used as a source of T cells for in vitro studies.
Tumors were induced and maintained in MMTV-rtTA/tetO-HER2 mice using doxycycline as previously described6. For experiments in transgenic MMTV-rtTA/tetO-HER2 and MMTV-PyMT mice, tumors measured 4–10 mm at treatment initiation. Prior to treatment, mice were assigned into groups of equal average tumor volume. For CT-26 experiments, 1×10⁵ tumor cells were injected subcutaneously in 1:1 PBS:Matrigel, injected subcutaneously into Balb/c mice, and treatment was initiated one week later. For rechallenge experiments, 5×10⁵ tumor cells were injected subcutaneously in 1:1 PBS:Matrigel 33 days after treatment was stopped. PDX 14-07 was established from a biopsy of a liver metastasis from a patient with ER+/Her2+ breast cancer as previously described6.
For studies in Foxn1nu mice, MMTV-rtTA/tetO-HER2 tumor fragments were orthotopically implanted bilaterally into nude mice, as previously described6. Prior to treatment initiation, mice were randomized into groups of equal average tumor volume (5–10 mm diameter).
For in vivo experiments, samples sizes were determined based on previous model-specific experience. Tumors were measured by caliper 2–3 times per week, and volume was calculated as previously described6. For tumor growth kinetic analysis, we performed two-way ANOVA or one-way ANOVA tests with correction for multiple comparisons using Sidak’s multiple comparisons test. No animals were excluded from analyses. Ex vivo analyses of mouse tissues were performed in a blinded fashion such that the investigators were unaware of treatment groups. Source data for tumor volume measurements can be found in Supplementary Table 2.
Abemaciclib (75–90 mg/kg, as noted for individual experiments, Haoyuan Chemexpress, prepared as previously described6) and palbociclib (90mg/kg, Haoyuan Chemexpress, diluted in 50 nM sodium D-lactate) were administered daily by oral gavage. For CD8 depletion experiments, mice were injected intraperitoneally with either α-CD8 antibody (400 μg; clone YTS 169.4, BioXcell) or isotype control (400 μg; clone LTF-2, BioXcell) 48 and 24 hours prior to beginning abemaciclib therapy (90mg/kg) and every 4 days thereafter. For combination therapy, treatment with abemaciclib was initiated at a dose of 90 mg/kg daily for 3 days; thereafter, the dose was dropped to 75mg/kg daily and intraperitoneal injection of either α-PDL1 antibody (200 μg every 72 hours; BioXcell, clone 10F.9G2) or isotype control antibody (200 μg every 72 hours, clone LTF-2, BioXcell) was added to the regimen.
Mice were euthanized using CO2 inhalation. All mouse experiments were performed in compliance with federal laws and institutional guidelines as approved by the Institutional Animal Care and Use Committees of Dana-Farber Cancer Institute, Harvard Medical School, and Boston Children’s Hospital. The maximum tumor diameter permitted under the relevant animal protocols is 25mm, and this limit was not exceeded in any experiment.
Immunohistochemistry and immunofluorescence
Immunostaining for Ki-67 (Vector), HER2 (AB16901; Abcam), and STAT1 (AB47425; Abcam) was performed as previously described6. Secondary antibodies (AF488 AffiniPure donkey anti-mouse IgG, Cy3 AffiniPure donkey anti-rabbit IgG) were from Jackson ImmunoResearch Laboratories. Images were acquired with a Yokogawa spinning disk confocal on an inverted Nikon T_i_ fluorescence microscope using MetaMorph image acquisition software, and 3–5 fields were analyzed per tumor. Image analysis was performed using a semi-automated in-house platform (NIH ImageJ).
Immunofluorescence for FoxP3 (clone FJK-16s; eBioscience), CD8 (clone 4SM15; eBioscience), and Ki-67 (clone SP6; Thermo Scientific) was performed as previously described21. Secondary antibodies (AF488 donkey anti-rabbit IgG, AF647 goat anti-rat IgG) were from Life Technologies. Tissues were counterstained with DAPI (Invitrogen). Images were acquired on a Nikon Eclipse N_i_ microscope using NIS Elements software, and 5–10 fields were analyzed per tumor.
Human cell lines
BT474, SKBR3, MDA-MB-361, MDA-MB-453, and MCF7 human breast cancer cell lines were maintained as previously described6 with slight modifications: antibiotics and anti-fungals were not used in cell culture media. MCF7 cells were cultured in RPMI medium (Gibco) supplemented with 10% FBS (Gibco). All cell lines were obtained from ATCC, tested negative for mycoplasma, and their identity was verified by short tandem repeat analysis (Promega GenePrint 10 System).
Murine cell lines
_MMTV-PyMT_-S2WTP3 cells22 (gift from Dr. Andreas Möller, QIMR Berghofer Medical Research Institute) were cultured in DMEM (Gibco) supplemented with 10% FBS (Gibco). B16-OVA cells23 were cultured in DMEM supplemented with 10% FBS and 250 μg/mL G418 (Invitrogen). CT-26 cells (gift from Dr. Steve Elledge, Harvard University) were cultured in RPMI (Gibco) supplemented with 10% FBS. All cell lines tested negative for mycoplasma, and their murine strain of origin was confirmed by short tandem repeat analysis (Bioassay Methods Group, NIST).
In vitro drug studies
Abemaciclib and lapatinib (Haoyuan Chemexpress) were diluted as previously described6. For in vitro use, palbociclib was diluted in DMSO. Cleaved PARP was measured after 48 hours of treatment with DMSO, lapatinib, or abemaciclib. Lapatinib was used at 30 nM for BT474 and SKBR3; 500 nM for MDA-MB-453 and MDA-MB-361. Abemaciclib was used at 300 nM for BT474 and SKBR3; 25 nM for MDA-MB-453; 500 nM for MDA-MB-361. For staurosporine experiments, MDA-MB-453 cells were pretreated with DMSO or abemaciclib (500 nM) for 0, 1, or 7 days prior to exposure to staurosporine (500nM, Enzo Life Sciences) for 4 hours. For hormonal therapy studies, cells were treated with combinations of DMSO, abemaciclib (100 nM), and fulvestrant (100 nM, Sigma Aldrich). To determine JAK dependency, cells were treated with combinations of DMSO, abemaciclib (500nM), and ruxolitinib (500nM, Selleckchem) for 7 days.
Western blots
Western blotting was carried out as previously described6 using antibodies to cleaved PARP (CST 9541), cleaved caspase-3 (CST 9661), phospho-STAT1 Y701 (CST 9167), STAT1 (CST 9172), and FLAG (CST 2368) (Cell Signaling Technologies), vinculin (V9131, Sigma) and DNMT1 (92314, Abcam). For western blots assessing phosphorylated and total STAT1 in tumor cells, lysates from equivalent numbers of cells were loaded in each lane. Uncropped western blots can be found in Supplementary Figure 1.
β-galactosidase activity
SA-β-galactosidase expression was determined as previously described6.
Transcriptome methodology
AmpliSeq™ libraries were constructed and sequenced on the Ion Torrent Proton platform (Thermo Fisher) according to the manufacturer’s instructions as previously described24,25. For human gene analysis in cell lines, the Ion AmpliSeq Transcriptome Human Gene Expression Kit is designed for targeted amplification of over 20,000 human RefSeq genes simultaneously in a single primer pool. A short amplicon (~110 bp) is amplified for each targeted gene. Since an AmpliSeq transcriptome mouse kit is not commercially available, an Ion AmpliSeq™ Custom Panel was designed by the manufacturer (Thermo Fisher) using Ion AmpliSeq™ Designer for targeted amplification of 3,826 mouse genes that are most relevant for our studies (one short amplicon for each gene) in one primer pool for mouse studies. For each sample, 10 ng of total RNA was used for cDNA library preparation. Multiple libraries were multiplexed and clonally amplified using the Ion OneTouch 2 System (Thermo Fisher), and then sequenced on an Ion Torrent Proton machine (Thermo Fisher). Data was first analyzed by Torrent Suite and ampliSeqRNA analysis plugin (Thermo Fisher) to generate count data.
Mouse transcriptome analysis
Raw read counts per gene were mapped to corresponding human homologs, using homology information from the Mouse Genome Informatics database (The Jackson Laboratory). For GO analysis, differential gene expression was determined using DESeq226 and genes were ranked according to log2 fold change (MAP). For GSEA analysis, we used the GSEAPreranked tool, with the above ranked gene list, using MSigDB v5.1 Hallmarks gene sets collection and the “classic” method for calculating enrichment scores27,28.
Human transcriptome analysis
Analyses were performed on normalized read counts per gene. For GO analysis, only genes with an absolute read count of >20 on at least one sample were included. For these genes, the fold change in normalized read count was determined for each replicate experiment, and the mean fold change was calculated for each gene. Genes with a mean fold change of >2 (DMSO vs abemaciclib) were then included for analysis using gene ontology enrichment analysis.
The Cancer Genome Atlas (TCGA) analysis
Gene expression data were obtained using the cBioPortal for Cancer Genomics (http://www.cbioportal.org). Data were obtained from the breast cancer dataset “TCGA, Provisional (1105 samples)” for comparisons between cyclin D1 shallow deletion, amplified, gain, and diploid tumors7,29.
RT-qPCR
RT-qPCR was performed as previously described6. Primer sequences used for qPCR were as follows: Ifng (mouse) forward:5′-ATG-AAC-GCT-ACA-CAC-TGC-ATC-3′; reverse:5′-CCA-TCC-TTT-TGC-CAG-TTC-CTC-3′. Tap1 (mouse) forward:5′-GGA-CTT-GCC–TTG-TTC-CGA-GAG-3′; reverse:5′-GCT-GCC-ACA-TAA-CTG-ATA-GCG-A-3′. Tap2 (mouse) forward:5′-CTG-GCG-GAC-ATG-GCT-TTA-CTT-3′; reverse:5′-CTC-CCA-CTT-TTA-GCA-GTC-CCC-3′. Tapbp (mouse) forward:5′-GGC-CTG-TCT-AAG-AAA-CCT-GCC-3′; reverse:5′-CCA-CCT-TGA-AGT-ATA-GCT-TTG-GG-3′. Erap1 (mouse) forward:5′-TAA-TGG-AGA-CTC-ATT-CCC-TTG-GA-3′; reverse:5′-AAA-GTC-AGA-GTG-CTG-AGG-TTT-G-3′. Nlrc5 (mouse) forward:5′-GCT-GAG-AGC-ATC-CGA-CTG-AAC-3′; reverse:5′-AGG-TAC-ATC-AAG-CTC-GAA-GCA-3′. Il6 (mouse) forward:5′-TAG-TCC-TTC-CTA-CCC-CAA-TTT-CC-3′; reverse:5′-TTG-GTC-CTT-AGC-CAC-TCC-TTC-3′. Dnmt1 (mouse) forward:5′-CCG-TGG-CTA-CGA-GGA-GAAC-3′; reverse:5′-TTG-GGT-TTC-CGT-TTA-GTG-GGG-3′. Cdkn1a (mouse) forward:5′-CCT-GGT-GAT-GTC-CGA-CCT-G-3′; reverse:5′-CCA-TGA-GCG-CAT-CGC-AAT C-3′. B2M (human) forward:5′-GAG-GCT-ATC-CAG-CGT-ACT-CCA-3′; reverse:5′-CGG-CAG-GCA-TAC-TCA-TCT-TTT-3′. HLA-A (human) forward:5′-ACC-CTC-GTC-CTG-CTA-CTC-TC-3′; reverse:5′-CTG-TCT-CCT-CGT-CCC-AAT-ACT-3′. HLA-B (human) forward:5′-CAG-TTC-GTG-AGG-TTC-GAC-AG-3′; reverse:5′-CAG-CCG-TAC-ATG-CTC-TGG-A-3′. HLA-C (human) forward:5′-GGA-CAA-GAG-CAG-AGA-TAC-ACG-3′; reverse:5′-CAA-GGA-CAG-CTA-GGA-CAA-CC-3′. STAT1 (human) forward:5′-CAG-CTT-GAC-TCA-AAA-TTC-CTG-GA-3′; reverse:5′-TGA-AGA-TTA-CGC-TTG-CTT-TTC-CT-3′. IL6 (human) forward:5′-ACT-CAC-CTC-TTC-AGA-ACG-AAT-TG-3′; reverse:5′-CCA-TCT-TTG-GAA-GGT-TCA-GGT-TG-3′. IFNL2 (human) forward:5′-ACG-CGA-GAC-CTG-AAT-TGT-GT-3′; reverse:5′-AGC-GAC-TGG-GTG-GCA-ATA-AA-3′. DDX58 (human) forward:5′-CTG-GAC-CCT-ACC-TAC-ATC-CTG-3′; reverse:5′-GGC-ATC-CAA-AAA-GCC-ACG-G-3′. DHX58 (human) forward:5′-GGG-CCT-CCA-AAC-TCG-ATG-G-3′; reverse:5′-TTC-TGG-GGT-GAC-ATG-ATG-CAC-3′. OAS2 (human) forward:5′-GGA-GCT-TCC-TGA-TTG-GCA-GA-3′; reverse:5′—ATG-TAG-GGT GGC-AAG-CAC-TG-3′. RB1 (human) forward:5′-CTC-TCG-TCA-GGC-TTG-AGT-TTG-3′; reverse:5′-GAC-ATC-TCA-TCT-AGG-TCA-ACT-GC-3′. Relative copy number was determined by calculating the fold change difference in the gene of interest relative to GAPDH or HSP90AB1 (human), or Actb or Hsp90ab1 (mouse). qPCR was performed on the Applied Biosystems 7300 machine.
Flow cytometry
Tumor cell lines
1×10⁶ cells per condition were stained with the appropriate antibodies diluted in PBS (Hyclone) plus 2% FBS (Life Technologies) for 30 minutes on ice. Matched fluorescence minus one (FMO) staining for each condition was performed as a control.
Blood
Obtained by retro-orbital sampling at intermediate time points and by cardiac puncture at experimental endpoints. Blood cells and plasma were separated by centrifugation at 1,500 × g for 8 minutes at 4°C.
Spleen, thymus, and lymph nodes
Single cell suspensions were obtained by mechanical digestion.
Tumor
Tumors were first mechanically disrupted by chopping, then chemically digested in dissociation buffer (2 mg/mL collagenase type IV (Worthington Biochemical), 0.02 mg/mL DNase (Sigma Aldrich) in DMEM (Life Technologies) containing 5% FBS (Life Technologies), PenStrep (Hyclone)) with agitation at 37°C for 45 minutes.
Following RBC lysis if necessary (blood, spleen, thymus, tumor; PharmLyse, BD Biosciences), single cell suspensions were blocked with anti-CD16/32 (Biolegend) for 20 minutes on ice and then incubated with appropriate antibodies for 30 min on ice.
Murine antibodies: Antibodies were purchased from Biolegend unless otherwise indicated: CD45 (clone 30-F11), CD3 (clone 145-2C11), CD8 (clone 53-6.7), CD4 (clone RM4-5), PD-1 (clone 29F.1A12), Tim-3 (clone RMT3-23), CTLA-4 (clone UC10-4B9), LAG-3 (clone C9B7W), B220 (clone RA3-6B2), NK1.1 (clone PK136), CD11b (clone M1/70), Ly6G (clone 1A8), Ly6C (clone AL-21; BD Pharmigen), and FoxP3 (clone FJK-16s; eBioscience). Human antibodies: β2-microglobulin (clone 2M2) and HLA-A,B,C (clone W6/32). Anti-mouse/rat FoxP3 staining set (eBioscience) was used for intracellular staining according to the manufacturer’s instructions. dsRNA was detected by the K1 antibody (English and Scientific Consulting (Hungary) using 75% ethanol for fixation. 7AAD was used to distinguish live/dead cells, except in cases requiring intracellular staining in which case eFluor 450 (eBioscience) or Zombie Yellow (Biolegend) fixable viability dyes were used. To determine the absolute number of cells in a sample, CountBright absolute counting beads (Molecular Probes, ThermoFisher) were added. Flow cytometry was performed on a LSRII (BD Biosciences) or FACSCANTOII (BD Biosciences), and data was analyzed using FlowJo (TreeStar). Flow cytometry gating strategies can be found in the Supplementary Methods (regulatory T cell gating strategy, Supplementary Methods 1; thymic cell populations, Supplementary Methods 2; and immune checkpoint molecules on intratumoral T cells, Supplementary Methods 3).
Tumor cell/OT-I co-culture assay
_MMTV-PyMT_-S2WTP3-OVA and B16-OVA cells were pre-treated with abemaciclib (500 nM or 1000 nM, respectively) or DMSO for 7d. Tumor cells were pre-incubated with 40 μg/mL of appropriate antibodies for 1 hr at 37°C. For the _MMTV-PyMT_-S2WTP3-OVA experiments, anti-H-2Kb (clone Y-3) or isotype control IgG2b (clone MPC-11) were used from Bioxcell. For the B16-OVA experiments, anti-H-2Kb-SIINFEKL (clone 25-D1.16) or isotype control (clone IS5-21F5) from Miltenyl Biotec were utilized. CD8+ T cells were isolated from spleens and lymph nodes of OT-I or P14 mice using a CD8a+ T cell isolation kit (Miltenyl Biotec) with an autoMACS pro separator. Isolated T cells were suspended in RPMI (ATCC) with 5% FBS, labeled with 5 μM CFSE (Biolegend) for 10 minutes in the dark at room temperature, and washed twice in 10× volume of T cell media (RPMI, 10% FBS, 55 μM 2-Mercaptoethanol (Gibco)). 1×10⁵ CD8+ T cells were co-cultured with abemaciclib or control pre-treated tumor cells at a ratio of 1:8 tumor cells:T cells (_MMTV-PyMT_-S2WTP3-OVA) or 1:4 tumor cells:T cells (B16-OVA) in a final concentration of 10 μg/mL of the appropriate antibody with 2.5 ng/mL IL-7 (Peprotech), 50 ng/mL IL-15 (Peprotech), and 2 ng/mL IL-2 (Peprotech) for 48 hrs (_MMTV-PyMT_-S2WTP3-OVA) or 72 hrs (B16-OVA) at 37°C in the dark. At the experimental endpoint, cytokines in conditioned media were analyzed by ELISA, and CD8+ T cell proliferation was determined by CFSE-dilution by flow cytometry.
Overexpression vectors and transfection
_MMTV-PyMT_-S2WTP3 cells were infected with lentiviral particles expressing the pHAGE-deltaOA-zsGreen plasmid as previously described6, and infected cells were isolated by FACS.
MDA-MB-453 and BT474 cells were transient transfected with pBabepuro3-p16Flag (Addgene Cat # 24934) using Lipofectamine 3000 (Thermo Fisher) according to the manufacturer’s instructions. 72 hours after transfection cells were selected in puromycin for 48 hours. p16 overexpression was confirmed by anti-FLAG western blots.
For overexpression of DNMT1, MDA-MB-453 cells were transfected with the pcDNA3/Myc-DNMT1 vector (Addgene Cat #36939) using Lipofectamine 3000 according to the manufacturer’s instructions. Cells were treated with abemaciclib 72 hrs after transfection.
ELISAs
Cells were treated with DMSO or abemaciclib (500 nM) for 7 days. For the last 24 hours, culture media was replaced with serum free media. Following concentration of conditioned medium using Amicon Ultra centrifugal filters (Millipore), cytokines were analyzed according to the manufacturer’s recommendations: human IFN gamma ELISA Ready-SET-Go! (Affymetrix eBioscience), human TNF alpha ELISA Ready-SET-Go! (Affymetrix eBioscience), Verikine human IFN alpha ELISA kit (PBL assay science), VeriKine-HS human IFN beta serum ELISA kit (PBL assay science), human IL-28B quantikine ELISA kit (R&D Systems), human IL-28A DuoSet ELISA (R&D Systems), and human IL-29 DuoSet ELISA (R&D Systems). Cytokine production by OT-I T cells in OVA/OT-I co-culture assays was measured by mouse IFN gamma ELISA Ready-SET-Go! (Affymetrix eBioscience) and mouse TNF-alpha Quantikine ELISA Kit (R&D Systems) according to the manufacturer’s instructions. Anti-ANA and anti-dsDNA ELISAs (Alpha Diagnostic) were performed on plasma according to the manufacturer’s instructions. Absorbance was measured on a Synergy Neo plate reader (BioTek) using Gen5 software.
Interferon neutralization experiments
Cell lines were treated with DMSO or abemaciclib (500nM) for 7 days. For the duration of drug treatment, neutralizing antibodies were applied including: IFN gamma (1 μg/mL, R&D Systems, MAB2851), IFN alpha (2.0–2.5 μg/mL, R&D Systems, 21100-1), IL-28a (0.5 μg/mL, R&D Systems, MAB1587), or IL-29 (1 μg/mL, R&D Systems, MAB15981-100). Successful neutralization was validated using recombinant human IFN gamma (Peprotech, 250pg/mL) and IFN alpha (Life Technologies, 250pg/mL). Recombinant proteins were administered 24 hours prior to protein collection.
Analysis of methylation of the ERV3-1 5′-LTR
Genomic DNA was extracted from cells and subjected to RNAse treatment before standard bisulfite conversion (MethylEdge Bisulfite Kit, Promega). Bisulfite DNA was subjected to PCR, and then a second nested PCR, to amplify the 5′;-LTR of ERV3-1 using the method and primers as previously described30 to amplify a DNA fragment of 644bp. The PCR product was enzymatically digested using the RsaI restriction enzyme (New England Biolabs). Due to a CG site in the native DNA within this amplicon, this digestion will cut methylated DNA amplicons into ~ 317 bp and ~327 bp fragments, leaving the non-methylated DNA uncut.
shRNA experiments
Two shRNA constructs to RB1 (TRC ID# TRCN0000295892 and TRCN0000295842) and shLuciferase control were expressed in tumor cells as previously described6. Suppression efficiency was validated by RT-qPCR.
Doxorubicin-induced senescence
MDA-MB-453 and BT474 cells were treated with doxorubicin (Sigma Aldrich, 200nM) for a period of 24 hrs. The cells were then cultured in fresh media for 72 hours after treatment, and RNA was extracted for qPCR.
In vitro regulatory T cell differentiation
CD4+CD25− T cells were isolated from spleens and lymph nodes of naïve FVB mice using the CD4+CD25+ Regulatory T cell kit (Miltenyl Biotec) with an autoMACs pro separator. Cells were cultured for 72 hours in T cell medium with CD3/CD28 Dynabeads (1:1 ratio of cells:beads, ThermoFisher), 100 U/mL rhIL-2 (Peprotech), +/− 25 ng/mL rhTGF-β (R&D Systems) with DMSO or abemaciclib (125–1000 nM). Differentiation status for each condition was determined by intracellular flow cytometry for FoxP3. Fold change in percent differentiation with the addition of rhTGF-β was calculated for each condition and normalized to the DMSO control.
T cell proliferation in vitro
CD4+CD25− and CD4+CD25+ T cells were isolated from spleens and lymph nodes of naïve FVB mice using the CD4+ CD25+ Regulatory T cell kit (Miltenyl Biotec); CD8+ T cells were isolated as described above. Isolated T cells were labeled with 5 μM CFSE (Biolegend) as described above. 1×10⁵ cells were cultured in T cell medium with CD3/CD28 beads (1:1 ratio of cells to beads), 100 U/mL rhIL-2 and DMSO or abemaciclib (250 or 500 nM) for 72 hours at 37°C. CFSE dilution was analyzed at endpoint by flow cytometry.
Gene expression in isolated T cell populations
CD8+, CD4+CD25−, and CD4+CD25+ T cells were isolated as described above from lymph nodes and spleens of naïve FVB mice treated with vehicle or 90 mg/kg abemaciclib for 12 days. Purity of isolated populations was confirmed by flow cytometry. mRNA was obtained using the NucleoSpin RNA XS kit (Macherey-Nagel) according to the manufacturer’s instructions. RT-qPCR was performed as described above.
Patient data
Gene expression data (GEO GSE93204) were obtained from biopsy samples from the NeoPalAna clinical trial (NCT01723774)9. Expression data was utilized in the log2 normalized form. We used GSEA software (Broad Institute, MA) with the following settings for analysis: Number of permutations: 1000; Collapse dataset of gene symbols: true; Permutation type: gene set; Enrichment statistic: weighted; Metric for ranking genes: Signal2Noise; Gene list sorting mode: real; Gene list ordering mode: descending; Max size/exclude larger sets: 500; Min size/exclude smaller sets: 15. Analysis was performed using the “Hallmarks v6.0” GSEA signatures.
Statistical analyses
Statistical analyses were performed as described in the figure legend for each experiment. All statistical tests were two-sided, and non-parametric tests were used when variance was dissimilar between groups. All data are presented as mean ± SD unless otherwise noted in the legend. Differences were considered statistically significant at a p value ≤ 0.05. All data shown is representative two or more independent experiments, unless indicated otherwise.
Data availability
Transcriptomic data that support the findings of this study have been deposited in the Gene Expression Omnibus with primary accession code GSE99063. Source data for Western blots and tumor measurements are provided in Supplementary Fig. 1 and Supplementary Table 2. All other data is available upon reasonable request.
Extended Data
Extended Data Figure 1. Tumor cell proliferation and expression of cell cycle related genes after CDK4/6 inhibition.
a, Immunohistochemistry for Ki-67 in MMTV-rtTA/tetO-HER2 tumors treated for 12d with abemaciclib or vehicle; representative images (scale bar=100 μm) and quantification (n=7 tumors/group). b, Expression of E2F transcription factors, S phase genes, and G2/M genes in MMTV-rtTA/tetO-HER2 tumors treated with abemaciclib for 12d compared to vehicle (vehicle, n=11; abemaciclib, n=12 tumors). c–d, Gene ontology terms with p<0.05 (c) or GSEA terms significantly downregulated (d) by abemaciclib compared to vehicle in MMTV-rtTA/tetO-HER2 tumors (vehicle, n=11; abemaciclib, n=12 tumors). Unpaired two-tailed t-tests (a–b). Error bars, SD. *p<0.05, **p<0.01.
Extended Data Figure 2. CDK4/6 inhibition enhances antigen presentation.
a, Antigen processing and presentation gene expression in MDA-MB-361 cells treated with 500 nM abemaciclib or DMSO (7d, n=3). b, Gene expression in cell lines treated with DMSO or palbociclib (7d, n=3). c, β2M/MHC-I flow cytometry in cell lines; grey, FMO control. (For MDA-MB-453, vehicle and abemaciclib, n=2; palbociclib, n=3. For MDA-MB-361, n=3) d, Gene expression in TCGA samples (CCND1 shallow deletion, n=101; CCND1 diploid, n=503; CCND1 gain, n=203; CCND1 amplified, n=153). e, H-2Kb SIINFEKL flow cytometry after 7d abemaciclib or DMSO (B16-OVA, n=9; _MMTV-PyMT_-S2WTP3-OVA, n=3). f, CD8+ T cell proliferation in response to abemaciclib-pretreated tumor cells (n=3). g, IFNγ and TNFα production in tumor cell/OT-I assay by ELISA (n=3). One-way ANOVA adjusted for multiple comparisons (c–d,f), unpaired two-tailed t-tests (a–b,e,g). Error bars, SD. *p<0.05, **p<0.01, ***p<0.001, ****p<0.0001.
Extended Data Figure 3. Effects of CDK4/6 inhibition on breast cancer cell proliferation and apoptosis in vitro.
a, Relative numbers of breast cancer cells cultured in 250 nM (MDA-MB-453) or 500 nM (MDA-MB-361, BT474) abemaciclib or DMSO for 11d, followed by drug withdrawal (arrow). b, Representative SA-β-galactosidase staining of MDA-MB-453 cells (left) and BT474 cells (right) treated with DMSO or abemaciclib (MDA-MB-453, 250 nM; BT474, 500 nM) for 0, 4, and 7 days. c, Western blot of SKBR3, BT474, MDA-MB-453, and MDA-MB-361 cells treated with DMSO, lapatinib, or abemaciclib for 48h. d, Western blot of MDA-MB-453 cells pretreated with DMSO or abemaciclib (500 nM) for 0, 1, or 7 days prior to exposure to staurosporine (500 nM) for 4h. For western blot source images, see Supplementary Figure 1.
Extended Data Figure 4. CDK4/6 inhibition increases interferon signaling.
a–b, Top ranked GO terms (a) and expression of interferon-responsive transcription factors (b) in MDA-MB-361 cells treated with 500 nM abemaciclib or DMSO (7d, n=3). c, Expression of interferon sensitive genes (ISGs) in _MMTV-PyMT_-S2WTP3 cells treated with DMSO or abemaciclib (500 nM, 7d) (n=3). d, Expression of ISGs in MDA-MB-361 and MCF7 cells treated with abemaciclib (100 nM), fulvestrant (100 nM), or the combination for 7d (n=3). e, Expression of ISGs in MDA-MB-453, MCF7, and MDA-MB-231 cells treated with abemaciclib or DMSO (7d, n=3). f, Expression of ISGs in PDX 14-07 tumors treated with abemaciclib or vehicle (21–28d, vehicle, n=4; abemaciclib, n=2 tumors/group). g, phospho- and total STAT1 in cells treated with 500 nM abemaciclib as indicated. h, Confirmation of p16-FLAG overexpression in MDA-MB-453 and BT474 cells (left) and gene expression in these cell lines by qPCR (right) (n=6). i–j, Gene expression changes in MMTV-rtTA/tetO-HER2 tumors from mice treated with vehicle or abemaciclib for 12d (vehicle, n=11; abemaciclib, n=12 tumors/group). Relative expression of interferon-responsive T cell chemoattractants (i); relative expression of ISGs (j). k, Correlation of expression of Stat1 and Nlrc5 with genes involved in antigen processing and presentation in MMTV-rtTA/tetO-HER2 tumors. Blue dots, vehicle-treated tumors; red dots, abemaciclib-treated tumors. (r is Pearson product-moment correlation coefficient). Unpaired two-tailed t-tests (b,d–f,h–j) adjusted for multiple comparisons (c). Error bars, SD. *p<0.05, **p<0.01, ***p<0.001, ****p<0.0001. For western blot source images, see Supplementary Figure 1.
Extended Data Figure 5. CDK4/6 inhibitors enhance expression of immune-related signatures in breast cancer patients.
a–c, NeoPalAna schema (a) Endo. Rx denotes endocrine therapy for breast cancer. Down-regulated GSEA signatures after 2 wks palbociclib treatment (b); Nom p<0.001, FDR q<0.001. Up-regulated GSEA signatures after 2 wks palbociclib treatment (c); Nom p<0.001, FDR q<0.001 (C1D1, n=34; C1D15, n=29; Surgery, n=23).
Extended Data Figure 6. CDK4/6 inhibition mediates Type III interferon production.
a, Phospho- and total STAT1 in MDA-MB-453 cells treated with abemaciclib +/− ruxolitinib for 7d. b, Effect of neutralization of IFN-α or IFN-γ on STAT1 mRNA expression (n=2–4). c–d, Impact of neutralization of IFN-α (c) and IFN-γ (d) on phospho-STAT1 and total STAT1 protein in indicated cell lines. e, Expression of type III interferon genes in indicated cell lines treated with abemaciclib for 7d compared to DMSO (n=3). f, Type III interferon production measured by ELISA (7d, n=2). Unpaired two-tailed t-tests (e–f) adjusted for multiple comparisons (b). Error bars, SD. *p<0.05, **p<0.01, ***p<0.001, ****p<0.0001. For western blot source images, see Supplementary Figure 1.
Extended Data Figure 7. DNMT1 suppression mediates dsRNA response.
a, DNMT1 expression after treatment with abemaciclib (n=3). b, DNMT1 protein expression after treatment with abemaciclib. c, DNMT3A expression after treatment with abemaciclib (500 nM) for 7d (n=3, except abemaciclib 24 hrs, n=2). d, DNMT1 expression after abemaciclib or control in MMTV-rtTA/tetO-HER2 tumors, p=0.05, (12d, vehicle, n=11; abemaciclib, n=12 tumors/group). e, RB1 knockdown in MDA-MB-453 cells and its effect on indicated gene expression after 7d abemaciclib (500 nM) (two biological replicates each associated with three technical replicates). f, ERV3-1 methylation. g, ERV expression after abemaciclib or DMSO (7d, n=3). h, Relative dsRNA expression after 7d of abemaciclib compared to DMSO (n=3). i–j, Cytosolic pattern recognition receptors in cells (i) (7d, n=3) or PDX tumors (j) (21–28d, vehicle, n=4; abemaciclib, n=2 tumors/group). k, Western blot of overexpression of DNMT1 in MDA-MB-453 cells and quantification of mRNA expression (n=3). Unpaired two-tailed t-tests (d–e,g–k) adjusted for multiple comparisons (a). Error bars, SD. *p≤0.05, **p<0.01, ***p<0.001, ****p<0.0001. For western blot source images, see Supplementary Figure 1.
Extended Data Figure 8. Abemaciclib induces a ‘senescence-like’ phenotype without evidence of SASP.
a, Representative SA-β-galactosidase staining (left) of MMTV-rtTA/tetO-HER2 tumors treated with vehicle or abemaciclib for 12d (scale bar=500 _μ_m). Quantification of relative SA-β-galactosidase positive area (right, n=6 tumors/group). b, mRNA expression of SASP factors in MMTV-rtTA/tetO-HER2 tumors treated as in Fig. 1a. Il6 expression determined by qPCR (n=10 tumors/group); Il1a and Il1b by transcriptome analysis (vehicle, n=11; abemaciclib, n=12 tumors/group). c, MDA-MB-453 and BT474 cells treated with DMSO or abemaciclib (500 nM) for 7d, and expression determined by qPCR. d, mRNA expression of IL6 upon doxorubicin-induced senescence (n=3). MDA-MB-453 and BT474 cells were treated with doxorubicin (200 nM) for 24h, and mRNA extracted 3d later for qPCR. Unpaired two-tailed t tests (a,d). Error bars, SD. **p<0.01.
Extended Data Figure 9. Impact of CDK4/6 inhibition on immune cell populations and Treg biology.
a, Flow cytometric analysis of immune cell populations in MMTV-rtTA/tetO-HER2 tumors treated with vehicle or abemaciclib for 12d (vehicle, n=15; abemaciclib, n=17 tumors/group). b, Peripheral blood Tregs in MMTV-rtTA/tetO-HER2 mice (12d, n=4 mice/group). c–d, Tregs (CD4+ FoxP3+) quantified by flow cytometry of MMTV-PyMT tumors (c, vehicle, n=18; abemaciclib, n=16 tumors/group) and CT-26 tumors (d, n=12 tumors/group) treated as indicated for 12d. e, Tregs in lymph nodes of tumor-free mice (12d, one-way ANOVA corrected for multiple comparisons, vehicles and palbociclib, n=8; abemaciclib, n=7 mice/group). f, Treg:CD8 ratio in the spleens and lymph nodes (LN) of tumor-free FVB mice (12d, vehicles and palbociclib, n=8; abemaciclib, n=7 mice/group). g, Plasma autoantibodies in tumor-free and tumor-bearing mice treated with vehicle or abemaciclib for 12d (tumor-free vehicle, n=8; tumor-free abemaciclib, n=7; tumor-bearing vehicle, n=7; tumor-bearing abemaciclib, n=6 mice/group). h–l, Tumor-free FVB mice treated with abemaciclib or vehicle for 12d. Thymic mass (h). Thymic cell populations were quantified by flow cytometry. CD4+CD8+ double positive (DP) thymocytes (i); CD4+ single positive (SP) thymocytes (j); CD8+ SP thymocytes (k); CD4+FoxP3+ regulatory T cells (l). (vehicles and palbociclib, n=5; abemaciclib, n=4 mice/group). m, Effect of abemaciclib or DMSO on ex vivo differentiation of CD4+CD25− T cells into Tregs in the presence of TGF-β for 72hr (n=4). n, Effect of DMSO or abemaciclib treatment for 72hr on Treg apoptosis measured by Annexin V staining (n=2). o, Quantification of immunofluorescent staining of MMTV-rtTA/tetO-HER2 tumors (n=7 tumors/group). p–q, Dnmt1 (p) and Cdkn1a (q) in T cells from tumor-free mice (12d, two-way ANOVA corrected for multiple comparisons, n=7 mice/group [pooled]). Unpaired two-tailed t-tests (b–d), one-way ANOVA corrected for multiple comparisons (e–f,h–l). Error bars, SD. *p<0.05, **p<0.01, ***p<0.001, ****p<0.0001
Extended Data Figure 10. Role of adaptive immunity in response to abemaciclib and combination with immunotherapy.
a, Relative change in volume of MMTV-rtTA/tetO-HER2 tumors implanted into Foxn1nu mice and then treated with vehicle (n=11 tumors) or abemaciclib (n=9 tumors) (one way ANOVA). b, Immunohistochemistry of tumors in (a) for Ki-67. Representative images (left), and quantification of percent of Ki-67+ cells (right) (vehicle, n=7; abemaciclib, n=10/group, scale bar=100 _μ_m). c, Flow cytometric analysis of absolute number (left) and percentage (right) of CD8+ T cells in peripheral blood after administration of anti-CD8 or isotype control antibodies (isotype, n=6; anti-CD8, n=4 mice/group). d–g, Expression of inhibitory co-receptors on intratumoral CD8+ T cells in MMTV-rtTA/tetO-HER2 tumors after 6d of treatment with abemaciclib (n=6 tumors) or vehicle (n=5 tumors). PD-1 cell-surface expression (d); representative flow cytometry plots (left), quantification (right). Representative flow cytometry plots for CTLA-4 (e) and LAG3 (f). g, Quantification of (e) and (f). h, Quantification of number of inhibitory receptors per cell on intratumoral CD8+ T cells in MMTV-PyMT tumors after treating mice with abemaciclib or vehicle (12d, n=18 tumors/group). i, Ifng in MMTV-rtTA/tetO-HER2 tumors (12d, Mann-Whitney test, n=10 tumors/group). j, Experimental schema for Fig. 4j. k, Quantification of mean change in tumor volume at d19 (top) and maximal reduction in tumor volume (bottom) of curves in Fig. 4j. l, Spider plots of CT-26 tumor growth with indicated treatments (n=4/group, one experiment). m, Kaplan-Meier curves of incidence of CT-26 tumor formation after rechallenge. n, Schematic. Unpaired two-tailed t-tests (b–c), two-way ANOVA corrected for multiple comparisons (d,g). Error bars, SD; except (a), SEM. *p<0.05, ***p<0.001, ****p<0.0001. For source data, see Supplementary Table 2.
Supplementary Material
reporting summary
supp_guide
supp_info
supp_table1
supp_table2
Acknowledgments
This work was supported by a Career Development Award from the DF/HCC SPORE in Breast Cancer (NIH 2015 P50 CA, to S.G.), Landry Cancer Biology Research Fellowship (to M.J.D.), DOD Era of Hope award (W81XWH-14-1-0191 to S.S.M), NIH (NCI) RO1 CA166284 (to S.S.M), a Presidential Early Career Award for Scientists and Engineers (to S.S.M), the Breast Cancer Research Foundation (to J.J.Z), the DF/HCC SPORE in Breast Cancer (P50 CA168504, to I.E.K., E.P.W., T.M.R. and J.J.Z), and NIH awards CA187918-02 (to T.M.R. and J.J.Z), CA210057-01 (to J.J.Z), and CA172461-04 (to J.J.Z). We thank Tyler Laszewski, Anna Molineaux, Jamie Almeida, the Nikon Imaging Center at Harvard Medical School, and Boston Children’s Hospital Heme/Onc-HSCI Flow Cytometry facility for experimental assistance. We thank providers of reagents: pHAGE-deltaOVA-zsGreen plasmid (Rong En Tay, Kai Wucherpfennig), LCMV-P14 transgenic mice (Adam Cartwright, Kai Wucherpfennig), CT-26 cell line (Stephen Elledge), _MMTV-PyMT-_S2WTP3 cell line (Andreas Moller). We thank Sheila Stewart for advice.
Footnotes
Author Contributions
S.G., M.J.D., H-J. K., S.S.M., and J.J.Z. designed the study. S.G. and M.J.D. performed all experiments with help as follows: A.C.W. and H.B. helped with in vitro tumor cell experiments, qPCR, in vivo treatments, and tumor tissue collection. H-J. K. helped with Treg isolation from mice. J.S. and J.M.U. helped with processing mouse tissues for flow cytometry. N.K. helped with qPCR and COBRA. B.B.L. analyzed mouse transcriptomic data. S.R. conducted digital image analysis. S.X. conducted transcriptomic assays. I.E.K., E.P.W, O.M-F. and T.M.R contributed to scientific discussion that guided the project’s direction. M.E., C.M, and J.H. conducted the NeoPalAna trial and provided gene expression data for analysis. S.G. and M.J.D. wrote the paper.
Competing Financial Interests
Shom Goel has served as a paid scientific advisor to Eli Lilly, and conducts laboratory research funded by Eli Lilly. Eli Lilly did not fund the present study. Matthew Ellis has performed ad hoc consulting for Novartis, Pfizer, and AstraZeneca, receives royalties for PAM50-based diagnostics including Prosigna, and holds stock in Bioclassifier LLC for PAM50-based diagnostics.
References
- 1.Yu Q, et al. Requirement for CDK4 kinase function in breast cancer. Cancer Cell. 2006;9:23–32. doi: 10.1016/j.ccr.2005.12.012. [DOI] [PubMed] [Google Scholar]
- 2.Choi YJ, et al. The requirement for cyclin D function in tumor maintenance. Cancer Cell. 2012;22:438–451. doi: 10.1016/j.ccr.2012.09.015. [DOI] [PMC free article] [PubMed] [Google Scholar]
- 3.Patnaik A, et al. Efficacy and Safety of Abemaciclib, an Inhibitor of CDK4 and CDK6, for Patients with Breast Cancer, Non-Small Cell Lung Cancer, and Other Solid Tumors. Cancer Discov. 2016;6:740–753. doi: 10.1158/2159-8290.CD-16-0095. [DOI] [PubMed] [Google Scholar]
- 4.Finn RS, et al. Palbociclib and Letrozole in Advanced Breast Cancer. N Engl J Med. 2016;375:1925–1936. doi: 10.1056/NEJMoa1607303. [DOI] [PubMed] [Google Scholar]
- 5.Sherr CJ, Roberts JM. CDK inhibitors: positive and negative regulators of G1-phase progression. Genes Dev. 1999;13:1501–1512. doi: 10.1101/gad.13.12.1501. [DOI] [PubMed] [Google Scholar]
- 6.Goel S, et al. Overcoming Therapeutic Resistance in HER2-Positive Breast Cancers with CDK4/6 Inhibitors. Cancer Cell. 2016;29:255–269. doi: 10.1016/j.ccell.2016.02.006. [DOI] [PMC free article] [PubMed] [Google Scholar]
- 7.Cerami E, et al. The cBio cancer genomics portal: an open platform for exploring multidimensional cancer genomics data. Cancer Discov. 2012;2:401–404. doi: 10.1158/2159-8290.CD-12-0095. [DOI] [PMC free article] [PubMed] [Google Scholar]
- 8.Campisi J, di Fagagna FA. Cellular senescence: when bad things happen to good cells. Nature Reviews Molecular Cell Biology. 2007;8:729–740. doi: 10.1038/nrm2233. [DOI] [PubMed] [Google Scholar]
- 9.Ma CX, et al. NeoPalAna: Neoadjuvant palbociclib, a cyclin-dependent kinase 4/6 inhibitor, and anastrozole for clinical stage 2 or 3 estrogen receptor positive breast cancer. Clin Cancer Res. 2017 doi: 10.1158/1078-0432.CCR-16-3206. [DOI] [PMC free article] [PubMed] [Google Scholar]
- 10.Roulois D, et al. DNA-Demethylating Agents Target Colorectal Cancer Cells by Inducing Viral Mimicry by Endogenous Transcripts. Cell. 2015;162:961–973. doi: 10.1016/j.cell.2015.07.056. [DOI] [PMC free article] [PubMed] [Google Scholar]
- 11.Kimura H, Nakamura T, Ogawa T, Tanaka S, Shiota K. Transcription of mouse DNA methyltransferase 1 (Dnmt1) is regulated by both E2F-Rb-HDAC-dependent and -independent pathways. Nucleic Acids Res. 2003;31:3101–3113. doi: 10.1093/nar/gkg406. [DOI] [PMC free article] [PubMed] [Google Scholar]
- 12.Chiappinelli KB, et al. Inhibiting DNA Methylation Causes an Interferon Response in Cancer via dsRNA Including Endogenous Retroviruses. Cell. 2015;162:974–986. doi: 10.1016/j.cell.2015.07.011. [DOI] [PMC free article] [PubMed] [Google Scholar]
- 13.Coppe JP, Desprez PV, Krtolica A, Campisi J. The Senescence-Associated Secretory Phenotype: The Dark Side of Tumor Suppression. Annu Rev Pathol. 2010;5:99–118. doi: 10.1146/annurev-pathol-121808-102144. [DOI] [PMC free article] [PubMed] [Google Scholar]
- 14.Malumbres M, et al. Mammalian Cells Cycle without the D-Type Cyclin-Dependent Kinases Cdk4 and Cdk6. Cell. 2004;118:493–504. doi: 10.1016/j.cell.2004.08.002. [DOI] [PubMed] [Google Scholar]
- 15.Obata Y, et al. The epigenetic regulator Uhrf1 facilitates the proliferation and maturation of colonic regulatory T cells. Nat Immunol. 2014;15:571–579. doi: 10.1038/ni.2886. [DOI] [PubMed] [Google Scholar]
- 16.Bauer CA, et al. Dynamic Treg interactions with intratumoral APCs promote local CTL dysfunction. J Clin Invest. 2014;124:2425–2440. doi: 10.1172/JCI66375. [DOI] [PMC free article] [PubMed] [Google Scholar]
- 17.Sakuishi K, et al. Targeting Tim-3 and PD-1 pathways to reverse T cell exhaustion and restore anti-tumor immunity. J Exp Med. 2010;207:2187–2194. doi: 10.1084/jem.20100643. [DOI] [PMC free article] [PubMed] [Google Scholar]
- 18.Finn RS, et al. PD 0332991, a selective cyclin D kinase 4/6 inhibitor, preferentially inhibits proliferation of luminal estrogen receptor-positive human breast cancer cell lines in vitro. Breast Cancer Res. 2009;11:R77. doi: 10.1186/bcr2419. [DOI] [PMC free article] [PubMed] [Google Scholar]
- 19.Heng TS, Painter MW. Immunological Genome Project, C. The Immunological Genome Project: networks of gene expression in immune cells. Nat Immunol. 2008;9:1091–1094. doi: 10.1038/ni1008-1091. [DOI] [PubMed] [Google Scholar]
- 20.Bates GJ, et al. Quantification of regulatory T cells enables the identification of high-risk breast cancer patients and those at risk of late relapse. J Clin Oncol. 2006;24:5373–5380. doi: 10.1200/JCO.2006.05.9584. [DOI] [PubMed] [Google Scholar]
- 21.McAllister SS, et al. Systemic endocrine instigation of indolent tumor growth requires osteopontin. Cell. 2008;133:994–1005. doi: 10.1016/j.cell.2008.04.045. [DOI] [PMC free article] [PubMed] [Google Scholar]
- 22.Wong CS, et al. Vascular normalization by loss of Siah2 results in increased chemotherapeutic efficacy. Cancer Res. 2012;72:1694–1704. doi: 10.1158/0008-5472.CAN-11-3310. [DOI] [PubMed] [Google Scholar]
- 23.Bellone M, et al. Relevance of the tumor antigen in the validation of three vaccination strategies for melanoma. J Immunol. 2000;165:2651–2656. doi: 10.4049/jimmunol.165.5.2651. [DOI] [PubMed] [Google Scholar]
- 24.Ni J, et al. Combination inhibition of PI3K and mTORC1 yields durable remissions in mice bearing orthotopic patient-derived xenografts of HER2-positive breast cancer brain metastases. Nat Med. 2016;22:723–726. doi: 10.1038/nm.4120. [DOI] [PMC free article] [PubMed] [Google Scholar]
- 25.Wang Y, et al. CDK7-dependent transcriptional addiction in triple-negative breast cancer. Cell. 2015;163:174–186. doi: 10.1016/j.cell.2015.08.063. [DOI] [PMC free article] [PubMed] [Google Scholar]
- 26.Love MI, Huber W, Anders S. Moderated estimation of fold change and dispersion for RNA-seq data with DESeq2. Genome Biol. 2014;15:550. doi: 10.1186/s13059-014-0550-8. [DOI] [PMC free article] [PubMed] [Google Scholar]
- 27.Subramanian A, et al. Gene set enrichment analysis: a knowledge-based approach for interpreting genome-wide expression profiles. Proc Natl Acad Sci U S A. 2005;102:15545–15550. doi: 10.1073/pnas.0506580102. [DOI] [PMC free article] [PubMed] [Google Scholar]
- 28.Mootha VK, et al. PGC-1alpha-responsive genes involved in oxidative phosphorylation are coordinately downregulated in human diabetes. Nat Genet. 2003;34:267–273. doi: 10.1038/ng1180. [DOI] [PubMed] [Google Scholar]
- 29.Gao J, et al. Integrative analysis of complex cancer genomics and clinical profiles using the cBioPortal. Sci Signal. 2013;6:pl1. doi: 10.1126/scisignal.2004088. [DOI] [PMC free article] [PubMed] [Google Scholar]
- 30.Gimenez J, et al. Comparative methylation of ERVWE1/syncytin-1 and other human endogenous retrovirus LTRs in placenta tissues. DNA Res. 2009;16:195–211. doi: 10.1093/dnares/dsp011. [DOI] [PMC free article] [PubMed] [Google Scholar]
Associated Data
This section collects any data citations, data availability statements, or supplementary materials included in this article.
Supplementary Materials
reporting summary
supp_guide
supp_info
supp_table1
supp_table2
Data Availability Statement
Transcriptomic data that support the findings of this study have been deposited in the Gene Expression Omnibus with primary accession code GSE99063. Source data for Western blots and tumor measurements are provided in Supplementary Fig. 1 and Supplementary Table 2. All other data is available upon reasonable request.
