Prediction of rho-independent transcriptional terminators in Escherichia coli (original) (raw)
Abstract
A new algorithm called RNAMotif containing RNA structure and sequence constraints and a thermodynamic scoring system was used to search for intrinsic rho-independent terminators in the Escherichia coli K-12 genome. We identified all 135 reported terminators and 940 putative terminator sequences beginning no more than 60 nt away from the 3′-end of the annotated transcription units (TU). Putative and reported terminators with the scores above our chosen threshold were found for 37 of the 53 non-coding RNA TU and for almost 50% of the 2592 annotated protein-encoding TU, which correlates well with the number of TU expected to contain rho-independent terminators. We also identified 439 terminators that could function in a bi-directional fashion, servicing one gene on the positive strand and a different gene on the negative strand. Approximately 700 additional termination signals in non-coding regions (NCR) far away from the nearest annotated gene were predicted. This number correlates well with the excess number of predicted ‘orphan’ promoters in the NCR, and these promoters and terminators may be associated with as yet unidentified TU. The significant number of high scoring hits that occurred within the reading frame of annotated genes suggests that either an additional component of rho-independent terminators exists or that a suppressive mechanism to prevent unwanted termination remains to be discovered.
INTRODUCTION
Two mechanisms of transcription termination and two classes of termination signals have been described in bacteria: rho-dependent and rho-independent (1). The rho-independent termination signals consist of stable hairpins followed by U-rich regions. The mechanism of intrinsic termination includes pausing of the transcription elongation complex (TEC) at the termination point and formation of the RNA terminator hairpin inside RNA polymerase (RNAP) (1–8). Three nucleic acid binding sites have been characterized in the TEC: a double-stranded DNA binding site (DBS), an RNA:DNA hybrid binding site (HBS), and a single-stranded RNA binding site (RBS) (9,10). Formation of a stable RNA hairpin in combination with dissociation of a weak U-rich RNA:DNA hybrid duplex (11) results in disruption of the protein–nucleic acid interaction in the HBS and RBS of RNAP, destabilization and dissociation of TEC, and release of nascent mRNA (reviewed in 1,12,13).
A few attempts have been made to search for intrinsic rho-independent terminators (14,15). From statistical analysis of identified and predicted intrinsic terminators, d’Aubenton Carafa et al. (16) created a model of a typical intrinsic terminator that consisted of an RNA hairpin followed by a 15 nt ‘T-region’. The hairpin and thymidine-rich region could be separated by a ‘spacer’ no longer than 2 nt. An adenosine-rich region was also identified upstream of the hairpin but not included in this terminator model. The scoring system developed included free energy of RNA hairpin formation and an empirical equation considering the number and position of thymidine residues in the T-region. Due to the lack of full genome sequences, annotated coding regions, and clear understanding of the molecular mechanism of intrinsic transcription termination at that time, these searches had limited success. Two recent searches for intrinsic terminators (17,18) used the same terminator model and scoring system (16). No information about hit positions, sequences or gene annotations were published.
For this study, a new algorithm called RNAMotif, which searches nucleic acid databases for RNA structure motifs (19), was used. The motif is defined by a ‘descriptor’ that contains user-defined constraints on the RNA sequence and structure. Our model of the intrinsic terminator was based on that of d’Aubenton Carafa et al. (16), but also included an 11 nt region upstream of the hairpin enriched in adenosine, called the ‘A-region’. Our scoring system was based on the assumption that the efficiency of transcription termination depends on both the difference between the stability of the RNA hairpin and the RNA:DNA hybrid duplex within TEC and pausing of TEC at the termination point (7,8,12,20). Thermodynamic parameters for nucleic acid structure formation were used in our scoring system.
The annotated Escherichia coli K-12 genome containing 4 639 221 bp (21) was used for testing our novel RNAMotif algorithm and ‘thermodynamic’ scoring system. There were 1075 hits with scores better than the threshold found near the 3′-end of almost half of the 2592 known and predicted transcription units (TU) including 37 of the 53 TU of non-coding RNAs. We also predicted the existence of approximately 700 additional termination signals in non-coding regions (NCR) more than 60 nt away from the 3′-end of annotated genes and TU.
MATERIALS AND METHODS
Descriptors of intrinsic terminators
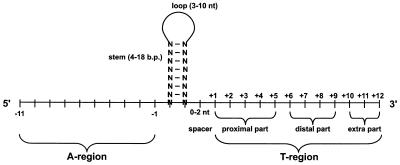
The RNAMotif algorithm (19) searches nucleic acid sequence databases for RNA structure motifs. The motif of interest must be defined by a ‘descriptor’ that contains the desired constraints on the RNA structure and sequence. To create our constraints we analyzed a published list of 147 experimentally identified and proposed terminator sequences (16). The BLAST program (22) identified 135 of these terminator sequences on the E.coli K-12 genome (21). Strings of thymidine residues that are a critical part of rho-independent terminators were not present in the remaining 12 sequences. Based on analysis of the 135 terminators, a model of an intrinsic terminator was defined that included the following regions from 5′ to 3′: an 11 nt adenosine-rich region (A-region), a variable-length hairpin, a variable-length spacer and a 12 nt thymidine-rich region (T-region) (Fig. 1). The A-region was added to the previously described model (16) to aid in identification of bi-directional terminators. Due to symmetry, the A-region on one strand becomes the T-region of the terminator on the opposite strand. The T-region was divided into three parts from 5′ to 3′ according to their specific functions in the intrinsic termination process (7): the 5 nt region nearest to the hairpin (proximal-T), the next 4 nt (distal-T), and the final 3 nt (extra-T) (Fig. 1). Structural constraints applied to the terminator hairpin are presented in the legend to Figure 1. Additional sequence constraints on the hairpin and the T-regions included the following: (i) the first base in the hairpin stem cannot be an A; (ii) there can be no less than four GC/CG or GT/TG base pairs in the hairpin stem; (iii) the proximal T-region must contain at least three T residues, no more than one G, and no 5′-TVVTT stretches (V is A, C or G); (iv) the distal T-region cannot have four purines or four cytosines; (v) there must be at least four T residues in the proximal and distal T-region. No special sequence constraints were applied to the A-region, spacer or the extra T-region.
Figure 1.
Rho-independent intrinsic terminator construct. Regions include from 5′ to 3′: (i) A-region of 11 nt; (ii) a hairpin with a loop of 3–10 residues and with one of three types of stems: perfect stems of 4–18 base pairs, stems of 9–18 base pairs with internal loop no longer than 20% stem length, or stems of 7–18 base pairs with 1–5 nt bulges in either 5′ or 3′-side of stems; (iii) a spacer of 0–2 nt (any bases except T); (iv) T-region divided into three parts: proximal part of 5 nt, distal part of 4 nt, and extra part of 3 nt. (We did not number spacer nucleotides since no more than 5% putative terminators contained 2 nt spacers and no more than 15% putative terminators contained 1 nt spacers.)
Scoring system
The RNAMotif program calculates a score for each sequence match based upon a user-defined schema. Components of the motif can be independently scored, weighted and combined to create an overall score. We created a scoring system based on the proposed mechanism of intrinsic transcription termination (7). According to this mechanism, RNA hairpin formation inside the TEC is crucial for destabilization and dissociation of TEC. The ability of a hairpin stem to fold ‘inside’ the TEC strictly depends on disruption of the RNA:DNA hybrid duplex including the spacer (if it exists) and the proximal T-region (Fig. 1). The distal part of T-region plays a role in the slowing and pausing of TEC at the termination point, thus giving the hairpin time to form. The 3′-most part of T-region may enhance the pausing effect and may be important if the distal T-region is too weak to allow effective pausing of RNAP. The competition between stability of two adjacent helices, the RNA hairpin and the RNA:DNA hybrid, results in transcription termination if ΔG037 of hairpin formation [ΔG037 (hairpin)] exceeds ΔG037 of hybrid formation [ΔG037 (spacer) + ΔG037 (proximal-T)] and RNAP pauses at termination point. We created a thermodynamic equation to allow quantitation of these effects on termination:
Score = ΔG037 (hairpin) – [ΔG037 (spacer) + ΔG037 (proximal-T)] – 0.5 × ΔG037 (distal-T) – 0.01 × ΔG037 (extra-T) (1)
The free energy of the RNA hairpin formation [ΔG037 (hairpin)] was calculated using the most recent thermodynamic parameters available (23). The free energy for the formation of the RNA:DNA hybrid duplex formed between the coding DNA and the nascent RNA (terms 2–5 in equation 1) was calculated using nearest-neighbor thermodynamic parameters for RNA:DNA duplex formation (24).
The distal T-region is involved in kinetic process of slowing and pausing of TEC. Substitution of rU in position +8 (Fig. 1) by rC, rG and rA resulted in 90, 80 and 30% inhibition of termination, respectively, compared to rU in that position (7). The free energy of hybrid duplex formation mirrors this observed inhibition, with stability as follows: rGG:dCC > rCC:dGG >> rAA:dTT >> rUU:dAA (24). We used ΔG037 (distal-T) and ΔG037 (extra-T) as a penalty for inhibition of TEC pausing by subtracting them from ΔG037 (hairpin). The base composition effect of the distal T-region on intrinsic termination in vivo is weaker than that observed in vitro experiments. We found that 21% of the terminators reported had rC or rG at position +8 and 7% had rC and rG in both positions +7 and +8 of the T-region (16). To reflect the reduced effect of the distal and extra parts of the T-region, the ΔG037 for these regions in equation 1 were multiplied by coefficients of 0.5 and 0.01, respectively. While many terminators have thymidine residues in positions +10 to +12 of the T-region, there are no clear experimental data on the effect of this part of the sequence on termination, therefore we entered a low coefficient in equation 1 for the extra T-region. If experimental data warrants, it would be easy to increase the weight of this term.
Analysis of identified intrinsic terminators
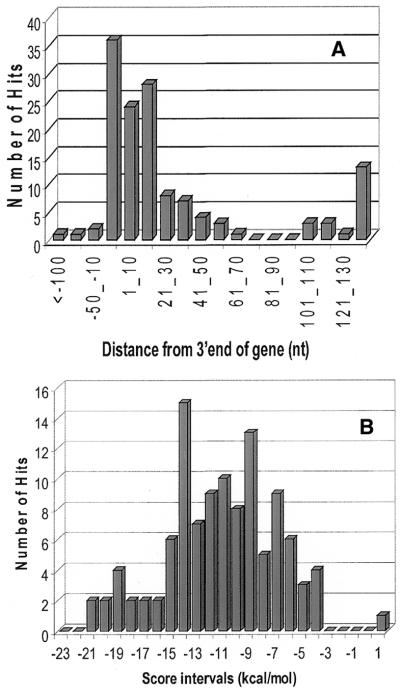
The set of 135 terminators was used to determine sensitivity of the RNAMotif algorithm, descriptors and thermodynamic scoring system. We identified all 135 reported terminators and analyzed them for their positions relative to annotated genes and score values. The E.coli K-12 genome annotation (3) was used to calculate distances between the start of identified terminators and the end of nearest upstream genes. Almost 82% of the terminators started in NCR between 10 nt upstream [a terminator may start 10 nt upstream of the 3′-end of the genes because the 11 nt string (A-region) can be a part of the gene] and 60 nt downstream from the 3′-end of genes (either a translation termination codon or nucleotide corresponding to the processed end of a non-coding RNAs). The other 18% started further than 60 nt downstream of the end of nearest gene or in open reading frames (ORFs) (Fig. 2A). NCRs were defined as sequences between consecutive genes in the operons (intercistronic regions), sequences between consecutive operons and sequences on the antisense strand of coding regions. We considered hits in intercistronic regions as candidates for transcription terminators because termination signals starting in these regions serve frequently as attenuators and are often involved in transcriptional regulation (reviewed in 25–27). We also searched sequences on the antisense strand of coding regions for putative terminators of genes on the opposite strand. Score values calculated by the RNAMotif program for the set of 135 terminators varied from –21.73 to –4.61, with a peak number of hits in a score interval ranging from –10.0 to –14.0 (Fig. 2B). Only one terminator had a score >0 (+0.27); this terminator began 2 nt before the end of the uvrD gene (b3813) (21). The 109 identified terminators with scores less than –4.0 within the distance range –10 to +60 nt from the end of genes were used as a training set (Set A). A score of –4.0 was used as a threshold for this study.
Figure 2.
Distance distribution between the start of the hits and the end of nearest annotated genes (A) and score distribution (B) for the RNAMotif hits of Set A containing 135 reported terminators (16). A translation termination codon of an ORF was considered the end of a protein-encoding gene and the processed end was considered the end of a non-coding RNA gene.
Computing pD and pFA for Receiver Operating Characteristics (ROC) curve
An ROC curve is a parametric plot of the probability of detection (pD) versus the probability of false alarm (pFA) for a series of threshold values (scores) created by the detection algorithm. In our case, pD(threshold) was the fraction of all the putative true terminators whose absolute score value was higher than the absolute threshold value. For our purposes, pFA(threshold) represented the fraction of false positive hits (points) that did not represent terminators but had negative scores better (higher in absolute value) than threshold value. To account for the detection performance provided by the RNAMotif algorithm, false positive counts were divided by 8 000 000 to yield the pFA; there are approximately 8 000 000 possible starting points for genes in E.coli. To compute pD, the histogram of putative terminator points versus their score was created. We then integrated the number of points in the histogram for each score bin value, starting from the most negative score. Each score bin contained the number of known positives with scores at that defined score interval (–1 kcal/mol). The probability of detection was that number divided by the total number of putative true terminators. The pD climbs from 0 for the ‘highest’ to 1 for the ‘lowest’ negative threshold. We computed pFA as we did pD, except that it was divided by 8 000 000 and plotted on a logarithmic scale.
RESULTS
Hit distribution between non-coding and intragenic regions of the E.coli genome
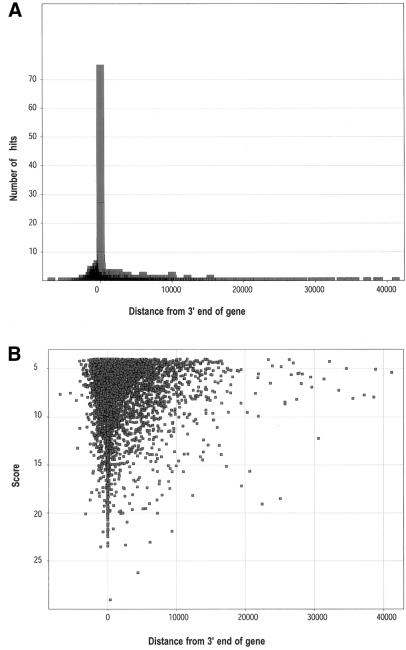
The annotated E.coli K-12 genome containing 4 639 221 bp (21) was used for testing the RNAMotif algorithm and ‘thermodynamic’ scoring system. Analysis of the E.coli K-12 genome using RNAMotif yielded 6635 hits with scores less than –4.0 (as the score is based upon thermodynamic parameters, a more negative score is better). Of these hits, 4049 began in NCRs while 2586 hits started in ORFs (Table 1). A pronounced peak on the hit distance distribution histogram (Fig. 3A) indicated that highest concentration of the hits was near the end of annotated genes. The score distribution histogram showed that most of the hits starting near the end of genes had good scores (Fig. 3B), while a low percentage of the hits found in non-coding and ORF regions had good scores. Score values for an overwhelming majority of the hits did not exceed –12.0.
Table 1. RNAMotif hit distribution (score threshold –4.0 kcal/mol).
| Description | Distance from 3′-end of gene (nt) | Number of hits meeting the criteria |
|---|---|---|
| RNAMotif hits | Total genome | 6635 |
| NCR, Set B (putative terminators for annotated genes) | –10a _ +60 | 1075 |
| NCRs | More than +60 | 2974 |
| Intragenic regions | Less than –10 | 2586 |
Figure 3.
Distance distribution between the start of the hits and the end of nearest annotated genes (A) and score distribution (B) for the population of RNAMotif hits with scores under threshold –4.0 (ends of genes were designated as coordinate 0 on the _x_-axis). The data were fit by Spotfire software.
General properties of putative terminators identified by RNAMotif
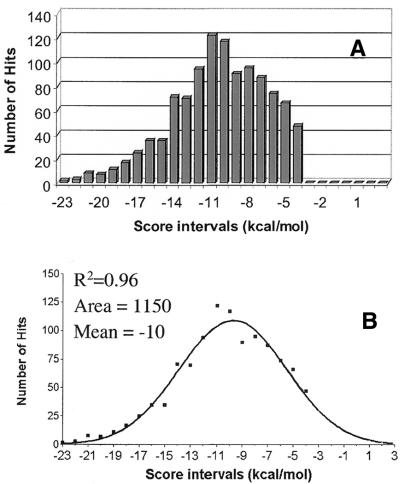
Putative terminators downstream of annotated genes. Based upon the score distribution and the location of the documented terminators of Set A relative to 3′-ends of known genes (Fig. 2), putative terminators should start in the region between 10 nt upstream and 60 nt downstream of the 3′-end of genes and possess scores less than –4.0. Of the 4049 hits in NCR, 1075 hits obey these criteria. These 1075 hits include the terminators in Set A and are called Set B. (The full list of 6635 hits and Set B are available as Supplementary Material. Terminators from Set A are designated as ‘old term’.) The score distribution for the set B (Fig. 4A) fit well to a Gaussian curve (R2 = 0.96) with a maximum in the score interval between –10.0 and –11.0 (Fig. 4B). Most (834 hits) began no further than 20 nt downstream from the gene end.
Figure 4.
The score distribution histogram (A) and the Gaussian curve fitting it (B) for RNAMotif hits starting between –10 and +60 nt from the end of annotated genes (Set B). The lowest value of score bins were plotted on the _x_-axis. Each bin is 1 kcal/mol wide. The data were fit by Graphpad Prizm software.
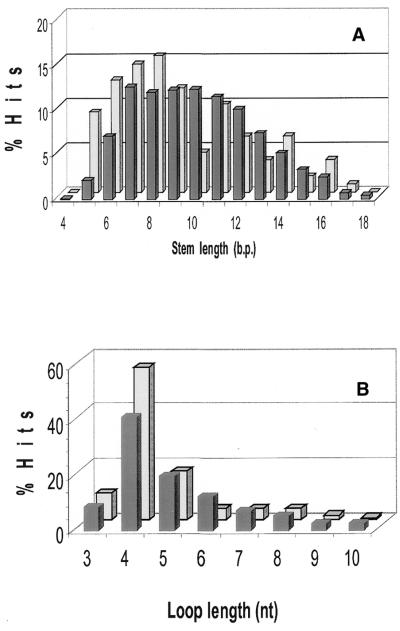
Structural features of putative and identified terminator sets. The comparison of the structural features of hits in Set B with those in Set A revealed general similarity: in both sets, tetraloop hairpins with 6–11 bp stems were predominant. However, there was a broader distribution of structural parameters in Set B than in Set A (Fig. 5). Approximately 60% of the hits in Set B were evenly distributed across stems of 7–11 bp. Only 9% of hairpins in Set B had short stems (4–6 bp), while 22% in Set A did. In Set B, 42% of the hits had long stems (10–13 bp), while only 24% of the hairpins in Set A did (Fig. 5A). Similar trends were observed for loop length distribution (Fig. 5B): a broader profile with a shift to longer loops in Set B compared to Set A. Tetraloops accounted for 56% of the loops in Set A, but only 42% in Set B. In Set B, 30% of the loops contained 6–10 nt, while only 16% of those in Set A did. The two most stable tetraloops, UUCG and GAAA (28), were observed more frequently in Set A than in Set B. While 17% of tetraloops in Set A had UUCG loops, only 7.6% of those in Set B did. The GAAA tetraloop accounted for 5.4% of tetraloops in Set B versus 9.6 % in Set A. However, the thermodynamic stability of the hairpins in Set B was comparable to the stability of those in Set A.
Figure 5.
Comparison of hairpin structure parameters for hits in Set A (light bars) and Set B (dark bars): (A) stem length distribution; (B) loop length distribution.
Specific termination signals identified by RNAMotif algorithm
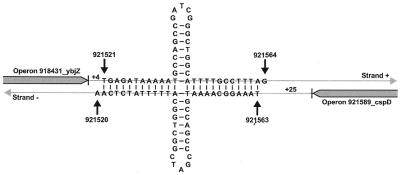
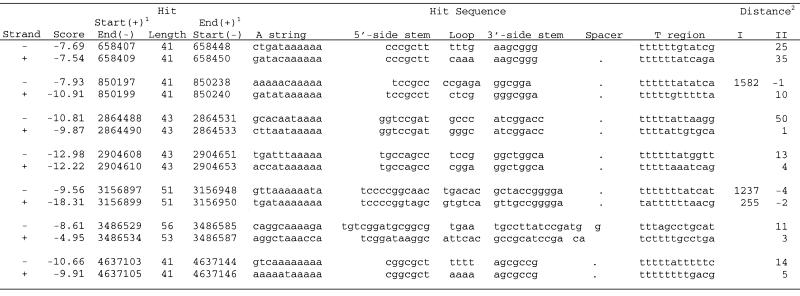
Bi-directional hits. A few intrinsic terminators in E.coli that function bi-directionally have been reported (29). Analysis showed that 878 of the hits (439 pairs) could serve as bi-directional terminators. These hits resided on opposite strands and were shifted by no more than 10 nt relative to each other and both had scores better than –4.0 (Fig. 6). Generally, hits in a pair had similar structure and close scores: 105 pairs (24% of the total) had <10% difference in score values. However, due to the difference in base pairing between T and G in one strand and between A and C in the opposite strand, significant differences in hairpin structure and score values were also observed (Table 2). Most of the bi-directional hits (94%) resided in NCR. Of these, 92 pairs are included in Set B, i.e. both hits in a pair start near the 3′-end of divergent genes and are putative terminators. In 288 pairs, only one hit was close to the end of an annotated gene, while the other resided in an NCR far from annotated genes. In the remaining pairs, both bi-directional hits resided in NCR far from the annotated genes or in ORF regions. Approximately 60% of the bi-directional hits had 6–10 adenosine residues and an additional 30% had 4–5 adenosines in an 11 nt A-region. (The full list of bi-directional hits is available as Supplementary Material.)
Figure 6.
An example of bi-directional putative terminators starting 4 nt (score –11.28) and 25 nt (score –11.95) downstream of annotated genes in (+) and (–) strand, respectively.
Table 2. Bi-directional putative terminators from Set B.
 |
|---|
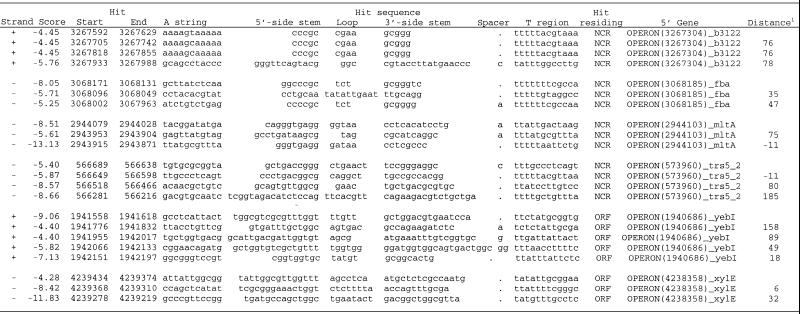
Consecutive hits. Almost one in 10 hits in NCR and one in eight hits in ORFs were followed by one or more additional hits with scores less than –4.0. We found 410 hits in NCR (of these, 134 met the criteria for inclusion in Set B) and 330 hits in ORFs that were followed by one or more additional hits no further than 200 nt from the end of an upstream hit (Table 3). (A full list of clusters of consecutive hits is presented as Supplementary Material.)
Table 3. Clusters of consecutive RNAMotif hits.
 |
|---|
Putative terminators for the RNA genes
Putative terminators for rRNA operons. Seven rRNA operons are annotated in the E.coli K-12 genome (21). Each operon has two clusters of genes: a cluster of 16S rRNA with one or two tRNA genes followed by a downstream cluster of 23S and 5S rRNAs that may or may not include tRNA genes (30–33). Putative terminators were identified downstream of each of the seven operons following the final gene in the 23S rRNA cluster (either a 5S rRNA or a tRNA) (Table 4). Strong terminators with scores of less than –19.0 and almost identical sequence were found at the end of rrnA, rrnB and rrnD operons. Sequence differences were observed in the loop (a GAAA in the rrnB tetraloop instead of GGAA found in the rrnA and rrnD terminators) and in the second base pair of the hairpin stem (A:T in rrnD terminator instead of G:C in the two others) (Table 4). The putative terminators downstream of tRNA genes in operons rrnH, rrnE and rrnG had scores ranging from –9.8 to –12.0. The hairpins had stems of 8 bp closed by either tetraloops (in rrnH and rrnG) or a pentaloop (rrnE) (Table 4). A putative terminator with a score value below our threshold (–3.18) was found downstream of the last tRNA gene in the rrnC operon. It consisted of the hairpin with low GC content in the stem (ΔG037 = –4.6 kcal/mol) closed by an AAA triloop. However, the T-region contained the sequence TTTTTTTTATCT, which will form a very unstable RNA:DNA heteroduplex (ΔG037 = –1.8 kcal/mol), thus, the whole construct may function effectively as an intrinsic terminator.
Table 4. RNAMotif putative terminators for rRNA operons in E.coli K-12 genome.
 |
|---|
Two groups of identical sequences with scores between –7.0 and –8.5 were identified inside operons rrnH, rrnA and rrnD, and inside operons rrnC, rrnB and rrnE. (data not shown). They started between 15 and 27 nt downstream from tRNA genes at the end of 16S rRNA clusters. These sequences in the spacer regions of rRNA operons are actually rrn anti-terminators that mediate efficient transcription through rho-dependent terminators (34–36). Consecutive hits with strong scores (–11.42 to –17.32) were found downstream of the putative terminators in three operons: rrnA, rrnB and rrnD (Table 4, Additional hits). They resided in the NCR between 112 and 118 nt downstream of the end of the putative terminators for rRNA operons.
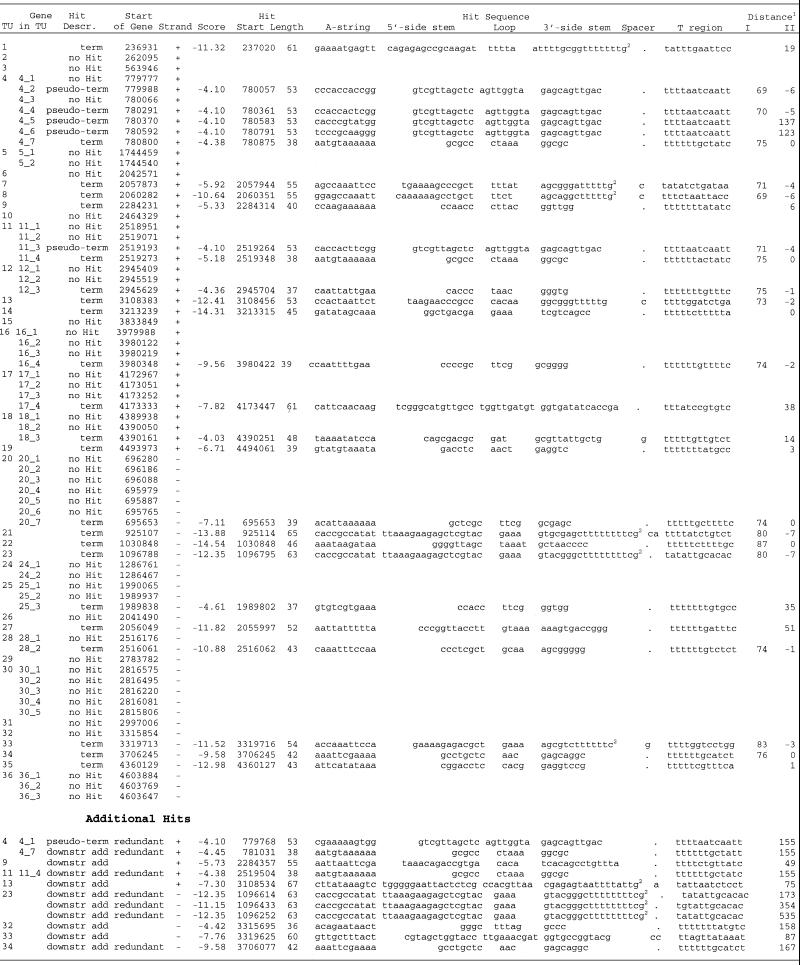
Putative terminators for tRNA transcription units. There are 86 tRNA genes annotated in the E.coli genome (21). Of these, 14 tRNA genes are included in rRNA operons. The other 72 tRNA genes are organized in 36 transcription units of 23 single tRNA genes and 13 operons containing from two to seven tRNA genes (Table 5). We found 23 RNAMotif hits obeying our distance-score requirements for putative terminators. Fourteen hits were found in NCR downstream of single tRNA genes and nine hits were found downstream of the operons.
Table 5. RNAMotif putative terminators for tRNA genes in E.coli K-12 genome.
 |
|---|
The analysis of these 23 putative transcription terminators for tRNA genes revealed considerable variation in sequences and structures. The length of terminator regions varied from 37 to 65 nt and scores ranged from –4.36 to –14.54. The hairpins had stems that ranged from 5 to 17 bp with loops of 3–10 nt. Only two identical putative terminators were found, those downstream of the last Lys-tRNA genes in TU4 and TU11 (Table 5). In all other cases, genes encoding the same tRNAs had different putative terminator sequences at different distances from the ends of the genes (Table 5). For nine single tRNA genes and four tRNA operons, no sequences meeting out terminator criteria were found. Either terminator sequences for these genes do not obey the constraints used in this study, or these tRNA transcripts are terminated via another mechanism.
Identical hits with scores of –4.10 were found inside the operons TU4 and TU11, and in NCR upstream of the first Lys-tRNA gene in TU4 (Table 5, Additional hit 4_1). The analysis of these six sequences showed that none were real terminator sequences but instead were intrinsic parts of down-tream Lys-tRNAs genes. The A-regions of these pseudo-terminators began 9 nt upstream of the start of Lys-tRNA genes. The sequences identified as hairpin and T-region of the terminator comprised the 5′-part of the Lys-tRNA gene including the D-loop and the acceptor stem. Thus, no putative terminators were found in intercistronic regions of tRNA operons suggesting that these operons are transcribed into a single pre-tRNA transcript, as has been observed experimentally for some transcripts (37).
Putative terminators for small non-coding RNAs. Putative terminators were found for seven of the 10 small regulatory RNAs known in E.coli (38). Some of the regulatory RNAs are processed from long primary transcripts while others are transcripts from single RNA genes (Table 6). Four of the putative terminators were for primary transcripts of single genes (TU 3, 6, 7 and 10) and began 30 or more nt upstream from the 3′-end of genes. Two other putative terminators were found in the NCR downstream of TU4 and TU9. These transcripts are processed post-transcriptionally from long pre-mRNA and these regions may serve as terminators for the long transcript. For three other processed RNAs (TU 1, 2 and 5), no putative terminators were found in the vicinity of the 3′-ends of genes. These RNAs may be processed from a long primary transcript under control of terminators for nearby genes. Three consecutive hits (two of them were identical) were found downstream of the putative terminator for rnpB RNAse P RNA gene (TU9) (Table 6, Additional hits). The results indicate that, in contrast to protein encoding genes, non-coding RNA genes may include all or only part of the terminator sequence within the transcript (Table 6). The terminator sequences may be removed during post-transcriptional processing or may be critical for the function or structure of the RNA.
Table 6. RNAMotif putative terminators for small non-coding RNA genes in E.coli K-12 genome.
 |
|---|
High scoring hits in non-coding regions
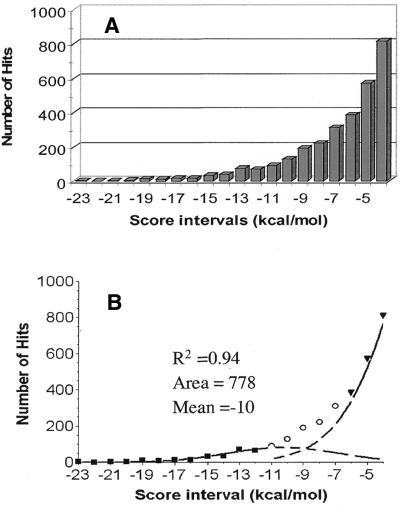
In addition to the 1075 hits of Set B, 2974 hits with score less than –4.0 were found in NCR more than 60 nt downstream from the nearest annotated gene (Table 1). The score distribution histogram for these hits fit two overlapping Gaussian curves (Fig. 7A). A small portion of hits with highest negative scores was fit by a Gaussian curve (R2 = 0.94) with a maximum in a score interval of –10.0 to –12.0 as was observed for Set B (Fig. 7B). This population probably consists of actual termination signals that may function to terminate transcription from the excess of predicted promoters in the E.coli genome (39). The vast majority of the hits in NCR (more than 2000) belong to a population that would fit a Gaussian curve with a maximum near score value of +3.0 and are apparently false positive hits.
Figure 7.
The score distribution histogram (A) and the Gaussian curves fitting it (B) for RNAMotif hits beginning in NCRs further than 60 nt downstream from the end of annotated genes. The lowest value of score bins were plotted on the _x_-axis. Each bin is 1 kcal/mol wide. The data were fit by Graphpad Prizm software.
DISCUSSION
Thermodynamic model for scores of RNAMotif hits
The rho-independent termination pathway includes three consecutive steps: the TEC pausing at termination point, the disruption of hybrid duplex formed between newly synthesized RNA and template DNA strand, and the formation of an RNA hairpin resulting in irreversible destabilization and dissociation of the TEC (7,8,12). A thermodynamic model for intrinsic transcription termination was developed by Yager and von Hippel (1,20), where the net TEC stability [–ΔG037 (TEC)] was described as an algebraic sum of three free energy terms:
ΔG037 (TEC) = ΔG037 (DNA bubble) + ΔG037 (RNA:DNA) + ΔG037 (TEC-NA) (2)
where ΔG037 (DNA bubble) is free energy of the formation of the DNA transcription bubble, ΔG037 (RNA:DNA) is the free energy of RNA:DNA hybrid formation and ΔG037 (TEC-NA) is the free energy gain from the interaction between RNAP and nucleic acids. The formation of the RNA hairpin at termination point disrupts most of the hybrid structure and reduces interaction between RBS and nascent RNA and presumably between DBS and DNA (8,9,14,15). Therefore, effectiveness of the intrinsic termination is driven mainly by the difference between stabilities of the RNA hairpin [ΔG037 (hairpin)] and the RNA:DNA hybrid duplex [ΔG037 (RNA:DNA)]. Equation 1 used for score calculation was based on this competitive model and includes additional terms reflecting the base composition effects of the T-region on TEC pausing.
Termination signals in NCR
Application of the RNAMotif algorithm resulted in identification of all 135 reported terminators (16). Additional 940 putative terminator sequences obeying distance and score criteria were found near the 3′-end of the annotated TU (Set B). Set B is a homogeneous population that fits to a single Gaussian curve (Fig. 5B). Thus, we believe that these additional 940 hits are functional terminators. If it is so, rho-independent events terminate approximately half of the 2300 annotated TU in the E.coli genome in good agreement with predictions (1). The broad shape of the curve (Fig. 5B) indicates that there is a probability that some true terminators with score values worse than our threshold exist. As an example, the putative terminator for rrnC operon had a score of –3.18, slightly worse than our threshold of –4.0.
Almost 3000 hits were identified in NCR, far from annotated TU. This population was fit by two overlapping Gaussian curves (Fig. 7B). Hits with the most negative scores were fit by a Gaussian curve (R2 = 0.94) very similar to that for Set B, suggesting that this population consists of actual termination signals. Some may be terminators for as yet unidentified genes. Others may be additional terminators that provide a backup to upstream terminators (40) or termination signals used to halt erroneous transcription from spurious promoters. The area under the curve reflects a population of 778 termination signals. If we apply our score threshold of –4.0 to this population the number of expected signals is reduced to approximately 700. The second curve (Fig. 7B) covering more than 2000 hits presumably outlines a population of false positive hits. This raises the issue of whether our constraints were too loose. The application of more restrictive constraints on the T-region resulted in significant reduction of the total number of hits, but it also reduced the detection of known terminators. In this experiment, constraints were chosen that allowed detection of all known terminators and did not significantly reduce the number of viable terminator candidates.
Evaluation of the prediction probability
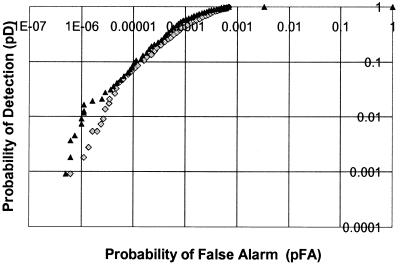
When creating and comparing detection algorithms that separate a set of data points into hits and non-hits, it is helpful to have a performance metric. A common method of data evaluation is an ROC curve, discussed in detail in the Materials and Methods. We tested two thermodynamic scoring systems: one represented by equation 1 and second by the free energy of the RNA hairpin formation alone [ΔG037 (hairpin)]. ROC curves for both scoring systems were plotted in logarithmic scale (Fig. 8). The curve corresponding to the score calculated using equation 1 is to the left of that for the hairpin-only score at all points. This indicates that the equation 1 score provides fewer false positives than the hairpin-only score at all pD values.
Figure 8.
True terminator prediction probability obtained from equation 1 scores (triangles) versus free energy of hairpin formation [ΔG037 (hairpin)] (dimonds).
In Table 7, performance statistics were converted to absolute values for several pD points. Also computed were the percent of points above a given threshold that represent true terminators. The right hand column shows the probability, for a given pD value, that any predicted terminator will be functional when experimentally tested. The equation 1 score significantly improves the odds of success over the hairpin-only score. For example, at the threshold values that yield pD = 0.01, the combined score nearly doubles (59 versus 32%) the chance that a given selection will turn out to be a true terminator when evaluated experimentally.
Table 7. Detection performance at several thresholds for both the score (equation 1) and free energy of hairpin formation.
| Threshold | pD | pFA | Number of missed true terminators | Number of retained false positive hits | Probability of prediction of true terminator (%) |
|---|---|---|---|---|---|
| Combined parameter score (equation 1) | |||||
| –5.7 | 0.9 | 3.5E-04 | 110 | 2812 | 26 |
| –10.4 | 0.5 | 7.2E-05 | 550 | 577 | 48 |
| –15.9 | 0.1 | 1.1E-05 | 990 | 90 | 56 |
| –20.9 | 0.01 | 1.0E-06 | 1089 | 8 | 59 |
| Free energy for a hairpin [ΔG037 (hairpin)] | |||||
| –10.0 | 0.9 | 1.0E-03 | 110 | 4054 | 20 |
| –14.6 | 0.5 | 2.5E-04 | 550 | 1014 | 35 |
| –20.2 | 0.1 | 3.2E-05 | 990 | 126 | 48 |
| –24.7 | 0.01 | 5.3E-06 | 1089 | 21 | 32 |
The ROC curves as presented are adequate for comparing algorithms, as we have done here. To correctly predict the true ROC, one would have to know the set of all actual terminators. The pFA predictions are artificially high because true terminators for unknown genes and other termination signals in NCR are not correctly classified in the ROC analysis. The analysis of hit population residing far from annotated genes in NCR (Fig. 7B) predicts the existence of an additional 700 putative termination signals with the same score distribution as for the Set B members. When the ROC curve is corrected by assuming that these signals are correct (not shown), the pFA estimate for the score calculated using equation 1 improves from 4 × 10⁻⁵ to 1 × 10⁻⁵ at a pD value of 0.1. At the same pD, the estimate for the probability of a predicted terminator is functional improves from 56 to 81%.
Specificity of termination signals
The results obtained indicate that no more than one-third of 6635 hits with score less than –4.0 found in NCR and ORFs are reported or putative terminators. This raises the question about the role of the other two-thirds of this population. Almost 1000 are the ‘consecutive hits’ situated no more than 200 nt downstream of the first hit. In NCR, they may enhance the effectiveness of the primary terminator (40), serve as terminators for as yet unidentified small ORFs and RNA genes residing between consecutive terminators or function as processing signals for upstream genes. Some of these apparent terminator sequences are actually part of other signals and structures. For example, six hits with scores between –7.0 and –8.5 (sequences not shown) are previously identified anti-terminators of rho-dependent termination in spacer regions of rRNA (26,34–36,41,42). What the RNAMotif algorithm identified as the hairpin of an intrinsic terminator was actually the ‘BoxB’ hairpin of the anti-terminator, followed by a T-rich region characteristic of the ‘BoxA’ signal. Another example is found in the 5′ terminal region of Lys-tRNA genes, where sequences that match our terminator criteria function as the acceptor stem and the D-loop of the tRNA (pseudo-terminators in Table 5, TU4 and TU11). Thus, these are examples of sequences that match terminator constraints but are buried in the context of a larger signal that has a different function.
The question also rises about the role of the hits with good scores residing in ORFs. More than 40 hits with the parameters of very strong intrinsic termination signals (score less than –10.0 and sequences TTTTT or TTTTA in the proximal T-regions) were found in ORFs. While it is tempting to consider these hits to be false positives, we cannot identify any features of these hits that make them less suitable as terminators than terminators with similar scores located in the ‘correct’ positions near the ends of ORFs. One possibility is that there is a requirement missing from our search constraints that would separate true functional terminators from false positives. Alternatively, there may be signals outside the terminator sequence that suppresses termination in inappropriate places, as occurs with attenuators. A third possibility is that these terminators actually stop transcription much of the time, producing truncated transcripts that are rapidly degraded. Experimental analysis will be required to distinguish these possibilities.
CONCLUSIONS
The E.coli genome consists of more than 2200 annotated TU (18,39). Using the RNAMotif algorithm (21), in combination with descriptors including structure and sequence constraints and a thermodynamic scoring system, putative rho-independent terminators have been identified for 1075 of the annotated genes and operons. Putative terminators for all annotated rRNA operons and small non-coding RNAs as well as for more than 64% of tRNA TU were found. This suggests that the transcription termination of RNA genes occurs mainly via rho-independent mechanism or via combination of both rho-independent and rho-dependent mechanisms as was reported for rrnG operon (40). Putative terminators were found for half of the protein encoding ORFs suggesting that both rho-dependent and rho-independent mechanisms participate equally in transcription termination of protein-encoding TU as was predicted (1). We have also predicted the existence of an additional 700 putative termination signals in NCR further than 60 nt downstream from the annotated genes. These numbers are in agreement with the excess number of promoters predicted in the E.coli genome (39). Sequences between predicted orphan promoters and terminators in NCR may be candidates for as yet undiscovered genes.
SUPPLEMENTARY MATERIAL
Supplementary Material is available at NAR Online.
[Supplementary Data]
Acknowledgments
ACKNOWLEDGEMENTS
We thank Dr J. Wyatt for her thorough and very useful editing of the manuscript and W. Schuelke for technical support during the manuscript preparation.
References
- 1.von Hippel P.H. (1998) An integrated model of the transcription complex in elongation, termination and editing. Science, 281, 660–665. [DOI] [PubMed] [Google Scholar]
- 2.Farnham P.J. and Platt,T. (1981) Rho-independent termination: dyad symmetry in DNA causes RNA polymerase to pause during transcription in vitro. Nucleic Acids Res., 9, 563–577. [DOI] [PMC free article] [PubMed] [Google Scholar]
- 3.Wilson K.S. and von Hippel,P.H. (1995) Transcription termination at intrinsic terminators: The role of the RNA hairpin. Proc. Natl Acad. Sci. USA, 92, 8793–8797. [DOI] [PMC free article] [PubMed] [Google Scholar]
- 4.Reynolds R., Bermudez-Cruz,R.M. and Chamberlin,M.J. (1992) Parameters affecting transcription termination by Escherichia coli RNA polymerase. I. Analysis of 13 rho-independent terminators. J. Mol. Biol., 224, 31–51. [DOI] [PubMed] [Google Scholar]
- 5.von Hippel P.H. and Yager,T.D. (1992) The elongation-termination decision in transcription. Science, 255, 809–812. [DOI] [PubMed] [Google Scholar]
- 6.Uptain S.M. and Chamberlin,M.J. (1997) Escherichia coli RNA polymerase terminates transcription efficiently at rho-independent terminators on single-stranded DNA templates. Proc. Natl Acad. Sci. USA, 94, 13548–13553. [DOI] [PMC free article] [PubMed] [Google Scholar]
- 7.Gusarov I. and Nudler,E. (1999) The mechanism of intrinsic transcription termination. Mol. Cell, 3, 495–504. [DOI] [PubMed] [Google Scholar]
- 8.Yarnell W.S. and Roberts,J.W. (1999) Mechanism of intrinsic transcription termination and antitermination. Science, 284, 611–615. [DOI] [PubMed] [Google Scholar]
- 9.Zhang G., Campbell,E.A., Minakhin,L., Richter,C., Severinov,K. and Darst,S.A. (1999) Crystal structure of Thermus aquaticus core RNA polymerase at 3.3 Å resolution. Cell, 98, 811–824. [DOI] [PubMed] [Google Scholar]
- 10.Korzheva N., Mustaev,A., Kozlov,M., Malhotra,A., Nikiforov,V., Goldfarb,A. and Darst,S.A. (2000) A structural model of transcription elongation. Science, 289, 619–625. [DOI] [PubMed] [Google Scholar]
- 11.Martin F.H. and Tinoco,I.J. (1980) DNA–RNA hybrid duplexes containing oligo(dA:rU) sequences are exceptionally unstable and may facilitate termination of transcription. Nucleic Acids Res., 8, 2295–2299. [DOI] [PMC free article] [PubMed] [Google Scholar]
- 12.Landick R. (1997) RNA polymerase slides home: pause and termination site recognition. Cell, 88, 741–744. [DOI] [PubMed] [Google Scholar]
- 13.Nudler E., Gusarov,I., Avetissova,E., Kozlov,M. and Goldfarb,A. (1998) Spatial organization of transcription elongation complex in Escherichia coli. Science, 281, 424–428. [DOI] [PubMed] [Google Scholar]
- 14.Brendel V. and Trifonov,E.N. (1984) A computer algorithm for testing potential prokaryotic terminators. Nucleic Acids Res., 12, 4411–4427. [DOI] [PMC free article] [PubMed] [Google Scholar]
- 15.Brendel V., Hamm,G.H. and Trifonov,E.N. (1986) Terminators of transcription with RNA polymerase from Escherichia coli: what they look like and how to find them. J. Biomol. Struct. Dyn., 3, 705–723. [DOI] [PubMed] [Google Scholar]
- 16.d’Aubenton Carafa Y., Brody,E. and Thermes,C. (1990) Prediction of rho-independent Escherichia coli transcription terminators. A statistical analysis of their RNA stem–loop structures. J. Mol. Biol., 216, 835–858. [DOI] [PubMed] [Google Scholar]
- 17.Ermolaeva M.D., Khalak,H.G., White,O., Smith,H.O. and Salzberg,S.L. (2000) Prediction of transcription terminators in bacterial genomes. J. Mol. Biol., 301, 27–33. [DOI] [PubMed] [Google Scholar]
- 18.Yada T., Nakao,M., Totoki,Y. and Nakai,K. (1999) Modeling and predicting transcriptional units of Escherichia coli genes using hidden Markov models. Bioinformatics, 15, 987–993. [DOI] [PubMed] [Google Scholar]
- 19.Macke T., Ecker,D.J., Gutell,R., Gautheret,D., Case,D. and Sampath,R. (2001) RNA Motif – A new RNA secondary structure definition and discovery algorithm. Manuscript in preparation. [DOI] [PMC free article] [PubMed]
- 20.Yager T.D. and von Hippel,P.H. (1991) A thermodynamic analysis of RNA transcript elongation and termination in Escherichia coli. Biochemistry, 30, 1097–1118. [DOI] [PubMed] [Google Scholar]
- 21.Blattner F.R., Plunkett,G., Bloch,C.A., Perna,N.T., Burland,V., Riley,M., Collado-Vides,J., Glasner,J.D., Rode,C.K., Mayhew,G.F., Gregor,J., Davis,N.W., Kirkpatrick,H.A., Goeden,M.A., Rose,D.J., Mau,B. and Shao,Y. (1997) The complete genome sequence of Escherichia coli K-12. Science, 277, 1453–1462. [DOI] [PubMed] [Google Scholar]
- 22.Altschul S.F., Madden,T.L., Schaffer,A.A., Zhang,J., Zhang,Z., Miller,W. and Lipman,D.J. (1997) Gapped BLAST and PSI-BLAST: a new generation of protein database search programs. Nucleic Acids Res., 25, 3389–3402. [DOI] [PMC free article] [PubMed] [Google Scholar]
- 23.Mathews D.H., Sabina,J., Zuker,M. and Turner,D.H. (1999) Expanded sequence dependence of thermodynamic parameters improves prediction of RNA secondary structure. J. Mol. Biol., 288, 911–940. [DOI] [PubMed] [Google Scholar]
- 24.Sugimoto N., Nakano,S., Katoh,M., Matsumura,A., Nakamuta,H., Ohmichi,T., Yoneyama,M. and Sasaki,M. (1995) Thermodynamic parameters to predict stability of RNA/DNA hybrid duplexes. Biochemistry, 34, 11211–11216. [DOI] [PubMed] [Google Scholar]
- 25.Landick T., Turnbough,J.R. and Yanofsky,C. (1996) Transcription attenuation. In Neidhardt,F.C. (ed.), Escherichia coli and Salmonella typhimurium. American Society for Microbiology, Washington, DC.
- 26.Richardson J.P. and Greenblatt,J. (1996) Control of RNA chain elongation and termination. In Neidhardt,F.C. (ed.), Escherichia coli and Salmonella typhimurium. American Society for Microbiology, Washington, DC.
- 27.Henkin T.M. (1996) Control of transcription termination in prokaryotes. Annu. Rev. Genet., 30, 35–57. [DOI] [PubMed] [Google Scholar]
- 28.Antao V.P., Lai,S.Y. and Tinoco,I.,Jr (1991) A thermodynamic study of unusually stable RNA and DNA hairpins. Nucleic Acids Res., 19, 5901–5905. [DOI] [PMC free article] [PubMed] [Google Scholar]
- 29.Postle K. and Good,R.F. (1985) A bidirectional rho-independent transcription terminator between the E. coli tonB gene and an opposing gene. Cell, 41, 577–585. [DOI] [PubMed] [Google Scholar]
- 30.Young R.A. (1979) Transcription termination in the Escherichia coli ribosomal RNA operon rrnC. J. Biol. Chem., 254, 12725–12731. [PubMed] [Google Scholar]
- 31.Brosius J., Dull,T.J., Sleeter,D.D. and Noller,H.F. (1981) Gene organization and primary structure of a ribosomal RNA operon from Escherichia coli. J. Mol. Biol., 148, 107–127. [DOI] [PubMed] [Google Scholar]
- 32.Lund E., Dahlberg,J.E., Lindahl,L., Jaskunas,R., Dennis,P.P. and Nomura,M. (1976) Transfer RNA genes between 16S and 23S rRNA genes in rRNA transcription units of E. coli. Cell, 7, 165–177. [DOI] [PubMed] [Google Scholar]
- 33.Schlessinger D. (1980) In Chambliss,G., Craven,G.R., Davies,J., Davis,K., Kahan,L., Nomura,M. (eds), Ribosomes: Structure, Function and Genetics. University Park Press, Baltimore, pp. 767–780.
- 34.Berg K.L., Squires,C. and Squires,C.L. (1989) Ribosomal RNA operon anti-termination. Function of leader and spacer region box B-box A sequences and their conservation in diverse micro-organisms. J. Mol. Biol., 209, 345–358. [DOI] [PubMed] [Google Scholar]
- 35.Squires C.L., Greenblatt,J., Li,J., Condon,C. and Squires,C.L. (1993) Ribosomal RNA antitermination in vitro: Requirement for Nus factors and one or more unidentified cellular components. Proc. Natl Acad. Sci. USA, 90, 970–974. [DOI] [PMC free article] [PubMed] [Google Scholar]
- 36.Albrechtsen B., Squires,C.L., Li,S. and Squires,C. (1990) Antitermination of characterized transcriptional terminators by the Escherichia coli rrnG leader region. J. Mol. Biol., 213, 123–134. [DOI] [PubMed] [Google Scholar]
- 37.Deutscher M.P. (1984) Processing of tRNA in prokaryotes and eukaryotes. CRC Crit. Rev. Biochem., 17, 45–71. [DOI] [PubMed] [Google Scholar]
- 38.Wassarman K.M., Zhang,A. and Storz,G. (1999) Small RNAs in Escherichia coli. Trends Microbiol., 7, 37–45. [DOI] [PubMed] [Google Scholar]
- 39.Salgado H., Santos-Zavaleta,A., Gama-Castro,S., Millan-Zarate,D., Blattner,F.R. and Collado-Vides,J. (2000) RegulonDB(version 3.0): transcriptional regulation and operon organization in Escherichia coli K-12. Nucleic Acids Res., 28, 65–67. [DOI] [PMC free article] [PubMed] [Google Scholar]
- 40.Albrechtsen B., Ross,B.M., Squires,C. and Squires,C.L. (1991) Transcriptional termination sequence at the end of the Escherichia coli ribosomal RNA G operon: complex terminators and antitermination. Nucleic Acids Res., 19, 1845–1852. [DOI] [PMC free article] [PubMed] [Google Scholar]
- 41.Pfeiffer T. and Hartmann,R.K. (1997) Role of the spacer boxA of Escherichia coli ribosomal RNA operons in efficient 23 S rRNA synthesis in vivo. J. Mol. Biol., 265, 385–393. [DOI] [PubMed] [Google Scholar]
- 42.Nodwell J.R. and Greenblatt,J. (1993) Recognition of boxA antiterminator RNA by the E. coli antitermination factors NusB and ribosomal protein S10. Cell, 72, 261–268. [DOI] [PubMed] [Google Scholar]
Associated Data
This section collects any data citations, data availability statements, or supplementary materials included in this article.
Supplementary Materials
[Supplementary Data]
