Size- and speed-dependent mechanical behavior in living mammalian cytoplasm (original) (raw)
Significance
Although the driving force generated by motor proteins to deliver intracellular cargos is widely studied, the mechanical nature of cytoplasm, which is also important for intracellular processes by providing mechanical resistance, remains unclear. We use optical tweezers to directly characterize the resistance to transport in living mammalian cytoplasm. Using scaling analysis, we successfully distinguish between the underlying mechanisms governing the resistance to mechanical deformation, that is, among viscosity, viscoelasticity, poroelasticity, or pure elasticity, depending on the speed and size of the probe. Moreover, a cytoplasmic state diagram is obtained to illustrate different mechanical behaviors as a function of two dimensionless parameters; with this, the underlying mechanics of various cellular processes over a broad range of speed and size scales is revealed.
Keywords: cell mechanics, poroelasticity, viscoelasticity, cytoplasmic state diagram
Abstract
Active transport in the cytoplasm plays critical roles in living cell physiology. However, the mechanical resistance that intracellular compartments experience, which is governed by the cytoplasmic material property, remains elusive, especially its dependence on size and speed. Here we use optical tweezers to drag a bead in the cytoplasm and directly probe the mechanical resistance with varying size a and speed V. We introduce a method, combining the direct measurement and a simple scaling analysis, to reveal different origins of the size- and speed-dependent resistance in living mammalian cytoplasm. We show that the cytoplasm exhibits size-independent viscoelasticity as long as the effective strain rate V/a is maintained in a relatively low range (0.1 s−1 < V/a < 2 s−1) and exhibits size-dependent poroelasticity at a high effective strain rate regime (5 s−1 < V/a < 80 s−1). Moreover, the cytoplasmic modulus is found to be positively correlated with only V/a in the viscoelastic regime but also increases with the bead size at a constant V/a in the poroelastic regime. Based on our measurements, we obtain a full-scale state diagram of the living mammalian cytoplasm, which shows that the cytoplasm changes from a viscous fluid to an elastic solid, as well as from compressible material to incompressible material, with increases in the values of two dimensionless parameters, respectively. This state diagram is useful to understand the underlying mechanical nature of the cytoplasm in a variety of cellular processes over a broad range of speed and size scales.
The cytoplasm of living mammalian cells is a crowded, yet dynamic, environment (1). There are continuous intracellular movements that are vital for cell physiology, such as transport of vesicles and other organelles. While biological motors and other enzymatic processes provide key driving forces for these activities, the mechanical properties of the cytoplasm are crucial for determining the mechanical resistance that cellular compartments experience. Indeed, both the active driving force and appropriate mechanical environment are critical for shaping the living cellular machinery. However, while the force that molecular motors generate both individually and collectively has been extensively studied (2, 3), the mechanical properties of the cytoplasmic environment remain elusive. In addition, the impact of object size and velocity on the mechanical resistance that active forces need to overcome to enable transport remains unclear. Such characterization is essential for understanding the physical environment and numerous key dynamic processes inside living cells.
The cytoplasm is composed of cytoskeletal networks and many proteins, as well as organelles and vesicles. Materials with such complex microstructure are expected to display time-dependent or frequency-dependent properties (4). Indeed, it has been revealed by many experimental approaches that the mechanical properties of living cells exhibit clear frequency dependency (5, 6); the cell response follows a power-law rheology behavior within a broad frequency range (3, 7, 8). A common view is that cells are viscoelastic materials (9–13), and the observed mechanical properties depend on the timescale over which the deformation occurs during the measurement. One important feature of a viscoelastic material is that its mechanical property does not depend on any length scales of the observation (14). Interestingly, it has recently been demonstrated that living cells may also behave like a poroelastic gel at short timescales (15–17); the stress relaxation of cells can be entirely determined by migration of cytosol through cytoskeletal networks. In the framework of poroelasticity, the measured mechanical property strongly depends on the size of the probe, as it takes a longer time for cytosol to move over a longer distance, therefore the stress relaxes slower. The size-dependent poroelastic behavior is in direct contrast to viscoelasticity whose relaxation is a material property and is independent of probe size, set by the time-dependent response of the materials’ macromolecular and supramolecular constituents. More importantly, most of previous attempts to study cell mechanics probe cells from the exterior, such as by using atomic force microscopy or an optical stretcher, and thus the measurement depends more on the stiff actin-rich cell cortex rather than on the much softer cytoplasm (13, 15, 18). Therefore, it remains unclear if viscoelasticity or poroelasticity better describes the rate-dependent resistance of the cytoplasm of living mammalian cells, or if both are required.
In this paper, we use optical tweezers to drag a plastic bead in the cytoplasm of a living mammalian cell and directly measure the force (denoted by F) and displacement (denoted by x) relationship, which reflects the mechanical behavior of the cytoplasm. Considering both viscoelasticity and poroelasticity, we identify two independent dimensional parameters in the experiments: V/a and Va, where V and a represent the speed and diameter of the probe bead, respectively. Using these two control parameters, and through a combination of experimental measurement and scaling analysis, we reveal different origins of cytoplasmic resistance, ranging from viscous, viscoelastic, and poroelastic to pure elastic. Finally, we classify different cytoplasmic mechanical behaviors in an overall state diagram, which illustrates different origins of mechanical resistance of a variety of physiological processes in cells with different characteristic size and speed.
Results and Discussion
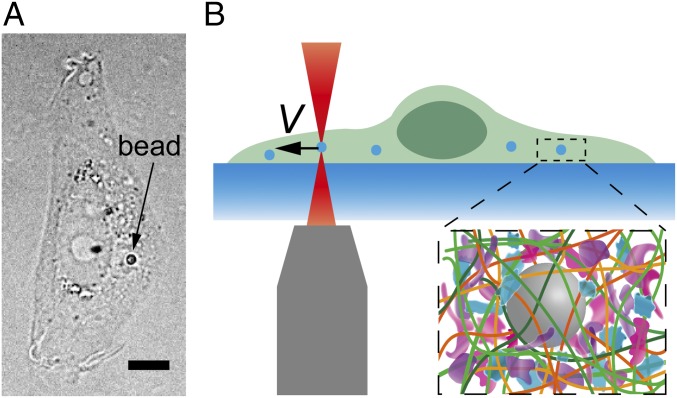
To investigate the mechanical resistance that intracellular objects experience within a living mammalian cytoplasm we deliver micrometer-sized polystyrene beads into living normal rat kidney epithelial cells (NRK) through endocytosis (Fig. 1_A_). These beads, with sizes ranging from 0.5 µm to 1.5 µm, distribute randomly inside the cell and are much larger than the typical cytoskeletal mesh size [∼50 nm (19)]; these beads can thereby probe the cytoplasm modeled as a continuous medium. We then use optical tweezers to trap and pull a bead unidirectionally with a constant speed toward the cell boundary, as illustrated in Fig. 1_B_ and Movie S1. To avoid any interactions with the mechanically distinct cell cortex and nucleus we only use beads that are positioned greater than 1.5 µm away from the cell boundary, and away from both the thin lamellar region and the nucleus. The beads are pulled unidirectionally at a constant speed; thus, the intracellular resistance force on the bead in the direction of motion equals the measured pulling force. A force-vs.-displacement curve of the cytoplasm is then obtained (Fig. S1_A_). To compare measurements of different bead sizes we normalize the force as F/S and the displacement as x/a, where S is the cross-sectional area and a is the diameter of the bead, and thus obtain a normalized force-displacement curve.
Fig. 1.
Experimental setup measuring the mechanical resistance in living mammalian cytoplasm. (A) Bright-field image of an NRK cell with a 1-µm-diameter particle inside. (Scale bar, 5 µm.) (B) Schematic showing the experimental setup. A probe bead is dragged at a constant speed toward the cell boundary to obtain a force-displacement curve. (Inset) The crowed environment around the bead in cells.
Fig. S1.
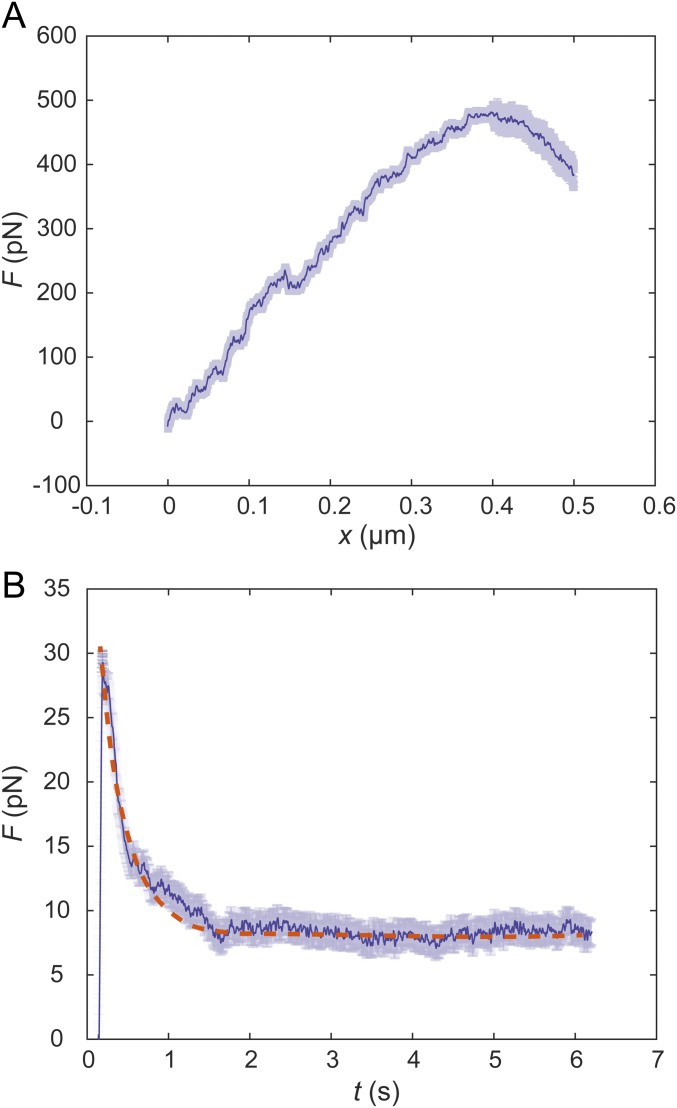
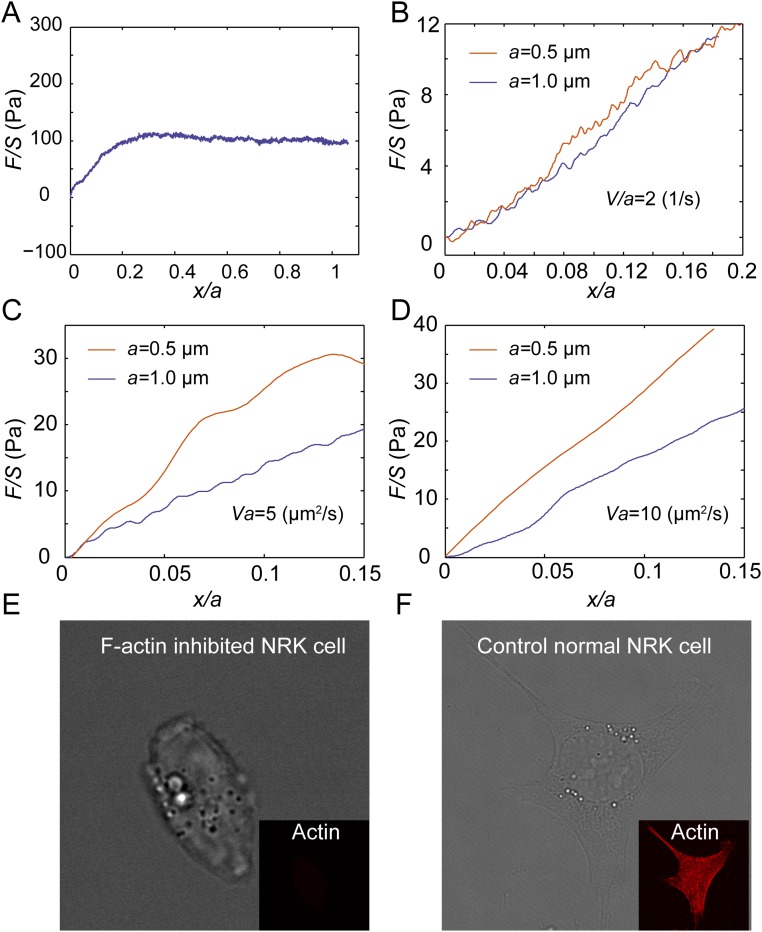
Representative force-displacement curve and relaxation curve obtained in the cytoplasm of NRK cells. The semitransparent bars represent SE (n = 20 for A, n = 15 for B). (A) The force-displacement curve is obtained by stretching a 0.5-μm-diameter bead at a speed of 1 μm/s in the cytoplasm. (B) The relaxation curve is obtained by stretching a 0.5-μm-diameter bead to 0.1 μm displacement at a high speed of 30 μm/s in the cytoplasm, then maintaining the location of the bead and recording the force as a function of time. Because the duration of the initial stretching is much shorter than the relaxation time recorded, the loading process can be regarded as instantaneous. The apparent relaxation time τ obtained through exponential fitting of the relaxation curves is 0.79 ± 0.13 s (n = 15, mean ± SD). The orange dashed line is the single term exponential fitting of the relaxation curve.
To understand the mechanical resistance in the cytoplasm we assume that the resistance force experienced by the bead is mainly due to the restoring force from the deformed cytoskeleton and the inhomogeneously distributed pore pressure in the cytoplasm. Deformation of the cytoskeleton structure itself is typically viscoelastic, which can result from cytoskeletal structure rearrangement and bond fracture of proteins (20). The kinetics of viscoelasticity can be characterized by intrinsic relaxation timescales or time spectra (21, 22) that are independent of loading conditions, such as bead diameter and speed. The local deformation of the cytoplasm also results in an inhomogeneous distribution of pore pressure in the porous structure formed by the cytoskeleton due to poroelasticity (15, 23). To reach a rehomogenization of pore pressure distribution, the intracellular fluid flows over characteristic distances related to bead size, with characteristic poroelastic relaxation time _a_2/D; D is the effective poroelastic diffusivity of the cytosol and scales as D ∼ Eκ (23), where E is the equilibrium elastic modulus of the cytoplasm and κ is the permeability defined as the flux of cytosol through cytoskeletal network under unit pressure gradient. We thus take both viscoelasticity and poroelasticity into consideration when analyzing the mechanical resistance of the cytoplasm. Both viscoelastic relaxation times and effective poroelastic diffusivity are considered as constants for NRK cells in the following discussion.
In our experiments there is only one timescale associated with the loading condition, which is a/V. Based on simple scaling analysis, the relationship between the resistant force and bead displacement, F = f (E, τ i, D, ν, a, x, V), can be transformed to a dimensionless form, F/ES = f (x/a, Va/D, Vτ i/a, ν), where S is the cross-sectional area of the bead, ν is the equilibrium Poisson’s ratio of the cytoplasm, and τ i represents a series of characteristic viscoelastic timescales. For a certain cell type, E, D, τ i, and ν are constants. Here, Vτ i/a (i = 1, 2, 3…) are dimensionless parameters denoting the ratio of the characteristic viscoelastic timescales to the experimental timescale, which is known as the Deborah number (24). Va/D is the ratio of the characteristic poroelastic timescale to the experimental timescale. As discussed above, when the observed rate-dependent mechanical behavior is only due to viscoelasticity, and a constant V/a is maintained, the measured relations between F/S and x/a should collapse to one curve; when the observed rate-dependent behavior is only due to poroelasticity, and a constant Va is maintained, the measured relations should collapse to one curve.
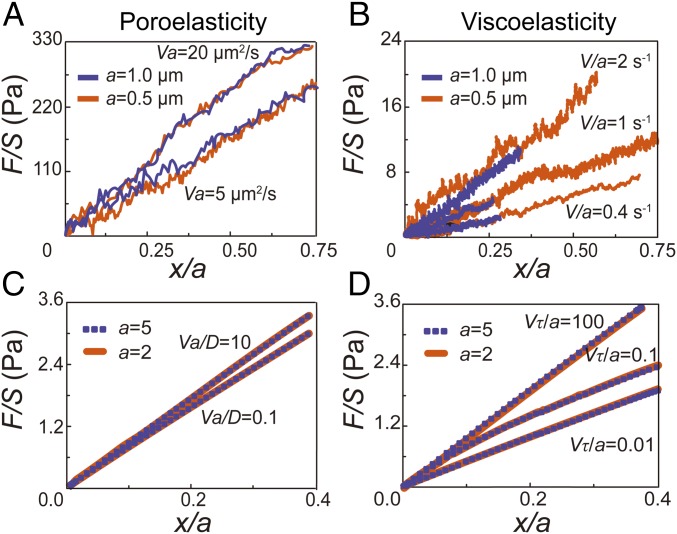
To validate the ability of our experimental approach to distinguish between viscoelastic and poroelastic behaviors we perform unidirectional particle stretching within classical poroelastic and viscoelastic materials having known material properties. To test poroelastic behavior, we use polyacrylamide (PA) (3% acrylamide and 0.05% bis-acrylamide cross-linker), a hydrogel having covalently cross-linked networks demonstrated to have linear elastic behavior over a broad range of frequencies (25). However, when the gel is subjected to a high-enough strain rate deformation, fluid flow within the gel network affects material resistance to the applied deformation, and the rate dependence is well captured by linear poroelasticity theory (26). We premix beads of two different sizes (0.5-µm and 1-µm diameter) and perform unidirectional pulling at relatively high speeds (5, 10, 20, and 40 µm/s). We find that the measured normalized force-displacement curves are close to each other when Va is a constant (Fig. 2_A_). Moreover, higher values of Va yield larger stresses at the same strain, consistent with the behavior of poroelastic materials. In addition, according to the analytical solution of the inclusion problem of a spherical rigid inclusion within an elastic medium (27), the Young’s modulus of the medium E can be obtained as E = [(5 − 6_ν_)(1 + ν)/24(1 − ν)]E A, where ν is the Poisson’s ratio and E A is the apparent modulus measured as the average slope of the normalized force-displacement curve from 0 to 10% normalized displacement. Using a Poisson’s ratio of 0.457 (28), the calculated elastic modulus of our PA gel is ∼80 Pa (Fig. 2_A_), in agreement with our bulk rheology measurements on the same gel (Fig. S2).
Fig. 2.
Validation of the scaling argument through experiments in classical materials and with finite element simulation. (A) Normalized force-displacement curves obtained in a classical poroelastic material, PA gel, by dragging beads with 1 µm (blue lines) and 0.5 µm (orange lines) in diameter at different speeds. Curves with the same Va (20 µm2/s and 5 µm2/s, respectively) are close to each other. (B) Normalized force-displacement curves obtained in a classical viscoelastic material, alginate gel (5 mg/mL alginate cross-linked with 3 mM calcium sulfate), by dragging beads with 1 µm (blue lines) and 0.5 µm (orange lines) in diameter at different speeds. Curves with the same V/a (2, 1, and 0.4 s−1, respectively) are close to each other. Each force displacement curve shown in A and B is averaged over at least 20 individual experiments. (C and D) Finite element simulation of dragging a bead in a large cubic poroelastic material (C) and viscoelastic material (D). Two dimensionless bead sizes are used, 5/5,000 of the overall sample length (orange lines), and 2/5,000 of the sample length (purple dashed lines). (C) If the material is defined as poroelastic, curves with the same Va/D (10 and 0.1, respectively) collapse. (D) If the material is defined as viscoelastic, curves with the same Vτ/a (100, 0.1, and 0.01, respectively) collapse.
Fig. S2.
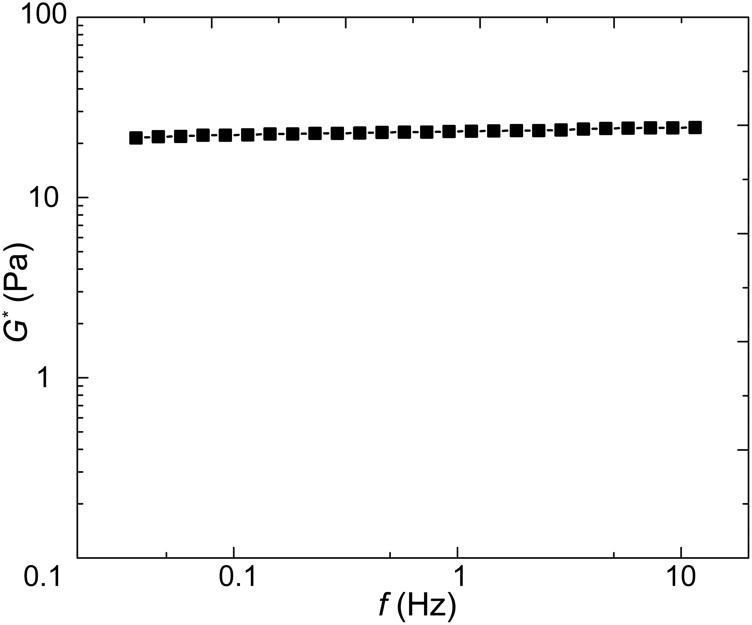
The complex modulus G* of bulk PA gel measured using a rheometer with a parallel plate geometry (Gemini HRnano; Malvern Instruments). We can calculate the value of E* = 75.4 Pa through the relation E* = 2(1 + ν)G*. This value is consistent with E* = 80 Pa measured with optical tweezers when Va = 5 µm2/s (Fig. 2_A_).
To test if stress strain curves with the same V/a collapse in the viscoelastic regime we use ionic cross-linked alginate gel, made of 5 mg/mL alginate solution cross-linked with 3 mM calcium sulfate. The viscoelastic behavior of alginate gel has been well characterized in a broad frequency range corresponding to low-enough strain rates (29). In this case, beads are pulled at a range of relatively low speeds (0.4, 0.8, 1, 2, and 4 µm/s) for which viscoelasticity dominates stress-strain behavior. Indeed, we find that at constant V/a the measured normalized force-displacement curves are close to each other (Fig. 2_B_). For the same bead size, higher pulling speed results in a greater resistant force, also consistent with the response of most viscoelastic materials. When the strain rate is high, stresses in the material do not have time to relax. These results demonstrate that our method can indeed distinguish poroelasticity and viscoelasticity in a material.
In addition, we have also performed finite element simulations using ABAQUS (www.3ds.com) to verify our scaling analysis. In the simulation, a rigid bead is embedded within an elastic solid, which is much larger than the bead. A constant velocity is applied to the bead. The resistant force exerted on the bead is then computed. In the simulation, the elastic solid is defined as either a viscoelastic material [using a Prony series (30)] or a linear poroelastic material. As expected, our numerical simulations again confirm the scaling analysis (Fig. 2 C and D).
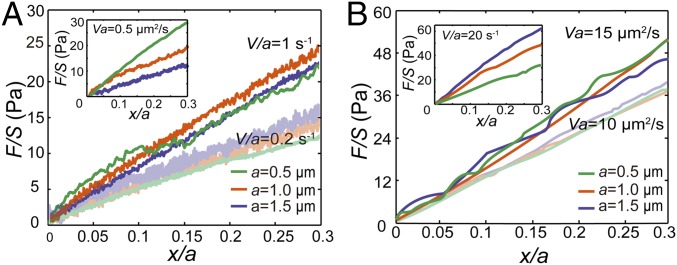
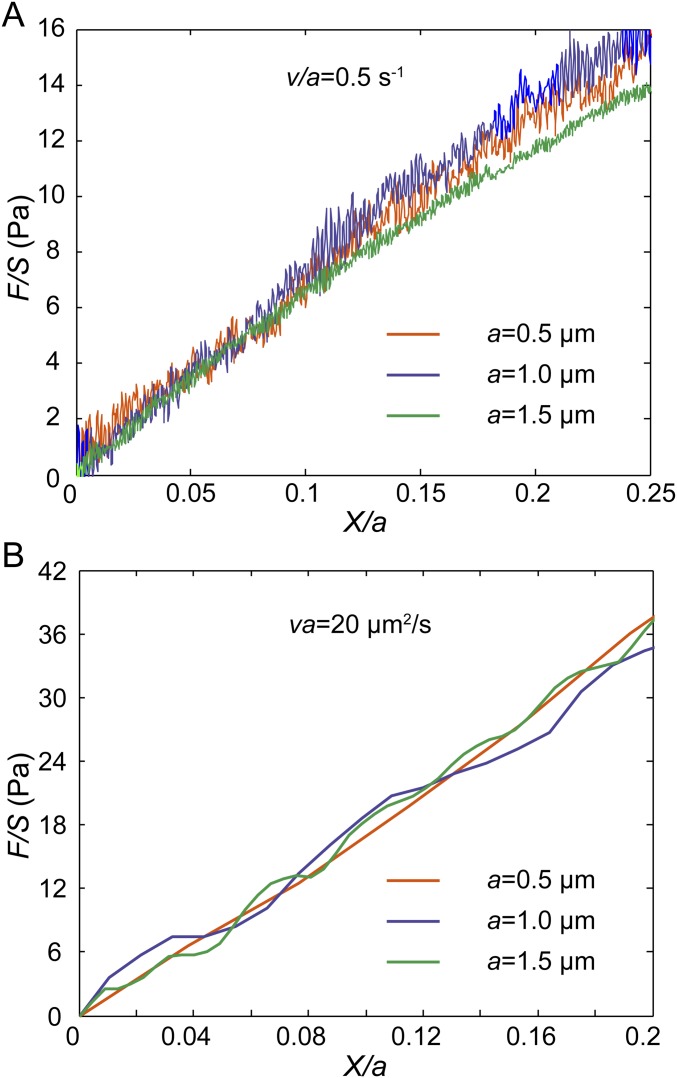
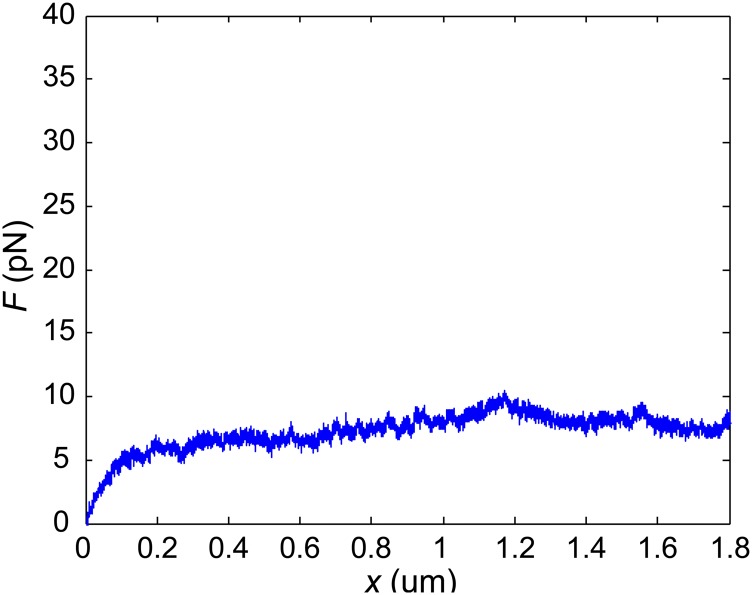
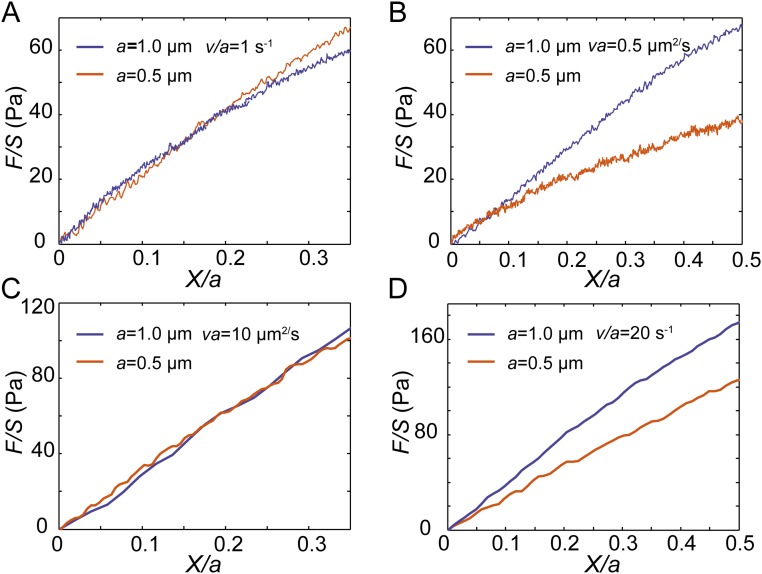
We next apply this method in the cytoplasm of living NRK cells. We measure the normalized force-displacement curves at different loading speeds and with three different bead sizes (0.5, 1, and 1.5 µm). We find that the cytoplasm’s mechanical behavior strongly depends on the two dimensional numbers, V/a and Va, in two ranges of effective strain rate. The cytoplasm is viscoelastic at low effective strain rates (0.1 s−1 < V/a < 2 s−1), as the normalized force-displacement curves are close to each other for measurements with the same V/a (e.g., 1, 0.5, and 0.2 s−1, Fig. 3_A_ and Fig. S3_A_). Within this regime, when we compare measurements with the same Va instead (e.g., 0.5 µm2/s) they clearly separate from each other (Fig. 3_A_, Inset). Through similar analysis, we find that the cytoplasm appears poroelastic under high effective strain rate (5 s−1 < V/a < 80 s−1), as the normalized force-displacement curves are close to each other for measurements with the same Va (e.g., 20, 15, and 10 µm2/s, Fig. 3_B_ and Fig. S3_B_). Again, within this regime, when we compare measurements with the same V/a (e.g., 20 s−1) they are distinguished from each other (Fig. 3_B_, Inset). Moreover, when the effective strain rate is reduced further (V/a < 0.1 s−1) the resistance force remains roughly a constant with increasing displacement (Fig. S4). This is a typical feature of a viscous fluid with an effective viscosity, estimated here to be 12.1 ± 6.3 Pa·s (n = 15, mean ± SD), consistent with previous measurements (10, 31). Similar results are observed using HeLa cells (Fig. S5).
Fig. 3.
Normalized force-displacement curves measured in the cytoplasm of NRK cells show that the cytoplasm exhibits viscoelasticity under small effective strain rate and exhibits poroelasticity under large effective strain rate. Each curve shown here is averaged over at least 20 individual experiments. (A) Under low effective strain rate, the normalized force-displacement curves obtained with different bead sizes (0.5, 1, and 1.5 µm) are close to each other when the same V/a is maintained (e.g., 1 s−1 and 0.2 s−1). (Inset) Normalized force-displacement curves with different bead sizes are clearly separated when we compare experiments with the same Va in the low-speed regime. (B) Under high effective strain rate, the normalized force-displacement curves with different bead sizes (0.5, 1, and 1.5 µm) are close to each other when the same Va is maintained (e.g., 15 µm2/s and 10 µm2/s). (Inset) Normalized force-displacement curves with different bead sizes are clearly separated when we compare experiments with the same V/a in the high-speed regime.
Fig. S3.
Normalized force-displacement curves measured in the cytoplasm of NRK cells show that the cytoplasm exhibits viscoelasticity under low loading speed and exhibits poroelasticity under high loading speed. Each curve shown here is averaged over at least 20 individual experiments. (A) Under low loading speeds, the normalized force-displacement curves obtained with different bead sizes (0.5 µm, 1 µm, and 1.5 µm) in the cytoplasm are close to each other when the same V/a is maintained (0.5 s−1). (B) Under high moving speeds, the normalized force-displacement curves with different bead sizes (0.5, 1, and 1.5 µm) in the cytoplasm are close to each other when the same Va is maintained (20 µm2/s).
Fig. S4.
The cytoplasm of NRK cells behaves as a viscous fluid when the strain rate is very low (V/a < 0.1 s−1). When we drag a 1.5-μm-diameter bead at the speed of 0.1 μm/s the resistant force roughly remains constant with increasing displacement. Through the Stokes equation, the effective viscosity is 12.1 ± 6.3 Pa·s (n = 15, mean ± SD).
Fig. S5.
Normalized force-displacement curves measured in the cytoplasm of HeLa cells show that the cytoplasm exhibits viscoelasticity under small loading speed and exhibits poroelasticity under large loading speed. Each curve shown here is averaged over at least 20 individual experiments. (A) Under low loading speeds, the normalized force-displacement curves obtained with different bead sizes (0.5 µm and 1 µm) in the cytoplasm are close to each other when the same V/a is maintained (1 s−1). (B) Normalized force-displacement curves with different bead sizes in the cytoplasm are clearly separated when we compare experiments with the same Va in the low-speed regime (e.g., 0.5 µm2/s). (C) Under high moving speeds, the normalized force-displacement curves with different bead sizes (0.5 µm and 1 µm) in the cytoplasm are close to each other when the same Va is maintained (10 µm2/s). (D) Normalized force-displacement curves with different bead sizes in the cytoplasm are clearly separated when we compare experiments with the same V/a in the high-speed regime (e.g., 20 s−1).
We also note that when the probe size becomes comparable to or even smaller than the mesh size of the cytoskeletal network it is not valid anymore to view the cytoplasm as a continuum and use the above scaling analysis to study the mechanical interaction between the bead and the cytoplasm. However, most common cytoplasmic organelles, such as vesicles and mitochondria, are much larger than typical cytoplasmic mesh size and are in fact comparable in size to the beads we use here. Therefore, our measurements here provide direct insights into understanding the mechanical resistance that common organelles experience in living cells.
The cytoplasm of mammalian cells is a porous structure formed by cytoskeletal networks and other proteins, filled with cytosol (15). Our results demonstrate that living mammalian cytoplasm exhibits viscous fluid behavior, viscoelasticity and poroelasticity, respectively, with different combinations of bead size and speed. Under high-enough effective strain rates the characteristic time for moving over one bead diameter is comparable to the time needed for cytosol to migrate around the bead; this leads to the observed rate dependence induced by poroelasticity. However, at low-enough effective strain rates, the resulting slow cytosol motion is accompanied by essentially instantaneous rehomogenization of pore pressure; thus, any residual rate-dependent resistance to bead motion is due to viscoelastic behavior of the cytoskeletal network. Furthermore, when the bead speed is extremely low the cytoplasm behaves as a viscous fluid, since at such very long timescales the cytoskeleton has enough time to depolymerize and reform, and the fully relaxed cytoplasm can thereby undergo viscous flow upon loading. In our experiments, the poroelastic relaxation time of the cytoplasm is about 0.02–0.1 s, estimated from the range of effective strain rates at which poroelasticity is observed (Fig. 3_B_); this is much shorter than the apparent viscoelastic relaxation time, τ = 0.79 ± 0.13 s, measured in the cytoplasm of NRK cells (Fig. S1_B_). τ is obtained through single-term exponential fitting of the relaxation curve measured in the cytoplasm. Although the cytoplasm may have a spectrum of relaxation times (21), our exponential fitting with a single characteristic time agrees reasonably well with the experimental data (Fig. S1_B_); this indicates that even though there is a spectrum of relaxation times it does have a dominating range in timescale which shares the same order of magnitude with the fitted apparent relaxation time τ. During this apparent relaxation time, viscoelastic resistance in the cytoplasm relaxes markedly. For the convenience of discussion but without losing generality we use the apparent relaxation time τ, instead of the time spectrum τ i (i = 1, 2, 3…) in the following discussion on cytoplasmic viscoelasticity. The poroelastic diffusion coefficient of the cytosol, estimated from the experimental timescale, T (= a/V), at which we observe the poroelastic regime, is D = _a_2/T ≈ 50 µm2/s; this is consistent with previous measurements in mammalian cells (15). Our measurements demonstrate that cytoplasmic mechanical properties have different origins at different timescales: viscoelastic and viscous behavior due to relaxation and reorganization of the cytoplasmic structure dominate cytoplasmic mechanics at long timescales, while poroelasticity due to fluid–solid (cytosol–cytoskeleton) frictional interactions and energy dissipation dominate at short timescales.
To investigate the contribution of the cytoskeletal network to the mechanical nature of the cytoplasm we use 5 μg/mL cytochalasin D to depolymerize F-actin structures, a major part of the cytoskeleton, then apply unidirectional stretching. We observe a clear decrease in the characteristic viscoelastic timescale τ and a marked increase of the effective poroelastic diffusivity D in the cytoplasm (Fig. S6), thereby decreasing the poroelastic relaxation time. We note that the poroelastic diffusion coefficient, which describes the effective diffusion of the fluid within a porous medium caused by internal pressure gradients, is different from the usual solute diffusion coefficient which accounts for the collective motion of solutes in response to concentration gradients in the solvent medium. Depolymerizing F-actin causes an increase of the cytoskeletal mesh size and porosity in the cytoplasm, and hence increases the poroelastic diffusivity. The decrease in the viscoelastic timescale is likely to be due to the loss of the friction among F-actin structures and other cytoplasmic components (32), or other actin-associated activities. Thus, disrupting the F-actin network expedites both the cytoplasmic viscoelastic relaxation and the diffusion of cytosol when the cell is deformed. As a result, the critical effective strain rate, V/a, that initiates poroelastic behavior increases. Moreover, the transition effective strain rate from a seemingly viscous fluid behavior to a viscoelastic material also increases.
Fig. S6.
Normalized force-displacement curves measured in the cytoplasm of NRK cells with F-actin depolymerized show a clear decrease of the characteristic viscoelastic timescale, τ, and a marked increase of the effective diffusivity, D, in the cytoplasm. (A) The cytoplasm of NRK cells with F-actin depolymerized behaves as a viscous fluid when the strain rate V/a is ∼0.2 s−1, and the cytoplasm of normal NRK cells behaves as a fluid when V/a < 0.1 s−1. This increase in the transition strain rate from a seemingly viscous fluid behavior to a viscoelastic material is attributed to the decrease of the characteristic viscoelastic timescale, τ. (B) The normalized force-displacement curves obtained with different bead sizes (0.5 µm and 1 µm) in the cytoplasm are close to each other when the same V/a is maintained as 2 s−1; this proves that F-actin polymerized NRK cytoplasm behaves as a viscoelastic material in such a condition. (C and D) Under high loading speeds, the normalized force-displacement curves obtained with different bead sizes (0.5 µm and 1 µm) in the F-actin depolymerized cytoplasm are separated when the same Va is maintained (e.g., 5 µm2/s in C and 10 µm2/s in D), while force-displacement curves with the same speeds and sizes obtained in the cytoplasm of control NRK cells collapse well (Fig. 3_B_ and Fig. S7_A_). This proves that the critical strain rate, V/a, at which we observe poroelasticity to start dominating the mechanical resistance increases because of an increase of the cytoplasmic diffusivity, D. (E and F) Bright-field and fluorescent imaging of NRK cells stained with phalloidine in the control cells (E) and cytochalasin D-treated cells (F) shows that F-actin structure is fully inhibited.
It has also been shown that the biological activity of molecular motors largely affects the mechanical properties of reconstituted cytoskeletal networks (33, 34) and increases cytoplasmic fluidity in bacteria (35). To investigate how such biological activity influences the mechanical behavior of the cytoplasm of mammalian cells we perform force-relaxation tests in HeLa cells with myosin II motors inhibited by blebbistatin treatment or with depletion of ATP. We find that the characteristic relaxation time in the cytoplasm significantly increases from 0.31 ± 0.08 s in normal HeLa cells to 0.50 ± 0.20 s in blebbistatin-treated cells and further increases to 0.73 ± 0.30 s in ATP-depleted cells (Table S1). Both blebbistatin treatment and ATP depletion slow down cytoplasmic reorganization, thus increasing the characteristic viscoelastic relaxation time τ. This observation is consistent with previous results with reconstituted cytoskeletal networks and in bacteria cytoplasm (33, 35). This increase in τ causes a decrease in the transition effective strain rate V/a from a viscous fluid to a viscoelastic gel. These results indicate that both the cytoskeleton and other active cellular components affect the mechanical response of the cytoplasm by influencing cytoplasmic mechanical parameters such as viscoelastic relaxation time and poroelastic diffusivity.
Table S1.
The relaxation time measured in normal, myosin II-inhibited, and ATP-depleted HeLa cells
| Cell conditions | τ, s | SD, s |
|---|---|---|
| Control | 0.31 | 0.08 |
| Myosin II-inhibited | 0.5 | 0.2 |
| ATP-depleted | 0.73 | 0.3 |
To quantitatively characterize the mechanical resistance that an object experiences when moving in the cytoplasm we calculate the rate-dependent apparent modulus of the cytoplasm from the slope of the stress-vs.-strain curve. This rate-dependent modulus can be converted to the storage and loss moduli based on certain rheological models and the Boltzmann superposition principle (32). Although the storage and loss moduli are more often adopted to describe soft materials and complex fluids (3, 36), we adopt this apparent modulus to characterize the mechanical property of the cytoplasm, since it is most relevant to the rate- and size-dependent resistance force that a particle may experience in the cytoplasm. Interestingly, we find that all of the normalized force-displacement curves measured in the cytoplasm are rather linear when the normalized displacement remains relatively small, (i.e., smaller than the radius of the bead). Thus, an apparent elastic modulus, E A, is calculated as the average slope from 0 to 10% strain. Interestingly, we find that the apparent elastic modulus depends on both probe size and loading speed, as shown in Fig. 4_A_. To reveal the dependency of E A on the probe size we project this 3D plot onto 2D axes, E A vs. S. For a small effective strain rate (0.1 s−1 < _V_/_a_ < 2 s−1), _E_ _A_ remains constant for varying probe size because viscoelasticity dominates this regime (Fig. 4_B_). However, for a large effective strain rate (_V_/_a_ > 5 s−1), E A increases with probe size (Fig. 4_B_); this is indeed because poroelasticity starts to contribute to the measurement of the apparent modulus, and it becomes increasingly difficult for the differential pore pressure to be relaxed as the probe size increases.
Fig. 4.
Cytoplasmic modulus under different effective strain rates and probe sizes. (A) Dependence of the apparent cytoplasmic modulus on normalized loading speed and probe size. Each modulus value (black circles) is averaged over at least 20 experiments; the SE bar has a length smaller than the size of the symbols in the plot. The 3D surface is obtained by piecewise linear interpolation of the measured apparent cytoplasmic modulus (E A). The color of the surface represents the value of E A. (B) E A at different loading conditions does not change with the area of the probe bead at low effective strain rate regime, since viscoelasticity is dominating in this regime. However, E A increases with the area of the bead at the high effective strain rate regime, since poroelasticity is dominating in this regime. (C) E A is solely determined by V/a at low effective strain rate regime (0.1 s−1 < _V_/_a_ < 2 s−1); this reinforces that _V_/_a_ is the control parameter of the mechanical resistance at the low effective strain rate regime where viscoelasticity dominates. At the high effective strain rate regime (_V_/_a_ > 5 s−1), E A obtained with different probe size starts to deviate even at the same V/a. Instead, E A has the same value when the same Va is maintained (indicated by the horizontal dashed lines); this reinforces that Va is the control parameter of the resistance at the high effective strain rate regime where poroelasticity dominates. (Inset) The logarithmic plot of the dependence of E A on V/a, which exhibits a seeming power-law behavior with a power of ∼0.25 at the low-speed regime.
Different origins of cytoplasmic elasticity can be further revealed when we plot the apparent cytoplasmic modulus as a function of V/a (Fig. 4_C_). The apparent modulus from all measurements follows exactly the same trend at low effective strain rate regardless of bead size; E A is solely determined by V/a at this regime, confirming that the resistant force is mainly due to viscoelasticity. Interestingly, in this regime the measured dependence of E A on effective strain rate is also consistent with previously observed power-law rheology with a power around 0.2 (3, 7). However, when effective strain rate becomes large, no obvious correlation between the apparent modulus and the number V/a can be seen. Instead, when Va is a constant, we obtain the same modulus, as indicated by the dashed lines in Fig. 4_C_; E A remains the same even if the value of V/a changes by orders of magnitude. In this regime, the rate dependence of the resistant force is mainly contributed by the poroelasticity of the cytoplasm. The transition between these two regimes is around V/a = 3 s−1; both viscoelasticity and poroelasticity contribute at this transition region (Fig. S7). The different dependency of the apparent modulus on V/a and Va in different regimes reinforces the conclusion that viscoelasticity dominates the size-independent (for a fixed effective strain rate, V/a) mechanical behavior under low effective strain rate when the experimental timescale a/V is comparable to the viscoelastic timescale τ, namely Vτ/a ∼ 1, while poroelasticity dominates the size-dependent (for a fixed effective strain rate, V/a) mechanical behavior under high effective strain rate when the experimental timescale is comparable to the poroelastic timescale _a_2/D, namely Va/D ∼ 1.
Fig. S7.
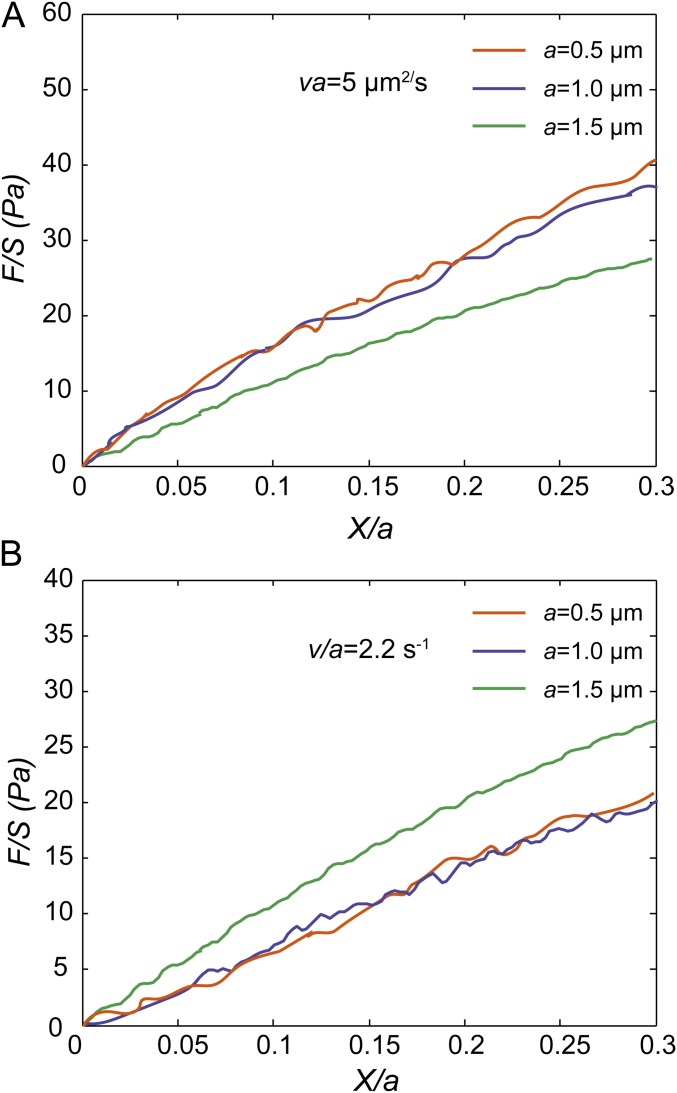
Normalized force-displacement curves measured in the cytoplasm of NRK cells show that the cytoplasm exhibits poro-viscoelasticity when loading speed V = 3.5 μm/s and loading size a = 1.5 μm. Each curve shown here is averaged over at least 20 individual experiments. (A and B) Under intermediate loading speeds, the normalized force-displacement curves obtained with 0.5-µm beads and 1-µm beads in the cytoplasm are close to each other when the same Va (5 µm2/s) or the same V/a (2.2 s−1) is maintained; however, the curves obtained with 0.5-µm beads and 1-µm beads are clearly separated with the curves obtained with 1.5-µm beads at a speed of 3.3 μm/s, when the same Va (5 µm2/s) or V/a (2.2 s−1) is maintained. This proves that the cytoplasm can exhibit both poroelasticity and viscoelasticity under large loading size and intermediate loading speed.
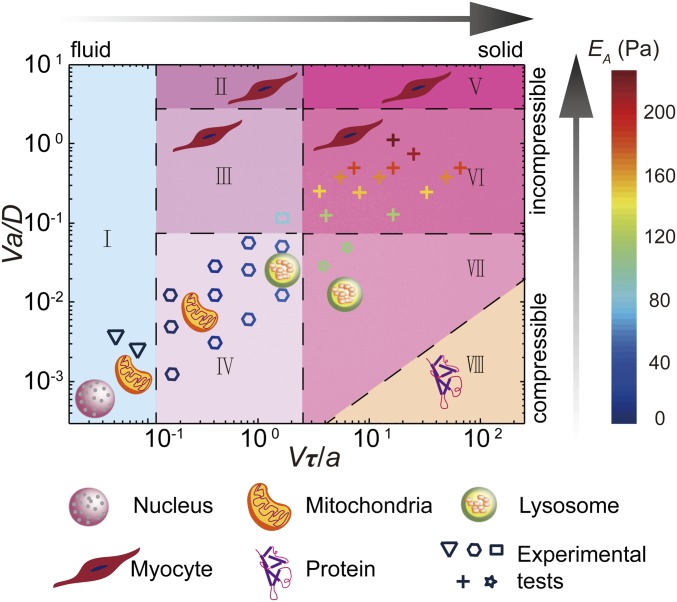
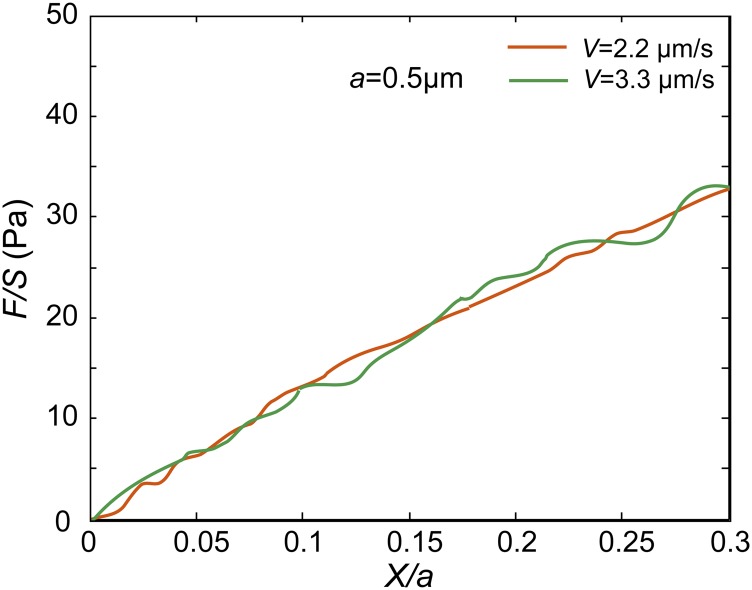
Finally, we summarize different cytoplasmic mechanical behaviors in a state diagram as a function of two dimensionless parameters, Vτ/a and Va/D (Fig. 5). Under different loading conditions, the mechanical response of the cytoplasm can be divided into eight types, corresponding to eight sections on the state diagram. When Vτ/a << 1 (section I), the cytoplasm behaves as a viscous fluid. As _Vτ_/_a_ ∼ 1 (sections II–IV), viscoelasticity contributes to the rate-dependent mechanical properties of cells. When _Vτ_/_a_ >> 1 (sections V–VII), the cytoplasm behaves as an unrelaxed elastic material; when the experimental timescale is much shorter than the viscoelastic relaxation time, the cytoskeleton is not able to reorganize, slide or fracture, and thus no viscoelastic dissipation can occur. Likewise, when Va/D << 1 (sections IV and VII), the cytoplasm is highly compressible, because when the experimental timescale is much longer than the poroelastic relaxation time the infiltrated fluid in cells migrates around freely, which corresponds to significant volumetric changes. In this case, the apparent bulk modulus equals the bulk modulus of solid part of the cytoplasm, which can be characterized as highly compressible. As _Va_/_D_ ∼ 1 (sections III and VI), poroelasticity contributes to the size-dependent mechanical properties of the cytoplasm. When _Va_/_D_ >> 1 (sections II and V), the experimental condition requires large loading size and high loading speed, which cannot be achieved with optical tweezers in the cytoplasm. However, based on our experimental results in other regions of the state diagram and theoretical analysis in the framework of poroelasticity, it is clear that the loading timescale is too short compared with the poroelastic relaxation time in these two regions, and thus the intracellular fluid is trapped in the porous cytoskeleton; in this condition, there are no volumetric changes and thus it can be characterized as incompressible, with a bulk modulus significantly larger than its shear modulus. Interestingly, the cytoplasm also exhibits a pure elastic behavior when the dimensionless parameter V/a is very large, and Va is either very large (section V) or small (section VII). In these two regimes further change in the bead diameter and speed does not alter the resultant normalized force-displacement curve, as shown in Fig. S8, indicating a size- and rate-independent elastic behavior. We also note that in section VIII the probe is equal to or smaller than the typical cytoskeletal mesh size [∼50 nm (19)], and thus a continuum mechanics model does not apply here.
Fig. 5.
The state diagram of living mammalian cytoplasm as a function of two dimensionless numbers, Vτ/a and Va/D. The state diagram shows that as dimensionless number Vτ/a increases from 10−2 to 102 the cytoplasm changes from a viscous fluid to a solid; as dimensionless number Va/D increases from 10−3 to 101 the cytoplasm changes from a compressible material to an incompressible material. Each data point represents an experimental test with that particular speed and size combination. Different symbol shapes of the data points represent different origins of the mechanical resistance, and the color of the symbol represents the value of the measured apparent modulus. Based on our experiments at different loading speeds and probe sizes, combined with our scaling analysis, the origins of mechanical resistance in the cytoplasm can be divided into eight regions of the sate diagram: I, Viscous fluid; the resistance remains a constant as displacement increases (Fig. S4). II, Incompressible viscoelasticity. III, Poroviscoelasticity, where both viscoelasticity and poroelasticity are important (Fig. S7). IV, Compressible viscoelasticity. V, Incompressible pure elasticity; both viscoelasticity and poroelasticity do not relax in this region, and thus the cytoplasmic modulus always remains constant. VI, Poroelasticity. VII, Compressible pure elasticity (Fig. S8); poroelasticity relaxes completely while viscoelasticity does not relax at all in this region. VIII, Continuous mechanics fails when the object is equal or smaller than cytoskeletal mesh size (∼50 nm). Moreover, we mark a variety of physiological intracellular transport and cellular movement phenomena on the state diagram, to illustrate different origins of the mechanical resistance each of these processes experiences. The characteristic size and speed of these phenomena are taken from literature (details in Table S2). The dashed lines in the state diagram are transitional boundaries of different regions; the location of these dashed lines is determined by experimental results and theoretical analysis.
Fig. S8.
Normalized force-displacement curves measured in the cytoplasm of NRK cells show that the cytoplasm exhibits pure elasticity under high strain rate (Vτ/a >> 1) and small loading size (Va/D << 1). Each curve shown here is averaged over at least 20 individual experiments. Under high strain rates V/a (e.g., 4.4 s−1 and 6.6 s−1) and small loading sizes a (e.g., 0.5 μm), the normalized force-displacement curves obtained in the cytoplasm are close to each other with varied Va and V/a. In this poro-viscoelastic region, cytoplasmic mechanical behavior is independent with both speed and size.
This state diagram illustrates different characteristics and origins of cytoplasmic mechanics upon varying characteristic size and speed. Based on this diagram we can distinguish the origin of mechanical resistance that a variety of physiological processes experience in mammalian cytoplasm. There are many different organelles that are constantly moving in the cytoplasm; the mechanical nature of the resistance that each of them typically experiences also depends on their sizes and speeds. Using typical organelle size and speed reported previously in the literature (details in Table S2), we calculate the values of the two dimensionless numbers for movement of cell nucleus, mitochondria, and lysosome, as well as contraction of myocyte; the values of these two dimensionless numbers determine the specific region that each process typically locates on the state diagram (Fig. 5). This result reveals the underlying origins of the mechanical resistance of different cellular processes over a broad range of speed and size scales.
Table S2.
The estimated locations of different physiological processes on the state diagram
| Name | V, μm/s | a, μm | Vτ/a | Va/D | Locations |
|---|---|---|---|---|---|
| Cell nucleus | 3 × 10⁻³ ∼ 6 ×10⁻³ (39) | ∼8 (39) | 3 × 10⁻⁴ ∼ 6 × 10⁻⁴ | 6 × 10⁻⁴ ∼ 1 × 10⁻³ | I |
| Mitochondria | 0.1 ∼ 1.8 (40) | 1.5 (40) | 0.05 ∼ 0.96 | 3.8 × 10⁻³ ∼ 0.06 | I, IV |
| Lysosome | 0.3 ∼ 2 (40, 41) | 0.3 ∼ 1 (40) | 0.24 ∼ 5.3 | 2.3 × 10⁻³ ∼ 0.05 | IV, VII |
| Myocyte | 5 ∼ 600 (42) | 10 ∼ 25 (43) | 0.15 ∼ 48 | 1.3 ∼ 375 | II–VI |
Conclusion
By combining unidirectional force-displacement measurement in living mammalian cytoplasm using optical tweezers and simple scaling analysis we present a method to distinguish different origins of cytoplasmic mechanical resistance upon intracellular transport. Using this method, we reveal that the cytoplasmic mechanical resistance can originate from the effect of either viscosity, viscoelasticity, poroelasticity, or pure elasticity depending on the speed and size of the object. As a result, the mechanical resistance and the apparent cytoplasmic modulus depend on both the speed and size of the probe and, more interestingly, in different fashions while different mechanisms dominate the apparent cytoplasmic mechanical properties. Furthermore, we summarize different cytoplasmic mechanical behaviors into a state diagram as a function of two dimensionless parameters; this state diagram shows that living mammalian cytoplasm changes from a viscous fluid to an elastic solid as one dimensionless parameter, Vτ/a, increases, and from a compressible material to an incompressible material as another dimensionless parameter, Va/D, increases. Both the cytoskeleton and bioactive cellular motors can directly regulate the viscoelastic relaxation time τ as well as the poroelastic diffusivity D and, therefore, they can both affect the transition between different mechanical states. Our cytoplasmic state diagram provides insights into understanding the underlying mechanical nature of a variety of intracellular transport and other cellular processes, over a broad range of speed and size scales. This state diagram can also be extended to characterize the mechanical behavior of other soft materials with both viscoelastic and poroelastic nature.
Materials and Methods
Full materials and methods are described in SI Materials and Methods. Briefly, to investigate the mechanical resistance that intracellular objects experience within a living mammalian cytoplasm, we deliver micrometer-sized polystyrene beads into living NRK or HeLa cells through endocytosis. These beads, with sizes ranging from 0.5 µm to 1.5 µm, distribute randomly inside the cell. To obtain the force-displacement curve in the cytoplasm we use optical tweezers to trap and pull a bead unidirectionally with a constant speed toward the cell boundary. The trap stiffness is 0.05 pN/nm as determined using the traditional power spectrum method with the same type of beads in a 41% sucrose solution having a refractive index matched with that of the cell (37). To avoid any interactions with the mechanically distinct cell cortex and nucleus we only use beads that are positioned greater than 1.5 µm away from the cell boundary, and away from both the thin lamellar region and the nucleus.
SI Materials and Methods
Cell Culture, Pharmacological Interventions, and Immunofluorescence.
Cells are maintained under 5% CO2 at 37 °C in a humidified incubator. The NRK and HeLa cells are cultured in DMEM with 10% FBS, 100 μg/mL penicillin, and 100 μg/mL streptomycin. Before experiments, cells are passaged onto glass-bottom MatTek dishes coated with 0.1 mg/mL collagen-I and are allowed to grow at least 8 h before experiments are conducted. Fluorescent carboxylate-modified polystyrene spherical particles (0.5, 1, and 1.5 μm, from Molecular Probes) are delivered into living NRK cells and HeLa cells through endocytosis; the number of beads is controlled to be less than 10 in each cell to avoid impacting cell behavior.
To depolymerize F-actin structures in cells, cytochalasin D (Sigma) is added to cell culture medium at a 5 μg/mL final concentration, incubating for 1 h. Cells then change morphology markedly (Fig. S6). To further confirm that actin structure is inhibited, 3.7% formaldehyde is used to fix cells. The fixed cells are immunostained with Alexa 488-conjugated phalloidin (1:200 diluted in PBS; Sigma) and are then imaged with confocal microscopy (Leica TCS SP8) equipped with a water immersion objective (63×, 1.2 N.A.).
To inhibit myosin II in cytoplasm, blebbistatin (Toronto Research Chemicals), a specific inhibitor of myosin II activity, is dissolved in DMSO and added to cell media to a 10 mM concentration for 30 min. To inhibit the general motor activity, ATP is depleted by treating cells with 2 mM NaN3 and 10 mM deoxyglucose in PBS for 1 h.
Optical Tweezers Setup and Calibration.
To optically trap and manipulate micrometer-sized beads in the cytoplasm of living cells the beam from a variable-power solid-state laser (5 W, 1,064 nm) is steered through a series of Keplerian beam expanders to overfill the back aperture of a 100× 1.3 N.A. trapping objective (Leica). For detection, the bead is centered on a high-resolution position detection quadrant detector (Thorlabs). The linear region of the detector is calibrated by trapping a bead identical to those used in the cells in a 41% sucrose solution that is refractive index-matched with the cell (37) and moving it across the detector using an acousto-optic deflectors in known step sizes; the trap stiffness is determined as 0.05 pN/nm. Bead displacement is maintained in the linear region. The trap stiffness is calibrated as 0.05 pN/nm through the equipartition principle (38). A trapped bead is dragged across a speed range of 0.1–40 μm/s using a high-resolution XYZ piezo stage on a fluorescent microscope equipped with a 100× 1.3 N.A. lens (Leica).
Details on Cytoplasmic State Diagram.
We present a state diagram of living mammalian cytoplasm as a function of two dimensionless numbers, Vτ/a and Va/D, as shown in Fig. 5. In the main text we have illustrated the viscous fluid region (I), the compressible viscoelastic region (IV), and the poroelastic region (VI). Here, we want to provide more details and understanding of several other regions on the state diagram. When both the viscoelastic control parameter Vτ/a and the poroelastic control parameter Va/D are around 1 (region III on the state diagram), both poroelasticity and viscoelasticity contribute to the mechanical resistance when dragging a bead in the cytoplasm. The square symbol on the state diagram in region III represents an experimental measurement in this poro-viscoelastic region, as shown by the green curves in Fig. S7. No matter whether we maintain the same value of Va/D (Fig. S7_A_) or the same value of Vτ/a (Fig. S7_B_), the green curve is always separate from other curves; this indicates that the mechanical resistance is not solely dominated by either viscoelasticity or poroelasticity in this region, and thus it is poro-viscoelastic. When Vτ/a >> 1 and Va/D << 1 (region VII), the poroelastic resistance in the cytoplasm is completely relaxed, while the relaxation of viscoelastic resistance does not start yet. As a result, the mechanical resistance in the cytoplasm does not exhibit any rate dependency in this region, and thus reflects the pure elasticity of the cytoplasmic material. Indeed, in this region the normalized force-displacement curves (Fig. S8) all collapse well independently of the choice of V and a, which is the typical mechanical behavior of pure elastic materials. In this region, the infiltrated fluid in cells migrates around freely so that the apparent bulk modulus equals the bulk modulus of the solid part of the cytoplasm. Because of this, the cytoplasm is highly compressible in region VII, and the origins of the mechanical resistance can be classified as compressible pure elasticity. Because they are limited to cellular dimension and tweezer-trap velocity, we did not obtain experimental data locating in region II and region V of the state diagram. However, based on our theoretical analysis in the frame of poroelasticity and experimental results in other regions it is clear that the cytoplasm should exhibit incompressible viscoelasticity in region II and incompressible pure elasticity in region V. In these two regions the infiltrated fluid in the cytoplasm does not have time to move around to homogenize the pore pressure, and thus poroelastic relaxation does not happen; the cytoplasm is considered as incompressible with the apparent bulk modulus much greater than the shear modulus.
Supplementary Material
Supplementary File
Acknowledgments
This work was supported by the Department of Mechanical Engineering at the Massachusetts Institute of Technology (M.G.) and the Hellman Fellows Fund (S.C.).
Footnotes
The authors declare no conflict of interest.
This article is a PNAS Direct Submission.
References
- 1.Alberts B, et al. Molecular Biology of the Cell. 5th Ed. Garland Science; New York: 2008. pp. 965–1052. [Google Scholar]
- 2.Hendricks AG, Holzbaur ELF, Goldman YE. Force measurements on cargoes in living cells reveal collective dynamics of microtubule motors. Proc Natl Acad Sci USA. 2012;109:18447–18452. doi: 10.1073/pnas.1215462109. [DOI] [PMC free article] [PubMed] [Google Scholar]
- 3.Guo M, et al. Probing the stochastic, motor-driven properties of the cytoplasm using force spectrum microscopy. Cell. 2014;158:822–832. doi: 10.1016/j.cell.2014.06.051. [DOI] [PMC free article] [PubMed] [Google Scholar]
- 4.Larson RG. The Structure and Rheology of Complex Fluids. Oxford Univ Press; New York: 1999. [Google Scholar]
- 5.Hoffman BD, Crocker JC. Cell mechanics: Dissecting the physical responses of cells to force. Annu Rev Biomed Eng. 2009;11:259–288. doi: 10.1146/annurev.bioeng.10.061807.160511. [DOI] [PubMed] [Google Scholar]
- 6.Zhu C, Bao G, Wang N. Cell mechanics: Mechanical response, cell adhesion, and molecular deformation. Annu Rev Biomed Eng. 2000;2:189–226. doi: 10.1146/annurev.bioeng.2.1.189. [DOI] [PubMed] [Google Scholar]
- 7.Fabry B, et al. Scaling the microrheology of living cells. Phys Rev Lett. 2001;87:148102. doi: 10.1103/PhysRevLett.87.148102. [DOI] [PubMed] [Google Scholar]
- 8.Hoffman BD, Massiera G, Van Citters KM, Crocker JC. The consensus mechanics of cultured mammalian cells. Proc Natl Acad Sci USA. 2006;103:10259–10264. doi: 10.1073/pnas.0510348103. [DOI] [PMC free article] [PubMed] [Google Scholar]
- 9.Janmey PA, Winer JP, Murray ME, Wen Q. The hard life of soft cells. Cell Motil Cytoskeleton. 2009;66:597–605. doi: 10.1002/cm.20382. [DOI] [PMC free article] [PubMed] [Google Scholar]
- 10.Bausch AR, Möller W, Sackmann E. Measurement of local viscoelasticity and forces in living cells by magnetic tweezers. Biophys J. 1999;76:573–579. doi: 10.1016/S0006-3495(99)77225-5. [DOI] [PMC free article] [PubMed] [Google Scholar]
- 11.Guck J, et al. The optical stretcher: A novel laser tool to micromanipulate cells. Biophys J. 2001;81:767–784. doi: 10.1016/S0006-3495(01)75740-2. [DOI] [PMC free article] [PubMed] [Google Scholar]
- 12.Lu Y-B, et al. Viscoelastic properties of individual glial cells and neurons in the CNS. Proc Natl Acad Sci USA. 2006;103:17759–17764. doi: 10.1073/pnas.0606150103. [DOI] [PMC free article] [PubMed] [Google Scholar]
- 13.Nawaz S, et al. Cell visco-elasticity measured with AFM and optical trapping at sub-micrometer deformations. PLoS One. 2012;7:e45297. doi: 10.1371/journal.pone.0045297. [DOI] [PMC free article] [PubMed] [Google Scholar]
- 14.Hu Y, Suo Z. Viscoelasticity and poroelasticity in elastomeric gels. Guti Lixue Xuebao. 2012;25:441–458. [Google Scholar]
- 15.Moeendarbary E, et al. The cytoplasm of living cells behaves as a poroelastic material. Nat Mater. 2013;12:253–261. doi: 10.1038/nmat3517. [DOI] [PMC free article] [PubMed] [Google Scholar]
- 16.Rosenbluth MJ, Crow A, Shaevitz JW, Fletcher DA. Slow stress propagation in adherent cells. Biophys J. 2008;95:6052–6059. doi: 10.1529/biophysj.108.139139. [DOI] [PMC free article] [PubMed] [Google Scholar]
- 17.Charras GT, Yarrow JC, Horton MA, Mahadevan L, Mitchison TJ. Non-equilibration of hydrostatic pressure in blebbing cells. Nature. 2005;435:365–369. doi: 10.1038/nature03550. [DOI] [PMC free article] [PubMed] [Google Scholar]
- 18.Guo M, et al. The role of vimentin intermediate filaments in cortical and cytoplasmic mechanics. Biophys J. 2013;105:1562–1568. doi: 10.1016/j.bpj.2013.08.037. [DOI] [PMC free article] [PubMed] [Google Scholar]
- 19.Luby-Phelps K. Cytoarchitecture and physical properties of cytoplasm: Volume, viscosity, diffusion, intracellular surface area. Int Rev Cytol. 2000;192:189–221. doi: 10.1016/s0074-7696(08)60527-6. [DOI] [PubMed] [Google Scholar]
- 20.Kumar S, et al. Viscoelastic retraction of single living stress fibers and its impact on cell shape, cytoskeletal organization, and extracellular matrix mechanics. Biophys J. 2006;90:3762–3773. doi: 10.1529/biophysj.105.071506. [DOI] [PMC free article] [PubMed] [Google Scholar]
- 21.Balland M, et al. Power laws in microrheology experiments on living cells: Comparative analysis and modeling. Phys Rev E Stat Nonlin Soft Matter Phys. 2006;74:021911. doi: 10.1103/PhysRevE.74.021911. [DOI] [PubMed] [Google Scholar]
- 22.Wang Q-M, Mohan AC, Oyen ML, Zhao X-H. Separating viscoelasticity and poroelasticity of gels with different length and time scales. Lixue Xuebao. 2014;30:20–27. [Google Scholar]
- 23.Detournay E, Cheng AH-D. 2014. Fundamentals of poroelasticity. Comprehensive Rock Engineering: Principles, Practice & Projects. Comprehensive Rock Engineering, ed Fairhurst C (Pergamon, New York), pp 113–172.
- 24.Reiner M. The Deborah number. Phys Today. 1964;17:62. [Google Scholar]
- 25.Lourenço T, et al. Modulation of oligodendrocyte differentiation and maturation by combined biochemical and mechanical cues. Sci Rep. 2016;6:21563. doi: 10.1038/srep21563. [DOI] [PMC free article] [PubMed] [Google Scholar]
- 26.Hu Y, Zhao X, Vlassak JJ, Suo Z. Using indentation to characterize the poroelasticity of gels. Appl Phys Lett. 2010;96:121904. [Google Scholar]
- 27.Selvadurai APS. Indentation of a spherical cavity in an elastic body by a rigid spherical inclusion: Influence of non-classical interface conditions. Contin Mech Thermodyn. 2016;28:617–632. [Google Scholar]
- 28.Takigawa T, Morino Y, Urayama K, Masuda T. Poisson’s ratio of polyacrylamide (PAAm) gels. Polym Gels Netw. 1996;4:1–5. [Google Scholar]
- 29.Mitchell J, Blanshard J. Rheological properties of alginate gels. J Texture Stud. 1976;7:219–234. [Google Scholar]
- 30.Park S, Schapery R. Methods of interconversion between linear viscoelastic material functions. Part I—A numerical method based on Prony series. Int J Solids Struct. 1999;36:1653–1675. [Google Scholar]
- 31.Berret JF. Local viscoelasticity of living cells measured by rotational magnetic spectroscopy. Nat Commun. 2016;7:10134. doi: 10.1038/ncomms10134. [DOI] [PMC free article] [PubMed] [Google Scholar]
- 32.Ferry JD. Viscoelastic Properties of Polymers. Wiley; New York: 1980. [Google Scholar]
- 33.Humphrey D, Duggan C, Saha D, Smith D, Käs J. Active fluidization of polymer networks through molecular motors. Nature. 2002;416:413–416. doi: 10.1038/416413a. [DOI] [PubMed] [Google Scholar]
- 34.Koenderink GH, et al. An active biopolymer network controlled by molecular motors. Proc Natl Acad Sci USA. 2009;106:15192–15197. doi: 10.1073/pnas.0903974106. [DOI] [PMC free article] [PubMed] [Google Scholar]
- 35.Parry BR, et al. The bacterial cytoplasm has glass-like properties and is fluidized by metabolic activity. Cell. 2014;156:183–194. doi: 10.1016/j.cell.2013.11.028. [DOI] [PMC free article] [PubMed] [Google Scholar]
- 36.Shuck L, Advani S. Rheologioal response of human brain tissue in shear. J Basic Eng. 1972;94:905–911. [Google Scholar]
- 37.Jun Y, Tripathy SK, Narayanareddy BR, Mattson-Hoss MK, Gross SP. Calibration of optical tweezers for in vivo force measurements: How do different approaches compare? Biophys J. 2014;107:1474–1484. doi: 10.1016/j.bpj.2014.07.033. [DOI] [PMC free article] [PubMed] [Google Scholar]
- 38.Veigel C, Bartoo ML, White DC, Sparrow JC, Molloy JE. The stiffness of rabbit skeletal actomyosin cross-bridges determined with an optical tweezers transducer. Biophys J. 1998;75:1424–1438. doi: 10.1016/S0006-3495(98)74061-5. [DOI] [PMC free article] [PubMed] [Google Scholar]
- 39.Gomes ER, Jani S, Gundersen GG. Nuclear movement regulated by Cdc42, MRCK, myosin, and actin flow establishes MTOC polarization in migrating cells. Cell. 2005;121:451–463. doi: 10.1016/j.cell.2005.02.022. [DOI] [PubMed] [Google Scholar]
- 40.Trinczek B, Ebneth A, Mandelkow EM, Mandelkow E. Tau regulates the attachment/detachment but not the speed of motors in microtubule-dependent transport of single vesicles and organelles. J Cell Sci. 1999;112:2355–2367. doi: 10.1242/jcs.112.14.2355. [DOI] [PubMed] [Google Scholar]
- 41.Wang B, Kuo J, Granick S. Bursts of active transport in living cells. Phys Rev Lett. 2013;111:208102. doi: 10.1103/PhysRevLett.111.208102. [DOI] [PubMed] [Google Scholar]
- 42.Göktepe S, Abilez OJ, Parker KK, Kuhl E. A multiscale model for eccentric and concentric cardiac growth through sarcomerogenesis. J Theor Biol. 2010;265:433–442. doi: 10.1016/j.jtbi.2010.04.023. [DOI] [PubMed] [Google Scholar]
- 43.Bárány M. ATPase activity of myosin correlated with speed of muscle shortening. J Gen Physiol. 1967;50:197–218. doi: 10.1085/jgp.50.6.197. [DOI] [PMC free article] [PubMed] [Google Scholar]
Associated Data
This section collects any data citations, data availability statements, or supplementary materials included in this article.
Supplementary Materials
Supplementary File
