m6A level and isoform characterization sequencing (m6A-LAIC-seq) reveals the census and complexity of the m6A epitranscriptome (original) (raw)
. Author manuscript; available in PMC: 2017 Nov 28.
Published in final edited form as: Nat Methods. 2016 Jul 4;13(8):692–698. doi: 10.1038/nmeth.3898
Abstract
_N_6-Methyladenosine (m6A) is a widespread, reversible chemical modification of RNA molecules, implicated in many aspects of RNA metabolism. Little quantitative information exists as to either how many transcript copies of particular genes are m6A modified (‘m6A levels’) or the relationship of m6A modification(s) to alternative RNA isoforms. To deconvolute the m6A epitranscriptome, we developed m6A-level and isoform-characterization sequencing (m6A-LAIC-seq). We found that cells exhibit a broad range of nonstoichiometric m6A levels with cell-type specificity. At the level of isoform characterization, we discovered widespread differences in the use of tandem alternative polyadenylation (APA) sites by methylated and nonmethylated transcript isoforms of individual genes. Strikingly, there is a strong bias for methylated transcripts to be coupled with proximal APA sites, resulting in shortened 3′ untranslated regions, while nonmethylated transcript isoforms tend to use distal APA sites. m6A-LAIC-seq yields a new perspective on transcriptome complexity and links APA usage to m6A modifications.
Introduction
m6A is the most abundant known internal chemical modification of mRNAs and long noncoding RNAs (lncRNAs)1, 2, 3, 4, 5, 6. m6A has been implicated in all forms of RNA metabolism2, 3, 4, 7, 8, 9, 10, 11. The ‘writing’ of m6A RNA modification is accomplished via the m6A methyltransferases METTL3 and METTL14 (refs. 7,12, 13,14,15). Furthermore, m6A modification is reversible or ‘erased’ by the FTO and ALKBH5 m6A demethylases and ‘read’ by the m6A-binding family of YTH-domain RNA-binding proteins (RBPs), which promote degradation and translational regulation of m6A-modified transcripts8, 9, 10, 11, 16, 17. Recent findings that METTL3 is required for efficient embryonic-stem-cell differentiation highlight the functional importance of m6A modification18, 19.
Although transcriptome-wide m6A location analysis by m6A-seq (or MeRIP-seq) has led to significant insights, methods to quantify the ratio of methylated to nonmethylated transcripts (defined here as m6A level) on a transcriptome-wide scale have been lacking3, 15, 20, 21. The proportion of transcripts methylated per gene has been measured directly for only a handful of genes, and in those instances m6A levels were found to be nonstoichiometric (i.e., fewer than 100% of transcript copies were methylated)22, 23. Genome-wide quantitative measurements of m6A levels are critical to understanding the proportion of m6A-modified versus unmodified transcripts for each gene to assess the magnitude of potential m6A regulatory impact. Here, we report a new method, m6A-LAIC-seq, which quantitatively deconvolutes methylated versus nonmethylated transcripts. Unlike m6A-seq, our protocol does not fragment the RNA before anti-m6A RNA immunoprecipitation (RIP); instead relying on sequencing intact full-length transcripts in both m6A-positive and m6A-negative fractions post-RIP. While allowing quantification of m6A levels, the isolation and sequencing of intact full-length RNAs also allowed us to examine differential isoform usage in methylated and nonmethylated transcripts of each gene.
Results
In developing m6A-LAIC-seq (Fig. 1a), we conducted initial experiments to establish the saturation curve, sensitivity, and specificity for anti-m6A RIP of full-length transcripts. The anti-m6A antibody became saturated at 500 ng of RNA per 1 μg of antibody (500 ng μg−1) under our anti-m6A RIP conditions, which used _in vitro_–synthesized GAPDH transcripts containing 100% m6A-modified adenosines (Fig. 1b). We started m6A-LAIC-seq with 2 μg of 2× polyadenylated (poly(A)+) RNA, using an anti-m6A antibody at 500 ng μg−1. We employed a vast excess of antibody, as a second round of anti-m6A RIP on the m6A-negative fraction recovered no further RNA (Supplementary Fig. 1a–c). We also found that anti-m6A RIP efficiency was independent of the number of modifications per transcript (Supplementary Fig. 1d,e). To examine the sensitivity of the anti-m6A antibody in vitro, we performed anti-m6A RIP experiments using _in vitro_–synthesized GAPDH with, on average, two random m6A modifications per transcript as well as unmodified GAPDH transcripts, both of which were radiolabeled with CTP32. We then mixed the unmodified and m6A-modified GAPDH transcripts at varying percentages. We detected as few as one m6A-modified transcript mixed with 1,000 unmodified transcripts, which suggested a very high sensitivity of the anti-m6A RIP (Fig. 1c).
Figure 1.
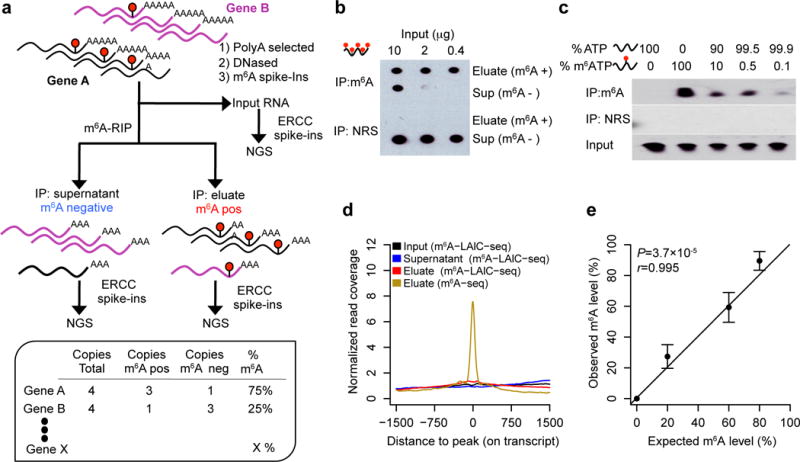
Next, we added various spike-in controls to our starting input poly(A)+ RNA to evaluate the specificity, sensitivity, and quantitation of the actual m6A-LAIC-seq protocol (Fig. 1a). As intended, our protocol sequenced intact full-length RNAs with no local enrichment of m6A sites (Fig. 1d). Furthermore, no reads were detected of the three nonmethylated RNA transcript spike ins in the eluate (m6A-positive fraction), but they were readily detected in the supernatant (m6A-negative fraction), confirming the high specificity. We quantified m6A levels per gene by the ratio of RNA abundances, (eluate)/(eluate + supernatant). RNA abundances were represented by the RNA-seq fragment counts normalized across input, eluate, and supernatant using the 96 synthetic ERCC control RNAs equally spiked in just before library construction (see Online Methods). To assess m6A-LAIC-seq’s ability to quantify m6A levels or stoichiometry, we mixed a series of nonmammalian m6A-modified RNAs generated in vitro, each with one or two modifications, with an unmodified counterpart at ratios ranging from 0–80%. Quantitative agreement between the known stoichiometry and its m6A-LAIC-seq quantification was excellent (Pearson r = 0.995; P = 3.7 × 10⁻⁵; Fig. 1e).
m6A-LAIC-seq reveals the transcriptome-wide patterns of m6A levels in H1-ESC
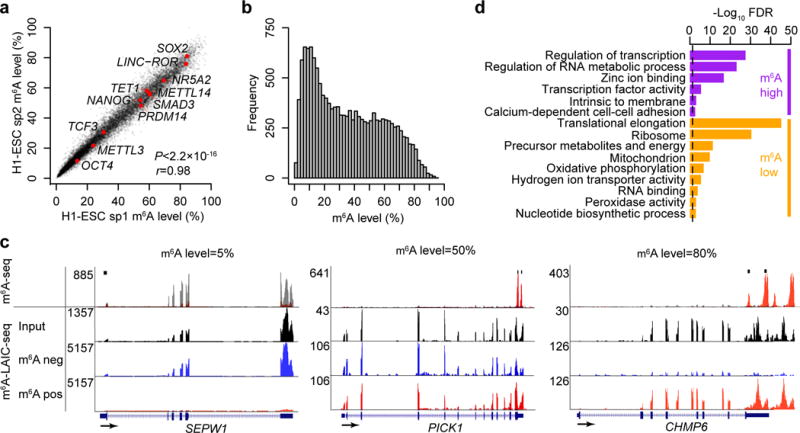
We recently characterized the m6A-seq profile of the hESC line H1-ESC18. Here we applied m6A-LAIC-seq to further characterize its m6A epitranscriptome. On a transcriptome-wide scale, we observed a strong concordance of m6A levels in two biological replicates (r = 0.98, P < 2.2 × 10⁻¹⁶; Fig. 2a), with m6A levels following an almost bimodal distribution whereby most genes exhibited less than 50% methylation levels (Fig. 2b). The analysis of the relationship between the number of m6A peaks and m6A levels revealed that the more peaks present, the higher the m6A levels (Supplementary Fig. 2a). Since m6A RIP efficiency is independent of the number of m6A sites and peaks (see above paragraph; Supplementary Fig. 1d,e), the increase in m6A levels with number of peaks is consistent with at least some m6A modifications occurring at different sites on separate transcripts, as opposed to all occurring in cis on the same transcripts. Notably, m6A-seq-derived peak intensities correlated only modestly with m6A levels (r = 0.6) (Supplementary Fig. 2b,c). Importantly, m6A levels as measured by qRT-PCR correlated strongly with m6A-LAIC-seq data (r = 0.96; P < 2.2 × 10⁻¹⁶, Supplementary Fig. 2d), crossvalidating the m6A-LAIC-seq approach. Figure 2c and Supplementary Figure 2e show examples of m6A-LAIC-seq profiles of genes with various m6A levels. Our results offer a quantitative road map as to which genes are most (SOX2 and LINC-ROR) or least (POU5F1 and TCF3) likely to be influenced by m6A-dependent regulatory networks (Supplementary Table 1).
Figure 2.
m6A-level-linked biological processes and protein domains
To understand potential links between biological pathways and m6A levels, we analyzed Gene Ontology (GO) terms. The 1,000 most highly methylated genes based on m6A levels were enriched in terms such as regulation of transcription (false discovery rate (FDR) = 2.9 × 10⁻²⁸) and regulation of RNA metabolic process (FDR = 7.5 × 10⁻²⁴) (Fig. 2d). This was consistent with the observation that high m6A levels were enriched in transcription factor (TF) domains, the strongest being TFs containing the repressive KRAB domain (FDR = 8.3 × 10⁻³⁵; n = 92) and the ZNF-C2H2-type domain (FDR = 4.0 × 10−36; n = 143). Conversely, the 1,000 genes with the lowest methylation levels were enriched in processes such as translational elongation (FDR = 5.7 × 10−46) and generation of precursors of metabolites and energy (FDR = 4.2 × 10⁻¹²). These results provided evidence that transcriptional regulators, especially transcriptional repressors, are likely the most susceptible to m6A regulation.
m6A levels are inversely correlated with steady-state RNA levels and half life
As m6A is implicated in promoting RNA degradation8, 18, 19, we asked how m6A levels were related to RNA steady-state expression levels and half-life measurements8, 18, 19. We found an inverse correlation between m6A levels and steady-state expression levels (r = −0.39; P < 2.2 × 10⁻¹⁶; Supplementary Fig. 2f). An inverse correlation was also identified between m6A levels in human embryonic stem cells (hESCs) and half-life measurements in induced pluripotent stem cells (iPSCs) (r = −0.14; P < 2.2 × 10⁻¹⁶; Supplementary Fig. 2g)24. Furthermore, long intergenic noncoding RNAs (lincRNAs) had significantly higher m6A levels than mRNAs or pseudogenes (P = 3.0 × 10⁻¹⁶; two-sided Wilcoxon test; Supplementary Fig. 2h and Supplementary Table 2).
m6A-LAIC-seq reveals the extent of differential m6A levels between cell types
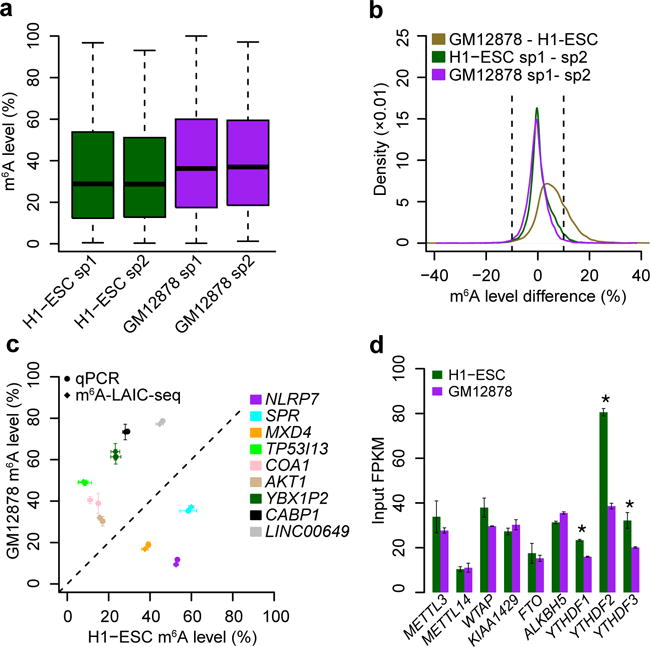
To examine variation of m6A levels among cell types, we performed m6A-LAIC-seq on the B-cell lymphoblastoid cell line GM12878, which also exhibited highly correlated m6A levels in replicates (Supplementary Fig. 2i). GM12878 cells also followed a non-Gaussian bimodal m6A-level distribution, but exhibited higher methylation levels than H1-ESC (P < 2.2 × 10⁻¹⁶; two-sided Wilcoxon test; Fig. 3a and Supplementary Fig. 2j). We found that 1,509 genes exhibited a reproducible variation in m6A levels of at least ±10% between cell types, but almost none showed variation larger than ±20%. Furthermore, such genes were found to largely exhibit a unidirectional increase in m6A levels in GM12878 as compared to H1-ESC (ratio, 1,465:44) (Fig. 3b). qRT-PCR analyses of genes with differential m6A levels between cell types showed highly concordant results compared to m6A-LAIC-seq (Fig. 3c). These results imply that cell-type-specific m6A levels of individual genes exhibit limited bidirectional variability, at least in the two cell types under the examined conditions. However, m6A levels appear to follow more global shifts, perhaps representing different m6A methyltransferase, demethylase, and/or reader expression and activity among conditions and cell types. Indeed, we found significantly higher mRNA levels of the YTH-domain-containing RBPs in H1-ESC (Fig. 3d), which would be expected to lead to higher rates of m6A-targeted RNA degradation and thus to a global reduction of H1-ESC m6A levels, compared to GM12878 as observed8.
Figure 3.
_N_6,2′-_O_-Dimethyladenosine is a low-abundance modification
In transcripts starting with an adenosine, methylation of the 2′-O and the _N_-6 positions can lead to a modification structurally related to m6A, _N_6,2′-_O_-dimethyladenosine (m6Am), that appears to be recognized by anti-m6A antibodies. m6Am is thought to occur exclusively on first nucleotides of mRNAs, whereas m6A has not been found at the first nucleotide position25, 26, 27, 28. To evaluate the impact of m6Am on the quantification of m6A level using m6A-LAIC-seq, we analyzed mRNAs that were unlikely to carry m6Am given that they lacked m6A-seq peak signals within the first 200 nt of any annotated isoforms. We found very similar m6A-level distributions between all mRNAs and the list of mRNAs lacking m6Am in H1-ESC, suggesting that the presence of m6Am was unlikely to cause significant distortions in m6A-level quantification (Supplementary Fig. 3a). However, to our knowledge, there is no report of absolute quantitative measurement of m6Am level in RNA. Thus, we synthesized m6Am standards and used liquid chromatography–mass spectrometry spectrometry (LC-MS) (Supplementary Fig. 3b) to quantify m6Am levels in poly(A)+ RNA29. We found that H1-ESC poly(A)+ RNAs contained ~3 m6Am nucleotides per 105 nucleotides compared to ~100 m6A nucleotides per 105 nucleotides, revealing 33 times more m6A than m6Am (Supplementary Fig. 3c). GM12878 also exhibited low levels of m6Am compared to m6A, suggesting that in both cell types m6Am is unlikely to skew m6A-LAIC-seq level results significantly (Supplementary Fig. 3c). Furthermore, multiple studies showed that fewer than 20% of methylated genes harbor m6A peaks in their 5′ UTRs18, 25. Even with a liberal estimate that all of these m6A peaks are m6Am, the vast majority (>80%) of genes do not have any potential m6Am signal, which further suggests that the impact of m6Am on m6A-LAIC-seq is limited.
Internal splicing differs in m6A and non-m6A RNA fractions
The m6A methyltransferase METTL3 has been implicated in splicing of internal exons, although the true extent of involvement is unclear19, 21, 30, 31, 32. Unlike traditional m6A-seq, m6A-LAIC-seq can directly compare alternatively spliced isoforms between methylated and nonmethylated RNA. By analyzing differential splicing events between these fractions using our rMATS software33, 34, at our current sequencing depth we detected only a limited number of differential splicing events in internal exons, including alternative cassette exons (n = 49 in H1-ESC; n = 77 in GM12878), and retained introns (n = 21 in H1-ESC; n = 78 in GM12878). There was a significant trend for alternative cassette exons included in the m6A-positive fraction of H1-ESC to harbor m6A sites as detected by m6A-seq (P = 2.7 × 10⁻¹⁷; Fisher’s exact test; Supplementary Fig. 4a,b and Supplementary Table 3). We independently validated an example of alternative-cassette-exon inclusion in the m6A-positive fraction by RT-PCR (Supplementary Fig. 4c). We concluded that internal isoform-specific m6A targeting may allow for differential regulation of individual isoforms by m6A modification.
m6A modification is associated with proximal APA usage
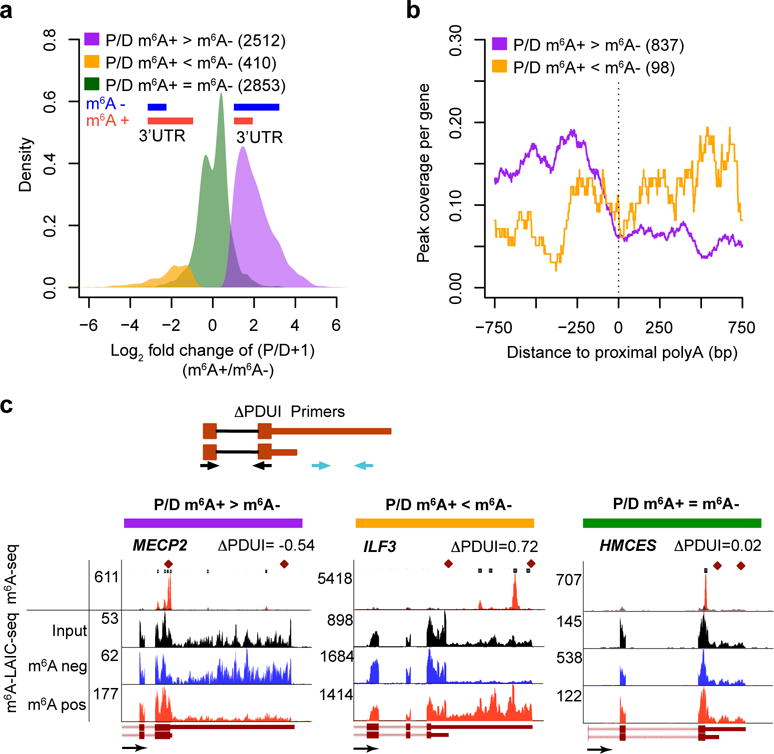
A prevalent form of mRNA isoform regulation outside of internal splicing is 3′-UTR length variation via APA. Visual inspection of m6A-LAIC-seq data tracks revealed numerous examples of genes with significantly differential 3′-UTR signals in m6A-positive versus m6A-negative fractions. A systematic evaluation of APA based on m6A-LAIC-seq (see Online Methods) revealed many genes (H1-ESC, _n_= 2,512; and GM12878, n = 2,260) in which methylated transcripts significantly used the proximal rather than the distal APA site and thus harbored short 3′ UTRs, compared to their nonmethylated transcripts (FDR < 0.01) (Fig. 4a, Supplementary Fig. 5a, and Supplementary Table 4). By contrast, we found a much smaller number of genes (H1-ESC, _n_ = 410; and GM12878, _n_ = 413) in which the reverse was true (Fig. 4a, Supplementary Fig. 5a, and Supplementary Table 4). Furthermore, the m6A-seq peak signals surrounding proximal poly(A) sites suggest that for genes with preferential m6A modification of the shorter 3′-UTR isoform, the m6A sites are located upstream of the proximal poly(A)+ sites and are thus shared by both the shorter and longer 3′-UTR isoforms (Fig. 4b). Figure 4c and Supplementary Figure 5b show examples of m6A-LAIC-seq results for genes with or without differential APA usage. We confirmed our findings in these examples, calculating the change in the percentage of distal polyadenylation (dPAS) usage index (DPDUI) by qRT-PCR (Fig. 4c and Supplementary Fig. 5b)35. Of note, genes in which the proximal APA usage in the m6A-positive fraction is greater than that in the m6A-negative fraction, designated P/D, m6A+ > m6A−, also exhibited higher m6A levels than genes without differential usage (P = 1.8 × 10−152, two-sided Wilcoxon test; Supplementary Fig. 5c,d). A recent study reported that genes with longer last exons have a higher density of m6A peaks36. Consistent with this observation, we found that m6A levels of genes are positively correlated with maximum 3′-UTR lengths as measured in input steady-state RNA-seq data (Supplementary Fig. 5e). Detailed analyses showed that genes with higher proximal APA usage in the m6A-positive fraction (P/D; m6A+ > m6A−) had significantly longer 3′ UTRs (Supplementary Fig. 5f) and lower ratios of proximal versus distal signals (Supplementary Fig. 5g,h) in the input RNA-seq data as compared to genes with higher distal APA usage in the m6A-positive fraction (P/D; m6A+ < m6A−) or no change in APA usage between fractions (P/D; m6A+ = m6A−). Given that m6A modification is strongly coupled with RNA degradation3, 15, 20, 21, our data suggest one possible model in which preferential m6A methylation and degradation of shorter 3′-UTR isoforms using proximal poly(A) sites simultaneously result in their increase in the m6A-positive fraction and decrease in the total steady-state population of RNA.
Figure 4.
One possible interpretation of our findings is that m6A and/or METTL3 may directly dictate APA choice. To test this possibility, we analyzed 3′-UTR read distribution of published RNA-seq or 3p-seq data in wild-type versus knockout or knockdown of m6A writers (METTL3, METTL14, and WTAP) from multiple human and mouse cell lines14, 15, 18, 19. We observed no or limited numbers of significant APA changes in all data sets, with a trend for increased signals of proximal poly(A) sites upon depletion of m6A writers (Supplementary Table 5). Thus, compared to thousands of differential APA usage events in methylated versus nonmethylated transcripts of the same genes, the direct effect of m6A on APA was considerably smaller, suggesting that it is unlikely to explain the widespread association between m6A and proximal APA usage revealed by m6A-LAIC-seq.
_N_6,2-_O_-Dimethyladenosine (m6Am) does not correlate with APA usage
To remove the potential confounding effects of m6Am, we repeated the APA analyses of m6A-LAIC-seq data in genes without any peak within the first 200 nt of transcripts as detected by m6A-seq and obtained similar results (Supplementary Fig. 6a). We also examined APA usage upon stratification of genes based on whether their transcription start sites (TSSs) are adenosine in H1-ESC and GM12878. The TSSs were annotated based on Ensembl annotation or cap analysis gene expression (CAGE) data. We found similarly strong association of m6A with proximal APA usage in genes with or without A at TSSs based on TSS annotation (Supplementary Fig. 6b). These results suggest that the association between m6A and proximal APA usage revealed by m6A-LAIC-seq is not dictated by the potential presence of m6Am at the starting nucleotide position.
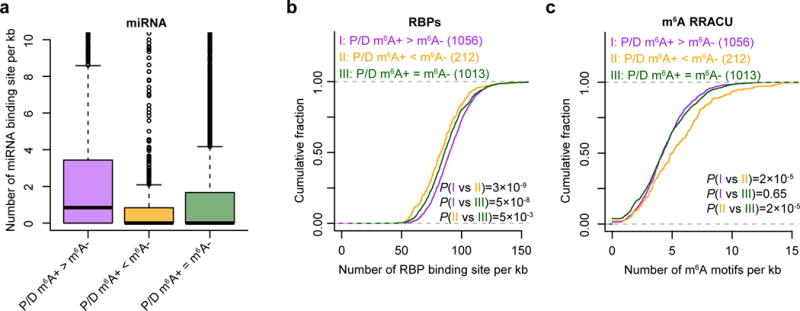
APA of m6A versus non-m6A fractions affects regulatory elements
The 3′ UTRs of transcripts serve as post-transcriptional nexuses of regulation by miRNAs as well as RBPs37. To assess the consequence of differential 3′-UTR usage patterns between modified and unmodified m6A isoforms, we analyzed potential miRNA–mRNA and RBP–mRNA interactions. To do so, we analyzed predicted miRNA target sites as well as RBP-binding motifs in the extended segment of 3′ UTR between the proximal and distal poly(A)+ sites in genes with differential APA usage, while using genes with m6A modifications and tandem APA sites but no difference in APA usage between methylated and nonmethylated fractions as controls. Genes with higher proximal APA usage in the m6A-positive fraction as compared to the m6A-negative fraction (P/D; m6A+ > m6A−) show a higher degree of transcript regulation in the extended segment by miRNAs and RBPs, as compared to genes with higher distal APA usage in the m6A-positive fraction (P/D; m6A+ < m6A−), or no change in APA usage between fractions (P/D; m6A+ = m6A−) (Fig. 5a,b). By contrast, genes with higher distal APA usage in the m6A-positive fraction (P/D; m6A+ < m6A−) had a higher density of m6A RRACU motif in the extended region (Fig. 5c).
Figure 5.
Discussion
We envision that m6A-LAIC-seq complements standard m6A-seq identification of methylation sites and adds to our armamentarium for the study of m6A biology. As demonstrated in this work, the combined use of these two technologies provides new insights into the dynamic range and isoform complexity of the m6A epitranscriptome. Factors that determine m6A levels remain to be elucidated, but they may be related to a number of interacting and stochastic processes ranging from the concentration of m6A readers, erasers, and writers to the in vivo folding and accessibility of RNA. Future application of m6A-LAIC-seq to a larger number of tissue types and cellular states will help further elucidate tissue or cell-state specificity of m6A levels and identify the regulatory logic controlling m6A levels. Theoretically, RNA secondary structures might affect m6A-LAIC-seq results if the structures in full-length RNAs shield the m6A sites from being recognized by the antibody. However, this scenario is unlikely, given that previous studies have shown that m6A modifications occur in unstructured regions31, 32.
A unique application of m6A-LAIC-seq is to deconvolute and contrast the isoform complexity of m6A-methylated versus nonmethylated RNA fractions in a given cell type. We found that thousands of genes with m6A-modified transcripts exhibited a tendency to utilize proximal APA sites, while for hundreds of genes the converse was true. These data suggest that many genes generate at least two distinct pools of transcripts, encoding the same protein in the case of mRNAs, with differing metabolic fates based on m6A coupled with differential binding of miRNAs and RBPs in their UTR regions. Indeed, our findings are consistent with a potential model that the m6A fraction of genes that often harbor shorter 3′ UTRs turns over more rapidly, leading to the observation in the steady-state RNA population that such genes have longer 3′ UTRs. Collectively, these observations may reflect the need to fine-tune the amount of RNA or protein under different circumstances using distinct post-transcriptional mechanisms38. For genes with tandem APA sites in the 3′ UTR, the shorter transcript isoforms have less regulatory sites at the 3′ UTR than the longer isoforms. However, they preferentially acquire m6A modifications and potentially turn on m6A-mediated regulatory pathways. Furthermore, our results suggest that rather than m6A METTL3 dictating APA choice, perhaps the opposite is true. APA factors may help determine m6A site distribution along transcripts, consistent with the predominance of m6A sites in 3′ UTR or last exon, along with data linking APA factors to internal exon splicing39. Further studies are needed to investigate the role of the APA machinery on the installment of m6A along transcripts40.
m6A-LAIC-seq provides a new vantage point from which to dissect and classify the human transcriptome. For example, using m6A-LAIC-seq as a road map, it should now be possible to study the effects of differentially depleting m6A-modified versus m6A-unmodified transcripts for the same gene by designing UTR-segment-specific shRNA or siRNAs. Furthermore, strategies employing RNA-targeting Cas9 systems will allow the rationale design of experiments based on LAIC-seq maps to track and manipulate methylated versus nonmethylated subfractions of a transcript based on their differential UTRs41. In addition, our work sets the foundation for subphenotyping methylated versus nonmethylated transcripts with respect to parameters such as their three-dimensional structures, half lives, and the binding specificity of RBPs on genome-wide scales.
In summary, m6A-LAIC-seq has revealed a new design principle embedded in the human transcriptome based on m6A modifications and 3′-UTR length combinatorics. Given the increasing recognition of other RNA modifications, such as 5mC, m1A, and pseudouridylation (ψψ)42, our results may point to an even greater heterogeneity and isoform complexity of the transcriptome as part of an RNA epitranscriptome code.
Methods
Antibodies
Anti-m6A antibody: the anti-m6A antibody was obtained from Synaptic Systems (cat# 202 003) m6A rabbit polyclonal, affinity purified. Normal rabbit serum R9133-5ML, Sigma (cat# R9133). Donkey secondary anti-rabbit antibody was obtained from Amersham (cat# NA934) (antibody dilution factor, 500 ng μg−1).
Cell line
The GM12878 cell line was obtained by the Coriell Institute for Medical Research (cat# GM12878). The species of origin was confirmed by nucleoside phosphorylase, glucose-6-phosphate dehydrogenase, and lactate dehydrogenase. The cell lines were genotyped based on microsatellite polymorphism assay used by Coriell Institute. The GM12878 cell line tested negative for mycoplasma contamination using the polymerase chain reaction (PCR) method developed by Applied Biosystems and the MycoSEQ Mycoplasma Detection System (4460625, Life Technologies).
The H1 embryonic stem cell line was obtained from WiCell (name: WA1, alias: H1). The cell tested negative for mycoplasma infection based on PCR method.
Synthesis of m6Am
The synthesis of _N_6, 2′-_O_-dimethyladenosine was analogous to a published procedure for the synthesis of 2′-_O_-methyladenosine, except for the use of _N_6-methyladenosine (Berry & Associates) as starting material29. Purification was performed on an Agilent 1200 series HPLC equipped with a diode array detector (DAD), fraction collector, and a Synergy Fusion RP column (4 μm particle size, 80 Å pore size, 250 mm length, and 4.6 mm inner diameter) from Phenomenex at 35 °C. The solvents consisted of 5 mM ammonium acetate buffer adjusted to pH 5.5 with acetic acid (solvent A) and acetonitrile (solvent B). The elution at a flow rate of 1 mL/min started with 90% solvent A followed by a linear gradient to 21% solvent B at 15 min. Solvent B was increased further to 50% over 5 min, followed by a decrease to 10% over 3 min. The desired fractions were dried under vacuum.
Analysis of m6A and m6Am by liquid chromatography-coupled mass spectrometric analysis (LC-MS)
Prior to mass spectrometric analysis, all RNA samples were hydrolyzed enzymatically to ribonucleosides as described previously44. Briefly, the digestion was carried out in 0.1 mM Tris buffer (pH 8), 5 mM MgCl2, 0.0375 U μL−1 benzonase, 0.17 U μL−1 alkaline phosphatase, 1 U mL−1 phosphodiesterase, 3 mM desferroxamine (antioxidant), 0.3 mM butylated hydroxytoluene (antioxidant), 0.05 μM [15_N_5]-2′-deoxyadenosine (internal standard), and 5 μM 2′-deoxyinosine (internal standard) at 37 °C for 2 h. Enzymes were then removed using a YM-10 centrifugal spin column (Millipore).
Quantitative analyses of m6A and m6Am were achieved using an Agilent 1200 HPLC coupled to an Agilent 6430 triple quadrupole mass spectrometer in positive-ion mode using dynamic multiple reaction monitoring (MRM). The ribonucleosides in the hydrolyzed RNA samples were resolved on a Phenomenex C18 HPLC column (1.7 μm particle size, 100 Å pore size, 2.1 × 150 mm; 25 °C) at 330 μL/min using a solvent system consisting of 10 mM ammonium acetate in H2O (A) and acetonitrile (B). The elution profile was 0% B for 3 min, 0–7% B over 20 min, then to 7–40% B over 4 min, followed by a column washing at 80% B and column equilibration. The operating parameters for the mass spectrometer were as follows: gas temperature 350 °C; gas flow 10 l/min; nebulizer 50 psi and capillary voltage 3500 V, fragmentor voltage 100 V, and collision energy 15 V. The quantification of a ribonucleoside can be achieved using mass-to-charge ratio (m/z) of the parent ribonucleoside ion and m/z of the deglycosylated product ion. The nucleosides were quantified based on the transition of the parent ribonucleoside to the deglycosylated base ion: m/z, 282.1/150.1 for m6A and m/z, 296.1/150.1 for m6Am. Absolute quantities of each m6A and m6Am were determined respectively using an external calibration curve prepared with synthetic standards for each ribonucleoside.
m6A-level dot blots
Amersham Hybond-XL (cat# RPN303s) membrane was rehydrated in H2O for 3 min. The membrane was then ‘sandwiched’ in Bio-Dot Microfiltration Apparatus (Bio-Rad, cat# 170-6545). Each well was then filled with H2O and flushed by gentle suction vacuum until it appeared dry. 5 μl of H2O alone was then applied to the membrane in each well followed by addition of indicated amount of RNA and this was allowed to bind to the membrane by gravity. The apparatus was disassembled and the membrane was crosslinked in a UV STRATALINKER 1800 using the automatic function, and then the membrane was placed back into the apparatus. The membrane was then blocked 10 min using sterile RNase DNase free TBST + 5% milk. The m6A primary antibody (Anti-m6A, Synaptic Systems, cat# 202 003) was then added at a concentration of 1:500 at room temperature for 1 h in TBST + 5% milk. The membrane was then washed four times in PBST. The membrane was then incubated with the secondary anti-rabbit antibody (1:5,000 dilution) for 30 min in TBST + 5% milk. The membrane was washed 4 times for 5 min in TBST and exposed on an autoradiographic film using Pierce ECL Western Blotting Substrate.
cDNA synthesis for qRT-PCR analysis
First, a mix was made of 100 ng of RNA in 5 μl volume, 2 μl of random hexamers (Roche), 1 μl of dNTP Mix (10 mM each) and 5 μl of ultrapure H2O was first generated, heated at 65 °C for 5 min and immediately put on ice. 4 μl of 5× first-strand buffer was added along with 1 μl of 0.1 M DTT, 1 μl RNase inhibitor and 1 μl of Superscript III reverse transcriptase (Invitrogen). The 20 μl reverse transcription reaction was then incubated 5 min at room temperature, then 60 min at 50 °C then 15 min at 70 °C. The freshly synthesized cDNA was treated with 1 μl of RNase H at 37 °C for 20 min.
SYBR Green qRT-PCR
To calculate m6A levels by qPCR for Figures 2d and 3c and Supplementary Figures 2d and 3e, SYBR Green quantitative real-time PCR assays were performed utilizing a spike-in synthetic control called Drosophila E (see below) for normalization. Each PCR reaction was done in a 10 μl volume made of 5 μl of master mix (SYBR GreenER qPCR SuperMix for iCycler, Invitrogen), 2.5 μl of primer mix at 1.2 μM (each) and 2.5 μl of cDNA template at 20 ng μl−1. The PCR was carried out using a standard protocol with melting curve. The amount of target was calculated using the formula: amount of target = 2−ΔΔ_C_T (ref. 45).
Calculation of ΔPDUI
All ΔPDUI calculations were based on the method described in Masamha et al.35, adopted to compare UTR length in positive and negative fractions of the m6A IP of m6A-LAIC-seq. The following was calculated using primer sets designed in the common part of the isoforms of a transcript (called ‘common primer set’) as well as in the distal part of long isoform of the same transcripts (called ‘distal primer set’): Δ_C_T (common and distal) was normalized to an artificial spike-in transcript DrosoE (described in spike-ins controls for m6A-LAIC-seq). ΔΔ_C_T = Δ_C_T distal − Δ_C_T common. ΔΔΔ_C_T = ΔΔ_C_T negative fraction m6A IP − ΔΔ_C_T positive-fraction m6A IP. The increase or decrease in ΔΔΔ_C_T was given by ±2Δ−Δ_C_T (ref. 45).
RNA extraction, DNase I treatment, and poly(A)+ selection
Total RNA was isolated from cells according to manufacturer’s instructions using TRIzol LS reagent (Ambion). Total RNA was treated using DNase I (Promega) for 20 min at 37 °C. The treated RNA was then acid-phenol-chloroform extracted and chloroform extracted. The RNA was precipitated using 300 mM final concentration of NaCl2 spiked with 1 μl of 50 mg/ml of Ultra Pure Glycogen (Promega) and 2.5 volume of 100% ethanol at −20 °C either for 2 h or overnight. The precipitated RNA was then centrifuged using a refrigerated tabletop at maximum speed (>13,000_g_) at 4 °C for 20 min. The precipitated RNA was then washed with 70 °C ethanol and centrifuged at maximum speed for an additional 10 min. The final pellet was then resuspended in ultrapure H2O. Poly(A)+ RNA selection was performed twice using Dynabeads mRNA Purification Kit (Invitrogen cat. # 610.06) according to the manufacturer’s protocol. The second poly(A)+ RNA selection was performed using the eluate of the first poly(A)+ RNA selection as starting material according to the manufacture’s instruction. The obtained poly(A)+ RNA was evaluated both by NanoDrop and Bioanalyzer. For all RNA samples, the concentration, purity, and integrity of the RNA were verified using a NanoDrop and Bioanalyzer.
H1-ESC cell and GM12878 cell culture
H1 (WA01) cells were cultured in feeder-free condition using mTESR1 media (Stem Cell Technologies cat. # 05850) on 6-well plates coated with Matrigel (BD Biosciences, cat. # 354603), as described46. GM12878 cells were cultured on complete RPMI media (Invitrogen) supplemented with 15% FBS and 10% Pen–Strep antibiotic.
m6A level and isoform-characterization sequencing (m6A-LAIC-seq)
Of note for each biological replicate for m6A-LAIC-seq, we started with 150 μg of total RNA yielding approximately 3.8 μg of double poly(A)-selected RNA which was resuspended in a final volume of 50 μl using UltraPure H2O (Life Technologies cat# 10977-015). The 2× poly(A)+ RNA was then heated at 65 °C for 5 min and immediately put on ice. 50 μl of m6A–DynaBeads (the m6A antibody, Synaptic Systems cat# 202 003, was coupled to Dynabeads using the Life Technologies coupling kit cat# 14311D) were equilibrated by washing twice for 5 min in 500 μl of m6A–Binding Buffer (50 mM Tris-HCl, 150 mM NaCl2, 1% NP-40, 0.05% EDTA). The RNA and the spike-ins controls were then added to the equilibrated m6A–DynaBeads. The RNA was allowed to bind to the m6A–Dynabeads (in 500 μl volume of m6A–Dynabeads and m6A–Binding Buffer at room temperature while rotating (tail over head) at 7 rotations per min for 1 h). The tubes containing the samples were placed on a magnet, allowing the beads complexes to cluster for 1 min or until the solution become clear. The liquid phase was carefully collected and placed on ice as this 500 μl fraction represented the ‘supernatant’ of the m6A IP. Following the collection of the supernatant fraction, series of washes were performed using various buffers (see as follows). For all wash steps, with the exception of the elution step, the beads were washed for 3 min then placed on a magnet and the wash buffers were discarded. Following the supernatant collection, Wash step 1: the remaining fractions bound to the beads were washed twice in 500 μl of m6A–Binding Buffer (50 mM Tris-HCl, 150 mM NaCl2, 1% NP-40, 0.05% EDTA). Wash step 2: the RNA–beads complexes were washed once in 500 μl of low-salt buffer (0.25× SSPE, 0.001 M EDTA, 0.05% Tween-20, 37.5 mM NaCl). Wash step 3: the RNA–beads complexes were washed once in 500 μl of high-salt buffer (0.25× SSPE, 0.001 M EDTA, 0.05% Tween-20, 137.5 mM NaCl). Wash step 4: the RNA–beads complexes were washed twice in 500 μl of TET (T.E. + 0.05% Tween-20). Elution step: The m6A RNA was eluted from the beads by repeating the following four times: 125 μl of elution buffer (0.02 M DTT, 0.150 M NaCl, pH 7.5 0.05 M Tris-HCl, 0.001 M EDTA, 0.10% SDS) was added to the beads and incubated at 42 °C for 5 min. At the end of the 5 min the beads were gently placed on the magnet. The liquid phase was collected and transferred to a fresh tube as this will represent the eluate fraction containing the m6A ‘enriched RNA’. An additional 125 μl of elution buffer was then added to the beads and the process was repeated. The liquid phase obtained at each step was added to the ‘fresh tube’ containing the 125 μl of eluate from the previous step so the total final eluate volume was 500 μl.
All RNA fractions were extracted as follow. 500 μl of acid phenol-chloroform (acid-phenol:chloroform), pH 4.5 (with IAA, 125:24:1; Ambion) was added to the 500 μl sample. The sample was centrifuged at 4 °C at 10,000_g_ for 7.5 min. The upper phase was carefully collected, ensuring that it did not touch the interphase, and it was transferred to a clean 1.5 ml tube. 500 ml of chloroform was added to the fresh tube, mixed by gentle manual shaking, and centrifuged at 4 °C at 10,000_g_ for 7.5 min. The upper phase was transferred to a fresh 1.5 ml tube and NaCl2 ethanol precipitated overnight at −20 °C in the presence of 1 μl of (20 mg/ml) Ultra Pure Glycogen. The following day the sample was centrifuged at 4 °C for 20 min at 16,000_g_. The pellet was then washed in 70% ethanol and centrifuged an additional 10 min at 4 °C at 16,000_g_. The pellet was then left to dry at room temperature for 10 min before it was resuspended in the desired volume of Ultra-Pure H20 (Invitrogen cat# 10977-015). Note that only one round of anti-m6A RNA immunoprecipitation for m6A-LAIC-seq was performed given our data that under the conditions we used there was essentially 100% efficiency in pulling down m6A-positive transcripts (Fig. 1 and Supplementary Fig. 1).
Spike-in controls for m6A-LAIC-seq
For each sample after double-poly(A)-RNA selection, but before anti-m6A RIP, _in vitro_–transcribed transcripts with and without m6A modification were mixed into the 2× poly(A)+ RNA as spike-in controls at the indicated percentage of m6A-modified to m6A-unmodified transcript, the indicated number of copies, and the indicated percentage of m6A in the modified transcript. For all samples these spike ins included: 80% mCHERRY (108 copies, 0.2% m6A), 60% XEF (108 copies, 0.2% m6A), 20% eGFP (108 copies, 0.2% m6A), luciferase unmodified (108 copies, 0% m6A), and Kanamycin unmodified (108 copies, 0% m6A). An additional unmodified transcript originating from Drosophila called transcript DrosC (EST:RH10804; 108 copies, 0% m6A) was also added before anti-m6A RIP. Post-m6A RIP 5 μl of 1:100 dilution of the universal ERCC spike-in control A (Invitrogen) was added to each fraction (input fraction, m6A− fraction and m6A+ fraction) as well as transcript originating from Drosophila called transcript-unmodified DrosE (EST:IP03042; 108 copies, 0% m6A).
Library construction for RNA-seq
100 ng of RNA was used for library construction for m6A-LAIC-seq input, supernatant (m6A-negative fractions), and eluate (m6A-positive fractions) using the TrueSeq Stranded mRNA Sample Preparation Guide, entering the protocol by adding the fragment, prime, finish mix, skipping the elution step and proceeding immediately to the synthesis of the first strand cDNA. From that point on, the exact steps of the Illumina TruSeq Stranded mRNA Sample Preparation Guide were followed to the end.
m6A-antibody-binding saturation and sensitivity titration
We generated an m6A antibody titration curve to identify the point of saturation of the anti-m6A antibody in the context of performing m6A RIPs (Fig. 1b). To do so, we used an _in vitro_–generated transcript from a plasmid containing cDNA of GAPDH transcript (1,008 bps; 233 ATPs). The plasmid was first linearized by restriction digest using SalI just downstream of the GAPDH cDNA cloning site. The linearized plasmid was gel purified and in vitro T7-mediated transcription was performed using the Ambion MEGAscript Kit (AM1334) as described in the user manual using 100% _N_6-methyladenosine-5′-triphosphate (cat# N1013) nucleotide during synthesis adding α-32P-CTP as tracer (PerkinElmer cat# BLU008H250UC). The anti-m6A RIP was performed as described in the m6A-seq section, using anti-m6A antibody (Synaptic system # 202 003) or normal rabbit serum on respectively 10 μg, 2 μg, and 400 ng of _in vitro_–transcribed transcript (antibody dilution factor, 500 ng μg−1). m6A dot blots were performed on the m6A-positive (eluate) and m6A-negative (supernatant) fractions resulting from the RIP as shown in Figure 1b. To test for sensitivity of anti-m6A RIP in vitro on full-length transcripts, we synthesized α-32P-CTP GAPDH transcripts with on average 2 m6A modifications per transcript, as well as unmodified α-32P-CTP GAPDH transcripts. Subsequently, various ratios (shown as percentages) of unmodified versus m6A-modified GAPDH transcripts were mixed (e.g., 0.1% indicates 1,000 unmodified to 1 modified transcripts). The various percentage ratios of mixed transcripts were then subjected to anti-m6A RNA immunoprecipitation (m6A-RIP) using anti-m6A antibody or normal rabbit serum (NRS-RIP). The indicated fractions were subjected to gel electrophoresis and radiographically visualized (Fig. 1c).
RNA sequencing
All libraries were prepared as previously described for RNA-seq. Each individual library fragment size was verified on Agilent Bioanalyzer 2100 with high-sensitivity chip. Final quantification was done by qPCR on PerkinElmer 2500Fast with Kapa library quantification kit (# KK4824). Libraries were pooled at equimolar concentrations according to the manufacturer guidelines (TruSeq Stranded mRNA Sample Preparation Guide, September, 2012). After clustering on Illumina cBot, samples were run on Illumina HiSeq 2000.
Anti-m6A RNA immunoprecipitation is efficient and independent of the number of m6A modifications
Total RNA was first isolated using TRIzol reagent. Following RNA isolation the total RNA was further treated using RQ1 RNase free DNase (PROMEGA # M610A). The RNA was then poly(A)-selected twice using Ambion Dynabeads mRNA Purification Kit. The quality and the integrity of the RNA was checked by BioAnalyzer. The 2× poly(A)+ RNA was split into 5 equal quantities. Each tube was spiked with _in vitro_–generated GFP transcripts containing one of five variant percentiles of incorporated m6A nucleotides (100% m6A, 20% m6A, 2% m6A, 0.2% m6A, or 0% m6A). Note that every percentage variant of m6A spike in underwent one round of m6A RIP and eluate was obtained to ensure the purity of each transcript after in vitro synthesis before being used as a spike in. Each of the five poly(A)+ RNA pools with unique spike in were subject to m6A RIP and fractions were subjected to a qRT-PCR for GFP to calculate the percentage of recovery of GFP post-m6A-RIP. To check for overall efficiency of anti-m6A RIP a similar experiment was performed with total RNA and a single spike in of 2% m6A GFP and subjected to anti-m6A RIP followed by qRT-PCR of GFP and anti-m6A dot blot of input, m6A positive (eluate), and m6A negative (supernatant). The anti-m6A RIP was performed a second time on the supernatant from the first round of anti-m6A RIP and each subsequent fraction was also subject to qRT-PCR and m6A dot blotting.
Read-mapping and gene-expression analyses
We mapped strand-specific paired-end RNA-seq reads first to Ensembl genes (release 74) and then to hg19 human genome incorporated with all spike-in sequences using tophat (v 1.4.1)47. Only the properly paired and uniquely mapped reads were used in future analyses. FPKMs of input fractions were calculated using Cufflinks (v 2.0.2)48. Differentially expressed genes (DEGs) between H1-ESC input and GM12878 input were determined by Cuffdiff (v 2.0.2)48.
Read coverage distribution comparison
To compare the read coverage distributions around m6A peaks during the three fractions of m6A-LAIC-seq and m6A-seq in H1-ESC, for each peak, we calculated the RNA-seq read coverage of the upstream and downstream 1,500 bp regions on the longest isoform of the Ensembl gene. The peaks with upstream or downstream transcript regions less than 1,500 bp were removed from the analyses. For each 3,000 bp region, the read coverage of each site was normalized by the average of the whole region. To plot Figure 1d, the normalized read coverage of all the 3,000 bp regions around m6A peaks were averaged at each site.
m6A-level calculation
The ratio of RNA abundance (copies) between eluate and supernatant was calculated first in order to calculate m6A level for each gene or spike-in RNA before m6A-RIP. Since equal amount of ERCC RNA Spike-In Mix were added to eluate and supernatant fractions right after m6A RIP, the abundance of each gene or spike-in RNA in eluate or supernatant was represented by the RNA-seq fragment (read pair) counts normalized by the fragment counts of the ERCC RNAs. So, for each gene or spike-in RNA before m6A RIP, the ratio of RNA abundance between eluate and supernatant could be calculated using the ratio of its RNA-seq fragment counts and the ratio of fragment counts of ERCC RNAs. Because there were 92 RNAs with a variety of concentrations in ERCC mixture, the ratio of ERCC RNA fragment counts between eluate and supernatant in each replicate could be accurately calculated using these RNAs together. As shown in Supplementary Figure 7, we used the log2-transformed counts of ERCC RNAs to fit a linear regression model (eluate counts as a function of supernatant counts) with coefficient of 1, and the log2 ratio between ERCC eluate counts and supernatant counts was indicated by the residual of the regression formula. To avoid using unreliable counts, only the ERCC RNAs with at least 100 counts were used to fit the regression model.
The m6A levels of a specific Ensembl-annotated gene or spike-in RNA before m6A-RIP were calculated using eluate counts (E), supernatant counts (S), and the residual of ERCC regression (R) according to the following formula:
m6A-level analyses
For all the analyses of m6A levels, we required eluate counts ≥50 or supernatant counts ≥50 in both replicates to obtain reliable m6A levels. To compare the m6A levels with m6A peaks, we used our previously published18 m6A peaks of H1 ESC cell line. The peak intensities of genes were represented by the maximum peak intensities of the peaks in the genes, and we also required the input RPKMs of the peaks ≥5 in both replicates to obtain reliable peak intensities. Gene ontology (GO) analyses for top 1,000 highly methylated genes and bottom 1,000 weakly methylated genes were conducted using DAVID49; all genes with the above required read counts for level calculation were used as background. Published half-life measurements of iPSC24 were used to compare with m6A levels, and the genes with average FPKMs of the two H1 replicates <5 were removed from the analyses.
Comparison of m6A levels between cell lines
For all the comparisons of m6A levels between H1-ESC and GM12878 cell lines, we required eluate counts ≥50 or supernatant counts ≥50 in both replicates of both H1-ESC and GM12878 cell lines to obtain reliable m6A levels. Differentially methylated genes were determined as the genes with m6A-level differences between cell types of > 10% or 20%.
Splicing analyses
We used rMATS (v 3.0.8)34 to determine the differential alternative splicing events between different libraries. Four types of alternative splicing events (skipped exon (SE), alternative 5′ splice site (A5SS), alternative 3′ splice site (A3SS), and retained intron (RI)) based on annotated Ensembl genes were tested for inclusion-level difference ≥5%, and the events with FDR < 0.05 were determined as differential alternative splicing events.
Differential usage of alternative poly(A) sites
Poly(A) sites from the APADB database50 were identified within the 3′-UTR regions of Ensembl protein-coding genes. For genes with multiple poly(A) sites, any pairs of poly(A) sites are defined as the end of the 3′ termini of common and extended 3′ UTR (the different region between longer 3′ UTR and shorter 3′ UTR) segments. If the lengths of the 3′-UTR segments are both greater than 100 nt (to rule out the regions determined by two close poly(A) sites), they are considered a valid pair of tandem UTRs. For each pair of tandem UTRs, the number of RNA-seq reads mapped within the common and extended 3′ UTRs were calculated for each replicate of supernatant and eluate, respectively. The P:D (proximal:distal) ratio plus 1 (P:D + 1) was calculated as the ratio of region-length normalized read counts between common and extended 3′ UTR. We then used the statistic model of rMATS34 to test the differences of the read counts ratio of common and extended 3′ UTRs between supernatant and eluate; the 3′-UTR pairs with read depths (total reads in common and extended 3′ UTR) <5 in any replicate of supernatant or eluate were removed from the calculation. The 3′-UTR pairs with FDR < 0.01 were then identified as differentially used alternative poly(A) sites between supernatant and eluate; we then took the most significant 3′-UTR pair of each gene for the downstream analyses. Based on the above analyses, we classified three categories of genes for further analyses: group 1, eluate has higher proximal poly(A) site usage; group 2, supernatant has higher proximal poly(A) site usage; group 3, eluate and supernatant have no significant (FDR > 0.5) difference of APA usage.
We then studied the m6A peak coverage around proximal poly(A) sites for genes in group 1 and group 2, respectively, in H1-ESC. For the transcript with the extended 3′ UTR of each gene, the peak coverage of upstream and downstream 750 bp flanking the last nucleotide of proximal poly(A) site was calculated. The transcripts with either flanking regions <750 bp were removed from the analyses. To study the relationship between m6A level and 3′-UTR length, we used the longest 3′ UTR of all isoforms for each gene.
m6Am analyses
To create a list of protein-coding genes that were unlikely to harbor m6Am, we removed the genes with m6A peaks within the first 200 nt of at least one Ensembl-annotated transcript isoform in H1-ESC and GM12878, respectively. The m6A peaks of GM12878 were obtained from previous publication51. To determine whether the genes had A at TSSs, we used the Ensembl-annotated TSSs of the longest protein-coding isoforms or TSSs annotated by ENCODE CAGE data of poly(A)+ mRNAs of H1-ESC and GM12878. The processed data summarizing CAGE tags were downloaded from http://ccg.vital-it.ch/mga/hg19/encode/GSE34448/GSE34448.html. For the CAGE data, we only used the TSSs with CAGE tags ≥10 in both replicates and the TSSs must have been located in the 5′ UTR of first exon of the longest protein-coding isoforms. For each gene, the TSS with maximum average CAGE tags was used in the analyses.
miRNA and RBP analyses
We compare the densities of miRNA targets and RBP binding sites in the extended 3′ UTRs in the 3 categories of genes in terms of poly(A) usage as described above. miRNA targets predicted by TargetScanHuman 5.1 were downloaded from the UCSC genome browser52. RBP binding sites were predicted through matching RNAcompete-derived motifs of 110 RNA-binding proteins and other well-known RNA-binding motifs53, 54, 55. Only the genes with extended 3′-UTR lengths between 500 nt and 2,000 nt were used in RNA-binding-protein analyses.
Data visualization
UCSC custom data tracks were generated using the uniquely mapped reads. For Figure 2c,e and Supplementary Figure 2e, to make the read coverage of supernatant and eluate reflect the real ratio of their RNA abundance, we used the raw reads coverage of eluate, but we multiplied the supernatant read coverage by 2_R_ (as described above, R was the residue of ERCC regression formula).
Supplementary Material
Supp. Figures
Supp. Table 1
Supp. Table 2
Supp. Table 3
Supp. Table 4
Supp. Table 5
Acknowledgments
This study was supported by an MGH startup and ECOR grants to C.C.G. This study was also supported by National Institutes of Health (NIH) grant R01GM088342 and an Eli & Edythe Broad Center of Regenerative Medicine and Stem Cell Research at UCLA and Rose Hills Foundation Research Award to Y.X. Y.X. is supported by an Alfred Sloan Research Fellowship. P.D. was supported by the National Research Foundation of Singapore through the Singapore–MIT Alliance for Research and Technology, National Institute of Environmental Health Science grants ES002109 and ES024615, and National Science Foundation grant CHE-1308839. A.C.M. was supported by NIH grant DK090122. We thank D. Mirsky for copy editing the manuscript. We thank J. Wan for technical support on data analyses. We thank H. Chang, P. Batista, and K. Jeffrey for reading the manuscript and providing helpful comments.
Footnotes
Contributions
C.C.G., Y.X., B.M., and J.W. conceived of the project, analyzed the data, and wrote the manuscript with input from all authors. B.M. did the experimental work related to m6A-LAIC-seq along with Z.L., N.V.W., B.D.H., K.D., and A.C.M. Y.X. and J.W. did the computational analyses of data with input from C.C.G. and B.M. P.D., K.S.L., and R.H. synthesized m6Am and performed RNA mass spectrometry.
Accession codes.
m6A-LAIC-seq raw data of H1-ESC and GM12878 have been deposited in the Gene Expression Omnibus database under the accession number GSE66086.
Competing financial interests
C.C.G., Y.X., B.M., and J.W. are in the process of filing a patent application for m6A-LAIC-seq.
References
- 1.Fu Y, He C. Nucleic acid modifications with epigenetic significance. Curr Opin Chem Biol. 2012;16:516–524. doi: 10.1016/j.cbpa.2012.10.002. [DOI] [PMC free article] [PubMed] [Google Scholar]
- 2.Sibbritt T, Patel HR, Preiss T. Mapping and significance of the mRNA methylome. Wiley Interdiscip Rev RNA. 2013;4:397–422. doi: 10.1002/wrna.1166. [DOI] [PubMed] [Google Scholar]
- 3.Meyer KD, Jaffrey SR. The dynamic epitranscriptome: N6-methyladenosine and gene expression control. Nat Rev Mol Cell Biol. 2014;15:313–326. doi: 10.1038/nrm3785. [DOI] [PMC free article] [PubMed] [Google Scholar]
- 4.Klungland A, Dahl JA. Dynamic RNA modifications in disease. Curr Opin Genet Dev. 2014;26:47–52. doi: 10.1016/j.gde.2014.05.006. [DOI] [PubMed] [Google Scholar]
- 5.Pan T. N6-methyl-Adenosine modification in messenger and long non-coding RNA. Trends Biochem Sci. 2013;38:204–209. doi: 10.1016/j.tibs.2012.12.006. [DOI] [PMC free article] [PubMed] [Google Scholar]
- 6.Schwartz S, et al. High-resolution mapping reveals a conserved, widespread, dynamic mRNA methylation program in yeast meiosis. Cell. 2013;155:1409–1421. doi: 10.1016/j.cell.2013.10.047. [DOI] [PMC free article] [PubMed] [Google Scholar]
- 7.Wang Y, et al. N6-methyladenosine modification destabilizes developmental regulators in embryonic stem cells. Nat Cell Biol. 2014;16:191–198. doi: 10.1038/ncb2902. [DOI] [PMC free article] [PubMed] [Google Scholar]
- 8.Wang X, et al. m6A-dependent regulation of messenger RNA stability. Nature. 2014;505:117–120. doi: 10.1038/nature12730. [DOI] [PMC free article] [PubMed] [Google Scholar]
- 9.Meyer KD, et al. 5′ UTR m6A promotes cap-independent translation. Cell. 2015;163:999–1010. doi: 10.1016/j.cell.2015.10.012. [DOI] [PMC free article] [PubMed] [Google Scholar]
- 10.Zhou J, et al. Dynamic m6A mRNA methylation directs translational control of heat shock response. Nature. 2015;526:591–594. doi: 10.1038/nature15377. [DOI] [PMC free article] [PubMed] [Google Scholar]
- 11.Wang X, et al. N6-methyladenosine modulates messenger RNA translation efficiency. Cell. 2015;161:1388–1399. doi: 10.1016/j.cell.2015.05.014. [DOI] [PMC free article] [PubMed] [Google Scholar]
- 12.Bokar JA, Shambaugh ME, Polayes D, Matera AG, Rottman FM. Purification and cDNA cloning of the AdoMet-binding subunit of the human mRNA (N6-adenosine)-methyltransferase. RNA. 1997;3:1233–1247. [PMC free article] [PubMed] [Google Scholar]
- 13.Liu J, et al. A METTL3–METTL14 complex mediates mammalian nuclear RNA N6-adenosine methylation. Nat Chem Biol. 2014;10:93–95. doi: 10.1038/nchembio.1432. [DOI] [PMC free article] [PubMed] [Google Scholar]
- 14.Ping XL, et al. Mammalian WTAP is a regulatory subunit of the RNA N6-methyladenosine methyltransferase. Cell Res. 2014;24:177–189. doi: 10.1038/cr.2014.3. [DOI] [PMC free article] [PubMed] [Google Scholar]
- 15.Schwartz S, et al. Perturbation of m6A writers reveals two distinct classes of mRNA methylation at internal and 5′ sites. Cell Rep. 2014;8:284–296. doi: 10.1016/j.celrep.2014.05.048. [DOI] [PMC free article] [PubMed] [Google Scholar]
- 16.Zheng G, et al. ALKBH5 is a mammalian RNA demethylase that impacts RNA metabolism and mouse fertility. Mol Cell. 2013;49:18–29. doi: 10.1016/j.molcel.2012.10.015. [DOI] [PMC free article] [PubMed] [Google Scholar]
- 17.Jia G. N6-methyladenosine in nuclear RNA is a major substrate of the obesity-associated FTO. Nat Chem Biol. 2011;7:885–887. doi: 10.1038/nchembio.687. [DOI] [PMC free article] [PubMed] [Google Scholar]
- 18.Batista PJ, et al. m6A RNA modification controls cell fate transition in mammalian embryonic stem cells. Cell Stem Cell. 2014;15:707–719. doi: 10.1016/j.stem.2014.09.019. [DOI] [PMC free article] [PubMed] [Google Scholar]
- 19.Geula S, et al. Stem cells. m6A mRNA methylation facilitates resolution of naïve pluripotency toward differentiation. Science. 2015;347:1002–1006. doi: 10.1126/science.1261417. [DOI] [PubMed] [Google Scholar]
- 20.Dominissini D, Moshitch-Moshkovitz S, Amariglio N, Rechavi G. Transcriptome-wide mapping of N6-methyladenosine by m6A-seq. Methods Enzymol. 2015;560:131–147. doi: 10.1016/bs.mie.2015.03.001. [DOI] [PubMed] [Google Scholar]
- 21.Dominissini D, et al. Topology of the human and mouse m6A RNA methylomes revealed by m6A-seq. Nature. 2012;485:201–206. doi: 10.1038/nature11112. [DOI] [PubMed] [Google Scholar]
- 22.Liu N, et al. Probing N6-methyladenosine RNA modification status at single nucleotide resolution in mRNA and long noncoding RNA. RNA. 2013;19:1848–1856. doi: 10.1261/rna.041178.113. [DOI] [PMC free article] [PubMed] [Google Scholar]
- 23.Horowitz S, Horowitz A, Nilsen TW, Munns TW, Rottman FM. Mapping of N6-methyladenosine residues in bovine prolactin mRNA. Proc Natl Acad Sci USA. 1984;81:5667–5671. doi: 10.1073/pnas.81.18.5667. [DOI] [PMC free article] [PubMed] [Google Scholar]
- 24.Neff AT, Lee JY, Wilusz J, Tian B, Wilusz CJ. Global analysis reveals multiple pathways for unique regulation of mRNA decay in induced pluripotent stem cells. Genome Res. 2012;22:1457–1467. doi: 10.1101/gr.134312.111. [DOI] [PMC free article] [PubMed] [Google Scholar]
- 25.Linder B, et al. Single-nucleotide-resolution mapping of m6A and m6Am throughout the transcriptome. Nat Methods. 2015;12:767–772. doi: 10.1038/nmeth.3453. [DOI] [PMC free article] [PubMed] [Google Scholar]
- 26.Wei C, Gershowitz A, Moss B. N6, O2′-dimethyladenosine a novel methylated ribonucleoside next to the 5′ terminal of animal cell and virus mRNAs. Nature. 1975;257:251–253. doi: 10.1038/257251a0. [DOI] [PubMed] [Google Scholar]
- 27.Kruse S, et al. A novel synthesis and detection method for cap-associated adenosine modifications in mouse mRNA. Sci Rep. 2011;1:126. doi: 10.1038/srep00126. [DOI] [PMC free article] [PubMed] [Google Scholar]
- 28.Keith JM, Ensinger MJ, Moss B. HeLa cell RNA (2′-O-methyladenosine-N6−)-methyltransferase specific for the capped 5′-end of messenger RNA. J Biol Chem. 1978;253:5033–5039. [PubMed] [Google Scholar]
- 29.Robins MJ, Naik SR, Lee AS. Nucleic acid related compounds. 12. The facile and high-yield stannous chloride catalyzed monomethylation of the cis-glycol system of nucleosides by diazomethane. J Org Chem. 1974;39:1891–1899. doi: 10.1021/jo00927a022. [DOI] [PubMed] [Google Scholar]
- 30.Zhao X, et al. FTO-dependent demethylation of N6-methyladenosine regulates mRNA splicing and is required for adipogenesis. Cell Res. 2014;24:1403–1419. doi: 10.1038/cr.2014.151. [DOI] [PMC free article] [PubMed] [Google Scholar]
- 31.Liu N, et al. N6-methyladenosine-dependent RNA structural switches regulate RNA-protein interactions. Nature. 2015;518:560–564. doi: 10.1038/nature14234. [DOI] [PMC free article] [PubMed] [Google Scholar]
- 32.Spitale RC, et al. Structural imprints in vivo decode RNA regulatory mechanisms. Nature. 2015;519:486–490. doi: 10.1038/nature14263. [DOI] [PMC free article] [PubMed] [Google Scholar]
- 33.Shen S, et al. MATS: a Bayesian framework for flexible detection of differential alternative splicing from RNA-seq data. Nucleic Acids Res. 2012;40:e61. doi: 10.1093/nar/gkr1291. [DOI] [PMC free article] [PubMed] [Google Scholar]
- 34.Shen S, et al. rMATS: robust and flexible detection of differential alternative splicing from replicate RNA-seq data. Proc Natl Acad Sci USA. 2014;111:E5593–E5601. doi: 10.1073/pnas.1419161111. [DOI] [PMC free article] [PubMed] [Google Scholar]
- 35.Masamha CP, et al. CFIm25 links alternative polyadenylation to glioblastoma tumour suppression. Nature. 2014;510:412–416. doi: 10.1038/nature13261. [DOI] [PMC free article] [PubMed] [Google Scholar]
- 36.Ke S, et al. A majority of m6A residues are in the last exons, allowing the potential for 3′ UTR regulation. Genes Dev. 2015;29:2037–2053. doi: 10.1101/gad.269415.115. [DOI] [PMC free article] [PubMed] [Google Scholar]
- 37.Di Giammartino DC, Nishida K, Manley JL. Mechanisms and consequences of alternative polyadenylation. Mol Cell. 2011;43:853–866. doi: 10.1016/j.molcel.2011.08.017. [DOI] [PMC free article] [PubMed] [Google Scholar]
- 38.Berkovits BD, Mayr C. Alternative 3′ UTRs act as scaffolds to regulate membrane protein localization. Nature. 2015;522:363–367. doi: 10.1038/nature14321. [DOI] [PMC free article] [PubMed] [Google Scholar]
- 39.Misra A, Ou J, Zhu LJ, Green MR. Global promotion of alternative internal exon usage by mRNA 3′ end formation factors. Mol Cell. 2015;58:819–831. doi: 10.1016/j.molcel.2015.03.016. [DOI] [PMC free article] [PubMed] [Google Scholar]
- 40.Shi Y, Manley JL. The end of the message: multiple protein-RNA interactions define the mRNA polyadenylation site. Genes Dev. 2015;29:889–897. doi: 10.1101/gad.261974.115. [DOI] [PMC free article] [PubMed] [Google Scholar]
- 41.Nelles DA, et al. Programmable RNA tracking in live cells with CRISPR/Cas9. Cell. 2016;165:488–496. doi: 10.1016/j.cell.2016.02.054. [DOI] [PMC free article] [PubMed] [Google Scholar]
- 42.Chen K, Zhao BS, He C. Nucleic acid modifications in regulation of gene expression. Cell Chem Biol. 2016;23:74–85. doi: 10.1016/j.chembiol.2015.11.007. [DOI] [PMC free article] [PubMed] [Google Scholar]
- 43.Lianoglou S, Garg V, Yang JL, Leslie CS, Mayr C. Ubiquitously transcribed genes use alternative polyadenylation to achieve tissue-specific expression. Genes Dev. 2013;27:2380–2396. doi: 10.1101/gad.229328.113. [DOI] [PMC free article] [PubMed] [Google Scholar]
- 44.Chan CT, et al. Identification of N6,N6-dimethyladenosine in transfer RNA from Mycobacterium bovis Bacille Calmette-Guérin. Molecules. 2011;16:5168–5181. doi: 10.3390/molecules16065168. [DOI] [PMC free article] [PubMed] [Google Scholar]
- 45.Livak KJ, Schmittgen TD. Analysis of relative gene expression data using real-time quantitative PCR and the 2(−ΔΔCT) method. Methods. 2001;25:402–408. doi: 10.1006/meth.2001.1262. [DOI] [PubMed] [Google Scholar]
- 46.Sigova AA, et al. Divergent transcription of long noncoding RNA/mRNA gene pairs in embryonic stem cells. Proc Natl Acad Sci USA. 2013;110:2876–2881. doi: 10.1073/pnas.1221904110. [DOI] [PMC free article] [PubMed] [Google Scholar]
- 47.Trapnell C, Pachter L, Salzberg SL. TopHat: discovering splice junctions with RNA-seq. Bioinformatics. 2009;25:1105–1111. doi: 10.1093/bioinformatics/btp120. [DOI] [PMC free article] [PubMed] [Google Scholar]
- 48.Trapnell C, et al. Transcript assembly and quantification by RNA-seq reveals unannotated transcripts and isoform switching during cell differentiation. Nat Biotechnol. 2010;28:511–515. doi: 10.1038/nbt.1621. [DOI] [PMC free article] [PubMed] [Google Scholar]
- 49.Huang da W, Sherman BT, Lempicki RA. Bioinformatics enrichment tools: paths toward the comprehensive functional analysis of large gene lists. Nucleic Acids Res. 2009;37:1–13. doi: 10.1093/nar/gkn923. [DOI] [PMC free article] [PubMed] [Google Scholar]
- 50.Müller S, et al. APADB: a database for alternative polyadenylation and microRNA regulation events. Database (Oxford) 2014;2014:bau076. doi: 10.1093/database/bau076. [DOI] [PMC free article] [PubMed] [Google Scholar]
- 51.Roost C, et al. Structure and thermodynamics of N6-methyladenosine in RNA: a spring-loaded base modification. J Am Chem Soc. 2015;137:2107–2115. doi: 10.1021/ja513080v. [DOI] [PMC free article] [PubMed] [Google Scholar]
- 52.Lewis BP, Burge CB, Bartel DP. Conserved seed pairing, often flanked by adenosines, indicates that thousands of human genes are microRNA targets. Cell. 2005;120:15–20. doi: 10.1016/j.cell.2004.12.035. [DOI] [PubMed] [Google Scholar]
- 53.Ule J, et al. An RNA map predicting Nova-dependent splicing regulation. Nature. 2006;444:580–586. doi: 10.1038/nature05304. [DOI] [PubMed] [Google Scholar]
- 54.Dittmar KA, et al. Genome-wide determination of a broad ESRP-regulated posttranscriptional network by high-throughput sequencing. Mol Cell Biol. 2012;32:1468–1482. doi: 10.1128/MCB.06536-11. [DOI] [PMC free article] [PubMed] [Google Scholar]
- 55.Anderson ES, et al. The cardiotonic steroid digitoxin regulates alternative splicing through depletion of the splicing factors SRSF3 and TRA2B. RNA. 2012;18:1041–1049. doi: 10.1261/rna.032912.112. [DOI] [PMC free article] [PubMed] [Google Scholar]
Associated Data
This section collects any data citations, data availability statements, or supplementary materials included in this article.
Supplementary Materials
Supp. Figures
Supp. Table 1
Supp. Table 2
Supp. Table 3
Supp. Table 4
Supp. Table 5