Quiescence unveils a novel mutational force in fission yeast (original) (raw)
Abstract
To maintain life across a fluctuating environment, cells alternate between phases of cell division and quiescence. During cell division, the spontaneous mutation rate is expressed as the probability of mutations per generation (Luria and Delbrück, 1943; Lea and Coulson, 1949), whereas during quiescence it will be expressed per unit of time. In this study, we report that during quiescence, the unicellular haploid fission yeast accumulates mutations as a linear function of time. The novel mutational landscape of quiescence is characterized by insertion/deletion (indels) accumulating as fast as single nucleotide variants (SNVs), and elevated amounts of deletions. When we extended the study to 3 months of quiescence, we confirmed the replication-independent mutational spectrum at the whole-genome level of a clonally aged population and uncovered phenotypic variations that subject the cells to natural selection. Thus, our results support the idea that genomes continuously evolve under two alternating phases that will impact on their size and composition.
Research organism: S. pombe
Introduction
The causes and consequences of spontaneous mutations have been extensively explored. The major sources include errors of DNA replication and DNA repair and the foremost consequences are genetic variations within a cell population that can lead to heritable diseases and drive evolution. The knowledge of the rate and spectrum of spontaneous mutations is also very informative and of fundamental importance to understand their origin. During cell division, fluctuation assay (Luria and Delbrück, 1943; Lea and Coulson, 1949) and more direct measurements using next generation sequencing, including mutation accumulation (MA) (Halligan and Keightley, 2009) and de novo mutations (Conrad et al., 2011) improved the mutation rate estimations expressed as the number of spontaneous mutations per cell division and led to the definition of their spectrum in many species (Behringer and Hall, 2015; Farlow et al., 2015; Zhu et al., 2014). During growth, most of the mutations are due to DNA replication errors. When the mutation is neutral or beneficial, it can be fixed in the population during subsequent generations. Conversely, when the mutation is disadvantageous it most often rapidly counter selected. The replication-dependent mutations define a spectrum quite similar among species, with the domination of Single Nucleotide Variants (SNVs) over Insertions/Deletions (Indels) and Structural Variants (SVs). For instance, preference for insertions at the expense of deletions along with a universal substitution bias toward AT has been frequently reported during cell division (Hershberg and Petrov, 2010; Lynch, 2010). At the evolutionary timescale, the mutations accumulate as a linear function of time (Zuckerkandl and Pauling, 1962). However, the mutation rate is not constant and depends on the generation time, the efficiency of the DNA damage protection, the accuracy of DNA repair and the selective environment. In the past decades, it has become increasingly evident that mutations also arise during cell cycle arrest, slow growth or under stress. Many genetic studies on E. coli and budding yeast used the term ‘adaptive mutation’ (Drake, 1991; Foster, 1999) as they used non-lethal selective conditions for an essential amino acid, nucleotide or antibiotic. An important notion related to adaptive mutation is that stress conditions may increase mutations and trigger accelerated evolution (Yaakov et al., 2017; Long et al., 2016; Rosenberg, 1997; Hicks et al., 2010; Holbeck and Strathern, 1997). A more recent notion is that a bacterial subpopulation of phenotypic variants called ‘persisters’ are more resistant to stress conditions suggesting that they precede adaptive mutations (for review (Harms et al., 2016)), a notion that was also found in budding yeast (Yaakov et al., 2017). The survival of ‘persisters’ to a large range of stress conditions can be explained by a reduced growth rate and metabolism. In addition, life alternates between periods of cell division and quiescence. During quiescence, the main replication-dependent source of mutations is not applicable but others remain, such as DNA repair errors, that may potentially improve the chance of survival. In other words, the respective fitness of cell division and quiescence might alternatively subject organisms to natural selection. In this regard, the extent of the impact of replication-independent mutations on the overall mutation load and evolution is mostly unknown (Gao et al., 2016). Hence, because of its mechanistic difference, a replication-independent mutational spectrum is expected to exhibit a different signature.
Quiescence is a common cell state on earth (Lewis and Gattie, 1991). In metazoan, stem cells alternate between variable periods of growth and quiescence depending on the period of development and the type of tissues. For the unicellular fission yeast, Schizosaccharomyces pombe, removing nitrogen triggers mating of opposite mating-types followed by meiosis. However, when the population is composed of only one mating-type they arrest in the G1-phase and rapidly enter into quiescence with a 1C content (Nurse and Bissett, 1981). In these conditions, the cells remain viable for months given the medium is refreshed every other week. They are metabolically active, exhibit stress-responsive signaling and are highly efficient in DNA damage repair (Mochida and Yanagida, 2006; Yanagida, 2009; Ben Hassine and Arcangioli, 2009; Marguerat et al., 2012; Gangloff and Arcangioli, 2017). Thus, quiescence in fission yeast is defined under a simple nutritional change so that studies can be reproduced and interpreted rigorously.
Here, we report the accumulation and spectrum of spontaneous mutations that arise in the quiescent phase of fission yeast. The growth and quiescence mutational spectra exhibit quantitative and qualitative differences that further explore the genetic potential of the genome. We named the new quiescence mutational spectrum ‘Chronos’ the personification of time in Greek mythology.
Results
In all our experiments, a prototrophic progenitor fission yeast strain is grown in minimal medium (MM) (Mitchison, 1970) prior to transfer into MM lacking nitrogen at a cell density of 106 cells per milliliter. After two divisions, a majority of the cells arrests in the G1 phase and enters into the G0 quiescent state. To determine the homogeneity of the cell population during quiescence, we analyzed the size and the proportion of cells exhibiting a septum during 15 days (Table 1). The cell-size (7–14 μm) and proportion of cells with a septum (~10%) observed during vegetative growth abruptly decrease after 1 day of quiescence, with more than 99,9% of septum free cells measuring 4 μm. During the following days of quiescence, the proportion of cells containing a septum dropped below 1 in 20,000 cells. This result indicates that the proportion of cells dividing or replicating during quiescence is very low. The efficiency and accuracy of the repair of DNA lesions in quiescence remain unknown, and lesions can be converted into mutations either during quiescence or when cells re-enter the vegetative cycle. We determined the mutation frequencies by plating samples of quiescent cultures after 1, 4, 8, 11 or 15 days in MM lacking nitrogen onto rich medium containing 5-fluoroorotic acid (5-FOA) that allows the recovery of _ura4_- and _ura5_- loss-of-function mutants (Grimm et al., 1988). We ascertained that the ura4∆ mutants remain viable for two weeks of quiescence, indicating that colonies resistant to 5-FOA (FOAR) emerging early are not biased by selection (Figure 1) and that our phenotypic accumulation assay is unbiased during the course of the experiment. FOAR colonies were scored and their DNA isolated for mutational spectrum analysis by Sanger sequencing. At day 1, a large fraction of FOAR colonies derive from replicative mutations that have appeared during the last rounds of DNA replication prior or during entry into quiescence and are capable of surviving two to three generations on media lacking uracil. Because of the fluctuation caused by the timing of mutation appearance in lineages (Luria and Delbrück, 1943), a mutation can be found multiple times in a population. To assess the mutational spectra in growth and quiescence, mutations found more than once in a clonal population were discarded (Supplementary files 1). The frequency of non-redundant FOAR mutations at day 1 ranges from 1 to 3 × 10⁻⁷ across the various independent experiments (Figure 2A). We next analyzed their spectrum at day one by Sanger sequencing the respective ura4- or ura5- mutated gene. If every substitution occurs with an equal probability, we should observe one transition per two transversions. We found a 1:2.18 ratio, with a mutational bias towards the enrichment of A/T (3.71, Table 2) due to the high frequency of C:G to T:A transitions and G:C to T:A transversions (Figure 2B and Figure 2—figure supplement 1). Interestingly, as previously observed (Behringer and Hall, 2015; Farlow et al., 2015; Zhu et al., 2014) the CpG dinucleotides are found among the top mutated dinucleotides in ura4 and ura5 (Figure 2—figure supplement 2) a feature difficult to understand in the absence of cytosine methyl transferase in fission yeast. Among the _ura4_- and _ura5_- FOAR mutations, 72% are caused by Single Nucleotide Variants (SNVs) and 28% by insertions/deletions (indels) (Figure 2C). A slight bias for insertions is observed with a net gain of 269 bp for 24 events and loss of 334 bp for 16 events (Table 2), including two deletions of 165 and 95 base-pairs (Supplementary files 1). Overall, the mutation profile at day one is similar to published results in cycling cells for URA3 in budding yeast (Lang and Murray, 2008) and for ura4+ and ura5+ in fission yeast (Fraser et al., 2003).
Table 1. Proportion of septa observed among cycling and quiescent cells.
| Days | Number of cells | Number of Septa | Percentage |
|---|---|---|---|
| 0 | 1 400 | 136 | 9.71% |
| 1 | 3 500 | 5 | 0.14% |
| 4 | 10 500 | 0 | 0.00% |
| 6 | 16 000 | 2 | 0.01% |
| 8 | 14 000 | 0 | 0.00% |
| 12 | 26 000 | 0 | 0.00% |
| 15 | 26 250 | 0 | 0.00% |
Figure 1. Survival of _ura_- cells during two weeks of quiescence.

Wild-Type, ura4D18 cells and a 50% mixture of both cultures were put into quiescence and their survival was followed for two weeks. ura4D18 has no advantage compared to wild-type strain or mixed populations and the proportion of uracil auxotrophs is maintained constant for the two weeks.
Figure 2. Mutations accumulate as a function of time in quiescence.
(A) slopes of FOAR accumulation as a function of time in quiescence from two independent experiments, determined by the least squares regression (R2 = 0.99 for all mutations, R2 = 0.96 for SNVs and R2 = 0.80 for indels). (B) mutation spectrum established on 105 SNVs found in the ura4+ and ura5+ genes at day 1 and 146 at days 8 + 15. (C) distribution among indels and SNVs of the mutations that result in FOAR for ura4+ and ura5+ genes over time. (D) distribution of the various sizes of indels over time in quiescence. The numbers directly above the histograms indicate the number of events, while those on the top of the figure are the sum of all the events for each class. The numbers at the bottom indicate the size range of the indels.
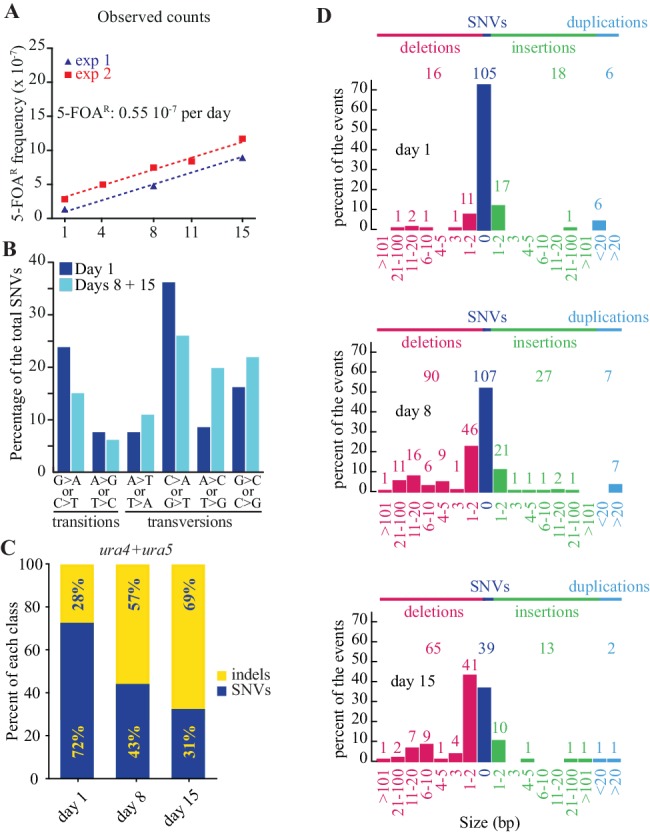
Figure 2—figure supplement 1. SNVs distribution. .

(A) Mutation spectrum established on 105 SNVs found in the ura4+ and ura5+ genes at day 1 and 146 at days 8 + 15 (from Fig. Figure 2B). (B) Same as in A, but normalized to the total number of relevant scorable base pairs. (C) Counts of all possible STOP and nonsense mutations for each substitution in ura4 and ura5..
Figure 2—figure supplement 2. Normalized percentage of each dinucleotide in the open reading frames of ura4+ and ura5+after one day in quiescence.

The percentage of every dinucleotide mutated at day one is compared to the frequency of occurrence of the same dinucleotide in the respective open reading frame.
Table 2. Type of mutation and AT bias found in ura4 and ura5 mutants at various time points of quiescence.
| day 1 | day 8 | day 15 | day 8+15 | |
|---|---|---|---|---|
| # of SNVs | 105 | 107 | 37 | 144 |
| Ts | 33 | 26 | 5 | 30 |
| Tv | 72 | 81 | 34 | 116 |
| Ts:Tv | 1:2.18 | 1:3.12 | 1:6.67 | 1:3.70 |
| To A or to T | 63 | 45 | 15 | 60 |
| To C or to G | 17 | 30 | 8 | 38 |
| AT bias | 3.71 | 1.50 | 1.88 | 1.58 |
| # of indels | 40 | 139 | 86 | 220 |
| # of deletions | 16 | 99 | 71 | 170 |
| lost bases | 334 | 864 | 907 | 1771 |
| # of insertions | 24 | 35 | 15 | 50 |
| gained bases | 269 | 401 | 99 | 500 |
| net loss | 65 | 463 | 808 | 1271 |
| # of deletions / # of insertions | 0.7 | 2.8 | 4.7 | 3.4 |
| average loss per event | 21 | 9 | 13 | 10 |
| average gain per event | 11 | 11 | 7 | 10 |
During quiescence, the total number of mutations (including redundant ones) resulting in FOAR colonies increases linearly as a function of time. From multiple experiments, we used least squares regression to determine that the slope is 0.55 × 10⁻⁷ FOAR mutants per day spent in quiescence (Figure 2A). Importantly, we observed that the number of redundant mutations dramatically fades over time, indicating that novel mutations arise in quiescence (Supplementary files 1). Days 8 and 15 are not statistically different for the Ts:Tv and AT bias (chi2 test) and were therefore combined. Day 1 is statistically different from days 8 + 15 (Ts/Tv: p<0.05; AT bias: p<0.05 by chi2 tests). The ratio of transition-to-transversion observed at days 8 + 15 of quiescence was reduced from 1:2.18 to 1:3.7 and the mutational bias toward A/T decreased (3.71 vs 1.58, Table 1). This is mainly due to a relative decrease of the G:C to A:T transitions that is balanced by an increase of the A:T to C:G and G:C to C:G transversions (Figure 2B and Figure 2—figure supplement 1). During two weeks of quiescence, the proportion of de novo indels increases from 28% at day 1 to 57% and 69% after 8 and 15 days, respectively (Figure 2C) to outnumber the SNVs (Figure 2C and D) (day 1 vs days 8 + 15: p<10−10, chi2 test). Altogether, we found more deletions than insertions (in days 8 + 15: p<10−5, chi2 test) with a net loss of 1771 bp in 170 mutants and a gain of 500 bp in 50 mutants (Figure 2D, Table 2). The main class of indels is ±1 bp and accounts for roughly half the events (Figure 2D). More than one half of the indels occur within homonucleotide runs and several mutations are complex (Supplementary files 1). Collectively, we found a phenotypic mutation rate of 0.55 × 10⁻⁷ FOAR colonies per day of quiescence with 0.14 × 10⁻⁷ FOAR colonies per day due to SNVs and 0.41 × 10⁻⁷ FOAR colonies per day due to indels (Figure 3A,B). Thus, the mutational spectra of growth and quiescence exhibit striking quantitative and qualitative differences. First, elevated levels of indels are generated. Second, two recent MA studies (Behringer and Hall, 2015; Farlow et al., 2015) with fission yeast have shown that in cycling cells insertions outnumber deletions, whereas we observe the reverse in quiescence (Figure 2D). Thus, growth and quiescence apply opposite pressures on the S. pombe genome size. Third, during cell divisions, SNVs elevate the genomic A/T composition (Hershberg and Petrov, 2010; Lynch, 2010). This bias is reduced during quiescence and counteracts the universal A/T enrichment observed during cell division. This suggests that, in addition to the previously recognized meiotic recombination, gene conversion, nucleotide modifications or transposition, the equilibrium of size and composition of the S. pombe genome also depends on the relative strength of the opposing forces applied during growth and quiescence.
Figure 3. FOAR accumulation and corrected counts.
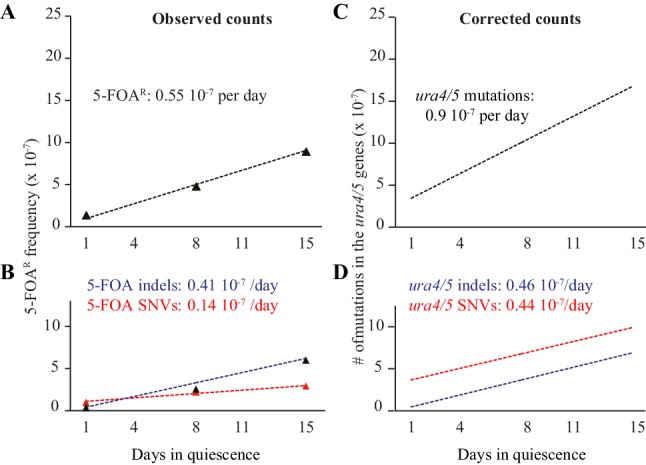
(A) slope of FOAR (as determined in Figure 2A). (B) slopes of FOAR SNVs and indels accumulation. (C) corrected counts determined on all experimental points using least squares regression (D) corrected slopes for SNVs and indels formation in the ura4+ and ura5+ genes.
A possible caveat of our study is that FOA is known to perturb the metabolism of uracil and thymidine and might thus impact differently the mutational spectra of growing and quiescent cells. To evaluate this issue, a yeast cell population was maintained during 6 days in quiescence, and one half of the culture (1.2 108 cells) was directly plated onto FOA plates while the other half was allowed to divide once in rich medium prior to plating. Note that we plated and sequenced all the FOAR mutants present in the culture, allowing to identify all the mutations. The experiment was performed after six days of quiescence when the proportion of quiescent mutations is elevated and the exit of quiescence is still synchronous. We obtained (i) 27 FOAR, including 8 SNVs and 19 Indels when quiescent cells are directly plated on FOA (ii) 56 FOAR when cells are allowed to divide once (iii) 40 mutations appeared as pairs of mutations, including 2 × 9 SNVs and 2 × 11 Indels and 16 unique mutations, including 7 SNVs and 9 Indels (iv) All mutations exhibit the quiescence mutational profile, indicating that the FOA drug does not significantly impact on the mutation spectrum of quiescent or dividing cells (Table 3). The 16 unique mutations suggest a frequent heterozygosity of the mutations that can be revealed only after cell division.
Table 3. Sequencing analysis of all the FOAR colonies recovered after 6 days of quiescence.
| SNVs | Indels | Insertions | Deletions | ||
|---|---|---|---|---|---|
| No division | Singles | 8 | 19 | 2 | 17 |
| Pairs | NA | NA | NA | NA | |
| One division | Singles | 7 | 9 | 3 | 6 |
| Pairs | 9 | 11 | 2 | 9 |
We have developed two new methods based on a likelihood framework to infer the total mutation count from the measured 5-FOAR phenotypic mutation rate (methods 1 and 2). We have also computed the total mutation count from a previously proposed method (here method 3)(Drake, 1991; Lang and Murray, 2008), (Materials and methods). For the sake of clarity, we report the corrections obtained using method 1, but provide in parenthesis inferences from the two other methods. When applied to the ura4+/5+ genes together, we found that the corrected number of mutations per day is 0.93 × 10⁻⁷ taking into account the mutations that do not result in a 5-FOAR phenotype (1.86 or 1.24 10−7 from methods 2 or 3). When applied to SNVs and indels, we found very similar slopes of 0.46 × 10⁻⁷ and 0.47 × 10⁻⁷, respectively (Figure 3D, Table 4) (1.27:0.59 and 0.50:0.74 10−7 using methods 2 and 3). Next, we used this method to extrapolate the number of mutations in the quiescent genome. We expected to find 0.93 × 10⁻⁷/1400 (nucleotides of ura4 +ura5) x 14 × 106 (nucleotides in the S. pombe genome)=0.93×10⁻³ mutations per genome per day (1.86 and 1.24 10−3 using methods 2 and 3).
Table 4. Estimation of the fraction of non-synonymous SNVs that lead to a phenotype.
Table 4—source data 1. Estimation of the fraction of SNVs and Indels that leads to a phenotype.
Table 4—source data 2. Estimated mutation rates.
| ura4 | ura5 | Total | ||
|---|---|---|---|---|
| (265 Aa) | (216 Aa) | (481 Aa) | ||
| Potential SNVs | Synonymous | 530 (0.22) | 443 (0.23) | 973 (0.22) |
| Non-synonymous | 1739 (0.73) | 1405 (0.72) | 3144 (0.73) | |
| STOPs | 116 (0.05) | 96 (0.05) | 212 (0.05) | |
| Observed SNVs | Synonymous | 3 (0.03) | 2 (0.03) | 5 (0.03) |
| Non-synonymous | 74 (0.69) | 58 (0.73) | 132 (0.71) | |
| STOPs | 29 (0.27) | 19 (0.24) | 48 (0.26) | |
| Non-coding | 1 (0.01) | 0 (0.00) | 1 (0.00) | |
| Different mutations per Aa | (41,13,3) | (23,7,5,0,0,1) | (64,20,8,0,0,1) | |
| Independent identical mutations per non-syn SNV | (64,9,1) | (41,11,2,1,1,0,1, 0,1) | (105,20,3,1,1,0,1, 0,1) | |
| Method 1 | Essential Aa (ML) | 124 | 54 | 170 |
| (Essential Aa) | [CI 95%] | [93,202] | [43,81] | [140,228] |
| f | 0.47 | 0.25 | 0.35 | |
| [CI 95%] | [0.35,0.76] | [0.20,0.38] | [0.29,0.47] | |
| Method 2 | Essential NS (ML) | 296 | 88 | 276 |
| (Non-Syn) | [CI 95%] | [195,394] | [73,118] | [228,362] |
| f | 0.17 | 0.06 | 0.09 | |
| [CI 95%] | [0.11,0.23] | [0.05,0.08] | [0.07,0.12] | |
| Method 3 | # STOPs among all potentials STOPs | 0.25 | 0.20 | 0.23 |
| (LM08) | f | 0.17 | 0.21 | 0.19 |
To extend our observations made on FOAR mutations to the whole genome, we analyzed the mutation spectrum in cells that survived for 3 months of quiescence. For long-term experiments, we changed the medium every other week to maintain oligo elements and glucose as well as to prevent the survivors to feed on the nitrogen released by dead cells. In these conditions, the viability at 3 months is about 0.05% (Figure 4). From several experiments, we observed a biphasic viability curve, with a cell death acceleration after three weeks of quiescence (Figure 4). DNA from 243 colonies was purified. Illumina libraries were constructed and paired-end sequenced with an average coverage above 50x to maintain high quality sequences and a low false discovery rate (FDR) that was experimentally validated (see Material and methods). SNVs and short indels were determined using Genome Analysis Toolkit (GATK) (McKenna et al., 2010; DePristo et al., 2011; Van der Auwera et al., 2013), and we combined the output of several tools including SOAPindel, Prism and Pindel (Li et al., 2013; Jiang et al., 2012; Ye et al., 2009) to increase the sensitivity of indels detection. We performed a stringent calling procedure for both SNVs and indels and we only considered variants that are present in at least 40% of the reads with a local coverage above 10x. Sanger sequencing was used to validate the de novo variants and to estimate the FDR.
Figure 4. Survival curves (red: linear; blue: log) of prototrophic cells in G0 as a function of time.

The medium is being replaced every other week starting at day 15, while an aliquot is plated out to monitor the viability. The standard error of the experiments is indicated.
We report 149 unique mutations, including 72 SNVs and 77 indels from the 243 sequenced genomes (Table 5 and Supplementary files 2). Although low, 0.61 mutations per genome after three months, is 3.5–7 times higher than anticipated by our projection (0.084 to 0.17 mutations/genome/three months, depending on the correction method), indicating that this process may not be linear for extended periods of time, as suggested by the viability curve (Figure 4). Among the 59 SNVs involved in the AT bias, we found an AT/GC ratio bias of 1.27, a value intermediates between 1.84 at day 1 or 1.1 at days 8 + 15. This value is higher than those observed in our targeted experiments, but lower than in cycling cells. Among the 77 indels, all the events detected with GATK were found as well with either Pindel, SOAPindel or Prism (Li et al., 2013; Jiang et al., 2012; Ye et al., 2009). Among these indels, 26 are deletions (25/77–35%), a value two times greater than reported in MA lines of cycling cells (14%–17%) (Behringer and Hall, 2015; Farlow et al., 2015). Consistent with what was observed in the FOAR study, over 62% (48/77) of the insertions and deletions are ±1 nucleotide. With respect to genome size, the 77 indels led to the net loss of 215 (511-296) nucleotides. We also analyzed the distribution of the number of mutations (143) per genome (237) that fits perfectly a Poisson distribution. We removed from the calculation the six mutated strains that were screened for phenotypic analysis, see below (Figure 5). This result shows that a unique mutational force, equally affecting all genomes, is at work during quiescence. The long-term quiescence experiment results support (i) the comparable amounts of indels and SNVs predicted in our estimation (Figure 6) (ii) that the proportion of deletions among indels is higher than in MA lines of cycling cells, with more nucleotides lost than gained (iii) over 62% of the deletions/insertions are ±1 events. Altogether, quiescence in fission yeast reveals Chronos as a new genetic force generating similar proportion of SNV and Indels, together with an enrichment of deletions.
Table 5. Type of mutation in whole genomes after 3 months in quiescence.
| Variants | # |
|---|---|
| # of SNVs | 72 |
| Ts | 26 |
| Tv | 46 |
| Ts:Tv | 1:21.77 |
| to A or T | 33 |
| to C or G | 26 |
| AT bias | 1.27 |
| # of indels | 77 |
| # of deletions | 27 |
| lost bases | 511 |
| # of insertions | 50 |
| gained of bases | 296 |
| net loss | 215 |
| # of deletions / # of insertions | 0.54 |
| average loss per event | 19.6 |
| average gain per event | 5.92 |
Figure 5. Distribution of mutations among the 237 genomes sequenced.
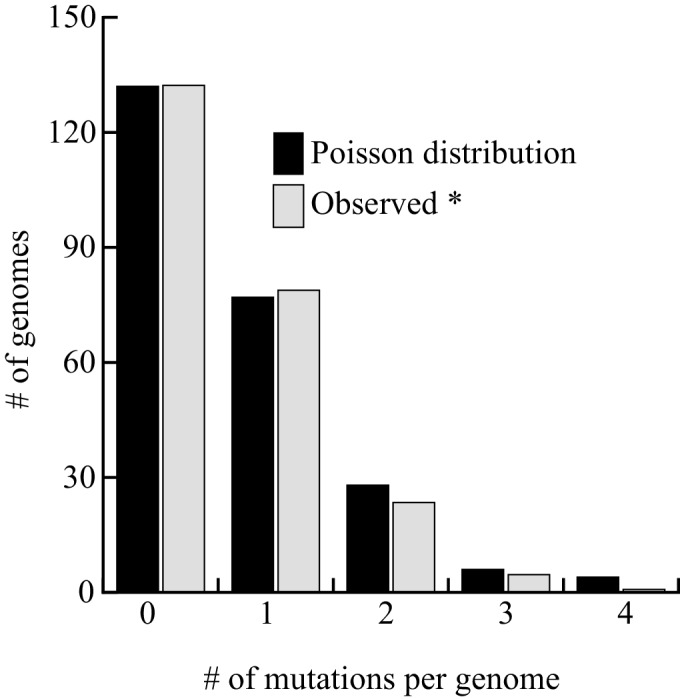
The six strains exhibiting a phenotype were excluded from the analysis. The fit between the observed and theoretical Poisson distribution indicates that Chronos acts homogeneously on genomes over time. The goodness of fit is excellent (Pchi2 = 0.56).
Figure 6. Corrected versus observed proportions of Indels.
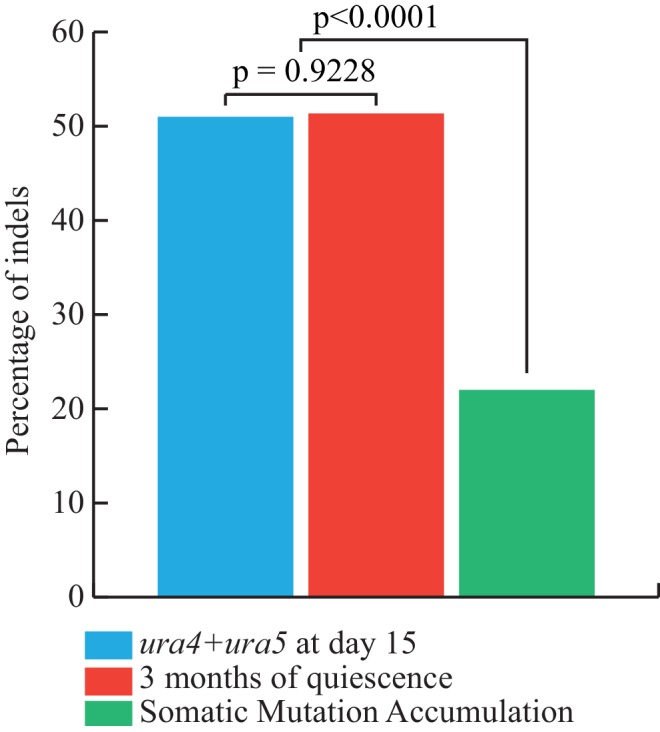
In blue, we report the percentage of Indels expected from the FOA experiments, that is the ratio of the estimated slopes of accumulation of INDELS and SNVs (using method 1). In red, the observed fraction of INDELS after 3 months of quiescence. In green, the observed fraction of INDELs in the MA lines from (Farlow et al., 2015) P-values are computed using homogeneity chi2 tests.
The level of mutations that we have observed after three months in quiescence is likely to cause some heritable phenotypic diversity. Therefore, we conducted a phenotypic survey in conditions that affect a broad range of cellular functions. We did not observe any phenotype upon examination of 384 colonies after 1 day or 1 month of quiescence. However, after 2 and 3 months, we observed 4/376 (1.1%) and 6/334 (1.8%) colonies displaying phenotypes (Table 6), respectively. Genetic crosses confirmed that the phenotype observed in the 10 colonies derives from a single mutated locus. We sequenced the genomes of the six strains isolated after three months and found mutations mapping to alg5, alg8, aur1, ccc2, gdi1 and oca8 genes. These genes encode for cell wall and vacuole/membrane trafficking functions that might improve viability during quiescence. Taken together, we conclude that cellular quiescence allows for genetic variation.
Table 6. Phenotypic alterations as a function of time spent in quiescence.
| Time | # of colonies w/phenotype | 18°C | 37°C | KCl 1M | Ca(NO3)2 0.15M | CaCl20.3M | TBZ 15 μg/ml | HU 4 mM | SDS 0.01% |
|---|---|---|---|---|---|---|---|---|---|
| in G0 | |||||||||
| 1 day | 0/384 | - | - | - | - | - | - | - | - |
| 1 month | 0/384 | - | - | - | - | - | - | - | - |
| 2 months | 4/376 | - | - | 1 | 1 | 4 | - | - | - |
| 3 months | 6/334 | 1 | 1 | 1 | 1 | 3 | 3 | 2 | 1 |
Discussion
Extensive work has shown that quiescence is a well-controlled and conserved process (Yanagida, 2009; Lee et al., 1988; Petersen and Hagan, 2005). Two recent studies on RNA interference and telomere stability have highlighted the importance of quiescence for chromosome biology (Maestroni et al., 2017; Roche et al., 2016). Our experimental conditions generate a homogenous quiescent cell population that remains stable during the mutation accumulation experiments. However, we cannot exclude that a very low proportion (<10−4) of cells are able to divide during quiescence. For instance, it is possible that persister cells, as observed during vegetative growth in budding yeast (Yaakov et al., 2017), will not arrest in nitrogen starvation conditions and attempt to replicate and divide later on during quiescence. If these replicating cells were generating the FOAR mutants observed during quiescence, we will have to conclude that they generate 1000 times more mutations per replication. Double-strand break (DSB) repair is a process that could generate this level of mutations (Hicks et al., 2010; Holbeck and Strathern, 1997). Nevertheless, these rare replicating cells will have to divide at a constant rate during time in quiescence. Additionally, the number and the distribution of mutations per genome observed in the three months aged cells is hardly compatible with this hypothesis. Therefore, we favor the Chronos model where DNA lesions (not excluding DSBs) that are arising during quiescence (Mochida and Yanagida, 2006; Ben Hassine and Arcangioli, 2009) are repaired with errors that generate mutations with time.
If the mutations are not generated by errors during DNA replication, what are the mechanism(s) underlying Chronos? As a first attempt, we investigated the involvement of the translesion DNA synthesis (TLS) pathway. We found that the Pcn1-K164R mutant (Coulon et al., 2010) that cannot switch from replicative to TLS mode accumulates only slightly more of FOAR mutants than wt and displays the Chronos profile (Figure 7). Thus, the participation of the TLS pathway in the mutational signature of quiescence is modest. Further investigations of the DNA repair pathways at work during quiescence are needed not only to provide information on the importance of each DNA repair pathway but also valuable insights into physiological source of the spontaneous DNA lesions in quiescence.
Figure 7. Mutation rate and spectrum in pcn1-K164R mutant strain.

(A) Survival curves in G0 of 3 independent prototrophic pcn1-K164R clones as a function of time. The standard error is indicated. (B) Frequency with standard error and slope of FOAR accumulation in G0 of 3 independent pcn1-K164R clones. The R square value is indicated. (C) Table and (D) graphical representation of the distribution among SNVs and indels of the ura4 and ura5 mutations accumulating over time in pcn1-K164R quiescent cells. The total number of the non-redundant events analyzed is indicated in the table.
Initially, Luria and Delbruck (Luria and Delbrück, 1943) expressed the mutation rate per unit time, that was transformed to per generation later by Lea and Coulson (Lea and Coulson, 1949). Now, the common assumption is that the overall mutation rate and spectrum accompanying cell division is combining errors occurring during DNA replicating and/or repair. It was recently proposed that inefficiently repaired lesions increase according to absolute time (Gao et al., 2016). Our work proposes that quiescence is a genetic active state that participates to the mutation fraction that is expressed in unit of time. Thus, S. pombe genome fluctuates between two mutational spectra, which alternatively expose the genome to natural selection that progressively shapes its composition, size and ability. During growth, the universal substitution bias toward AT preference along with the domination of insertions over deletion have been reported in numerous studies (Hershberg and Petrov, 2010; Lynch, 2010). The fact that the replication-driven mutational bias has not yet reached an equilibrium strongly suggests the existence of forces capable of counterbalancing it. Here we propose that Chronos is this novel mutational force that impact on the genetic material. Separate and alternate modes of mutagenesis and selection allow compensatory mutations to arise in one phase of the life cycle and fuel the phenotypic evolution simultaneously into the subsequent phase, a notion that might impact on germ cells genetics. On the contrary, the super-housekeeping genes (Yanagida, 2009) constrain evolution with a strong vector of conservation, since they are required for proliferation, quiescence and the transitions from one to the other (Williams and Williams, 1957).
The genetics of quiescence underscores the importance of a time-dependent process (Goldmann et al., 2016; Hazen et al., 2016; Kumar and Subramanian, 2002; Ségurel et al., 2014) to the overall mutation spectrum. This time-dependent process should also help to fine-tune the accuracy of the ‘molecular clock’ that measures, in units of time (dos Reis et al., 2016), the evolutionary distance of two closely related species with their common ancestor. Such hypotheses are accessible to experimental and modeling approaches and are of great interest for evolutionary, developmental and human-health perspectives.
Materials and methods
Strain and sanger sequencing of ura4 and ura5 mutants
The stable prototrophic M-smt0 PB1623 strain was used in all our experiments. We identified the FOAR mutant strains as _ura4_- and _ura5_- mutants by genetic crosses with a known ura4∆ strain, purified their DNA, PCR amplified the gene of interest, analyzed the PCR fragment by agarose gel electrophoresis and subjected it to Sanger sequencing.
Library construction and sequencing
Library construction and sequencing was performed by Illumina HiSeq 2500 following the manufacturer's instruction. Base calling was performed using CASAVA 1.9. For each strain, one insert size (ranging from 400 to 800 bp) library was constructed and sequenced. After initial quality control assessment with FastQC version 0.10.1 (Chen et al., 2012) fqCleaner (l = 80; q = 30) was used to trim the tails of the reads if the Phred quality dropped below 30.
Alignment-based assembly
We sequenced 12 strains per lane on an Illumina HiSeq 2500, aligned the resulting reads to the Schizosaccharomyces_ pombe.ASM294v2.23 DNA reference genome with BWA-MEM; version 0.7.5a. (Li and Durbin, 2009). SAMtools version 0.1.19 and Picard version 1.96 (http://picard. sourceforge.net) were used to process the alignment files and to mark duplicate reads. The coverage in our experiments ranges from 60 to 120, with an average of 80. SNVs and small indels were called using GATK version 2.7–2 (McKenna et al., 2010). We applied quality score recalibration, indel realignment, duplicate removal, and performed SNV and INDEL discovery and genotyping using standard filtering parameters or variant quality score recalibration according to GATK Best Practices recommendations (DePristo et al., 2011; Van der Auwera et al., 2013). In addition to the GATK analysis, we combined three programs, Pindel (Ye et al., 2009), Prism (Jiang et al., 2012), and SOAPindel (Li et al., 2013) dedicated to the detection of INDELs to search for additional variants not detected by GATK. Only variants detected at least 10-times in a sample and not found in any other strain sequenced from the same G0 pool were considered.
Filtering
For GATK, Pindel, Prism and SOAPindel analyses, only variants detected at least 10-times in a sample and not found in any other strain sequenced from the same G0 pool were considered. For GATK and indels detection, we have determined the FDR by Sanger sequencing on a larger set of previously sequenced strains. 20 random SNVs whose quality scores ranged from 21 to 1700 were analyzed. Only the lowest score (21; one occurrence) turned out to be a false positive, yielding an FDR of 0.05. Concerning the indels, all the variants detected by at least two approaches, including GATK, turned out to be true by Sanger sequencing. For the variants only detected by Prism, we sequenced 13 occurrences and found that only the two lowest scores (DP10) were false positives (FDR = 0.15). Pindel yielded the poorest yield of variants that were systematically true and called by at least one other program. SOAPindel called a large number of variants that were dispatched into five classes according to their type of output in the VCF file. We kept only the relevant calls labeled as HP = A_B or HP = X_N in the vcf file for which the FDR determined on 14 variants was 0.2143 (in the three other classes, 54 occurrences, only five were true and were not taken into account).
Miscellaneous
Template DNA fragments were hybridized to the surface of paired-end (PE) flow cells (HiSeq 2500 sequencing instruments) and amplified to form clusters using the Illumina cBotTM. Paired-end libraries were sequenced using 2 × 120 cycles of incorporation and imaging with Illumina SBS kits. For the HiSeq 2500, 2 × 101 cycles with SBS kits v3 were employed. Each library was initially run, assessing optimal cluster densities, insert size, duplication rates and comparison to chip genotyping data. Following validation, the desired sequencing depth (>60X) was then obtained. Real-time analysis involved conversion of image data to base-calling in real-time.
Estimation of the total mutation rate
The experimental assay based on 5-FOA resistance can be used to estimate the fraction of mutations that give rise to a phenotype. All the mutations that we have observed are single mutation events that invalidate either the ura4+ or ura5+ genes, hence resulting in the FOAR phenotype. We now want to infer the total mutation rate, both for SNVs and indels independently. We hypothesize that most indels will be deleterious to the genes and that therefore the total indel rate is close the observed indel rate that results in FOAR (for genes - 50% of the genome). On the contrary, many SNVs are likely to exhibit no phenotype and, therefore, we observe only a fraction of the total number of SNVs.
The gene model
As we only observe mutations among SNVs that lead to a phenotype, we have estimated the fraction f of non-synonymous SNVs that lead to a phenotype using three alternative methods. All three methods exploit different observations and lead to different estimators. As none seems obviously better than the two others, we report the three results in Table 4. In all three methods, the underlying gene model is the same and is indicated in Figure 8.
Figure 8. Schematic representation of a gene.

In all three methods, the gene model is the same. We observe only a subset of all possible SNVs (the back areas) among all SNVs that lead to a phenotype (the black and grey areas). All synonymous SNVs do not exhibit a phenotype. The methods aim at estimating the unknown proportion f of the non-synonymous SNVs that leads to a phenotype.
Method 1 – From the Aa saturation
The first method assumes that the non-synonymous SNVs that lead to a phenotype are evenly distributed among an unknown number ‘essential’ amino-acid (Aa). Whenever an essential Aa is mutated, there is a FOAR phenotype. We thus simply compute the observed distribution of the number of different mutations per Aa (from Table 4 -raw), from which we estimate the total number of essential Aa using maximum likelihood (see below). It thus assumes no mutational bias and uses the distribution of different mutations per Aa.
Method 2 – From the nucleotide saturation
The second method assumes that non-synonymous SNVs that lead to a phenotype can be targeted several times by independent mutations. Whenever one of them is mutated, there is a phenotype. We thus build the distribution of the number of independent recurrent mutations for each non-synonymous SNVs (from Table 4 -filtered), which is then used to estimate the total number of non-synonymous SNVs that lead to a phenotype using maximum likelihood (see below). It thus assumes no mutational bias and uses the distribution of independent identical mutations per non-synonymous SNV.
Method 3 – Lang and Murray (2008)
The last method, proposed by Lang and Murray (2008), equates the level of saturation of STOPs and non-synonymous mutations that lead to a phenotype. The level of saturation of STOPs is estimated by the fraction of STOPs that are reported (over the total number of possible STOPs). It thus assumes no mutational bias and uses the observed number of STOPs and non-synonymous SNVs.
Estimating the total number of targets from _k_-distribution by maximum likelihood
The model assumes that a set of k targets give rise to a phenotype once mutated (targets are either essential Aa –method 1-- or non-synonymous mutations with a phenotype –method 2--). All m mutations are uniformly distributed among the targets. Once all mutations are assigned, a target can have 0, 1 or more mutations. Only the number of non-mutated targets (0 hits) is unknown and therefore to be estimated. We estimated it by maximum likelihood using the distribution of mutations per target, hereafter the _k_-distribution.
We observe a total of m mutations uniformly distributed among the k targets, where target i has _m_i mutations:
As each mutation has a probability 1/k to occur at a particular target, the set of _m_i is given by the multinomial probability distribution:
We consider in our model that all targets are exchangeable. Defining _k_j, as the number of targets that have j substitutions, the number of exchangeable configurations is given by:
, where max is the highest observed number of mutation for a target. Therefore, the product of the two previous terms once rearranged, is the likelihood of the overall observed distribution of (k_1, k_2_, … k_max) given k:
P(k1,k2,...,kmax|k)=m!k!∏i=0maxki!(i!)ki×1km
with
and
We thus computed numerically the maximum likelihood estimate of k as well as its associated 95% credibility interval (Table S3).
How many SNVs can lead to a phenotype?
As we observe only SNVs that disrupt the function of the genes, we assumed that all synonymous substitutions have no phenotype, that all STOP substitutions do, as well as a fraction f of the non-synonymous SNVs. Mathematically, it is expressed as [PSTOP + f PNS], where PSTOP PNS are the proportions of STOP and Non-Synonymous mutations among all possible mutations.
How many indels can lead to a phenotype?
We further assumed that most insertions or deletions have phenotypes, except when the reading frame is kept intact. For these in-frame indels (which size is a multiple of 3), there is a phenotype only when an essential Aa (estimated by f) is deleted or disrupted by an insertion.
We retrieve the size distribution of indels and inflated the 3 bp indels (0.053 for URA4 and 0.019 for URA5) by a factor of 1/f and the 6bp indels (0.019 for URA4 and 0.0 for URA5) by a factor of 1/(1-(1 f)2). Larger insertions/deletions are all assumed to have a phenotype. Mathematically, it is expressed as 1/ [1 + P3nt / f + P6nt / (1-(1 f)2)], where P3nt P6nt are the proportions of indels of size 3nt or 6nt among all observed indels (Table 4—source data 1), in which the values for f were the ones estimated from Table 4 for each category. The estimated mutation rates are reported in Table 4—source data 2.
Acknowledgements
We thank Karl Ekwall and Stéphane Marcand for their critical reading of the manuscript. This work was supported by the grants ANR-13-BSV8-0018 and ANR-12-BSV7-0012 Demochips from the Agence Nationale de la Recherche (France) to BA and GA, respectively.
Funding Statement
The funders had no role in study design, data collection and interpretation, or the decision to submit the work for publication.
Contributor Information
Benoit Arcangioli, Email: barcan@pasteur.fr.
Naama Barkai, Weizmann Institute of Science, Israel.
Funding Information
This paper was supported by the following grant:
- Agence Nationale de la Recherche to Guillaume Achaz, Benoit Arcangioli.
Additional information
Competing interests
No competing interests declared.
Author contributions
Resources, Data curation, Software, Formal analysis, Supervision, Validation, Investigation, Methodology, Writing—review and editing.
Conceptualization, Resources, Data curation, Software, Formal analysis, Supervision, Validation, Investigation, Methodology, Writing—original draft.
Investigation, Methodology.
Resources, Software, Formal analysis, Investigation, Methodology.
Formal analysis, Investigation.
Investigation.
Conceptualization, Formal analysis, Supervision, Funding acquisition, Investigation, Methodology, Writing—original draft, Project administration, Writing—review and editing.
Additional files
Supplementary file 1. Position and nature of the alterations yielding 5-FOA resistant colonies in ura4+ and ura5+ genes.
Supplementary file 2. Mutations detected in the 243 colonies sequenced after 3 months in G0.
Transparent reporting form
Major datasets
The following dataset was generated:
Gangloff S, author. Quiescence pombe sequencing. 2017 http://www.ncbi.nlm.nih.gov/bioproject/413662 Publicly available at the NCBI BioProject database (accession no: PRJNA413662)
References
- Behringer MG, Hall DW. Genome-wide estimates of mutation rates and spectrum in Schizosaccharomyces pombe indicate CpG sites are highly mutagenic despite the absence of DNA methylation. Genes|Genomes|Genetics. 2015;6:149–160. doi: 10.1534/g3.115.022129. [DOI] [PMC free article] [PubMed] [Google Scholar]
- Ben Hassine S, Arcangioli B. Tdp1 protects against oxidative DNA damage in non-dividing fission yeast. The EMBO Journal. 2009;28:632–640. doi: 10.1038/emboj.2009.9. [DOI] [PMC free article] [PubMed] [Google Scholar]
- Chen CJ, Servant N, Toedling J, Sarazin A, Marchais A, Duvernois-Berthet E, Cognat V, Colot V, Voinnet O, Heard E, Ciaudo C, Barillot E. ncPRO-seq: a tool for annotation and profiling of ncRNAs in sRNA-seq data. Bioinformatics. 2012;28:3147–3149. doi: 10.1093/bioinformatics/bts587. [DOI] [PubMed] [Google Scholar]
- Conrad DF, Keebler JE, DePristo MA, Lindsay SJ, Zhang Y, Casals F, Idaghdour Y, Hartl CL, Torroja C, Garimella KV, Zilversmit M, Cartwright R, Rouleau GA, Daly M, Stone EA, Hurles ME, Awadalla P, 1000 Genomes Project Variation in genome-wide mutation rates within and between human families. Nature Genetics. 2011;43:712–714. doi: 10.1038/ng.862. [DOI] [PMC free article] [PubMed] [Google Scholar]
- Coulon S, Ramasubramanyan S, Alies C, Philippin G, Lehmann A, Fuchs RP. Rad8Rad5/Mms2-Ubc13 ubiquitin ligase complex controls translesion synthesis in fission yeast. The EMBO Journal. 2010;29:2048–2058. doi: 10.1038/emboj.2010.87. [DOI] [PMC free article] [PubMed] [Google Scholar]
- DePristo MA, Banks E, Poplin R, Garimella KV, Maguire JR, Hartl C, Philippakis AA, del Angel G, Rivas MA, Hanna M, McKenna A, Fennell TJ, Kernytsky AM, Sivachenko AY, Cibulskis K, Gabriel SB, Altshuler D, Daly MJ. A framework for variation discovery and genotyping using next-generation DNA sequencing data. Nature Genetics. 2011;43:491. doi: 10.1038/ng.806. [DOI] [PMC free article] [PubMed] [Google Scholar]
- dos Reis M, Donoghue PC, Yang Z. Bayesian molecular clock dating of species divergences in the genomics era. Nature Reviews Genetics. 2016;17:71–80. doi: 10.1038/nrg.2015.8. [DOI] [PubMed] [Google Scholar]
- Drake JW. Spontaneous mutation. Annual Review of Genetics. 1991;25:125–146. doi: 10.1146/annurev.ge.25.120191.001013. [DOI] [PubMed] [Google Scholar]
- Farlow A, Long H, Arnoux S, Sung W, Doak TG, Nordborg M, Lynch M. The Spontaneous Mutation Rate in the Fission Yeast Schizosaccharomyces pombe. Genetics. 2015;201:737–744. doi: 10.1534/genetics.115.177329. [DOI] [PMC free article] [PubMed] [Google Scholar]
- Foster PL. Mechanisms of stationary phase mutation: a decade of adaptive mutation. Annual Review of Genetics. 1999;33:57–88. doi: 10.1146/annurev.genet.33.1.57. [DOI] [PMC free article] [PubMed] [Google Scholar]
- Fraser JL, Neill E, Davey S. Fission yeast Uve1 and Apn2 function in distinct oxidative damage repair pathways in vivo. DNA Repair. 2003;2:1253–1267. doi: 10.1016/j.dnarep.2003.08.005. [DOI] [PubMed] [Google Scholar]
- Gangloff S, Arcangioli B. DNA repair and mutations during quiescence in yeast. FEMS Yeast Research. 2017;17:1–14. doi: 10.1093/femsyr/fox002. [DOI] [PubMed] [Google Scholar]
- Gao Z, Wyman MJ, Sella G, Przeworski M. Interpreting the dependence of mutation rates on age and time. PLOS Biology. 2016;14:e1002355. doi: 10.1371/journal.pbio.1002355. [DOI] [PMC free article] [PubMed] [Google Scholar]
- Goldmann JM, Wong WS, Pinelli M, Farrah T, Bodian D, Stittrich AB, Glusman G, Vissers LE, Hoischen A, Roach JC, Vockley JG, Veltman JA, Solomon BD, Gilissen C, Niederhuber JE. Parent-of-origin-specific signatures of de novo mutations. Nature Genetics. 2016;48:935–939. doi: 10.1038/ng.3597. [DOI] [PubMed] [Google Scholar]
- Grimm C, Kohli J, Murray J, Maundrell K. Genetic engineering of Schizosaccharomyces pombe: a system for gene disruption and replacement using the ura4 gene as a selectable marker. MGG Molecular & General Genetics. 1988;215:81–86. doi: 10.1007/BF00331307. [DOI] [PubMed] [Google Scholar]
- Halligan DL, Keightley PD. Spontaneous mutation accumulation studies in evolutionary genetics. Annual Review of Ecology, Evolution, and Systematics. 2009;40:151–172. doi: 10.1146/annurev.ecolsys.39.110707.173437. [DOI] [Google Scholar]
- Harms A, Maisonneuve E, Gerdes K. Mechanisms of bacterial persistence during stress and antibiotic exposure. Science. 2016;354:aaf4268. doi: 10.1126/science.aaf4268. [DOI] [PubMed] [Google Scholar]
- Hazen JL, Faust GG, Rodriguez AR, Ferguson WC, Shumilina S, Clark RA, Boland MJ, Martin G, Chubukov P, Tsunemoto RK, Torkamani A, Kupriyanov S, Hall IM, Baldwin KK. The complete genome sequences, unique mutational spectra, and developmental potency of adult neurons revealed by cloning. Neuron. 2016;89:1223–1236. doi: 10.1016/j.neuron.2016.02.004. [DOI] [PMC free article] [PubMed] [Google Scholar]
- Hershberg R, Petrov DA. Evidence that mutation is universally biased towards AT in bacteria. PLoS Genetics. 2010;6:e1001115. doi: 10.1371/journal.pgen.1001115. [DOI] [PMC free article] [PubMed] [Google Scholar]
- Hicks WM, Kim M, Haber JE. Increased mutagenesis and unique mutation signature associated with mitotic gene conversion. Science. 2010;329:82–85. doi: 10.1126/science.1191125. [DOI] [PMC free article] [PubMed] [Google Scholar]
- Holbeck SL, Strathern JN. A role for REV3 in mutagenesis during double-strand break repair in Saccharomyces cerevisiae. Genetics. 1997;147:1017–1024. doi: 10.1093/genetics/147.3.1017. [DOI] [PMC free article] [PubMed] [Google Scholar]
- Jiang Y, Wang Y, Brudno M. PRISM: pair-read informed split-read mapping for base-pair level detection of insertion, deletion and structural variants. Bioinformatics. 2012;28:2576–2583. doi: 10.1093/bioinformatics/bts484. [DOI] [PubMed] [Google Scholar]
- Kumar S, Subramanian S. Mutation rates in mammalian genomes. PNAS. 2002;99:803–808. doi: 10.1073/pnas.022629899. [DOI] [PMC free article] [PubMed] [Google Scholar]
- Lang GI, Murray AW. Estimating the per-base-pair mutation rate in the yeast Saccharomyces cerevisiae. Genetics. 2008;178:67–82. doi: 10.1534/genetics.107.071506. [DOI] [PMC free article] [PubMed] [Google Scholar]
- Lea DE, Coulson CA. The distribution of the numbers of mutants in bacterial populations. Journal of Genetics. 1949;49:264–285. doi: 10.1007/BF02986080. [DOI] [PubMed] [Google Scholar]
- Lee MG, Norbury CJ, Spurr NK, Nurse P. Regulated expression and phosphorylation of a possible mammalian cell-cycle control protein. Nature. 1988;333:676–679. doi: 10.1038/333676a0. [DOI] [PubMed] [Google Scholar]
- Lewis DL, Gattie DK. The ecology of quiescent microbes. ASM News. 1991;57:27–32. [Google Scholar]
- Li H, Durbin R. Fast and accurate short read alignment with Burrows-Wheeler transform. Bioinformatics. 2009;25:1754–1760. doi: 10.1093/bioinformatics/btp324. [DOI] [PMC free article] [PubMed] [Google Scholar]
- Li S, Li R, Li H, Lu J, Li Y, Bolund L, Schierup MH, Wang J. SOAPindel: efficient identification of indels from short paired reads. Genome Research. 2013;23:195–200. doi: 10.1101/gr.132480.111. [DOI] [PMC free article] [PubMed] [Google Scholar]
- Long H, Behringer MG, Williams E, Te R, Lynch M. Similar mutation rates but highly diverse mutation spectra in ascomycete and basidiomycete yeasts. Genome Biology and Evolution. 2016;8:3815–3821. doi: 10.1093/gbe/evw286. [DOI] [PMC free article] [PubMed] [Google Scholar]
- Luria SE, Delbrück M. Mutations of bacteria from virus sensitivity to virus resistance. Genetics. 1943;28:491–511. doi: 10.1093/genetics/28.6.491. [DOI] [PMC free article] [PubMed] [Google Scholar]
- Lynch M. Rate, molecular spectrum, and consequences of human mutation. PNAS. 2010;107:961–968. doi: 10.1073/pnas.0912629107. [DOI] [PMC free article] [PubMed] [Google Scholar]
- Maestroni L, Audry J, Matmati S, Arcangioli B, Géli V, Coulon S. Eroded telomeres are rearranged in quiescent fission yeast cells through duplications of subtelomeric sequences. Nature Communications. 2017;8:1684. doi: 10.1038/s41467-017-01894-6. [DOI] [PMC free article] [PubMed] [Google Scholar]
- Marguerat S, Schmidt A, Codlin S, Chen W, Aebersold R, Bähler J. Quantitative analysis of fission yeast transcriptomes and proteomes in proliferating and quiescent cells. Cell. 2012;151:671–683. doi: 10.1016/j.cell.2012.09.019. [DOI] [PMC free article] [PubMed] [Google Scholar]
- McKenna A, Hanna M, Banks E, Sivachenko A, Cibulskis K, Kernytsky A, Garimella K, Altshuler D, Gabriel S, Daly M, DePristo MA. The Genome Analysis Toolkit: a MapReduce framework for analyzing next-generation DNA sequencing data. Genome Research. 2010;20:1297–1303. doi: 10.1101/gr.107524.110. [DOI] [PMC free article] [PubMed] [Google Scholar]
- Mitchison JM. Physiological and cytological methods for Schizosaccharomyces pombe. Methods in Cell Biology. 1970;4:131–165. doi: 10.1016/S0091-679X(08)61752-5. [DOI] [Google Scholar]
- Mochida S, Yanagida M. Distinct modes of DNA damage response in S. pombe G0 and vegetative cells. Genes to Cells. 2006;11:13–27. doi: 10.1111/j.1365-2443.2005.00917.x. [DOI] [PubMed] [Google Scholar]
- Nurse P, Bissett Y. Gene required in G1 for commitment to cell cycle and in G2 for control of mitosis in fission yeast. Nature. 1981;292:558–560. doi: 10.1038/292558a0. [DOI] [PubMed] [Google Scholar]
- Petersen J, Hagan IM. Polo kinase links the stress pathway to cell cycle control and tip growth in fission yeast. Nature. 2005;435:507–512. doi: 10.1038/nature03590. [DOI] [PubMed] [Google Scholar]
- Roche B, Arcangioli B, Martienssen RA. RNA interference is essential for cellular quiescence. Science. 2016;354:aah5651. doi: 10.1126/science.aah5651. [DOI] [PMC free article] [PubMed] [Google Scholar]
- Rosenberg SM. Mutation for survival. Current Opinion in Genetics & Development. 1997;7:829–834. doi: 10.1016/S0959-437X(97)80047-0. [DOI] [PubMed] [Google Scholar]
- Ségurel L, Wyman MJ, Przeworski M. Determinants of mutation rate variation in the human germline. Annual Review of Genomics and Human Genetics. 2014;15:47–70. doi: 10.1146/annurev-genom-031714-125740. [DOI] [PubMed] [Google Scholar]
- Van der Auwera GA, Carneiro MO, Hartl C, Poplin R, Del Angel G, Levy-Moonshine A, Jordan T, Shakir K, Roazen D, Thibault J, Banks E, Garimella KV, Altshuler D, Gabriel S, DePristo MA. From FastQ data to high confidence variant calls: the Genome Analysis Toolkit best practices pipeline. Current Protocols in Bioinformatics. 2013;43:11.10.1–11.1033. doi: 10.1002/0471250953.bi1110s43. [DOI] [PMC free article] [PubMed] [Google Scholar]
- Williams GC, Williams DC. Natural selection of individually harmful social adaptations among sibs with special reference to social insects. Evolution. 1957;11:32–39. doi: 10.1111/j.1558-5646.1957.tb02873.x. [DOI] [Google Scholar]
- Yaakov G, Lerner D, Bentele K, Steinberger J, Barkai N. Coupling phenotypic persistence to DNA damage increases genetic diversity in severe stress. Nature Ecology & Evolution. 2017;1:0016. doi: 10.1038/s41559-016-0016. [DOI] [PubMed] [Google Scholar]
- Yanagida M. Cellular quiescence: are controlling genes conserved? Trends in Cell Biology. 2009;19:705–715. doi: 10.1016/j.tcb.2009.09.006. [DOI] [PubMed] [Google Scholar]
- Ye K, Schulz MH, Long Q, Apweiler R, Ning Z. Pindel: a pattern growth approach to detect break points of large deletions and medium sized insertions from paired-end short reads. Bioinformatics. 2009;25:2865–2871. doi: 10.1093/bioinformatics/btp394. [DOI] [PMC free article] [PubMed] [Google Scholar]
- Zhu YO, Siegal ML, Hall DW, Petrov DA. Precise estimates of mutation rate and spectrum in yeast. PNAS. 2014;111:E2310–E2318. doi: 10.1073/pnas.1323011111. [DOI] [PMC free article] [PubMed] [Google Scholar]
- Zuckerkandl E, Pauling L. Molecular disease, evolution, and genetic heterogeneity. In: Kasha M, Pullman B, editors. Horizons in Biochemistry. New York: Academic Press; 1962. pp. 189–225. [Google Scholar]
In the interests of transparency, eLife includes the editorial decision letter and accompanying author responses. A lightly edited version of the letter sent to the authors after peer review is shown, indicating the most substantive concerns; minor comments are not usually included.
Thank you for submitting your article "Quiescence unveils a novel mutational force in fission yeast" for consideration by eLife. Your article has been reviewed by three peer reviewers, and the evaluation has been overseen by Naama Barkai as the Senior and Reviewing Editor. The following individuals involved in review of your submission have agreed to reveal their identity: Nick Rhind (Reviewer #1) and Primo Schär (Reviewer #3).
Summary:
The study shows that starved fission yeast cells still mutate their genome at high rate, and define the associated mutation spectrum. All three reviewers found this result interesting, but raised substantial concerns that will need to be addressed using more experiments and analysis.
Essential revisions:
There are four main issues that the reviewers are only partially convinced on and that needs to be clarified:
Lack of cell replication: please validate quiescence by providing quantitative data on the population homogeneity with regard to cell cycle and proliferation.
The mechanism generating the mutations: Please test the hypothesis/rule out the possibility that the translesion polymerases as the basis of the new spectrum.
Please also examine the possibility that nucleotide imbalance (caused by FOA or metabolic shift) triggers repair-mediated mutational events. An insight into this question may be gained by comparing mutation spectra arising under FOA (ur4/5 sequences) and those occurring spontaneously (genome sequencing) in a quantitative manner.
Please extend the analysis of sequencing data as proposed by the reviewers.
Reviewer #1:
Gangloff et al. present a simple but convincing demonstration of the difference between the mutation spectrum of log phase fission yeast and those in a quiescent population. The fact that the quiescent mutation rate is so high is surprising – my intuition was that it should be low in a metabolically less active state presumably designed for durability – and the contrast between the two spectra raise interesting issues of mutational homeostasis. Nonetheless, it seems to me that this observation is more intriguing than informative. To have a significant impact in the field, I would think that one would want to provide some insight into the mechanisms by which these mutations accumulate or a more rigorous formal treatment of how the two spectra balance and what that says about the amount of time fission yeast spend growing versus quiescent.
In addition, attention to the following issues would strengthen the paper.
It is not clear how useful it was to name the quiescence mutational spectrum "Chronos", especially since Chronos does not appear again in the paper.
Although it is clear that the populations analyzed are quiescent, it is harder to say much specific about the cell leading to the selected mutations. In particular, calling these mutations replication independent is probably too strong. It would be useful to include a more explicit discussion of whether they may be rare replicating cells and, if so, what the different mutation spectrum might say about replication in quiescent populations.
The speculation about the mutational spectra in mammalian gametes is far removed from the results presented in the paper and does not add much insight to either the fission yeast or the mammalian biology. It should be saved for an opinion piece rather than a research paper.
Speculation, or preferably data, that would be more useful would address the mechanism of the mutations in quiescent populations.
Reviewer #2:
This is an interesting paper that studies changes in the spectrum of mutations in S. pombe as cells are held in starvation medium, lacking nitrogen. The frequency of mutations increases linearly with time over two weeks but apparently increases at 3 months. The spectrum of mutation changes, with somewhat more deletions than insertions (though this is not evident in the whole genome survey of 123 strains after 3 months).
There are a number of statements that require clarifications.
- Introduction, second paragraph. According to Marguerat et al. 2012, "These cells remain metabolically active by recycling nitrogen, become highly resistant to multiple stresses, and survive for months (Yanagida, 2009)." This raises the fundamental question whether quiescent cells are really devoid of DNA replication.
Would the authors know if 0.1% were able to replicate their DNA, with a different mutational profile? Could they show whether EdU or BrdU are incorporated, and if so, are these incorporations over long segments or only in repair-sized patches?
If additional experiments are suggested, they need to be justified by the reviewer. I am not convinced that metabolically active cells, able to recycle nutrients, are truly non-replicating. It seems equally likely that a subset of cells ("persisters") might indeed fully replicate their genomes. A more direct way of showing the extent of new DNA synthesis is highly desirable, but other reviewers may disagree.
Results, second paragraph. It is curious that a 50-50 mixture of ura4 and WT cells survives better than either population alone. This appears to be statistically significant. Is it? In any case the issue is not whether ura4 survives less, but whether it survives better (which would suggest some possibility of selection). When the 50-50 mixture survives, is there a change in the proportion of ura4 cells?
Results, sixth paragraph. What happens to mutations when the medium is not changed every two weeks? And what does it mean that the medium is changed to "maintain oligo elements" (are these nucleotides?).
"Mutations found more than once in clonal population" – do the authors mean "more than once in different clonal populations"?
Figure 1. Most mutations are apparently +/-1 indels. Do they arise in homonucleotide runs? I am not sure what "low complexity" sequences means.
Results, fourth paragraph. I find statements about evolutionary pressures overstated, based on this small survey of two genes whose nucleotide sequence may – or may not – reflect the entire genome. The small changes in + and – indels are insufficient for such a claim, especially because the 3-month data don't support the claim.
In this regard, is this whole genome or exome sequencing? If whole genome, were there no changes in copy number or other changes in the repeated sequences around centromeres, rDNA and elsewhere? These changes would support the idea that nutritional restriction would favor deletion to make a smaller, easier-to-replicate genome, even if under supposedly nonreplicating conditions.
- Figure 2. I am unable to evaluate the corrections to mutation frequencies based on the author's new method of estimating "essential" amino acids. I do not see how they evaluated the better predictive fit of this method relative to Lang and Murray's, which seems to be a straightforward calculation based on the idea that STOP codons become over-represented because many nonsynonymous changes are still functional. Unless the GC content is 50%in coding regions, and given that some SNVs are much more frequent than others, the statement that each mutation has a probability of 1/k may not be correct. In any case please provide the criteria by which the new method outperforms Lang and Murray and better explain the corrected frequencies.
8)Results, seventh paragraph. What was the estimated mutation frequency for 3 months?
Table 3. Is there a way to show which of the 4 or 6 mutations has which of the 8 phenotypes? And, since there was only about 0.7 mutations per genome, if I read correctly, it should be evident – or highly suggestive – what mutation in what gene caused these phenotypes. Do these mutations make sense in terms of their phenotypes?
The biggest question surrounding this approach is why these changes in mutation occur. In bacteria, SLAM reflects the increased use of mutagenic DNA polymerase DinB, leading to a change in mutational spectrum. How do bacterial mutation rates change with time? In budding yeast, DNA repair has an 1000-times increase in mutation rate compared to replication, with evidence of the use of a different DNA polymerase in some instances. None of these studies is cited, although Foster's early work on adaptive mutation is. Rosenberg's extensive later work deserves attention. Ditto Strathern's and Haber's yeast work.
So, if starving (quiescent) cells are subject to the use of a different polymerase or an altered mechanism of DNA repair, there well could be a change in mutation rate. These possibilities should be explored, perhaps instead of rather unconnected musings on the differences between sperm and ovum.
Reviewer #3:
The manuscript by Serge Gangloff and co-workers presents data on mutagenesis in quiescent S. pombe cells. The authors combined conventional and next generation sequencing to identify genetic alterations that occur in S. pombe cells held in a non-replicating state by nitrogen starvation for up to 3 months. In a first approach they analyse in a time course of 15 days single nucleotide changes and insertion/deletion mutations in the ura4 and ura5 genes in 5-FOA resistant cells. This dataset shows that, following entry into the quiescent state, mutations accumulate in a time-dependent manner, showing a characteristic spectrum that is distinct from replication-associate mutagenesis. A second approach identifies genomic mutations in cell populations following 3 months of nitrogen starvation and essentially corroborates the replication-independent mutational features. The authors conclude that replication- and quiescence-associated mutagenesis represent two alternative mutation drivers, facilitating a balanced evolution of genomes.
This work addresses a long-recognized but difficult to study, yet important gap of knowledge in mutagenesis, the highly complex question of the stability of genomes in non-replicating cells. The authors approach is based on the well-defined fission yeast model, where nitrogen-starvation can induce a "physiological" quiescent state, as well as of state of the art targeted and genome-wide analyses. The experimental setup has generated highly interesting data that one would like to explore further, both conceptually and mechanistically. While I greatly appreciate the authors efforts to advance this area of research and see the potential importance of the work, my impression is that the state of the current manuscript is somewhat immature; the data is purely descriptive at this point and, rather than using them to develop (and test?) hypotheses regarding the molecular mechanisms promoting mutagenesis in quiescence, the authors focus on genome evolutionary interpretations that seem to stretch the evidence presented considerably. These are definitely interesting considerations but the experimental support is not compelling. In my opinion the manuscript would benefit greatly by the addition of some controls (G0-phase validation), more rigorous analyses and discussion of the actual data, and a more thorough consideration/discussion (perhaps testing) of the potential mechanisms involved in quiescence mutagenesis. Addressing the following questions might help.
Mutational baseline: I have a number of questions relating to the discrimination of replicating from quiescent cells, i.e. the definition of baseline, which is critical here. (i) It is assumed that a majority of cells enter G0 under nitrogen-starved conditions. While this it probably correct, was the cell cycle status validated in these experiments and where proportions of G0 cells assessed? (i) Vice versa, what would be the proportion of quiescent cells in proliferating populations of S. pombe cells? (iii) How are pre-existing persisters dealt with and excluded? (iv) Why isn't there more fluctuation in mutation frequencies at end of replication, early quiescence? How many cultures were tested?
FOA mutation assay and time of occurrence of mutations: The mutation assay described bases on the selection of 5-FOA resistant survivors. FOA itself perturbs the uracil metabolism and, thereby also the dNTP balance. This in itself can generate a shift in mutational spectra. In the experimental setup used, mutations may emerge only after re-plating of cells on FOA media, possibly by repair of replication of DNA damage that was induced during quiescence. Nucleotide imbalance may then affect the type of mutation generated. Was this considered? What is the authors’ take on this? I think, this should be addressed briefly in the Discussion.
The FOA-based mutation assay is not fully unbiased as it scores functional changes related to uracil mechanism only. This limitation should be phrased in the description of the assay. To what extent could the spectra shift be explained by the FOA effect on nucleotide metabolisms (changes involving T?).
Mutation spectra: I suggest displaying the frequencies of individual single-nucleotide changes (e.g. Figure 1B, respective data in Tables 1 and 2) as normalized to the total number of relevant scorable base pairs. This would provide mora accurate information about true mutation preferences.
CpG mutagenesis: It is interesting, very interesting indeed, that CpG dinucleotides are preferential sites of mutation. Again, it would be interesting to see if and to what extent the normalized frequency (normalized to total number of such sites in the scorable sequences) is higher than predictable (statistics against all dinucleotides). This is likely, given the coding importance of these nucleotides and the fact that they not only preferentially mutate by C (or 5mC) deamination but also by alkylation of G (6-methylguanine), for instance.
Statistics in general: Are the differences in spectra between day 1 and day 8+15 statistically significant (Figures 1 and 2)?
Normalizations: I would be interested to have the analysis performed in Figure 2 extended for individual SNVs (again normalized to the total number of scorable bases in each category).
Genome-scale mutation assessment: This precious dataset should, in my opinion, be explored further, for instance to validate the CpG bias, or sequence context biases, or the FOA bias. I could imagine there is quite some potential there. Also, it seem important to me to compare this dataset to one of exponentially growing cells (same number of cell after similar time of continuous cultivation). In my opinion, this experiment is a real strength of the paper.
Discussion: The Discussion is interesting and stimulating but rather far reaching. Given that some caveats exist (FOA, persisters…) and the datasets are not exhaustively explored and also entirely descriptive, I would prefer to have some discussion of the actual data, their strengths and weaknesses, and the mechanisms of mutagenesis implicated. What could be the molecular reason for the spectrum shift?
[Editors' note: further revisions were requested prior to acceptance, as described below.]
Thank you for resubmitting your work entitled "Quiescence unveils a novel mutational force in fission yeast" for further consideration at eLife. Your revised article has been favorably evaluated by Naama Barkai as the Senior and Reviewing Editor and two reviewers.
The manuscript has been improved but there are some remaining issues that need to be addressed before acceptance, as outlined below:
Please acknowledge that repair processes could indeed give 1000x increases that you see.
Reviewer #1:
I raised two main points about the Gangloff manuscript: the question of whether a minority of cells may be replicating during quiescence and the opinion that, without some mechanistic insight into the cause of the mutations during quiescence or a more rigorous formal treatment of the evolutionary implications of the observation, the work was more intriguing than informative.
The authors addressed my first point, although somewhat indirectly. Instead of measuring the number of cells replicating, they measure the number of cells dividing and conclude that since very few cell divide, very few could be replicating. The other possibility is that cell occasionally replicate, but then arrest in a G2 G0, which has been reported in fission yeast. Nonetheless, I am persuaded by their data that there is unlikely to be a significant fraction of replicating cells and that their mutations are therefore most likely replication independent.
The authors’ response to the second point is less satisfying. They show that TLS is not a significant contributor to the mutation spectrum they observe, but offer no mechanistic insight beyond that and still speculate about the evolutionary significance of their result in only vague and qualitative terms. So, while I agree that this intriguing observation will cause people to think differently about DNA stability in quiescence, it does not provide much guidance as to what the new way of thinking about it should be.
Reviewer #2:
The authors have generally made a very good effort to address the reviewers' concerns. Showing that a PCNA mutation did not alter significantly the mutation rate was important (though it remains then a question what is the source of the elevated mutations, if they are not replicating or subject to the use of translesion polymerases to deal with damage in nondividing cells).
I am still stuck on one point, which I would ask the authors to address directly, based on their own statement in the rebuttal: "If these replicating cells were generating the FOAR mutants observed during quiescence, we will have to conclude that they generate 1,000 times more mutations per replication." That was my point originally – the papers now cited by Dr. Arcangioli from yeast DNA damage studies make exactly that argument: repair DNA synthesis is 1000x more mutagenic than normal replicative errors. So they should acknowledge that – although they believe their data make this unlikely – the very high rate of errors in DSB repair could indeed give the numbers that their CHRONOS study reveals.
Essential revisions:
There are four main issues that the reviewers are only partially convinced on and that needs to be clarified:
- Lack of cell replication: please validate quiescence by providing quantitative data on the population homogeneity with regard to cell cycle and proliferation.
In the Results section, we have introduced an additional analysis of the cell population homogeneity in quiescence with Table 1 and added:
“To determine the homogeneity of the cell population during quiescence, we analyzed the size and the proportion of cells exhibiting a septum during 15 days (Table 1). […] This result indicates that the proportion of cells dividing or replicating during quiescence is very low.”
See also the responses to reviewer comments.
Early in the Discussion section, we added:
“Extensive work has shown that quiescence is a well-controlled and conserved process {Yanagida, 2009; Lee et al., 1988; Petersen and Hagan 2005}. […] Therefore, we favor the Chronos model where DNA lesions that are arising during quiescence {Mochida and Yanagida, 2006; Ben Hassine and Arcangioli, 2009} are repaired with errors that generate mutations with time.”
“Initially, Luria and Delbruck {Luria and Delbrück, 1943} expressed the mutation rate per unit time, that was transformed to per generation later by Lea and Coulson {Lea and Coulson, 1949}. […] Our work proposes that quiescence is a genetic active state that participates to the mutation fraction that is expressed in unit of time.”
- The mechanism generating the mutations: Please test the hypothesis/rule out the possibility that the translesion polymerases as the basis of the new spectrum.
PCNA lysine 164 ubiquitination regulates TLS by promoting switching from replicative to specialized polymerases that are able to bypass different DNA lesions. To address the possibility that TLS is involved in the quiescence mutational signature we have analyzed the viability, the mutation accumulation and the spectrum of mutants arising in the translesion DNA synthesis mutant pcn1-K164R.
We found that the pcn1-K164R mutant, that cannot switch from replicative to TLS mode (i) maintains high viability during quiescence, (ii) accumulates almost twice FOAR mutants compared to the wild type strain (iii) with more indels than SNV mutations and a domination of deletions over insertions.
We added one figure (Figure 7) and the following into the Discussion section:
“If the mutations are not generated by errors during DNA replication, what are the mechanism(s) underlying Chronos? […] Further investigations of the DNA repair pathways at work during quiescence are needed not only to provide information on the importance of each DNA repair pathway but also valuable insights into physiological source of the spontaneous DNA lesions in quiescence.”
- Please also examine the possibility that nucleotide imbalance (caused by FOA or metabolic shift) triggers repair-mediated mutational events. An insight into this question may be gained by comparing mutation spectra arising under FOA (ur4/5 sequences) and those occurring spontaneously (genome sequencing) in a quantitative manner.
To assess the potential impact of FOA on the mutations accumulation and spectrum we added a paragraph in the Results section, one in Materials and methods and one Table (Table 3).
“A possible caveat of our study is that FOA is known to perturb the metabolism of uracil and thymidine and might thus impact differently the mutational spectra of growing and quiescent cells. […] The 16 unique mutations suggest a frequent heterozygosity of the mutations that can be revealed only after cell division.”
Please see also the response to reviewer 3.
- Please extend the analysis of sequencing data as proposed by the reviewers.
The whole genomes of 243 strains isolated after three months of quiescence are now reported. We updated the related section. The mutations accumulating during quiescence either from the estimated mutation rates from the FOA experiments or from the three months old quiescent cells are almost identical and different from the mutation accumulation results provided by Lynch et al. (Figure 6).
Therefore, we clarified the Chronos profile definition as a genetic force generating similar proportion of SNVs and Indels together with an enrichment of deletions. We also added information on the CpG dinucleotides (Figure 2—figure supplement 2)
We added:
“Altogether, quiescence in fission yeast reveals Chronos as a new genetic force generating similar proportions of SNVs and Indels, together with an enrichment of deletions.”
We also added Figure 5 and Figure 6 showing in a quantitative manner (point 3) the Poisson distribution of the mutations per genome and the similarities and differences between the growing and quiescent mutational profiles.
We added in the Results section and figure legends:
“We also analyzed the distribution of the number of mutations (143) per genome (237) that fits perfectly a Poisson distribution. […] This result shows that a unique mutational force, equally affecting all genomes, is at work during quiescence.”
Figure 5: Distribution of mutations among the 237 genomes sequenced. […] The goodness of fit is excellent (Pchi2=0.56).
Figure 6: Corrected versus observed proportions of Indels
In blue, we report the percentage of Indels expected from the FOA experiments, that is the ratios of the estimated slopes of accumulation of INDELS and SNVs (using method 1). In red, the observed fraction of INDELS after 3 month of quiescence. In green, the observed fraction of INDELs in the MA lines from {Farlow et al., 2015}. P-values are computed using homogenity chi2 tests.
Figure 2—figure supplement 2: Normalized percentage of each dinucleotide in the open reading frames of ura4+ and ura5+after one day in quiescence. The percentage of every dinucleotide mutated at day one is compared to the frequency of occurrence of the same dinucleotide in the respective open reading frame.
We also sequenced 6 genomes of the three-months aged cells exhibiting phenotypes and identified the putative causative mutations and genes of interest. We added at the end of the Results section (reviewer 2):
“We sequenced the genomes of the six strains isolated after three months and found mutations mapping in alg5, alg8, aur1, ccc2, gdi1 and oca8 genes. These genes encode for cell wall and vacuole/membrane trafficking functions that might improve viability during quiescence.”
Reviewer #1:
Gangloff et al. present a simple but convincing demonstration of the difference between the mutation spectrum of log phase fission yeast and those in a quiescent population. The fact that the quiescent mutation rate is so high is surprising – my intuition was that it should be low in a metabolically less active state presumably designed for durability – and the contrast between the two spectra raise interesting issues of mutational homeostasis. Nonetheless, it seems to me that this observation is more intriguing than informative. To have a significant impact in the field, I would think that one would want to provide some insight into the mechanisms by which these mutations accumulate or a more rigorous formal treatment of how the two spectra balance and what that says about the amount of time fission yeast spend growing versus quiescent.
We agree that knowing the DNA repair pathways and mechanisms operating during vegetative and quiescence states are equally important, but addressing experimentally the major DNA repair pathways at work during quiescence requires an effort well beyond the scope of the present work. Nonetheless, as requested, we added a new set of data on the role of the TLS pathway with the conclusion that its impact is rather weak during quiescence (Essential revisions 2).
In addition, attention to the following issues would strengthen the paper.
It is not clear how useful it was to name the quiescence mutational spectrum "Chronos", especially since Chronos does not appear again in the paper.
Although it is clear that the populations analyzed are quiescent, it is harder to say much specific about the cell leading to the selected mutations. In particular, calling these mutations replication independent is probably too strong. It would be useful to include a more explicit discussion of whether they may be rare replicating cells and, if so, what the different mutation spectrum might say about replication in quiescent populations.
The speculation about the mutational spectra in mammalian gametes is far removed from the results presented in the paper and does not add much insight to either the fission yeast or the mammalian biology. It should be saved for an opinion piece rather than a research paper.
Speculation, or preferably data, that would be more useful would address the mechanism of the mutations in quiescent populations.
We added new data on the cell population homogeneity during quiescence and discussed the consequences of potential persisters that are not responding to the absence of nitrogen and may potentially replicate during the quiescence period. We also added a new data showing that ura4 and ura5 mutations arising during quiescence or growth are similarly impacted by FOA. We removed most of the speculation on mammals and discussed Chronos as a potential vector for time-dependent mutations. (Essential revisions 1 and 3).
Reviewer #2:
[…] There are a number of statements that require clarifications.
- Introduction, second paragraph. According to Marguerat et al. 2012, "These cells remain metabolically active by recycling nitrogen, become highly resistant to multiple stresses, and survive for months (Yanagida, 2009)." This raises the fundamental question whether quiescent cells are really devoid of DNA replication.
Would the authors know if 0.1% were able to replicate their DNA, with a different mutational profile? Could they show whether EdU or BrdU are incorporated, and if so, are these incorporations over long segments or only in repair-sized patches?
If additional experiments are suggested, they need to be justified by the reviewer. I am not convinced that metabolically active cells, able to recycle nutrients, are truly non-replicating. It seems equally likely that a subset of cells ("persisters") might indeed fully replicate their genomes. A more direct way of showing the extent of new DNA synthesis is highly desirable, but other reviewers may disagree.
We agree with all the concerns. We added an analysis of the size and proportion of cells containing a septum during quiescence and discussed the consequence of rare dividing cells in quiescence. (See Essential revisions 1). This experiment indicates that less than one cell every 1000 cells might replicated or divided in quiescence, a detection threshold that could be improved by incorporation of thymidine analogs. However, incorporation of thymidine analogs required the two ectopic genes, thymidine kinase and nucleotide transporter, and complemented minimum liquid media. In addition, BrdU, CldU and EdU are known mutagens that may introduce a bias in the analysis. These compounds are base analogs that will introduce nitrogen to the medium and interfere with quiescence. We also analyzed the distribution of the mutations per genomes after three months of quiescence and found a perfect fit with Poisson distribution (supplemental curve) strongly suggesting that a single mutational force is at work during quiescence.
- Results, second paragraph. It is curious that a 50-50 mixture of ura4 and WT cells survives better than either population alone. This appears to be statistically significant. Is it? In any case the issue is not whether ura4 survives less, but whether it survives better (which would suggest some possibility of selection). When the 50-50 mixture survives, is there a change in the proportion of ura4 cells?
Figure 1 is showing several experiments performed comparing wild-type, ura4D18 and co-culture. Altogether they are showing that ura4D18 has no advantage compared to wild-type strain or mixed populations and the proportion of uracil auxotrophs is maintained constant for the two weeks (we added a sentence in the Figure 1 legend).
“ura4D18 has no advantage compared to wild-type strain or mixed populations and the proportion of uracil auxotrophs is maintained constant for the two weeks.”
- Results, sixth paragraph. What happens to mutations when the medium is not changed every two weeks? And what does it mean that the medium is changed to "maintain oligo elements" (are these nucleotides?).
When the medium is not changed, the dying cells are releasing nitrogen that can be used to feed the survivor cells. The procedure to change the medium was used by other teams (Sajiki K, Journal of Cell Science 2009). When the medium is not refreshed, especially after two- and four-weeks, the overall viability of the cell population is dropping faster.
The strain used in our study is a prototroph and the medium neither contain nucleotides nor amino-acids, but oligo-elements – trace concentrations of – salts, vitamins and minerals (described in Mitchison, JM Physiological and cytological methods for S. pombe. Methods in Cell biology 1970).
- "Mutations found more than once in clonal population" – do the authors mean "more than once in different clonal populations"?
Thank you for the remark; we corrected the sentence “more than once in a clonal population”. Additionally, several point mutations occurred independently in different clonal populations and were used to estimate the accumulation of mutations at the genome level (Synonymous versus non-synonymous SNV, in Table 4—source data 1).
- Figure 1. Most mutations are apparently +/-1 indels. Do they arise in homonucleotide runs? I am not sure what "low complexity" sequences means.
Sorry for the misunderstanding. The data of +/-1 indels are shown in Supplementary file 1 (for ura4/5) and Supplementary file 2 (for the genome). For ura4/5 mutants, referring to the reviewer’s comment, we corrected the sentence: “within homonucleotide runs”. The proportion of indels in homonucleotide runs seems more frequent at the genome level (See Supplementary file 2).
- Results, fourth paragraph. I find statements about evolutionary pressures overstated, based on this small survey of two genes whose nucleotide sequence may – or may not – reflect the entire genome. The small changes in + and – indels are insufficient for such a claim, especially because the 3-month data don't support the claim.
In this regard, is this whole genome or exome sequencing? If whole genome, were there no changes in copy number or other changes in the repeated sequences around centromeres, rDNA and elsewhere? These changes would support the idea that nutritional restriction would favor deletion to make a smaller, easier-to-replicate genome, even if under supposedly nonreplicating conditions.
The discussion about human was reduced.
The three-months data have been re-enforced with more genomes and the data analyzed quantitatively enough to conclude that the vegetative and quiescent mutational spectra are different (Essential revisions).
About CNVs, the sequencing was performed on whole genomes (coverage >50x) and repetitive sequences (rDNA, centromeric DNA, mitochondrial DNA) were excluded from the analysis. CNVs into the non-repetitive regions were analyzed using the free algorithm (Boeva et al. Bioinformatics 2011, 27, 268-269)but no CNVs have been detected
- Figure 2. I am unable to evaluate the corrections to mutation frequencies based on the author's new method of estimating "essential" amino acids. I do not see how they evaluated the better predictive fit of this method relative to Lang and Murray's, which seems to be a straightforward calculation based on the idea that STOP codons become over-represented because many nonsynonymous changes are still functional. Unless the GC content is 50%in coding regions, and given that some SNVs are much more frequent than others, the statement that each mutation has a probability of 1/k may not be correct. In any case please provide the criteria by which the new method outperforms Lang and Murray and better explain the corrected frequencies.
We have corrected and added new information.
8)Results, seventh paragraph. What was the estimated mutation frequency for 3 months?
Sorry, we added into the text:
“Although low, 0.61 mutation per genome after three months, is 3.5-7 times higher than anticipated by our projection (0.084 to 0.17 mutations/genome/three months, depending on the correction method)”
- Table 3. Is there a way to show which of the 4 or 6 mutations has which of the 8 phenotypes? And, since there was only about 0.7 mutations per genome, if I read correctly, it should be evident – or highly suggestive – what mutation in what gene caused these phenotypes. Do these mutations make sense in terms of their phenotypes?
As explained above the mutations responsible for the strains with phenotype were not included in the 3-month mutational survey. We now have sequenced six of them, they are mapping to alg5, alg8, aur1, ccc2, gdi1 and oca8 (dolichyl-phosphate beta-glucosyltransferase, glucosyltransferase -predicted), inositol phosphorylceramide synthase -predicted, copper transporting ATPase -predicted, GDP dissociation inhibitor -predicted and cytochrome b5 -predicted, respectively). Not much is known about these genes (membrane trafficking and cell wall), three are essential. The information was added at the end of the Results section:
“We sequenced the genomes of the six strains isolated after three months and found mutations mapping in alg5, alg8, aur1, ccc2, gdi1 and oca8 genes. These genes encode for cell wall and vacuole/membrane trafficking functions that might improve viability during quiescence.”
- The biggest question surrounding this approach is why these changes in mutation occur. In bacteria, SLAM reflects the increased use of mutagenic DNA polymerase DinB, leading to a change in mutational spectrum. How do bacterial mutation rates change with time? In budding yeast, DNA repair has an 1000-times increase in mutation rate compared to replication, with evidence of the use of a different DNA polymerase in some instances. None of these studies is cited, although Foster's early work on adaptive mutation is. Rosenberg's extensive later work deserves attention. Ditto Strathern's and Haber's yeast work.
So, if starving (quiescent) cells are subject to the use of a different polymerase or an altered mechanism of DNA repair, there well could be a change in mutation rate. These possibilities should be explored, perhaps instead of rather unconnected musings on the differences between sperm and ovum.
With respect to the above remarks several changes have been done. (See Essential revisions 1).
We also added in the Introduction the reference of the Rosenberg’s review (Rosenberg, 1997).
Similarly, we added: Holbeck and Strathern, 1997; Hicks, Kim and Haber, 2010;.
Along with gene conversion, nucleotide modification and transposition (Results, second paragraph) we added “meiotic recombination”.
The question on the potential impact of the TLS pathway has been added and discussed (See Essential revisions 2).
The discussion on human along with sperm and ovum are removed. But I’m keeping in mind that “What is true for E. coli is true for elephant” (J. Monod).
Reviewer #3:
[…] This work addresses a long-recognized but difficult to study, yet important gap of knowledge in mutagenesis, the highly complex question of the stability of genomes in non-replicating cells. The authors approach is based on the well-defined fission yeast model, where nitrogen-starvation can induce a "physiological" quiescent state, as well as of state of the art targeted and genome-wide analyses. The experimental setup has generated highly interesting data that one would like to explore further, both conceptually and mechanistically. While I greatly appreciate the authors efforts to advance this area of research and see the potential importance of the work, my impression is that the state of the current manuscript is somewhat immature; the data is purely descriptive at this point and, rather than using them to develop (and test?) hypotheses regarding the molecular mechanisms promoting mutagenesis in quiescence, the authors focus on genome evolutionary interpretations that seem to stretch the evidence presented considerably. These are definitely interesting considerations but the experimental support is not compelling. In my opinion the manuscript would benefit greatly by the addition of some controls (G0-phase validation), more rigorous analyses and discussion of the actual data, and a more thorough consideration/discussion (perhaps testing) of the potential mechanisms involved in quiescence mutagenesis. Addressing the following questions might help.
- Mutational baseline: I have a number of questions relating to the discrimination of replicating from quiescent cells, i.e. the definition of baseline, which is critical here. (i) It is assumed that a majority of cells enter G0 under nitrogen-starved conditions. While this it probably correct, was the cell cycle status validated in these experiments and where proportions of G0 cells assessed? (i) Vice versa, what would be the proportion of quiescent cells in proliferating populations of S. pombe cells? (iii) How are pre-existing persisters dealt with and excluded? (iv) Why isn't there more fluctuation in mutation frequencies at end of replication, early quiescence? How many cultures were tested?
Thank you for the remarks. We added new data about the quiescence population and fluctuation analysis are discussed. See above the Essential revisions and more details are following.
i) The procedure used in this work is classical and reproducible. Following this procedure, most if not all the cells replicate once and divided twice to enter in G1 and then in quiescence. Each time, the cell number, the cell size and their FACS analysis are carefully determined.
We have introduced microscopic analyses showing the homogeneity of cell size and determined the proportion of cells with septum every day, from 1 to 15 days, during the quiescence time course.
ii, iii) The persisters hypothesis is now discussed.
iv) We have performed fluctuation-like experiments. This is important at the early time point (Day 1) in wild type and even more the pcn1 mutant strain to avoid sequencing the same mutations arising during the pre-cultures. Fluctuation during latter time points in quiescence is less important because we are measuring a mutation accumulation.
Corrections have been added in Results and Discussion.
- FOA mutation assay and time of occurrence of mutations: The mutation assay described bases on the selection of 5-FOA resistant survivors. FOA itself perturbs the uracil metabolism and, thereby also the dNTP balance. This in itself can generate a shift in mutational spectra. In the experimental setup used, mutations may emerge only after re-plating of cells on FOA media, possibly by repair of replication of DNA damage that was induced during quiescence. Nucleotide imbalance may then affect the type of mutation generated. Was this considered? What is the authors’ take on this? I think, this should be addressed briefly in the Discussion.
Yes, we have been wondering about FOA appearing on the plate. To minimize the problem, we have standardized our FOA plates and only incubate the cells for three days. After five days, small secondary FOAR colonies appear. These mutants are more likely arising post plating.
To evaluate the potential bias imposed by the FOA we compared the FOAR mutations obtained after directly plating cells from quiescence or after one cell division prior plating cells onto FOA containing plates. The mutations appearing in pairs exhibits the quiescence spectrum that is supporting that FOA is equally affecting the growing and quiescence mutational spectrum (See Essential revisions). Thank you for motivating us to compare the FOAR mutations arising prior and after DNA replication.
- The FOA-based mutation assay is not fully unbiased as it scores functional changes related to uracil mechanism only. This limitation should be phrased in the description of the assay. To what extent could the spectra shift be explained by the FOA effect on nucleotide metabolisms (changes involving T?).
Yes, we agree. We also added the limitation of the FOA-based assay (Essential revisions 3).
We have represented the frequencies of individual single-nucleotide changes as normalized to the total number of relevant scorable base pairs and did not see any significant difference with that of the observed data in Figure 2B. Therefore, we have left the Figure 2B untouched and added a reference to Figure 2—figure supplement 1 that shows both graphs together with a table of the estimated values of the relevant scorable base pairs in ura4 and ura5.
Figure 2—figure supplement 1: (A) Mutation spectrum established on 105 SNVs found in the ura4+ and ura5+ genes at day 1 and 146 at days 8 + 15 (from Figure 1B). (B) Same as in A, but normalized to the total number of relevant scorable base pairs. (C) Counts of all possible STOP and nonsense mutations for each substitution in ura4 and ura5.
- CpG mutagenesis: It is interesting, very interesting indeed, that CpG dinucleotides are preferential sites of mutation. Again, it would be interesting to see if and to what extent the normalized frequency (normalized to total number of such sites in the scorable sequences) is higher than predictable (statistics against all dinucleotides). This is likely, given the coding importance of these nucleotides and the fact that they not only preferentially mutate by C (or 5mC) deamination but also by alkylation of G (6-methylguanine), for instance.
The CpG bias cited a day 1, although interesting, is a comparison with the finding of the Lynch and Hall laboratories and not the purpose of this manuscript. We have updated the figure to show the normalized frequency of mutations in each dinucleotide for each gene compared to the frequency of occurrence of every dinucleotide in the respective open reading frame. The differences between the two reporter genes make it difficult to draw a strong conclusion.
We have modified the sentence in the text and modified the figure legend.
“Interestingly, as previously observed {Behringer and Hall, 2015; Farlow et al., 2015; Zhu et al., 2014} the CpG dinucleotides are found among the top mutated dinucleotides in ura4 and ura5 (Figure 2—figure supplement 2)”.
Figure 2—figure supplement 2:Normalized percentage of each dinucleotide in the open reading frames of ura4+ and ura5+ after one day in quiescence. The percentage of every dinucleotide mutated at day one is compared to the frequency of occurrence of the same dinucleotide in the respective open reading frame.
We added statistic values. In particular, for days 8+15:
“Days 8 and 15 are not statistically different for the Ts:Tv and AT bias (chi2 test) and were therefore combined. Day 1 is statistically different from days 8+15 (Ts/Tv: P<0.05; AT bias: p<0.05 by chi2 tests).”
- Normalizations: I would be interested to have the analysis performed in Figure 2 extended for individual SNVs (again normalized to the total number of scorable bases in each category).
See point 4 about the differences between ura4 and 5.
- Genome-scale mutation assessment: This precious dataset should, in my opinion, be explored further, for instance to validate the CpG bias, or sequence context biases, or the FOA bias. I could imagine there is quite some potential there. Also, it seem important to me to compare this dataset to one of exponentially growing cells (same number of cell after similar time of continuous cultivation). In my opinion, this experiment is a real strength of the paper.
We extended the genome wide sequencing but the number of SNVs (and CpG) is not high enough.
- Discussion: The Discussion is interesting and stimulating but rather far reaching. Given that some caveats exist (FOA, persisters…) and the datasets are not exhaustively explored and also entirely descriptive, I would prefer to have some discussion of the actual data, their strengths and weaknesses, and the mechanisms of mutagenesis implicated. What could be the molecular reason for the spectrum shift?
We introduced new data in the Results section and discussed further the notion of persisters and the Chronos hypothesis and removed some of the human part.
[Editors' note: further revisions were requested prior to acceptance, as described below.]
The manuscript has been improved but there are some remaining issues that need to be addressed before acceptance, as outlined below:
Please acknowledge that repair processes could indeed give 1000x increases that you see.
Initial version:
“If these replicating cells were generating the FOAR mutants observed during quiescence, we will have to conclude that they generate 1,000 times more mutations per replication. Furthermore, these rare replicating cells will have to divide at a constant rate during time in quiescence. However, the number and the distribution of mutations per genome observed in the three months aged cells is hardly compatible with this hypothesis. Therefore, we favor the Chronos model where DNA lesions that are arising during quiescence [Mochida and Yanagida, 2006; Ben Hassine and Arcangioli, 2009] are repaired with errors that generate mutations with time.”
New version:
“If these replicating cells were generating the FOAR mutants observed during quiescence, we will have to conclude that they generate 1,000 times more mutations per replication. Double-strand break repair is a process that could generate this level of mutations [Hicks, Kim and Haber, 2010; Holbeck and Strathern, 1997]. Nevertheless, these rare replicating cells will have to divide at a constant rate during time in quiescence. Additionally, the number and the distribution of mutations per genome observed in the three months aged cells is hardly compatible with this hypothesis. Therefore, we favor the Chronos model where DNA lesions (not excluding DSBs) that are arising during quiescence [Mochida and Yanagida, 2006; Ben Hassine and Arcangioli, 2009] are repaired with errors that generate mutations with time.”
We also added two recent references at the beginning of the Discussion, on RNAi and telomere, which explore the genetic of quiescence.
“Two recent studies on RNA interference and telomere stability highlighted the importance of quiescence for chromosome biology (Maestroni et al., 2017; Roche, Arcangioli and Martienssen, 2016).”
Supplementary Materials
Table 4—source data 1. Estimation of the fraction of SNVs and Indels that leads to a phenotype.
Table 4—source data 2. Estimated mutation rates.
Supplementary file 1. Position and nature of the alterations yielding 5-FOA resistant colonies in ura4+ and ura5+ genes.
Supplementary file 2. Mutations detected in the 243 colonies sequenced after 3 months in G0.
Transparent reporting form