SPRING: a kinetic interface for visualizing high dimensional single-cell expression data (original) (raw)
Abstract
Motivation
Single-cell gene expression profiling technologies can map the cell states in a tissue or organism. As these technologies become more common, there is a need for computational tools to explore the data they produce. In particular, visualizing continuous gene expression topologies can be improved, since current tools tend to fragment gene expression continua or capture only limited features of complex population topologies.
Results
Force-directed layouts of k-nearest-neighbor graphs can visualize continuous gene expression topologies in a manner that preserves high-dimensional relationships and captures complex population topologies. We describe SPRING, a pipeline for data filtering, normalization and visualization using force-directed layouts and show that it reveals more detailed biological relationships than existing approaches when applied to branching gene expression trajectories from hematopoietic progenitor cells and cells of the upper airway epithelium. Visualizations from SPRING are also more reproducible than those of stochastic visualization methods such as tSNE, a state-of-the-art tool. We provide SPRING as an interactive web-tool with an easy to use GUI.
Availability and implementation
https://kleintools.hms.harvard.edu/tools/spring.html, https://github.com/AllonKleinLab/SPRING/.
Supplementary information
Supplementary data are available at Bioinformatics online.
1 Introduction
Recent advances in single-cell RNA sequencing (scSeq) have made it possible to catalog the expression of every gene in every cell from a given sample with reasonable accuracy. There is now a need for computational tools to explore and visualize this high-dimensional data, and in particular to capture the continuous trajectories of cell in gene expression space.
K-nearest-neighbor (knn) graphs have proven useful for analyzing continuous cell topologies (Bendall et al., 2014; Setty et al., 2016; Xu and Su, 2015), and one study proposed the use of knn graphs for visualization and data clustering (Islam et al., 2011). In a knn graph, each cell is a node that extends edges to the k other nodes with most similar gene expression. We have found that interactively exploring graph topology, overlaid with gene expression or other annotations, provides a powerful approach to uncover biological processes emerging from data. However, at present there are no publicly available tools for interactive visualization of scSeq data in a graph format.
Here, we present a user-friendly web tool called SPRING. To use the tool, users must supply a table of gene expression measurements for single-cells and can optionally upload additional annotations. SPRING builds a knn graph from this data and displays the graph using a force-directed layout algorithm that renders as a real-time simulation in an interactive viewing window. We include a set of features for open-ended data exploration, including interactive discovery of marker genes; gene expression comparisons between different sub-populations and selection tools for isolating sub-populations of interest. SPRING is compatible with all major web browsers and does not require technical knowledge to operate.
2 Materials and methods
To generate the knn graph, SPRING performs the following transformations to the inputted gene expression matrix. All parameters labeled ‘X’ in this section can be adjusted using an interactive web form. (1) Filter all cells with fewer than X reads; (2) cell normalization so that every cell has the same total reads; (3) filter genes with ¡ X mean expression or < X coefficient of variation; (4) Z-score normalize expression values for each gene; (5) perform principal components analysis, keep the top X principal components and (6) compute a distance matrix and output a knn-graph with k = X.
One can also conceive of other choices for each step of filtering, normalization, dimensionality reduction and distance metric used. SPRING is demonstrated in two examples in Figure 1. The underlying datasets are being published in separate research papers (in submission), and will be available at https://kleintools.hms.harvard.edu/tools/spring.html.
Fig. 1.
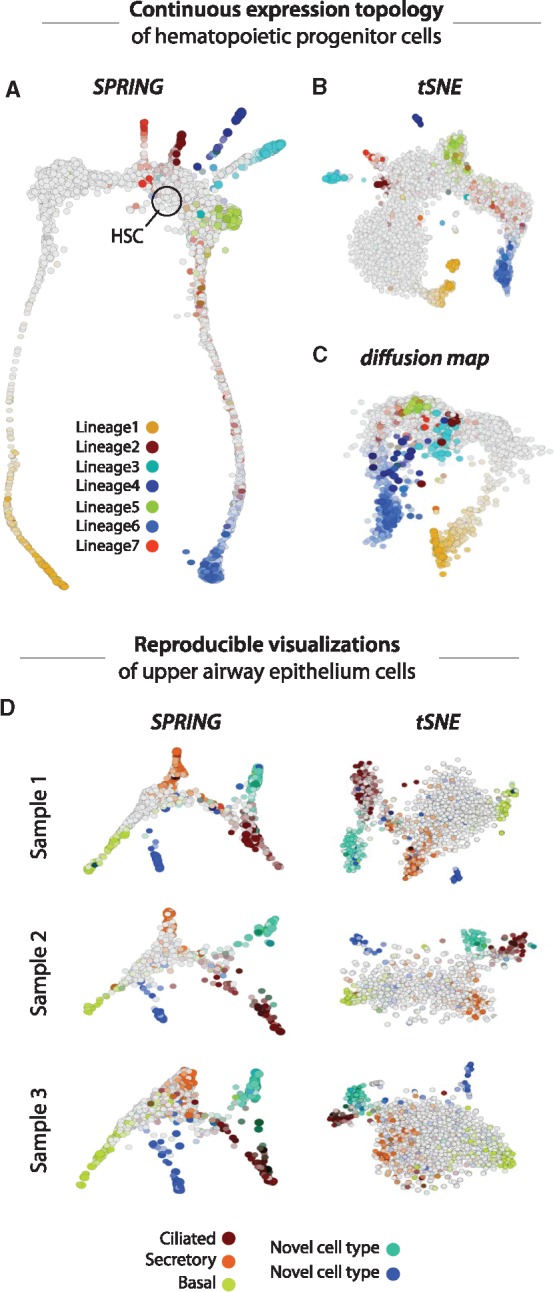
(A) SPRING depicts the dynamic trajectories of hematopoietic progenitor cells as they differentiate from stem cells (HSCs; black circle) into each of seven lineages (colored arms; lineage identities are described in a separate publication, in submission). In contrast, tSNE (B) and diffusion map (C) visualizations of the same data show disconnected clusters of cells or do not capture the full complexity of the data in two dimensions. (D) SPRING and tSNE plots of upper airway epithelium cells from three human donors highlight the reproducibility of SPING visualizations. Cells in (A–D) are colored by marker gene scores. Detailed methodology for producing all plots is available in the Supplementary Material
The SPRING GUI is currently configured for datasets up to 10 000 cells and becomes very slow for larger datasets because of poor scalability of the graph rendering method and the computational burden of computing the force layout. In principle, these can be improved, for example by using the ForceAtlas2 algorithm (Jacomy et al., 2014). In the meantime, large datasets can be accommodated by coarse-graining cells. A procedure to do so is described in the Supplementary Material and shown for an example dataset in Supplementary Figure S5. We provide code for coarse-graining on the github page.
3 Advantages over existing methods
3.1 Continuous expression topologies
In contrast to the commonly used method tSNE (Amir et al., 2013), SPRING captures the long-distance relationships between cells and can, therefore, visualize continuous expression topologies. For example, SPRING accurately maps the branching topology of hematopoietic progenitor cells as they differentiate along seven lineages (Fig. 1A). Though a diffusion map (Haghverdi et al., 2015) visualization (Fig. 1C) can usually capture continuous gene expression trajectories, it often requires more than two diffusion components to distinguish all lineages, preventing a full representation of the data complexity in a single two dimensional plot.
3.2 Graph invariance
One drawback of tSNE is that it is stochastic and, therefore, not perfectly reproducible. In contrast, graph construction in SPRING is non-stochastic and, therefore, yields consistent topologies between runs and replicates. In addition, manual interaction with the kinetic SPRING interface allows users to bring plots from separate replicates into register with one other (Fig. 1D).
4 Conclusion
Single-cell gene expression profiling is becoming a common tool to dissect cellular heterogeneity and characterize dynamic processes such as differentiation. Interactive visualization tools can help researchers exploit this data more fully. Our easy-to-use web tool, SPRING, provides a simple interface for open-ended investigation of gene expression topology.
Funding
C.W. and S.W. are supported by NIH training grant [5T32GM080177-07] and A.M.K. by NIH Grant 1R33CA212697, a Burroughs-Wellcome Career Award at the Scientific Interface, and by an Edward J Mallinckrodt Foundation Fellowship.
Conflict of Interest: none declared.
Supplementary Material
Supplementary Data
References
- Amir E.-A.D. et al. (2013) Visne enables visualization of high dimensional single-cell data and reveals phenotypic heterogeneity of leukemia. Nat. Biotech., 31, 545–552. [DOI] [PMC free article] [PubMed] [Google Scholar]
- Bendall S.C. et al. (2014) Single-cell trajectory detection uncovers progression and regulatory coordination in human b cell development. Cell, 157, 714–725. [DOI] [PMC free article] [PubMed] [Google Scholar]
- Haghverdi L. et al. (2015) Diffusion maps for high-dimensional single-cell analysis of differentiation data. Bioinformatics, 31, 2989–2998. [DOI] [PubMed] [Google Scholar]
- Islam S. et al. (2011) Characterization of the single-cell transcriptional landscape by highly multiplex rna-seq. Genome Res., 21, 1160–1167. [DOI] [PMC free article] [PubMed] [Google Scholar]
- Jacomy M. et al. (2014) Forceatlas2, a continuous graph layout algorithm for handy network visualization designed for the gephi software. PLoS One, 9, 1–12. [DOI] [PMC free article] [PubMed] [Google Scholar]
- Setty M. et al. (2016) Wishbone identifies bifurcating developmental trajectories from single-cell data. Nat. Biotech., 34, 637–645. [DOI] [PMC free article] [PubMed] [Google Scholar]
- Xu C., Su Z. (2015) Identification of cell types from single-cell transcriptomes using a novel clustering method. Bioinformatics, 31, 1974–1980. [DOI] [PMC free article] [PubMed] [Google Scholar]
Associated Data
This section collects any data citations, data availability statements, or supplementary materials included in this article.
Supplementary Materials
Supplementary Data