Origin and differentiation of human memory CD8 T cells after vaccination (original) (raw)
. Author manuscript; available in PMC: 2018 Jul 9.
Published in final edited form as: Nature. 2017 Dec 13;552(7685):362–367. doi: 10.1038/nature24633
Abstract
The differentiation of human memory CD8 T cells is not well understood. Here we address this issue using the live yellow fever virus (YFV) vaccine, which induces long-term immunity in humans. We used in vivo deuterium labelling to mark CD8 T cells that proliferated in response to the virus and then assessed cellular turnover and longevity by quantifying deuterium dilution kinetics in YFV-specific CD8 T cells using mass spectrometry. This longitudinal analysis showed that the memory pool originates from CD8 T cells that divided extensively during the first two weeks after infection and is maintained by quiescent cells that divide less than once every year (doubling time of over 450 days). Although these long-lived YFV-specific memory CD8 T cells did not express effector molecules, their epigenetic landscape resembled that of effector CD8 T cells. This open chromatin profile at effector genes was maintained in memory CD8 T cells isolated even a decade after vaccination, indicating that these cells retain an epigenetic fingerprint of their effector history and remain poised to respond rapidly upon re-exposure to the pathogen.
The cardinal properties of memory CD8 T cells are rapid elaboration of effector function and the ability to proliferate when they re-encounter a pathogen1. Memory cells also persist for extended periods after antigen has been cleared to provide long-term immunity2. Indeed, functional virus-specific memory CD8 T cells can be detected in humans for several decades following acute viral infections or immunization with live attenuated vaccines3,4. However, fundamental issues about the origin of human memory CD8 T cells, their differentiation and the dynamics of their turnover rate in vivo have not been well defined5–7. In this study, we address these questions by labelling human virus-specific CD8 T cells in vivo with deuterium, and longitudinally tracking the labelled antigen-specific cells as they transition through the naive-to-effector and memory stages of T cell differentiation. We use the highly effective live attenuated YFV vaccine (YFV-17D), which confers long-term immunity in humans and allows us to longitudinally monitor YFV tetramer+ CD8 T cells in the blood after vaccination. As there is no YFV circulating in the United States, this vaccine allows us to immunize YFV-naive individuals and characterize a primary human CD8 T cell response to an acute viral infection, and to examine the generation and maintenance of memory CD8 T cells in the absence of subsequent viral re-exposure8.
Marking virus-specific CD8 T cells with deuterium
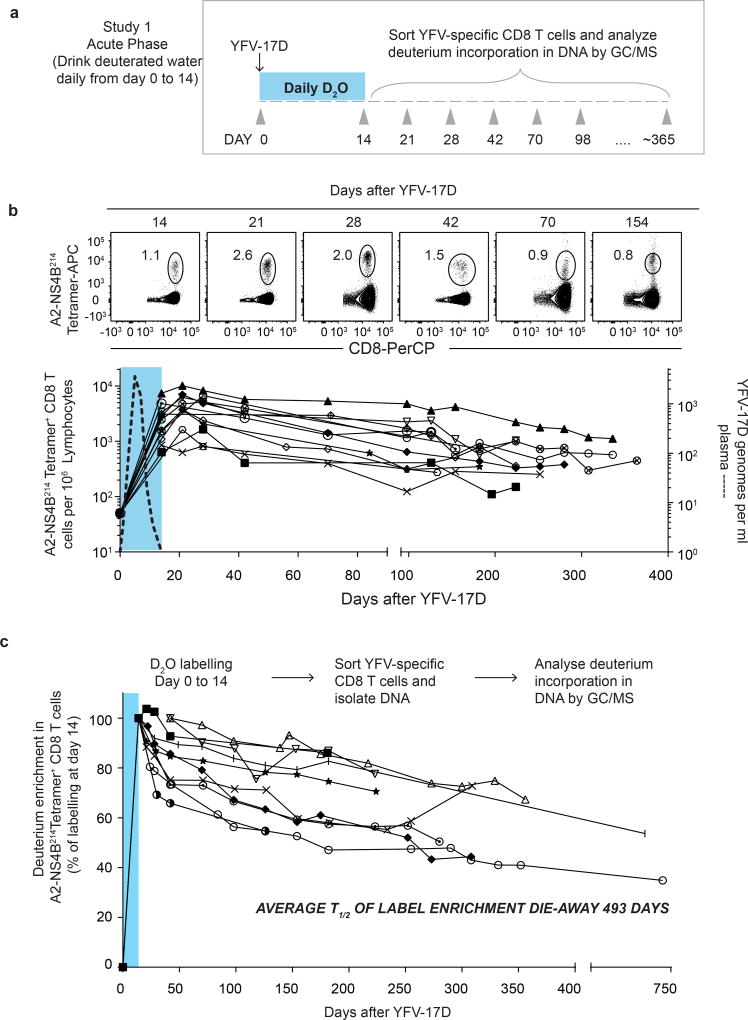
We vaccinated individuals who expressed the human leukocyte antigen HLA-A2 and thus had CD8 T cells specific for the HLA-A2 restricted epitope in the NS4b protein (A2-NS4B214) of the virus. In our first deuterium labelling study, vaccinees took heavy water (D2O) daily for the first two weeks after YFV-17D vaccination, and their blood was sampled at multiple subsequent time points (study 1; Fig. 1a). Longitudinal analysis of the frequencies of virus-specific A2-NS4B214 tetramer+ CD8 T cells in this group showed the typical stages of CD8 T cell expansion, contraction and maintenance (Fig. 1b). At each of the time points indicated, we sorted tetramer+ CD8 T cells using fluorescence-activated cell sorting (FACS) and then used gas chromatography–mass spectrometry (GC–MS) to quantify the deuterium content in their DNA (Fig. 1c) as well as in body water samples (body water sampled from plasma or saliva; Extended Data Fig. 1). Heavy water was enriched in body water and was subsequently washed out of the system by day 42 after vaccination, consistent with previously reported kinetics9–12. In this study, the D2O intake from day 0 to 14 was coincident with the period in which virus-specific CD8 T cells went through robust proliferation; consequently, tetramer+ CD8 T cells had incorporated the maximum possible levels of deuterium from the D2O enrichment in body water over the two weeks following vaccination. This incorporation of deuterium into the DNA of cells that divided while D2O was present can reveal the rate of cell division. The dilution of deuterium in cells following cessation of heavy water intake provides an additional method of measuring the rate of cell division9,12. In this case, the die-away of deuterium over time represents the rate at which labelled virus-specific CD8 T cells divide and incorporate unlabelled DNA strands through cell proliferation. Our analysis of tetramer+ CD8 T cells sorted at successive time points over the next 250–750 days showed that deuterium enrichment levels in the YFV-specific CD8 T cells exhibited only slight dilution by newly divided cells (Fig. 1c, Supplementary Table 1, cell division rate 0.17 ± 0.09% per day) corresponding to a half-life of deuterium enrichment in the tetramer-sorted population that averaged more than a year (493 days) in the period after washout of heavy water. These data establish two notable points. First, the high deuterium enrichment that remains in the YFV-specific memory CD8 T cells 1–2 years after vaccination shows that this population is seeded by T cells that underwent extensive proliferation and were ‘marked’ by deuterium when they were first generated during the effector stage of the immune response. Second, the surviving YFV-specific memory CD8 T cells exhibit notable proliferative quiescence and have a very long inter-mitotic interval (greater than one year).
Figure 1. Measuring the turnover rate and half-life of human YFV-specific CD8 T cells using in vivo deuterium labelling.
a, Design for study 1. b, FACS plots show percentage of tetramer+ CD8 T cells in a representative vaccinee. Graph shows the longitudinal analysis of YFV-specific tetramer+ CD8 T cells in the blood after vaccination (solid lines, n = 12). The period of D2O intake is shown as a shaded blue area; the kinetics of YFV-17D genomes in the plasma from a separate group of vaccinees is shown as a dashed line. APC, allophycocyanin, PerCP, peridinin chlorophyll. c, Dilution curves of the deuterium enrichment in A2-NS4B214 tetramer+ CD8 T cells sorted at various times post-vaccination, in study 1 (n = 10). The average _T_1/2 of label enrichment was calculated after wash-out of deuterium from body water (day 42 onwards). Data for each vaccinee are shown as a percentage of the label incorporation seen at the end of the heavy water intake period.
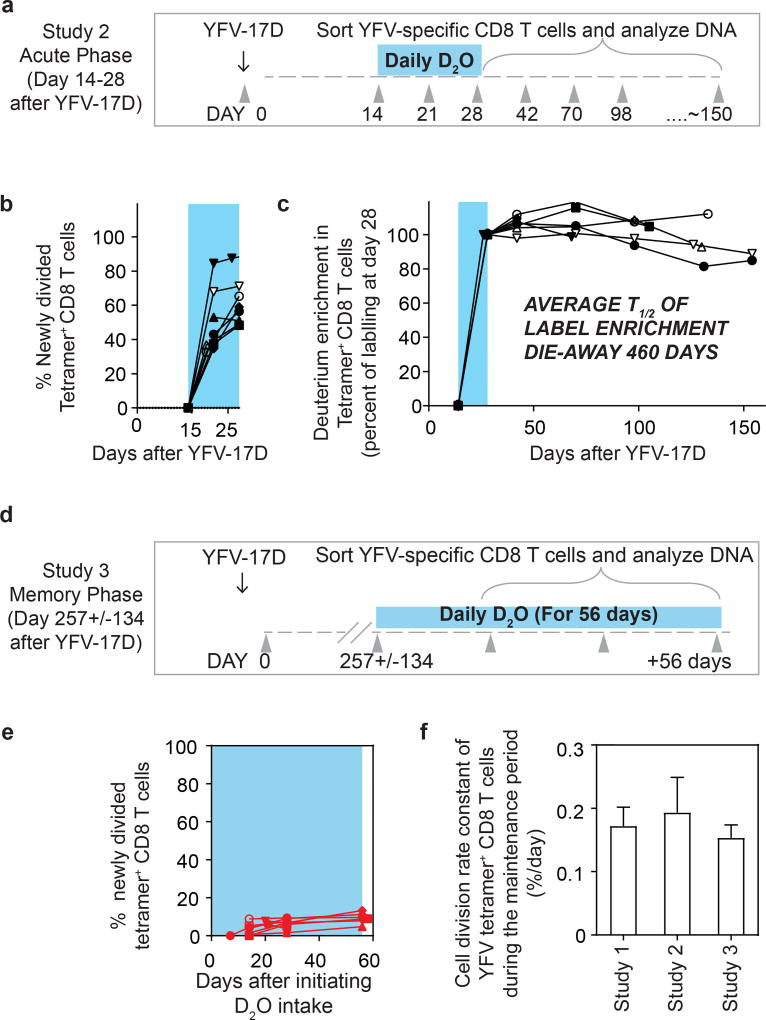
Interestingly, the deuterium enrichment in study 1 did not undergo exponential decay in a monophasic fashion but instead showed biphasic dilution kinetics. A sharper decline was observed in the two weeks immediately after the vaccinees discontinued D2O intake (die-away rate 1.1 ± 0.7% per day) and a more gradual decline was seen thereafter (0.17 ± 0.09% per day, as noted above) in the second phase of the deuterium die-away curve. To investigate this result, we studied a second group of vaccinees in whom D2O intake was initiated 14 days after vaccination and was continued until day 28 (study 2; Fig. 2a). Tetramer frequencies and D2O washout for this group followed the expected kinetics (Extended Data Fig. 2a, 2b). At the conclusion of heavy water intake at day 28 post-vaccination, deuterium labelling showed that 65.7 ± 14.8% (compared to the maximal proportion of labelled cells seen at the end of day 14 in study 1) of YFV-specific CD8 T cells (Fig. 2b) were newly divided. Most of this proliferation was seen between days 14 and 21, which produced an average of 51.3 ± 18.8% newly divided cells, followed by an increase of another 14.4% between days 21 and 28. This demonstrates that, in addition to the very extensive CD8 T cell expansion that occurs during the first two weeks after vaccination, there is still substantial proliferation between days 14 and 28. Thus, in study 1 (Fig. 1c), the initial rapid dilution phase of deuterium enrichment (between days 14 and 28) in the DNA of CD8 T cells is explained by the input of new cells arising from continued division after the D2O levels in the body had diminished (Extended Data Fig. 1). Viraemia was below detectable limits by day 11 (Fig. 1b), but it is likely that the delayed proliferation seen between days 14 and 28 was driven by residual antigen in the tissues. In study 2, the die-away of deuterium enrichment in YFV-specific memory CD8 T cells that were labelled during days 14–28 after vaccination no longer exhibited an initial phase of more rapid dilution after heavy water intake ceased (Fig. 2c). This is consistent with the finding from label incorporation that T cell proliferation had slowed considerably by day 28. The subsequent die-away of deuterium enrichment in the DNA of virus-specific CD8 T cells labelled during days 14–28 was now monophasic and extremely slow, with an average _T_1/2 of 460 days (Fig. 2c, cell division rate 0.19 ± 0.10 per day). These results again show that, following the initial phase of antigen-driven proliferation, YFV-specific CD8 T cells enter a quiescent phase with a remarkably slow rate of cell division as early as 30 days after vaccination. Even 1–2 years after vaccination, the majority of YFV-specific CD8 T cells present were from the original cohort of cells that had proliferated in the first few weeks in response to the vaccine.
Figure 2. Heavy water labelling during different stages of the immune response to investigate the in vivo kinetics of YFV-specific CD8 T cells.
a, Design for study 2. b, The percentage of YFV-tetramer+ cells that incorporated deuterium during the D2O intake period (shaded blue area). c, Die-away curves of deuterium enrichment after label washout. Data are normalized to maximum label incorporation, seen at day 28 (n = 7). d, Design for study 3. e, The percentage of newly divided A2-NS4B214 tetramer+ CD8 T cells that incorporated deuterium during the D2O intake period (shaded blue area) for study 3 (n = 8). f, The cell division rate constants of YFV-specific memory CD8 T cells, calculated either by die-away kinetics of deuterium enrichment (reflecting dilution rates of labelled cells by unlabelled cells; studies 1 and 2) or by kinetics of deuterium uptake (reflecting division rates of labelled cells; study 3). The corresponding _T_1/2 of the deuterium enrichment (and hence the division rate of tetramer+ memory CD8 T cells) is 493 days (study 1), 460 days (study 2) or 476 days (study 3). Bar graphs show mean and s.e.m.
Quantifying memory CD8 T cell half-life in vivo
We next sought to measure directly the in vivo rate of proliferation of resting virus-specific memory CD8 T cells during the maintenance stage of the immune response. In study 3, a new group of HLA-A2+ vaccinees initiated D2O intake at 4–9 months post vaccination (that is, during the memory phase), drinking D2O daily for 56 days. Deuterium incorporation was again quantified in the DNA of A2-NS4B214 tetramer+ CD8 T cells sorted during the D2O intake period (study 3; Fig. 2d). In this study, heavy water intake needed to be continued for a longer duration because of the slow rate of cell proliferation, which we had established based on the basis of dilution of deuterium enrichment during the maintenance stage of memory (studies 1 and 2). D2O levels in the body water plateaued by day 14 and remained stable until the end of the D2O intake period (Extended Data Fig. 2c). In each donor, deuterium incorporation among tetramer+ CD8 T cells increased extremely slowly with time, with an average of 8.2 ± 2.6% newly divided cells after 56 days (Fig. 2e). This proliferation rate during the memory phase was substantially lower than the antigen-driven proliferation rate seen during the acute post-vaccination stage (Extended Data Fig. 2d, e). Notably, the cell division rate (0.15 ± 0.045% per day, corresponding to a doubling time of 476 days) for tetramer+ memory CD8 T cells in these subjects was comparable to the doubling times calculated by the dilution rate of deuterium enrichment after labelling of effectors during the acute stage (Fig. 2f, Extended Data Fig. 2f). It is interesting to compare the turnover rate of virus-specific memory CD8 T cells in humans and mice. Earlier work using the mouse LCMV acute infection model has shown that virus-specific memory CD8 T cells divide about every 45 days in mice13, whereas human YFV memory CD8 T cells have an intermitotic interval that is more than ten times longer.
Our investigations into the turnover rate of the surviving deuterium-labelled YFV-specific memory CD8 T cells found that these cells have a long intermitotic phase and divide only once every 485 days on average. However, it is worth noting that the total number of YFV-specific memory CD8 T cells declined at a faster rate compared our calculated cell division rate over the 1–2-year post-vaccination period (Fig. 1b). The net rate of cell loss was 0.57 ± 0.25% per day (corresponding to a _T_1/2 of 123 days) and this can be added to the cell division rate (0.17% per day) to calculate a death rate (rate at which cells disappeared from circulation) of 0.74% per day (corresponding to a _T_1/2 of 94 days). Stated differently, the average life-span of the population of YFV-specific CD8 T cells after vaccination is dominated by the rate of net cell loss. It is, however, important to make a distinction between the longevity of the majority of the cells in the starting population, which clearly declines over the first few years post-vaccination, and how the cells that persist are maintained. If our kinetic data had revealed a cell division rate or doubling time comparable to the cell-loss rate (_T_1/2 of 123 days), rather than a doubling time of 485 days, after 1 year less than 10%—and after 2 years less than 1%—of the remaining cells in the YFV-specific CD8 T cell population would have retained the deuterium label. By contrast, we found that 90% of the YFV-specific memory CD8 T cells present six months after vaccination were the original labelled cells (Fig. 2c), and even after 1–2 years these labelled cells represented the majority of the remaining virus-specific memory CD8 T cells (Fig. 1c). Thus, the YFV-specific CD8 T cells that remain in the population are not only quiescent but have survived for at least 1–2 years, suggesting that there exists a subset of long-lived memory cells.
Previous deuterium labelling studies in humans12,14–16, investigating the turnover rate of bulk memory CD8 T cell subsets, have reported higher rates of cell proliferation than those we have found when tracking YFV-specific CD8 T cells (Figs 1, 2). In these earlier studies, the specificity and antigenic history of the T cells being analysed was not known. Without this information, it is difficult to distinguish between the proliferation of T cells recently activated by an antigen and the homeostatic proliferation of long-lived memory cells. It is likely that at least some of the proliferation observed in bulk memory T cell subsets may represent the cycling of recently activated T cells stimulated by antigen, rather than the homeostatic proliferation of memory cells. Our YFV studies not only track CD8 T cells of defined antigen specificity using major histocompatibility complex (MHC) class I tetramers, but also record when these T cells were generated and when the virus was cleared, thus providing more definitive information on human memory T cell life-span and turnover rate.
Tracking effector to memory transition
To investigate the changes that occur as YFV-specific CD8 T cells transition from the naive stage to the effector and memory stages of differentiation, we analysed the transcriptional and epigenetic profiles of naive CD8 T cells and YFV-specific effector (day 14) and memory (days 120–180) cells (Extended Data Fig. 3a–c). This longitudinal tracking showed that cell cycle and DNA synthesis were prominent among the pathways that were upregulated in the effector transcriptome, which returned to naive levels in the memory CD8 T cells (Extended Data Fig. 4). A similar pattern was seen with targets of the E2F family of transcription factors that are involved in cell cycle control. Protein-translation-related gene sets were among the most downregulated programs in effector cells, but were re-expressed in memory CD8 T cells. Among the programs that shared the same expression pattern in effector and memory CD8 T cells, immune-related pathways including cytokine signalling featured prominently. Genes with binding sites for LEF1 and NFAT occurred in both the transient effector-specific program and in the programs that were maintained during memory differentiation. To further investigate the transcriptional programming of YFV-specific CD8 T cells, we analysed genome-wide DNA methylation profiles in naive and tetramer+ effector and memory CD8 T cells17,18 (Extended Data Fig. 3c). As the YFV-specific CD8 T cells transitioned from the naive to the effector program, over 25,000 regions showed considerable de novo methylation; about 30% of these regions remained methylated in memory cells. In addition to de novo methylation, effector differentiation was associated with demethylation in nearly 8,000 regions, of which over 50% remained demethylated in YFV-specific memory CD8 T cells. This sharing of DNA methylation marks between YFV-specific effector and memory CD8 T cells suggests a lineage relationship between these two populations.
Defining long-lived memory CD8 T cells
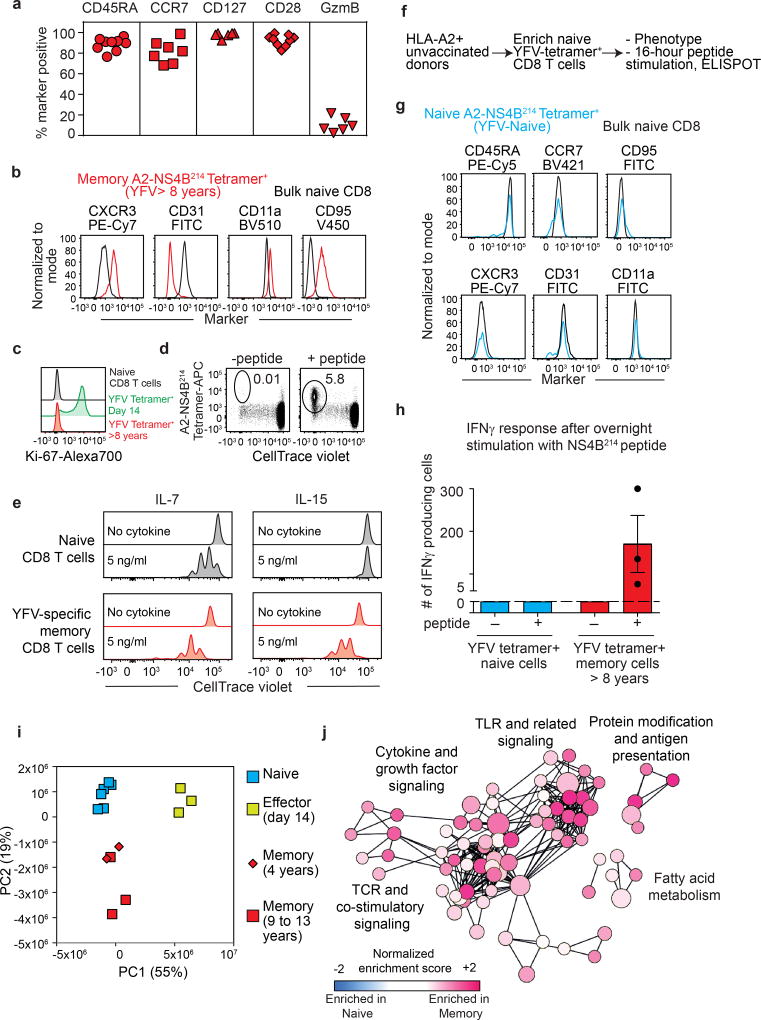
As the YFV vaccine induces long-term immunity, we next characterized the memory CD8 T cells that are present several years after vaccination. Phenotypic analysis of tetramer+ CD8 T cells isolated from vaccinees a decade after vaccination showed that long-lived YFV-specific memory CD8 T cells express CD45RA and CCR7, which are not expressed by effector YFV-specific CD8 T cells. Long-lived memory CD8 T cells also displayed increased expression of CD28 and CD127, but lacked granzyme B expression, a phenotype that they hold in common with naive CD8 T cells (Fig. 3a). However, these YFV-specific memory CD8 T cells could be distinguished from naive CD8 T cells by their expression of markers such as CXCR3, CD31, CD11a (LFA-1) and CD95 (Fig. 3b). A recent study19 also described YFV-specific long-term memory CD8 T cells with a similar phenotype to that identified in our analysis. Consistent with their quiescent nature, YFV-specific memory CD8 T cells lacked detectable levels of Ki-67 unlike the high levels seen in the YFV-specific effector CD8 T cells (Fig. 3c). Further characterization of A2-NS4B214 tetramer+ CD8 T cells isolated from vaccinees several years post-vaccination revealed functional features characteristic of antigen-experienced T cells. First, YFV-specific memory CD8 T cells proliferated readily in vitro in response to the A2-NS4B214 peptide (Fig. 3d). Second, they showed higher proliferative capacity than naive CD8 T cells in a dose-dependent manner when cultured in vitro with cytokines involved in homeostatic proliferation (IL-7 and IL-15; Fig. 3e, Extended Data Fig. 5). Third, these long-lived YFV-specific memory CD8 T cells rapidly produced interferon-γ (IFNγ) in response to peptide stimulation (Fig. 3h). By contrast, naive A2-NS4B214 tetramer+ CD8 T cells isolated from unvaccinated donors (Fig. 3f, g) were not capable of this rapid IFNγ production after peptide stimulation (Fig. 3h). These results show that although long-lived YFV-specific memory CD8 T cells have a phenotype that resembles naive CD8 T cells in many respects, these resting memory cells are poised to rapidly elaborate effector functions.
Figure 3. Phenotypic, functional and transcriptional profiling of long-lived YFV-specific memory CD8 T cells.
a, Phenotype of A2-NS4B214 tetramer+ CD8 T cells in individuals vaccinated 8–12 years previously (n = 6–9). b, Expression of markers that distinguish A2-NS4B214 tetramer+ memory CD8 T cells of individuals vaccinated over a decade previously (red) from naive CD8 T cells (black), n = 7. c. Expression of proliferation marker Ki-67 in naive (black), YFV-tetramer+ day 14 (green) and YFV-tetramer+ long-term memory CD8 T cells (red, n = 3). d, e, Proliferation of YFV-specific long-term (>8 years) memory CD8 T cells in vitro after stimulation with NS4B214 peptide (d, n = 3) or homeostatic cytokines (e, n = 3). Histogram plots are gated on tetramer+ CD8 T cells. f, Experimental setup for isolation and characterization of naive YFV-tetramer+ CD8 T cells from unvaccinated individuals. g, Phenotypic analysis of A2-NS4B214 naive tetramer+ CD8 T cells from unvaccinated individuals (blue, n = 3) and total naive CD8 T cells (black, n = 3). h, IFNγ production (mean ± s.e.m.) by tetramer-enriched CD8 T cells from unvaccinated individuals (n = 3) or from individuals vaccinated more than 8 years previously (n = 3). The dashed line shows the limit of detection. In the absence of peptide controls, no spots were detected in the cells from either unvaccinated or vaccinated individuals. i, Principal component analysis of RNA-seq data from naive and YFV-tetramer+ effector and memory CD8 T cells. Each data point represents one sample. j, Pathway analysis of RNA-seq data comparing YFV-specific long-term memory CD8 T cells and naive CD8 T cells. Circle size represents the number of genes in the gene set and length of connecting lines is proportional to how many genes overlap.
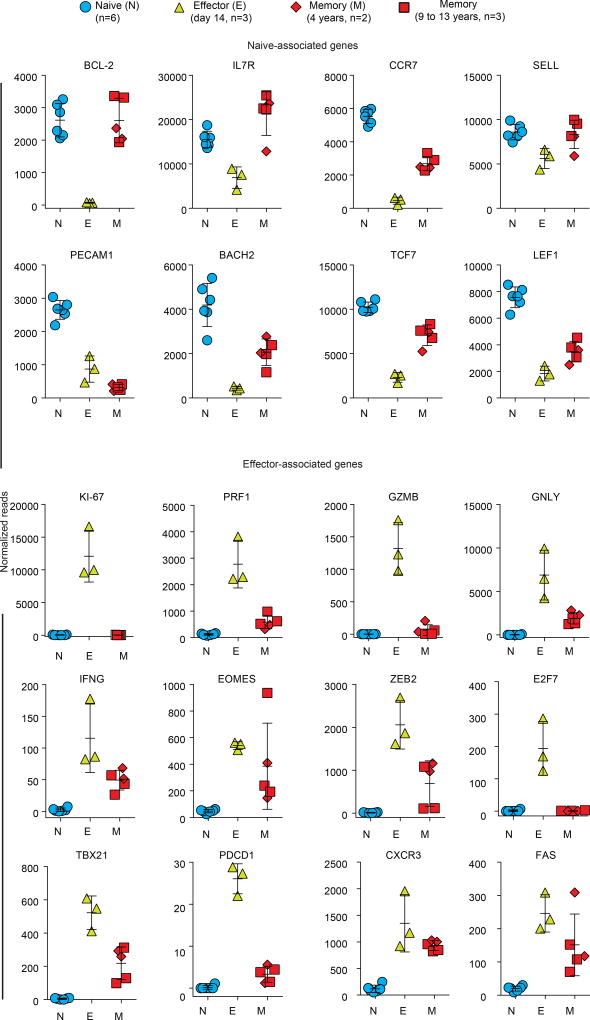
Next, we performed RNA-seq analysis of YFV tetramer-sorted cells to define the transcriptional program of memory CD8 T cells that persist years after vaccination or clearance of acute YFV infection. Principal component analysis showed that naive YFV effector (day 14) and YFV memory (4–13 years) cells clustered into three distinct groups, but that the transcriptome of the YFV-specific long-lived memory CD8 T cells was more naive-like than effector-like (Fig. 3i). Consistent with this, many naive-associated genes that were downregulated in effector CD8 T cells were expressed by the long-term YFV-specific memory CD8 T cells, and several transcripts that were upregulated during naive-to-effector CD8 T cell differentiation were downregulated in memory cells (Extended Data Fig. 6). By comparing these human YFV CD8 T cell signatures with published data25 from mouse effector and memory CD8 T cells, we found similarities between human and mouse transcriptional programs (Extended Data Fig. 7, Supplementary Table 2).
Although the YFV memory cell transcriptional signature was more naive-like than effector-like, it was distinct from naive CD8 T cells (Fig. 3i). To better understand these differences, we performed pathway analysis using the genes that distinguished between naive and YFV memory CD8 T cells (Fig. 3j). This analysis showed that T cell receptor and cytokine signalling pathways were enriched in memory cells, suggesting that these long-lived human memory CD8 T cells had acquired an enhanced ability to respond to antigen and cytokines. Interestingly, the toll-like-receptor-mediated signalling pathway was also enriched in memory CD8 T cells. In addition, memory cells displayed increased fatty-acid metabolism, consistent with previous studies showing the importance of this pathway in the survival and self-renewal of memory CD8 T cells20.
Epigenetic signature of memory CD8 T cells
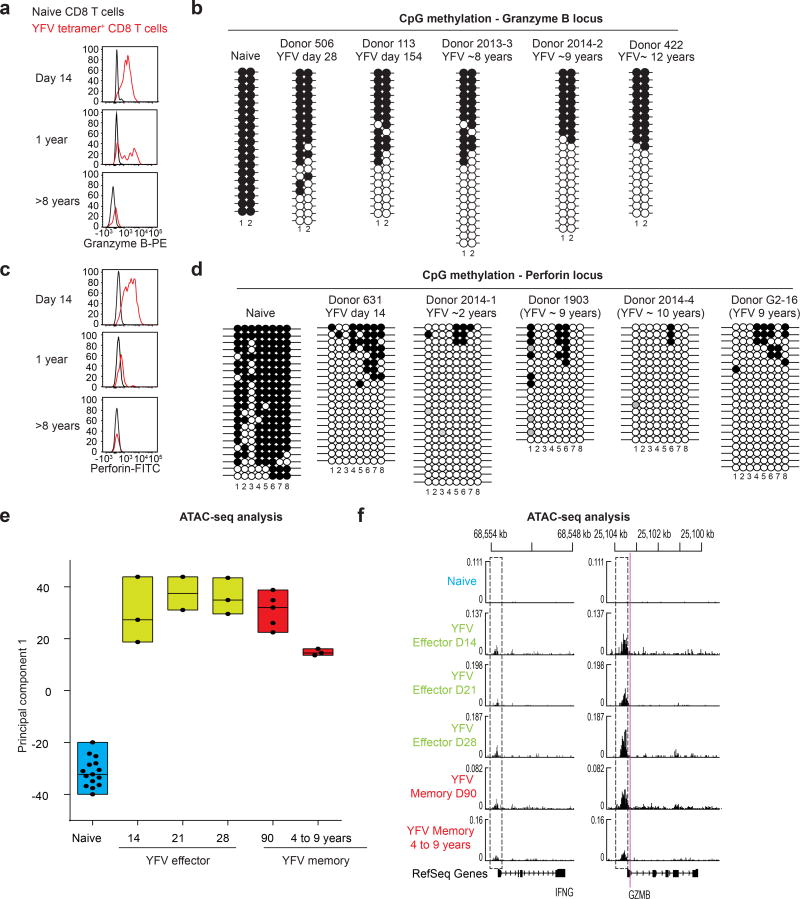
YFV-specific effector CD8 T cells express high levels of granzyme B and perforin; memory cells present several years after vaccination do not express these effector molecules (Fig. 4a, c). This raised the question of whether the DNA methylation of these genes also differed between effector CD8 T cells and long-term memory cells. Consistent with the high level of granzyme B expression in both YFV-specific effector CD8 T cells and memory cells at earlier time points (6–12 months), CpG sites near the granzyme B transcriptional start site were demethylated, compared with those in naive CD8 T cells (Fig. 4a, b). More interestingly, however, these two CpG sites remained demethylated in the long-lived YFV-specific memory CD8 T cells, despite the lack of granzyme B expression in these cells. On performing a similar analysis of a CpG region near the perforin promoter, we found that it was methylated in naive CD8 T cells and nearly completely demethylated in YFV effector CD8 T cells that expressed high levels of perforin (Fig. 4c, d). Remarkably, this region remained equally demethylated in YFV long-term memory CD8 T cells that no longer expressed perforin. Thus, these data provide compelling evidence that long-lived memory CD8 T cells retain an ‘epigenetic memory’ of transitioning through a stage of differentiation that involved a transcriptionally permissive granzyme B and perforin locus.
Figure 4. Long-lived YFV-specific memory CD8 T cells retain the epigenetic marks of their effector history.
a, c, Expression of granzyme B (a) and perforin (c) in naive and A2-NS4B214 effector, early memory and long-term memory CD8 T cells. PE, phycoerytherin; FITC, fluorescein isothiocyanate. b, d, Locus-specific bisulfite sequencing analysis of the CpG regions proximal to the promoter of GZMB (b) or PRF1 (d) in DNA from naive or tetramer+ CD8 T cells. Filled circles, methylated cytosine; open circles, non-methylated cytosine. e, ATAC–seq analysis of open chromatin in naive CD8 T cells (n = 15) and YFV-tetramer+ effector (n = 8), early memory (n = 5) and long-lived memory CD8 T cells (n = 3). Principal component analysis of ATAC–seq data summarizing the median, 25th and 75th percentiles for principal component 1. Each circle represents a sample from one donor. f, Traces of chromatin openness (y axis) near the IFNG and GZMB loci (x axis). The dashed rectangles represent open peaks that were significantly different (Wald test < 0.05) between at least two subpopulations. The purple line indicates the location of the CpGs investigated (in b) for methylation near the GZMB locus.
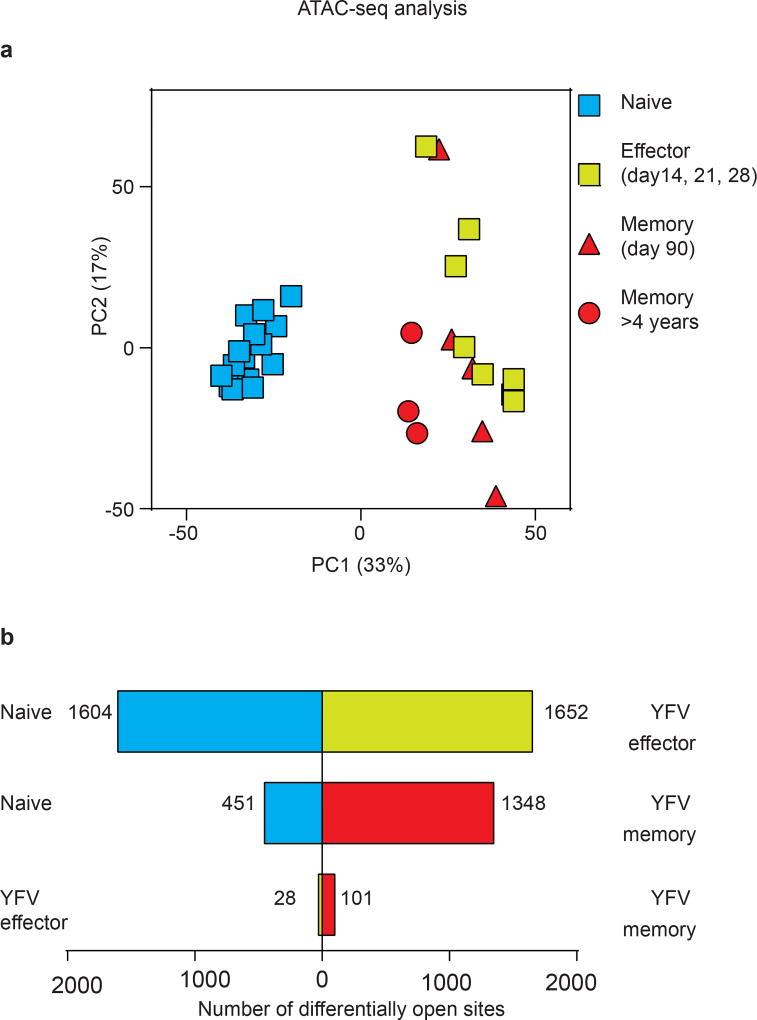
We next investigated transcriptionally open and closed chromatin regions in naive, effector and memory CD8 T cells, using assay for transposase-accessible chromatin with sequencing (ATAC–seq)21. We generated chromatin accessibility maps of naive CD8 T cells and tetramer-sorted YFV-specific effector and memory cells. Principal component analysis of these ATAC–seq data showed that there was a notable similarity between effector and memory CD8 T cells, but that naive CD8 T cells were distinct (Fig. 4e, Extended Data Fig. 8a). We also compared the various CD8 T cell populations with one another, enumerating the number of differentially accessible sites in each pairwise comparison; this analysis also showed that effector and memory cells were highly similar (Extended Data Fig. 8b). Together, these ATAC–seq data and the DNA methylation analysis clearly show that YFV-specific memory CD8 T cells retain an epigenetic memory of their effector history. YFV-specific long-lived memory CD8 T cells have a naive-like transcriptome (Fig. 3i, Extended Data Fig. 6) but an effector-like open chromatin map, suggesting a mechanism by which memory CD8 T cells are poised to rapidly elaborate effector functions. This is succinctly illustrated by the fact that there is open chromatin near the promoters of the IFNG and GZMB genes in both YFV-specific effector cells and YFV-specific memory CD8 T cells, compared with naive cells (Fig. 4f). Consistent with this, long-lived quiescent YFV-specific memory CD8 T cells rapidly produced IFNγ upon stimulation with the cognate peptide, whereas naive tetramer+ YFV-specific CD8 T cells did not (Fig. 3h).
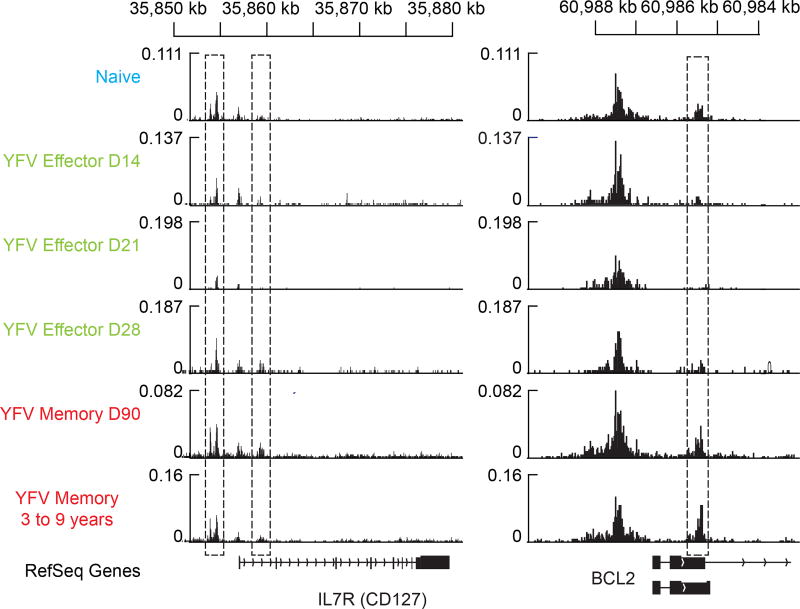
YFV-specific memory CD8 T cells express many naive-associated genes that were downregulated in effector CD8 T cells (Fig. 3, Extended Data Fig. 6). Two classic examples of these genes are CD127 (IL7R) and BCL2, which are essential for the long-term survival of memory T cells. We used the ATAC–seq data to investigate how the chromatin structure at these two genes changes as naive CD8 T cells differentiate into effector and memory cells. We identified open sites at the transcriptional start site (TSS), as well as immediately upstream and downstream of the TSS, for IL7R in naive CD8 T cells, which express high levels of CD127. However, these sites lost accessibility in YFV-specific effector CD8 T cells, which downregulate CD127, and were open in virus-specific memory cells, which express CD127 (Extended Data Fig. 9). A similar pattern was observed for open chromatin regions in the BCL2 gene; notably, an accessible site downstream of the BCL2 TSS that partially closes in effector CD8 T cells exhibits openness to an even greater extent in virus-specific memory CD8 T cells than in naive cells. These data highlight the unique epigenetic fingerprint of long-lived YFV-specific memory CD8 T cells. These memory cells not only have a poised open chromatin at many genes associated with effector cells, but at the same time they also have open sites at key naive-cell-associated genes.
Discussion
This study addresses fundamental questions about the origin, differentiation, turnover rate and longevity of human memory CD8 T cells generated after an acute viral infection. The long-lived YFV-specific memory CD8 T cells that we have characterized are phenotypically similar to the recently defined human stem-cell-like memory CD8 T cells (TSCM)23 (Extended Data Fig. 10). These TSCM cells have gained much attention as a subset of memory cells that are distinct from central memory CD8 T cells and that possess superior capabilities for self-renewal, recall responses and pluripotency22. It is believed that TSCM cells originate directly from naive CD8 T cells without going through a phase in which they express molecules associated with effector function23. Although such a differentiation pathway is plausible, our results support an alternative model in which human memory CD8 T cells have a history of extensive proliferation during the acute phase of infection, and retain epigenetic marks of having expressed effector molecules. In fact, the epigenetic landscape of YFV-specific memory CD8 T cells that are present over a decade after vaccination is much more similar to that of YFV-specific effector cells (day 14) than it is to that of naive CD8 T cells, even though the transcriptional program of these memory cells is more akin to the program of naive cells. Thus, we favour a differentiation model in which memory CD8 T cells originate from a subset of fate-permissive, activated CD8 T cells that not only downregulate effector molecules after antigen has cleared but also re-express naive cell genes such as IL7R, BCL2 and CCR7. The accompanying paper by Youngblood et al analysing memory CD8 T cells in mice provides additional support for this model of differentiation. The expression of these naive cell genes is critical for cell survival and for homing to lymphoid tissues, and the open poised chromatin at effector genes allows these long-lived circulating memory T cells to elaborate effector function rapidly on re-encounter with the pathogen.
METHODS
No statistical methods were used to predetermine sample size. The experiments were not randomized, and the investigators were not blinded to allocation during experiments and outcome assessment.
Human studies
Institutional review board approval was obtained before donor enrolment and written informed consent was obtained from all donors. Details of donors enrolled in the heavy water study (https://clinicaltrials.gov/, NCT01290055) are provided in Supplementary Table 3. Data are presented throughout the manuscript in days after administration of the YFV-17D vaccine. A single dose of 17D live-attenuated yellow fever vaccine strain (YF-VAX) was administered subcutaneously. Seventy per cent heavy water was obtained from CIL and provided in 50-ml aliquots to donors. Donors drank 50 ml three times daily for the first five days, followed by 50 ml twice daily for the remaining periods of intake. Phlebotomy was performed at indicated time points such that blood draw did not exceed one unit over two months. For long-term memory samples from some donors, leukapheresis was performed to obtain sufficient cell numbers.
Flow cytometry, sorting and in vitro experiments
Staining, data acquisition and analysis were done as described previously8,24. For sorting, peripheral blood mononuclear cells (PBMCs) were stained with the YFV-specific tetramers (made in-house) or dextramers (Immudex) and relevant antibodies, washed, and resuspended in sorting buffer (PBS with 1 mM EDTA, 25mM HEPES and 2% FCS), and populations of interest were isolated in a two-step sort on a BD FACS Aria. For analysis of low frequency tetramer+ populations from long-term vaccinees, bead-based tetramer enrichment was used. In our analyses, naive cells were defined as bulk CD45RA+CCR7+ CD8 T cells; we isolated YFV-tetramer+ CD8 cells at various times post-vaccination and defined ‘effector’ and ‘memory’ stages by the time of sampling. The time points (after vaccination) were defined as: effector (day 14–28); memory (day 90 or later); long term memory (3 or more years since vaccine administered).
PBMCs from donors vaccinated at least three years previously were isolated, labelled with CellTrace Violet (CTV) and cultured in complete medium (RPMI with 10% FCS and antibiotics) for nine days in the presence of IL-7 or IL-15 (PeproTech). Additionally, a dose response experiment for IL-7 and IL-15 was done (in five concentrations, from 250 ng ml−1 to 0.05 ng ml−1) using PBMC from YFV vaccinees or sorted naive CD8 T cells from unvaccinated donors. Proliferation was assessed by CTV dilution in gated cells.
Measurement of deuterium enrichment in cellular DNA and body water
The stable isotope labelling method for measuring cell turnover in small cell numbers has been described previously9. In brief, DNA was isolated from FACS-sorted cells and free nucleotides were prepared by enzymatic hydrolysis. Deoxyribose from purine nucleotides was derivatized for GC–MS analysis with pentafluorobenzyl hydroxylamine in acetic acid and acetic anhydride. GC–MS analysis was performed using an Agilent model 5973/6890 GC (Agilent Technologies/Quantum Analytics) in methane NCI mode, with an Agilent DB-17 column (30 m × 250 µm ID × 25-µm film thickness) under selected ion monitoring of m/z 435–437. The excess M+1 (EM1) mass isotopomer abundance was calculated using unenriched DNA standards to correct for the abundance sensitivity of mass isotopomer ratios. The EM1 value represents the isotope enrichment above natural abundance due to the incorporation of D2O into newly synthesized DNA (as deoxyribose). Each analysis was run with two technical replicates (GC–MS injections). Our assay can measure enrichment in cellular DNA reliably from 2,000 cells or fewer, but most of the samples in the present study were in the 10,000–50,000-cell range (typically obtained from 50–100 ml of blood).
Calculation of cell division rates
Rate constants of cell proliferation were determined by two methods: (i) by measuring label incorporation in cellular DNA; and (ii) by measuring label die-away in cellular DNA. The label incorporation and die-away data were converted to rate constants by standard first-order replacement rate kinetic models. These were by intent simple and assumed (i) homogeneity within the pool, and (ii) stable rate constants for birth (p), death (d), and therefore net growth (R), where R = p − d. It can be shown mathematically that if the net cell number is changing exponentially (if total cell numbers vary proportionately to their pool size) and if cells die exponentially, then population-wide birth is also exponential, even though the pool size is not at steady state (for example, where p and d are not equal).
Label incorporation method
During heavy water labelling, the cell division rate constant (k) was derived from k = −ln(1 − f) (ref. 9), in which f represents the fraction of cells that had divided during the observation period, t. In study 2 and study 3, heavy water intake by donors occurred over the course of 14 days and 56 days, respectively; at the end of each labelling period, f was calculated as the ratio of the measured enrichment (EM1) in deoxyribose in sorted cells to the maximum enrichment possible (EM1*) in deoxyribose if the cells were 100% replaced by newly divided cells under these conditions of heavy water exposure, using the equation f = EM1/EM1*. This maximum EM1* is dependent on 2H-enrichment in body water (u), and the number of sites on deoxyribose that are susceptible to deuterium labelling from body water, derived previously3 as EM1* = −7.7268 × _u_2 + 3.5291 × u + 0.0023. In this case, time-averaged 2H-enrichment in body water was calculated from the trapezoid rule and used as the value of u, to account for temporal variations in body water enrichment during heavy water labelling. For study 1, in which virus-specific CD8 T cells had expanded by over 50-fold based on measured A2-NS4B214 tetramer+ cell counts in circulation (Fig. 1b), the measured extent of cell expansion was used to estimate the fraction of newly divided cells (f) present at day 14 for the calculation of the cell division rate constant (k).
Label die-away method
After heavy water intake had ceased, fractional cell division rates in study 1 and study 2 were calculated as the label incorporation rate constant (k) derived by curve-fitting the isotopic enrichment (EM1) in the virus-specific CD8 T cells measured starting at least four weeks after the last dose of heavy water (Fig. 1c), because 2H enrichment was near zero at this time (Extended Data Figs 1, 2b). Isotopic enrichment values from blood samples taken between 4 weeks after the last dose of heavy water and day 150 after vaccination were log-transformed and then fit by linear regression to determine the rate constant k in Prism 5 (Graphpad).
Finally, cell division rates (either individual or group averages) were converted to doubling times as _T_1/2 = ln(2)/k. The fits were to each individual subject’s data, and were very good: the mean _R_2 of the die-away fits was 0.85, with standard error of the fits shown in the table (Supplementary Table 1) (0.17 ± 0.04% per day). The analytic CV of replicate analyses was approximately 3–5%. The curve fits were for each individual subject; the primary data for each individual are plotted in Figs 1, 2 and shown in Supplementary Table 2.
Expression profiling of naive and YFV-specific CD8 T cells using microarray or RNA-seq
The transcriptional profile of A2-NS4B214 tetramer+ effector (day 14, n = 4) and memory CD8 T cells (4–9 months, n = 6) was investigated using microarrays. Total RNA was isolated from FACS-sorted populations of interest and two-round in vitro transcription amplification and labelling was performed according to the Affymetrix protocol. HG U133 Plus 2.0 Arrays (YFV effector CD8 T cells) or HG U133A arrays (YFV memory CD8 T cells) were used. Only probe sets present on both chips were used for comparing the populations. For analysis, batch effects were adjusted using ComBat (an empirical Bayes method) and then a cluster affinity search technique was performed to identify expression patterns. RNA-seq analysis of naive and YFV-tetramer+ effector (day 14) and long-term memory (>3 years) CD8 T cells was done. Library preparation and sequencing for RNA-seq was performed by Hudson Alpha, and sequencing was done using an Illumina Hiseq 2000. Transcript-level expression analysis was performed in R using the Deseq2 package. Genes from the transient or maintained clusters identified in Extended Data Fig. 4 were analysed using MSigDB to identify Reactome pathways and transcription factors associated with each expression pattern.
Comparison of mouse versus human CD8 T cell populations
We compared the RNA-seq data from YFV-tetramer+ CD8 T cells to previously reported microarray data from mouse CD8 T cell populations. We identified five published datasets25–29 pertaining to mouse memory CD8 T cells (GSE10239, naive versus memory; GSE9650 naive versus memory, Kaech et al naive versus memory25; GSE21360, naive versus primary memory; GSE41867, naive versus day 30 memory), and three describing mouse effector CD8 T cells (GSE41867, naive versus day 8; GSE9650 naive versus day 8; Kaech et al naive versus effector25). The gene signatures for each dataset were generated by selecting the top 400 up- and downregulated genes. We then performed gene set enrichment analysis (GSEA) to determine the degree of overlap of human YFV-specific CD8 T cells with the mouse CD8 signatures. Using this analysis, most mouse effector and memory T cell gene sets had strongly positive enrichment scores with respect to human YFV-specific CD8 T cells. Further, upregulated genes generally had higher enrichment scores than the downregulated genes.
We next used the GSEA leading edge analysis tool to identify genes that were regulated in common in the YFV effector and memory phenotypes, and which overlapped with genes in the corresponding mouse signatures. In the effector cells, this included the homing molecules CXCR3 and CCR5, the cytotoxic molecules PRF1, IFNG and GZMB, and the transcription factor ID2. By comparison, the downregulated genes had lower enrichment scores and fewer genes that overlapped between the human and mouse datasets. However, several important surface receptors, such as IL7R and IL6ST, and transcription factors, such as MYC, TCF7, ID3 and LEF1, were conserved across the datasets. In memory cells, many of the genes that were common in the effector subset continued to be expressed differentially in both mouse and human memory datasets. This includes the effector molecules PRF1 and GZMB, the cytokine and chemokine receptors IL18R1, CCR5 and CCR2, and the transcription factors ID3, LEF1 and MYB.
Bisulfite sequencing methylation analysis
By deaminating cytosine using bisulfite treatment, we determined the frequency of cytosine methylation of the target genomic region. Genomic DNA was isolated from FACS-sorted populations of interest and treated with bisulfite using the Zymo EZ-DNA methylation gold kit. Gene-specific PCR was performed, and the PCR product was cloned using the pGEM-T Easy vector system (Promega) and transformed into XL-10 gold ultracompetent bacteria (Agilent). Plasmid DNA was isolated from individual colonies and the insert was sequenced. The granzyme sites interrogated were at +65 to +77 and the perforin sites were −974 to −550 (relative to the TSS). Primers used were: granzyme B; forward, GGTAGAGGTAGTGGGGGTGG and reverse, CTAAAATTCAAAACATTCC; perforin; forward, GTGTGATTTATGAGATATGATGTTATATG and reverse, CCACTTCCTACTCAACCTACATCCCAC.
At the granzyme B sites indicated, we observed 50% demethylation even in effector CD8 T cells that expressed high levels of granzyme B. This suggests the possibility of monoallelic expression for GZMB in humans or that the sites do not predict expression. However, these possibilities do not detract from the finding that the pattern is acquired during the effector stage and maintained in long-term memory CD8 T cells.
Genome-wide DNA methylation profiling
A2-NS4B214 tetramer+ CD8 T cells were isolated by FACS from one donor vaccinated 14 days previously (effector), and another donor vaccinated 166 days previously (memory). To obtain the required cell numbers from the memory donor, a leukapheresis procedure was performed. Total naive CD8 T cells from the memory donor were used as a control. Methylation profiling was performed using MeDIP sequencing services (Active Motif). In brief, genomic DNA was fragmented, and denatured, and a 5-methyl cytosine-specific antibody was used for enrichment of methylated DNA regions on the basis of immunoprecipitation; the enriched DNA samples were amplified and next-generation sequencing performed. Methylated DNA was aligned to the genome using BWA and differentially methylated regions were identified using the Bioconductor package MeDIPS, and custom R scripts. Regions of DNA methylation that were significantly different from one another were identified using the built-in exact test for negative binomial distribution, at a significance level of P < 0.0005. Shared regions of methylation between effector and memory cells were defined as regions that were significantly different in effector compared to naive cells, but not significantly different between effector and memory cells. Secondary data analysis and figures were plotted using custom R scripts.
ATAC–sequencing, peak annotation and statistical analysis
ATAC–seq analysis was performed as previously described21,30. YFV-tetramer+ and naive CD8 T cells were sorted from PBMC at the indicated time points after vaccination. Pellets from 20,000 cells were washed with cold PBS, then with RSB buffer (10 mM Tris-HCl, pH 7.4, 10 mM NaCl, 3 mM MgCl2) and finally with lysis buffer (RSB buffer + 0.1% NP40 + 0.1% Tween 20). The pellet obtained was then resuspended in the transposase reaction mix (25 µl 2× TD buffer, 1 µl Illumina transposase and 24 µl nuclease-free water) and incubated at 37 °C for 30 min. DNA from the transposase reaction was purified using a Qiagen MinElute kit. PCR amplification was performed using Nextera PCR primers. The final libraries were quantified using a KAPA Library Quantification Kit and sequenced on an Illumina HiSeq 2500 by ELIM Biopharm.
Reads were aligned to hg19 using bowtie2, and pairs with a mapping quality of less than 20 were discarded. The reads from all samples were pooled, and a peak file was generated using MACS2. Peaks that overlapped with repetitive regions or low complexity DNA regions (such as satellite DNA or retrotransposons) were removed from the analysis. Peaks were visualized using IGV, with the y axis set at the scale of reads per base pair. Gene and TSS annotations were done on the basis of the RefSeq database. ChIP–seq results in GM12878 were downloaded from the ENCODE project. The ability of the peaks to discriminate between subpopulations was assessed by calculating Spearman correlation coefficients on the 5,000 peaks with the greatest overall variance, following a regularized log transform. Principal components analysis was performed on the same data. To assess differential openness, we ran DESeq2 on the matrix of insertions in peaks by sample. Peaks were considered to be differentially open if the Wald test was less than 0.05, following multiple hypothesis correction with the Benjamini–Hochberg procedure.
Code availability
The custom R scripts used for aligning methylated DNA are available from the corresponding authors upon request.
Data availability
Flow cytometry, data for deuterium die-away kinetics and donor demographics supporting our findings are included in the article, Extended Data Figures and Supplementary Information. Data have been deposited in the GEO repository under accession numbers GSE26437 (microarray analysis), GSE75533 (whole-genome methylation analysis), GSE100745 (RNA-seq analysis) and GSE101609 (ATAC–seq analysis). All other data are available from the corresponding authors upon reasonable request.
Extended Data
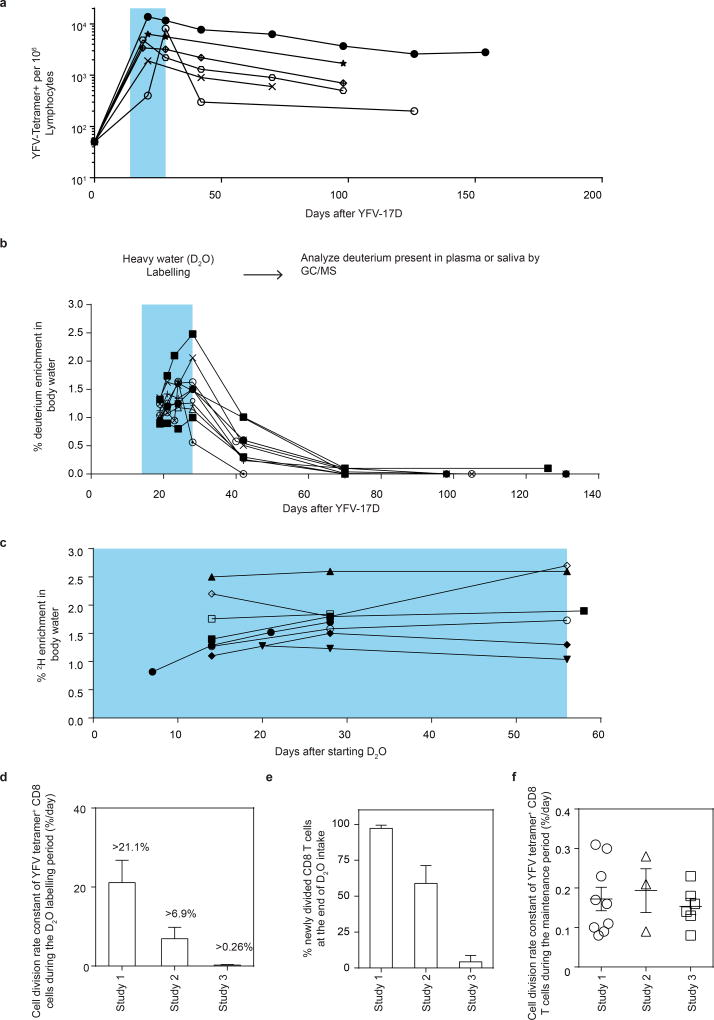
Extended Data Figure 1. The dynamics of deuterium enrichment in body water.
Deuterium enrichment in body water for each vaccinee in study 1 (n = 10). Plasma or saliva was used to sample body water.
Extended Data Figure 2. Investigating the in vivo kinetics of YFV-specific CD8 T cells using heavy water labelling at a range of stages of the immune response to YFV-17D.
a, Kinetics of the CD8 T cell response tracked by MHC class-I tetramer staining for vaccinees in study 2. b, c, Graphs show dynamics of the deuterium enrichment in body water for each vaccinee in study 2 (b, n = 8) and study 3 (c, n = 8). The period of water intake is indicated by the shaded blue area. d. The cell division rate constant (mean and s.d.) of A2-NS4B214 tetramer+ CD8 T cells. This represents the rate per day of newly divided A2-NS4B214 tetramer+ CD8 T cells during the D2O labelling period. Deuterium incorporation at the end of the water intake period in each study was used for this calculation. e. The percentage of deuterium-labelled A2-NS4B214 tetramer+ CD8 T cells (mean and s.d.) at the end of the water intake period in each study. f, The cell division rate constants of YFV-specific memory CD8 T cells during the maintenance period (same data as in Fig. 2f). Each circle represents data from one donor; horizontal lines show mean and s.e.m. The division rate constants were calculated by dilution kinetics of deuterium enrichment (studies 1 and 2) or by incorporation kinetics of deuterium uptake (study 3).
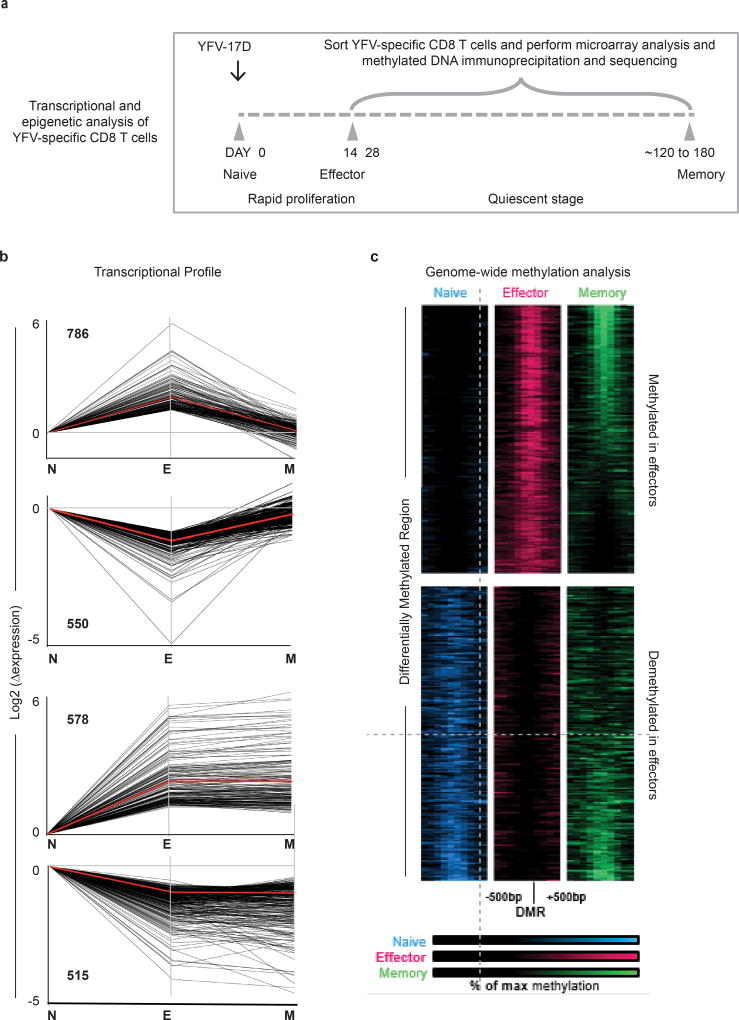
Extended Data Figure 3. Transcriptional and epigenetic changes during effector and memory differentiation of YFV-specific CD8 T cells.
a, Schematic of time points used for transcriptional or epigenetic analysis of tetramer-sorted YFV-specific CD8 T cells. b, Gene expression (by microarray analysis) was normalized to fold change over naive samples, and unsupervised _k_-means clustering was performed. Four major expression patterns emerged: genes that were up- or downregulated during the effector phase and then reverted to the naive state, and genes that were up- or downregulated during the effector stage and persisted into the memory phase. Red lines show the mean expression and numbers on the graph indicate the number of transcripts within each cluster. Data represent mean of four donors for tetramer+ effector CD8 T cells and six donors for tetramer+ memory CD8 T cells. c, MeDIP–seq analysis of genome-wide DNA methylation in bulk naive and tetramer-sorted effector and memory CD8 T cell subsets. The figure shows the top 4,000 regions that were differentially methylated (2,000 methylated and 2,000 demethylated regions) in the YFV-specific effector CD8 T cells relative to the naive CD8 T cells. Each band represents a 1,000-bp region surrounding a differentially methylated region. Regions methylated in naive CD8 T cells (blue), YFV-specific effector CD8 T cells (red) and YFV-specific memory CD8 T cells (green) are shown. Each sample was obtained from a single donor.
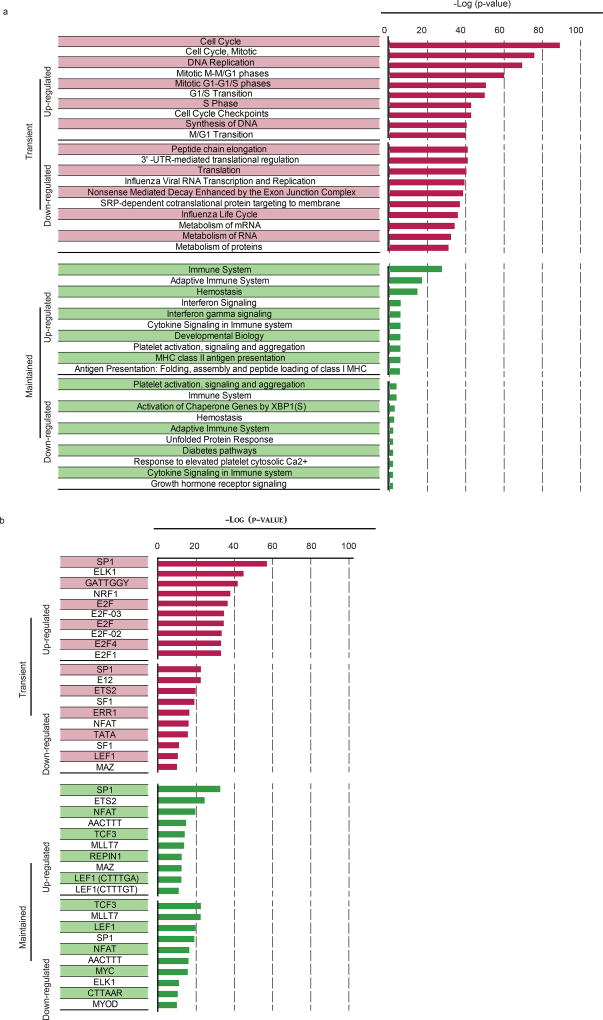
Extended Data Figure 4. Pathways enriched in YFV-specific effector and memory CD8 T cells.
Genes from the transient or maintained clusters identified from the microarray analysis in Extended Data Fig. 3 were analysed using MSigDB to identify Reactome pathways and transcription factors associated with each expression pattern. Figures show the topmost ten significant pathways (a) and transcription factors (b) associated with each expression pattern and the corresponding negative logarithm of the P values.
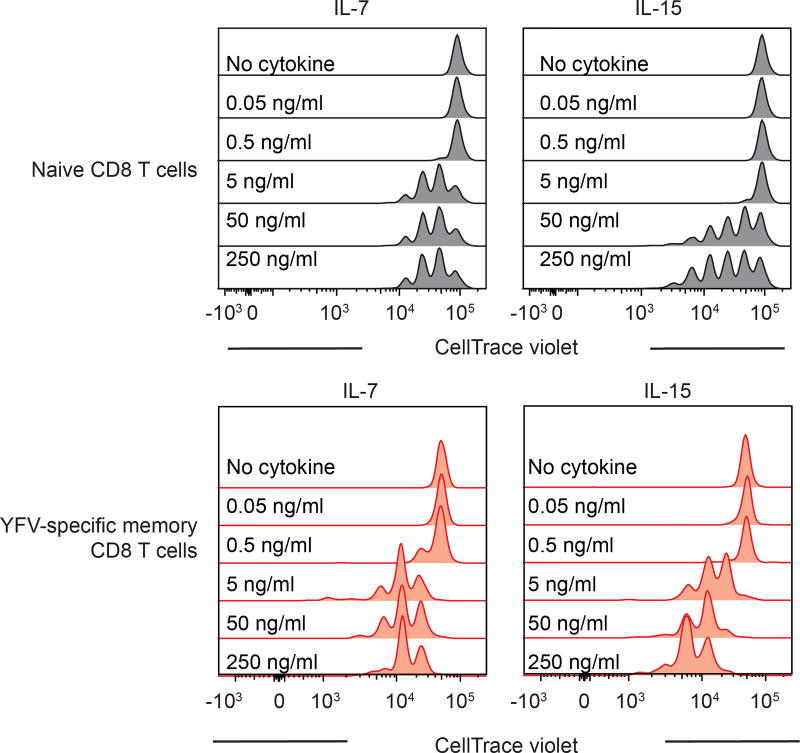
Extended Data Figure 5. Naive and YFV memory CD8 T cell responses to homeostatic cytokines.
Proliferation of naive CD8 T cells (upper panels) or YFV-specific long-term (>8 years) memory CD8 T cells (lower panels) after stimulation in vitro with different doses of IL-7 or IL-15 (n = 3). Histogram plots are gated on naive CD8 T cells or tetramer+ CD8 T cells.
Extended Data Figure 6. RNA-seq analysis of YFV tetramer-sorted effector and long-term memory CD8 T cells.
Scatter graphs show the expression of selected genes plotted as normalized reads (mean ± s.d.) from RNA-seq analysis of naive, YFV-effector (day 14) and YFV-memory (4–13 years) CD8 T cells.
Extended Data Figure 7. Comparing human YFV-specific effector and memory CD8 T cell signatures with mouse effector and memory CD8 T cells.
The RNA-seq data from YFV-tetramer+ effector and long-term memory CD8 T cells was compared with published mouse transcriptional profiles. The datasets used were from Kaech et al., 200225 (1); Doering et al., 201226 (2); Wherry27 et al., 2007 (3); Wirth28 et al., 2010 (4); and Sarkar29 et al., 2008 (5). a, Enrichment plots show the proportion of genes in the leading edge; the colour of the plots shows the normalized enrichment score. The size of the circles represents the number of genes in the mouse signatures that are present in the leading edge of the enrichment plots. b, The GSEA leading edge analysis tool was used to identify genes that were commonly correlated to the effector or memory phenotype and that overlapped with genes in the corresponding mouse signatures.
Extended Data Figure 8. Analysis of open chromatin sites in YFV-specific effector and memory CD8 T cells using ATAC–seq.
ATAC–seq analysis was performed using naive CD8 T cells (n = 15) and YFV-tetramer+ effector (n = 8), early memory (n = 5) and long-lived memory CD8 T cells (n = 3). a, Principal component analysis of ATAC–seq data showing principal component 1 (PC1) versus 2 (PC2). Each circle represents a sample from one donor. b, Comparison of the number of open chromatin peaks that are significantly different between CD8 T cell subsets. Bars to the left, number of open sites in the subset listed to the left; bars to the right, number of open sites in the CD8 T cell subset that was used for comparison. The day 90 YFV-memory (n = 5) and >4 year YFV-memory (n = 3) samples were all placed in the memory group for this comparison.
Extended Data Figure 9. Open chromatin sites near the TSSs of BCL-2 and IL-7R (CD127) in YFV-specific effector and memory CD8 T cells.
Plots show traces of chromatin openness (y axis) at the IL-7R and BCL-2 loci (x axis). The dashed rectangles represent the ATAC–seq peaks identified as open that were significantly different between at least two subpopulations. The RefSeq gene tracks are represented in the bottom row. We identified open sites at the TSS as well as immediately upstream and downstream of the TSS for IL7R in naive cells that all transiently lost accessibility in effector CD8 T cells and then opened in the YFV-specific memory CD8 T cells. A similar temporary pattern was seen for open chromatin regions in the BCL2 gene. We found an accessible site downstream of the BCL2 TSS that partially closes in effector cells but then regains openness to an even greater extent in memory cells than in naive cells, consistent with previous observations that memory cells are characterized by increased BCL-2 expression.
Extended Data Figure 10. Phenotypic comparison between YFV-specific long-term memory CD8 T cells and bulk stem-like memory (TSCM) CD8 T cell population.
Samples were obtained from individuals vaccinated with YFV-17D more than 8 years previously and CD8 T cells enriched by negative selection were used to compare bulk naive and bulk TSCM CD8 T cells with A2-NS4B214 tetramer+ CD8 T cells in the same stain. a, The gating schemes for naive, TSCM and A2-NS4B214 tetramer+ CD8 T cells. b, Histogram plots show the expression of CD58 (LFA-3) and CD122 (IL-2Rβ) on gated naive (filled grey histogram), TSCM (blue) and A2-NS4B214 tetramer+ CD8 T cells (red). Data are representative of three experiments.
Supplementary Material
Supplemental table
Acknowledgments
This work was supported by NIH grants U19AI057266 (R.A.), R01-AI43866-07 (M.H.), NIAID UM1 AI068618 (M.J.Mc.) and NIAID UM1 AI069481 (M.J.Mc.) The authors acknowledge technical support from R. Karaffa and S. Durham for cell sorting.
Footnotes
Supplementary Information is available in the online version of the paper.
Author Contributions R.A., M.H. and R.S.A. designed and analysed experiments. R.S.A., M.F., and S.Y. performed experiments with all other authors assisting with experiments and data analysis. H.T.K. and D.Z. analysed the genomics data. S.E., S.N. and M.J.Mu. directed the clinical part of human studies. R.S.A., K.W.L., H.T.K., R.A. and M.H. wrote the manuscript, with all authors providing feedback.
The authors declare no competing financial interests.
References
- 1.Ahmed R, Gray D. Immunological memory and protective immunity: understanding their relation. Science. 1996;272:54–60. doi: 10.1126/science.272.5258.54. [DOI] [PubMed] [Google Scholar]
- 2.Lau LL, Jamieson BD, Somasundaram T, Ahmed R. Cytotoxic T-cell memory without antigen. Nature. 1994;369:648–652. doi: 10.1038/369648a0. [DOI] [PubMed] [Google Scholar]
- 3.Demkowicz WE, Jr, Ennis FA. Vaccinia virus-specific CD8+ cytotoxic T lymphocytes in humans. J. Virol. 1993;67:1538–1544. doi: 10.1128/jvi.67.3.1538-1544.1993. [DOI] [PMC free article] [PubMed] [Google Scholar]
- 4.Nanan R, Rauch A, Kämpgen E, Niewiesk S, Kreth HW. A novel sensitive approach for frequency analysis of measles virus-specific memory T-lymphocytes in healthy adults with a childhood history of natural measles. J. Gen. Virol. 2000;81:1313–1319. doi: 10.1099/0022-1317-81-5-1313. [DOI] [PubMed] [Google Scholar]
- 5.De Boer RJ, Perelson AS. Quantifying T lymphocyte turnover. J. Theor. Biol. 2013;327:45–87. doi: 10.1016/j.jtbi.2012.12.025. [DOI] [PMC free article] [PubMed] [Google Scholar]
- 6.Surh CD, Sprent J. Homeostasis of naive and memory T cells. Immunity. 2008;29:848–862. doi: 10.1016/j.immuni.2008.11.002. [DOI] [PubMed] [Google Scholar]
- 7.Kaech SM, Wherry EJ. Heterogeneity and cell-fate decisions in effector and memory CD8+ T cell differentiation during viral infection. Immunity. 2007;27:393–405. doi: 10.1016/j.immuni.2007.08.007. [DOI] [PMC free article] [PubMed] [Google Scholar]
- 8.Akondy RS, et al. The yellow fever virus vaccine induces a broad and polyfunctional human memory CD8+ T cell response. J. Immunol. 2009;183:7919–7930. doi: 10.4049/jimmunol.0803903. [DOI] [PMC free article] [PubMed] [Google Scholar]
- 9.Busch R, Neese RA, Awada M, Hayes GM, Hellerstein MK. Measurement of cell proliferation by heavy water labeling. Nat. Protocols. 2007;2:3045–3057. doi: 10.1038/nprot.2007.420. [DOI] [PubMed] [Google Scholar]
- 10.Ladell K, et al. Central memory CD8+ T cells appear to have a shorter lifespan and reduced abundance as a function of HIV disease progression. J. Immunol. 2008;180:7907–7918. doi: 10.4049/jimmunol.180.12.7907. [DOI] [PMC free article] [PubMed] [Google Scholar]
- 11.Ahmed R, et al. Reconciling estimates of cell proliferation from stable isotope labeling experiments. PLOS Comput. Biol. 2015;11:e1004355. doi: 10.1371/journal.pcbi.1004355. [DOI] [PMC free article] [PubMed] [Google Scholar]
- 12.Hellerstein MK, et al. Subpopulations of long-lived and short-lived T cells in advanced HIV-1 infection. J. Clin. Invest. 2003;112:956–966. doi: 10.1172/JCI17533. [DOI] [PMC free article] [PubMed] [Google Scholar]
- 13.Choo DK, Murali-Krishna K, Anita R, Ahmed R. Homeostatic turnover of virus-specific memory CD8 T cells occurs stochastically and is independent of CD4 T cell help. J. Immunol. 2010;185:3436–3444. doi: 10.4049/jimmunol.1001421. [DOI] [PubMed] [Google Scholar]
- 14.Ahmed R, et al. Human stem cell-like memory T cells are maintained in a state of dynamic flux. Cell Reports. 2016;17:2811–2818. doi: 10.1016/j.celrep.2016.11.037. [DOI] [PMC free article] [PubMed] [Google Scholar]
- 15.McCune JM, et al. Factors influencing T-cell turnover in HIV-1-seropositive patients. J. Clin. Invest. 2000;105:R1–R8. doi: 10.1172/JCI8647. [DOI] [PMC free article] [PubMed] [Google Scholar]
- 16.Westera L, et al. Closing the gap between T-cell life span estimates from stable isotope-labeling studies in mice and humans. Blood. 2013;122:2205–2212. doi: 10.1182/blood-2013-03-488411. [DOI] [PubMed] [Google Scholar]
- 17.Deaton AM, Bird A. CpG islands and the regulation of transcription. Genes Dev. 2011;25:1010–1022. doi: 10.1101/gad.2037511. [DOI] [PMC free article] [PubMed] [Google Scholar]
- 18.Sellars M, et al. Regulation of DNA methylation dictates Cd4 expression during the development of helper and cytotoxic T cell lineages. Nat. Immunol. 2015;16:746–754. doi: 10.1038/ni.3198. [DOI] [PMC free article] [PubMed] [Google Scholar]
- 19.Fuertes Marraco SA, et al. Long-lasting stem cell-like memory CD8+ T cells with a naïve-like profile upon yellow fever vaccination. Sci. Transl. Med. 2015;7:282ra48. doi: 10.1126/scitranslmed.aaa3700. [DOI] [PubMed] [Google Scholar]
- 20.Cui G, et al. IL-7-induced glycerol transport and TAG synthesis promotes memory CD8+ T cell longevity. Cell. 2015;161:750–761. doi: 10.1016/j.cell.2015.03.021. [DOI] [PMC free article] [PubMed] [Google Scholar]
- 21.Buenrostro JD, Giresi PG, Zaba LC, Chang HY, Greenleaf WJ. Transposition of native chromatin for fast and sensitive epigenomic profiling of open chromatin, DNA-binding proteins and nucleosome position. Nat. Methods. 2013;10:1213–1218. doi: 10.1038/nmeth.2688. [DOI] [PMC free article] [PubMed] [Google Scholar]
- 22.Gattinoni L, et al. A human memory T cell subset with stem cell-like properties. Nat. Med. 2011;17:1290–1297. doi: 10.1038/nm.2446. [DOI] [PMC free article] [PubMed] [Google Scholar]
- 23.Restifo NP, Gattinoni L. Lineage relationship of effector and memory T cells. Curr. Opin. Immunol. 2013;25:556–563. doi: 10.1016/j.coi.2013.09.003. [DOI] [PMC free article] [PubMed] [Google Scholar]
- 24.Miller JD, et al. Human effector and memory CD8+ T cell responses to smallpox and yellow fever vaccines. Immunity. 2008;28:710–722. doi: 10.1016/j.immuni.2008.02.020. [DOI] [PubMed] [Google Scholar]
- 25.Kaech SM, Hemby S, Kersh E, Ahmed R. Molecular and functional profiling of memory CD8 T cell differentiation. Cell. 2002;111:837–851. doi: 10.1016/s0092-8674(02)01139-x. [DOI] [PubMed] [Google Scholar]
- 26.Doering TA, et al. Network analysis reveals centrally connected genes and pathways involved in CD8+ T cell exhaustion versus memory. Immunity. 2012;37:1130–1144. doi: 10.1016/j.immuni.2012.08.021. [DOI] [PMC free article] [PubMed] [Google Scholar]
- 27.Wherry EJ, et al. Molecular signature of CD8+ T cell exhaustion during chronic viral infection. Immunity. 2007;27:670–684. doi: 10.1016/j.immuni.2007.09.006. [DOI] [PubMed] [Google Scholar]
- 28.Wirth TC, et al. Repetitive antigen stimulation induces stepwise transcriptome diversification but preserves a core signature of memory CD8(+) T cell differentiation. Immunity. 2010;33:128–140. doi: 10.1016/j.immuni.2010.06.014. [DOI] [PMC free article] [PubMed] [Google Scholar]
- 29.Sarkar S, et al. Functional and genomic profiling of effector CD8 T cell subsets with distinct memory fates. The Journal of experimental medicine. 2008;205:625–640. doi: 10.1084/jem.20071641. [DOI] [PMC free article] [PubMed] [Google Scholar]
- 30.Buenrostro JD, Wu B, Chang HY, Greenleaf WJ. ATAC-seq: a method for assaying chromatin accessibility genome-wide. Curr. Protoc. Mol. Biol. 2015;109:21.29.1–21.29.9. doi: 10.1002/0471142727.mb2129s109. [DOI] [PMC free article] [PubMed] [Google Scholar]
Associated Data
This section collects any data citations, data availability statements, or supplementary materials included in this article.
Supplementary Materials
Supplemental table
Data Availability Statement
Flow cytometry, data for deuterium die-away kinetics and donor demographics supporting our findings are included in the article, Extended Data Figures and Supplementary Information. Data have been deposited in the GEO repository under accession numbers GSE26437 (microarray analysis), GSE75533 (whole-genome methylation analysis), GSE100745 (RNA-seq analysis) and GSE101609 (ATAC–seq analysis). All other data are available from the corresponding authors upon reasonable request.
