Genome trees constructed using five different approaches suggest new major bacterial clades (original) (raw)
Abstract
Background
The availability of multiple complete genome sequences from diverse taxa prompts the development of new phylogenetic approaches, which attempt to incorporate information derived from comparative analysis of complete gene sets or large subsets thereof. Such attempts are particularly relevant because of the major role of horizontal gene transfer and lineage-specific gene loss, at least in the evolution of prokaryotes.
Results
Five largely independent approaches were employed to construct trees for completely sequenced bacterial and archaeal genomes: i) presence-absence of genomes in clusters of orthologous genes; ii) conservation of local gene order (gene pairs) among prokaryotic genomes; iii) parameters of identity distribution for probable orthologs; iv) analysis of concatenated alignments of ribosomal proteins; v) comparison of trees constructed for multiple protein families. All constructed trees support the separation of the two primary prokaryotic domains, bacteria and archaea, as well as some terminal bifurcations within the bacterial and archaeal domains. Beyond these obvious groupings, the trees made with different methods appeared to differ substantially in terms of the relative contributions of phylogenetic relationships and similarities in gene repertoires caused by similar life styles and horizontal gene transfer to the tree topology. The trees based on presence-absence of genomes in orthologous clusters and the trees based on conserved gene pairs appear to be strongly affected by gene loss and horizontal gene transfer. The trees based on identity distributions for orthologs and particularly the tree made of concatenated ribosomal protein sequences seemed to carry a stronger phylogenetic signal. The latter tree supported three potential high-level bacterial clades,: i) Chlamydia-Spirochetes, ii) Thermotogales-Aquificales (bacterial hyperthermophiles), and ii) Actinomycetes-Deinococcales-Cyanobacteria. The latter group also appeared to join the low-GC Gram-positive bacteria at a deeper tree node. These new groupings of bacteria were supported by the analysis of alternative topologies in the concatenated ribosomal protein tree using the Kishino-Hasegawa test and by a census of the topologies of 132 individual groups of orthologous proteins. Additionally, the results of this analysis put into question the sister-group relationship between the two major archaeal groups, Euryarchaeota and Crenarchaeota, and suggest instead that Euryarchaeota might be a paraphyletic group with respect to Crenarchaeota.
Conclusions
We conclude that, the extensive horizontal gene flow and lineage-specific gene loss notwithstanding, extension of phylogenetic analysis to the genome scale has the potential of uncovering deep evolutionary relationships between prokaryotic lineages.
Background
The determination of multiple, complete genome sequences of bacteria, archaea and eukaryotes has created the opportunity for a new level of phylogenetic analysis that is based not on a phylogenetic tree for selected molecules, for example, rRNAs, as in traditional molecular phylogenetic studies [1,2], but (ideally) on the entire body of information contained in the genomes. The most straightforward version of this type of analysis, to which we hereinafter refer to as 'genome-tree' building, involves scaling-up the traditional tree-building approach and analyzing the phylogenetic trees for multiple gene families (in principle, all families represented in many genomes), in an attempt to derive a consensus, 'organismal' phylogeny [3-5]. However, because of the wide spread of horizontal gene transfer and lineage-specific gene loss, at least in the prokaryotic world, comparison of trees for different families and consensus derivation may become highly problematic [6,7]. Probably due to all these problems, a pessimistic conclusion has been reached that prokaryotic phylogeny might not be reconstructable from protein sequences, at least with current phylogenetic methods [4].
With the complete genome sequences at hand, it appears natural to seek for alternatives to traditional, alignment-based tree-building in the form of integral characteristics of the evolutionary process. Probably the most obvious of such characteristics is the presence-absence of representatives of the analyzed species in orthologous groups of genes, and recently, at least three groups have employed this approach to build genome trees, primarily for prokaryotes [8-10]. An alternative way to construct a genome tree involves using the mean or median level of similarity among all detectable pairs of orthologs as the measure of the evolutionary distance between species [11]. Yet another possibility involves building species trees by comparing gene orders. This approach had been pioneered in the classical work of Dobzhansky and Sturtevant who used inversions in Drosophila chromosomes to construct an evolutionary tree [12]. Subsequently, mathematical methods have been developed to calculate rearrangement distances between genomes, and, using these, phylogenetic trees have been built for certain small genomes, such as plant mitochondria and herpesviruses [13,14]. These approaches, however, are applicable only to genomes that show significant conservation of global gene order, which is manifestly not the case among prokaryotes [15-17]. Even relatively close species such as, for example, Escherichia coli and Haemophilus influenzae, two species of the γ-subdivision of Proteobacteria, retain very little conservation of gene order beyond the operon level (typically, two-to-four genes in a row), and essentially none is detectable among evolutionarily distant bacteria and ar chaea [15,16,18]. Very few operons, primarily those coding for physically interacting subunits of multiprotein complexes such as certain ribosomal proteins or RNA-polymerase subunits, are conserved across a wide range of prokaryotic lineages [15,16]. On the other hand, pairwise comparisons of even distantly related prokaryotic genomes reveal considerable number of shared (predicted) operons, which creates an opportunity for a meaningful comparative analysis [19][20,21].
The critical issue with all these approaches to genome tree building is to what extent each of them reflects phylogeny and to what extent they are affected by other evolutionary processes, such as lineage-specific gene loss and horizontal gene transfer. Comparative analyses have strongly suggested that these phenomena make major contributions to genome evolution, at least in prokaryotes [7,22-25]. These phenomena have the potential to severely affecting phylogenetic tree topology, particularly when similar sets of genes are lost indifferent lineages because of similar environmental pressures, or when a preferential trend of horizontal gene flow exists between different lineages. The possibility even has been discussed that the amount of lateral gene exchange is such that it invalidates the very principle of representing the evolution of species as a tree; instead, the only adequate representation of evolutionary history could be a complex network [6][25]. Genome-trees seem to be the last resort for the species tree concept. Unless phylogenetic signal can be revealed by at least some approaches based on genome-wide comparisons, the conclusion seems imminent that this concept should be abandoned and replaced by a more complex representation of evolution.
Here, we compare the topologies produced with five, largely independent approaches to genome-tree building: i) presence-absence of genomes in Clusters of Orthologous Groups of proteins (COGs); ii) conservation of local gene order (pairs of adjacent genes) among prokaryotic genomes; iii) distribution of percent identity between apparent orthologs; iv) sequence conservation in concatenated alignments of ribosomal proteins; v) comparative analysis of multiple trees reconstructed for representative protein families. We find that, while the presence-absence approach is most heavily affected by gene loss and horizontal transfer, the other four methods reveal stronger phylogenetic signals. Although the topologies of the trees constructed with different approaches were only partially compatible, three previously unnoticed high-level clades among bacteria were revealed with notable consistency. We suggest that, in spite of all the complexity brought about by horizontal gene transfer and lineage-specific gene loss, these groups reflect certain evolutionary reality, i.e. the trajectory of evolution for a relatively stable gene core. It appears that this is the only meaningful way to treat the notion of a species tree: as the history of a relatively large ensemble of genes, not a comprehensive representation of the history of entire genomes.
Results
New criteria for genome-tree construction
To our knowledge, conserved gene pairs and distributions of identity level between orthologs have not been used previously as the basis for phylogenetic tree construction. Therefore we start by describing the relevant results of prokaryotic genome comparison in somewhat greater detail.
Conserved gene pairs in prokaryotic genomes
The results of the present analysis of conserved gene pairs are consistent with the notion of the fluidity of prokaryotic gene order caused by extensive recombination. Only 17 invariant genes pairs were detected, all of which consists of genes for ribosomal proteins and RNA polymerase subunits. The remaining 4586 gene pairs were missing in at least one genome. The number of gene pairs represented in three, four and a greater number of genomes decayed rapidly, with highly conserved pairs forming the tail of the distribution (Fig. 1). The 95% quantile of this distribution (excluding the highly conserved pairs) was found to fit the geometric model with a high statistical significance (Fig. 1). This is compatible with random, independent loss of gene pairs during evolution suggesting that, with the caveat of horizontal transfer, the number of gene pairs shared by three genomes could reflect the evolutionary distance between them.
Figure 1.
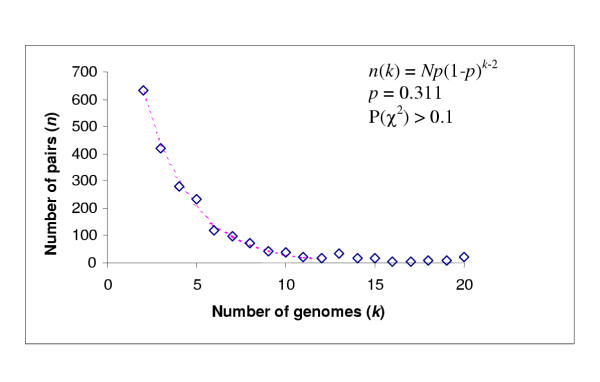
Distribution of conserved gene pairs among 31 clades of prokaryotes. Closely related genomes: E. coli-Buchnera sp., H. influenzae-P. mutocida, C. trachomatis-C. pneumoniae, P. horikoshii-P. abyssi, M. genitalium-M. pneumoniae-U. urealyticum., H. pyroli – C. jejuni, T. acidophilum-T. volcanium, were treated as a single clade. Nis the total number of conserved gene pairs.
The number of conserved gene pairs present in individual prokaryotic genomes varied from 208 for M. genitalium to 2314 for P. aeruginosa (Table 1). Analysis of the co-occurrence of gene pairs among the prokaryotic genomes shows high values of the Jaquard coefficient, which reflect partial conservation of gene order (see legend to Table 1), for closely related species, for example, 0.32 for E. coli and H. influenzae and 0.35 for M. thermoautotrophicum and M. jannaschi (Table 1). The value of this coefficient varied from 0.16 to 0.66, with a mean of 0.26, for archaea, and from 0.04 to 0.87, with a mean of 0.16, for bacteria. In contrast, for archaeal-bacterial comparisons, the values varied from 0.04 to 0.18, with the average of 0.08 (Table 1). These observations appear to indicate that the distribution of conserved gene pairs among prokaryotic genomes carries a phylogenetic signal.
Table 1.
Shared gene pairs in prokaryotic genomes.
| Aer | Sus | Arf | Pyh | Pya | Mej | Met | Has | Tha | Thv | Esc | Vic | Hai | Pam | Buc | Psa | Xyf | Nem | Cac | Mel | Rip | Hep | Caj | Bas | Bah | Lal | Sta | Stp | Myp | Myg | Urn | Myt | SyP | Der | Bob | Trp | Chp | Cht | Aqa | Thm | |
|---|---|---|---|---|---|---|---|---|---|---|---|---|---|---|---|---|---|---|---|---|---|---|---|---|---|---|---|---|---|---|---|---|---|---|---|---|---|---|---|---|
| Aepre | 495 | 298 | 263 | 207 | 241 | 123 | 172 | 238 | 212 | 227 | 198 | 61 | 102 | 112 | 138 | 209 | 93 | 92 | 146 | 219 | 53 | 87 | 116 | 190 | 200 | 128 | 149 | 96 | 55 | 54 | 51 | 164 | 82 | 172 | 66 | 64 | 63 | 65 | 75 | 148 |
| Sulso | 30 | 775 | 333 | 242 | 775 | 159 | 211 | 795 | 353 | 352 | 795 | 87 | 124 | 145 | 186 | 333 | 137 | 109 | 234 | 332 | 70 | 106 | 152 | 310 | 313 | 194 | 233 | 126 | 53 | 52 | 46 | 281 | 107 | 241 | 60 | 54 | 63 | 63 | 91 | 219 |
| Arcfu | 26 | 27 | 756 | 260 | 302 | 205 | 277 | 331 | 281 | 293 | 273 | 64 | 130 | 162 | 223 | 327 | 125 | 109 | 218 | 300 | 68 | 115 | 164 | 250 | 267 | 157 | 188 | 130 | 49 | 46 | 57 | 196 | 134 | 222 | 84 | 74 | 65 | 67 | 111 | 190 |
| Pyrho | 26 | 23 | 26 | 493 | 434 | 170 | 221 | 219 | 195 | 207 | 178 | 56 | 96 | 105 | 139 | 170 | 95 | 84 | 112 | 167 | 44 | 77 | 100 | 167 | 172 | 103 | 132 | 91 | 40 | 40 | 44 | 120 | 84 | 151 | 74 | 74 | 53 | 51 | 68 | 162 |
| Pyrab | 28 | 25 | 28 | 66 | 595 | 205 | 250 | 252 | 221 | 237 | 225 | 66 | 116 | 130 | 179 | 220 | 119 | 87 | 140 | 205 | 48 | 96 | 140 | 217 | 215 | 145 | 178 | 99 | 51 | 48 | 53 | 141 | 99 | 179 | 78 | 72 | 62 | 60 | 68 | 196 |
| Metja | 17 | 16 | 22 | 25 | 27 | 347 | 225 | 147 | 134 | 142 | 108 | 43 | 63 | 75 | 85 | 108 | 68 | 54 | 79 | 105 | 35 | 52 | 81 | 99 | 94 | 71 | 88 | 62 | 35 | 33 | 37 | 86 | 74 | 96 | 44 | 46 | 39 | 34 | 62 | 106 |
| Metth | 20 | 19 | 28 | 28 | 29 | 35 | 507 | 224 | 180 | 196 | 162 | 65 | 89 | 108 | 141 | 162 | 110 | 77 | 115 | 147 | 50 | 74 | 104 | 162 | 159 | 120 | 136 | 81 | 42 | 40 | 43 | 132 | 113 | 136 | 58 | 62 | 49 | 49 | 78 | 173 |
| Halsp | 24 | 24 | 29 | 22 | 24 | 16 | 22 | 705 | 270 | 274 | 252 | 75 | 135 | 159 | 220 | 335 | 129 | 123 | 245 | 334 | 74 | 112 | 155 | 284 | 284 | 180 | 222 | 142 | 70 | 63 | 65 | 236 | 142 | 260 | 91 | 84 | 67 | 68 | 86 | 168 |
| Theac | 23 | 34 | 25 | 21 | 22 | 16 | 19 | 25 | 611 | 494 | 238 | 67 | 102 | 108 | 156 | 285 | 102 | 98 | 198 | 273 | 68 | 103 | 122 | 234 | 229 | 147 | 181 | 102 | 46 | 45 | 40 | 213 | 95 | 197 | 53 | 57 | 60 | 62 | 75 | 147 |
| Thevo | 25 | 33 | 27 | 22 | 24 | 17 | 21 | 26 | 66 | 622 | 243 | 69 | 99 | 109 | 148 | 283 | 111 | 104 | 188 | 272 | 73 | 102 | 123 | 222 | 224 | 144 | 177 | 100 | 47 | 47 | 40 | 219 | 100 | 202 | 54 | 54 | 60 | 60 | 80 | 147 |
| Escco | 8 | 12 | 11 | 7 | 9 | 4 | 7 | 10 | 10 | 10 | 1953 | 415 | 700 | 826 | 1178 | 1368 | 634 | 491 | 734 | 1000 | 191 | 263 | 378 | 783 | 721 | 452 | 566 | 303 | 136 | 123 | 107 | 544 | 282 | 478 | 198 | 173 | 165 | 159 | 209 | 409 |
| Vibch | 6 | 7 | 5 | 6 | 6 | 5 | 7 | 6 | 6 | 6 | 20 | 447 | 241 | 274 | 362 | 346 | 262 | 216 | 196 | 214 | 113 | 122 | 145 | 213 | 206 | 125 | 177 | 91 | 84 | 81 | 73 | 186 | 83 | 134 | 112 | 100 | 99 | 97 | 101 | 176 |
| Haein | 8 | 8 | 8 | 7 | 8 | 5 | 6 | 9 | 7 | 7 | 32 | 22 | 875 | 684 | 648 | 632 | 358 | 335 | 343 | 418 | 135 | 172 | 231 | 359 | 347 | 273 | 331 | 216 | 105 | 99 | 108 | 252 | 136 | 236 | 140 | 116 | 132 | 126 | 113 | 241 |
| Pasmu | 7 | 8 | 9 | 7 | 8 | 5 | 7 | 9 | 6 | 6 | 37 | 22 | 54 | 1058 | 794 | 738 | 415 | 370 | 401 | 482 | 140 | 189 | 277 | 423 | 418 | 286 | 365 | 222 | 110 | 100 | 104 | 268 | 172 | 264 | 145 | 135 | 142 | 138 | 132 | 278 |
| Bucsp | 6 | 8 | 10 | 6 | 8 | 4 | 6 | 10 | 7 | 6 | 48 | 20 | 34 | 41 | 1650 | 1256 | 594 | 467 | 648 | 780 | 180 | 231 | 345 | 677 | 648 | 372 | 490 | 286 | 126 | 113 | 110 | 420 | 271 | 403 | 202 | 174 | 166 | 162 | 192 | 372 |
| Pseae | 8 | 12 | 11 | 6 | 8 | 4 | 6 | 12 | 10 | 10 | 47 | 14 | 24 | 28 | 46 | 2314 | 704 | 537 | 997 | 1297 | 224 | 268 | 397 | 926 | 849 | 447 | 589 | 330 | 135 | 126 | 122 | 691 | 380 | 624 | 220 | 184 | 181 | 179 | 248 | 419 |
| Xylfa | 7 | 9 | 8 | 7 | 8 | 5 | 8 | 8 | 7 | 7 | 28 | 24 | 25 | 27 | 30 | 28 | 877 | 345 | 461 | 471 | 154 | 175 | 217 | 375 | 355 | 227 | 297 | 162 | 84 | 82 | 85 | 312 | 178 | 271 | 134 | 118 | 125 | 128 | 154 | 239 |
| Neime | 8 | 7 | 8 | 7 | 7 | 5 | 6 | 9 | 8 | 8 | 22 | 23 | 26 | 76 | 24 | 21 | 27 | 703 | 332 | 383 | 151 | 178 | 238 | 306 | 300 | 193 | 233 | 157 | 85 | 85 | 79 | 258 | 138 | 225 | 105 | 117 | 123 | 120 | 128 | 192 |
| Caucr | 8 | 11 | 11 | 6 | 7 | 4 | 6 | 13 | 10 | 10 | 27 | 11 | 17 | 19 | 26 | 36 | 25 | 18 | 1417 | 1020 | 206 | 196 | 289 | 638 | 605 | 311 | 432 | 228 | 96 | 92 | 88 | 561 | 295 | 456 | 149 | 139 | 135 | 128 | 186 | 302 |
| Meslo | 9 | 13 | 12 | 7 | 8 | 4 | 6 | 14 | 12 | 11 | 34 | 9 | 17 | 19 | 27 | 43 | 20 | 16 | 43 | 1937 | 225 | 220 | 337 | 850 | 792 | 430 | 527 | 300 | 103 | 103 | 107 | 691 | 369 | 582 | 177 | 161 | 164 | 157 | 208 | 400 |
| Ricpr | 6 | 6 | 6 | 5 | 5 | 5 | 6 | 7 | 7 | 8 | 9 | 17 | 12 | 11 | 10 | 9 | 14 | 17 | 13 | 11 | 319 | 91 | 116 | 175 | 165 | 108 | 138 | 99 | 71 | 70 | 63 | 149 | 100 | 139 | 82 | 71 | 81 | 82 | 86 | 109 |
| Helpy | 10 | 9 | 10 | 9 | 10 | 7 | 8 | 11 | 11 | 11 | 12 | 16 | 15 | 14 | 12 | 10 | 15 | 19 | 12 | 10 | 14 | 407 | 250 | 203 | 217 | 147 | 183 | 113 | 76 | 73 | 88 | 172 | 100 | 171 | 110 | 105 | 90 | 89 | 131 | 162 |
| Camje | 11 | 12 | 13 | 10 | 13 | 9 | 10 | 13 | 11 | 11 | 17 | 16 | 18 | 20 | 18 | 15 | 17 | 22 | 16 | 15 | 14 | 33 | 592 | 329 | 312 | 202 | 240 | 134 | 81 | 77 | 80 | 239 | 177 | 232 | 113 | 118 | 100 | 94 | 150 | 222 |
| Bacsu | 9 | 13 | 11 | 8 | 10 | 4 | 7 | 13 | 10 | 10 | 26 | 10 | 15 | 17 | 24 | 29 | 16 | 14 | 25 | 29 | 9 | 10 | 16 | 1755 | 1234 | 615 | 931 | 486 | 178 | 175 | 164 | 621 | 284 | 530 | 223 | 197 | 162 | 154 | 186 | 473 |
| Bacha | 10 | 14 | 12 | 8 | 10 | 4 | 7 | 13 | 11 | 10 | 25 | 10 | 15 | 18 | 24 | 27 | 16 | 14 | 24 | 28 | 9 | 11 | 16 | 56 | 1646 | 575 | 869 | 460 | 173 | 166 | 166 | 594 | 282 | 522 | 213 | 193 | 158 | 149 | 191 | 491 |
| Lacla | 9 | 12 | 10 | 7 | 10 | 5 | 9 | 12 | 10 | 10 | 18 | 10 | 17 | 16 | 16 | 15 | 14 | 13 | 15 | 17 | 9 | 12 | 15 | 29 | 28 | 927 | 534 | 473 | 150 | 137 | 124 | 363 | 158 | 314 | 129 | 114 | 111 | 107 | 115 | 325 |
| Staau | 9 | 12 | 10 | 8 | 10 | 5 | 8 | 12 | 10 | 10 | 21 | 11 | 18 | 18 | 20 | 19 | 16 | 13 | 19 | 19 | 9 | 12 | 14 | 44 | 42 | 32 | 1254 | 434 | 182 | 169 | 169 | 480 | 215 | 395 | 170 | 140 | 160 | 146 | 141 | 384 |
| Strpy | 8 | 9 | 9 | 8 | 8 | 6 | 7 | 11 | 8 | 8 | 12 | 8 | 15 | 14 | 13 | 12 | 11 | 12 | 11 | 12 | 10 | 11 | 11 | 24 | 24 | 40 | 28 | 716 | 150 | 137 | 128 | 246 | 128 | 240 | 138 | 120 | 110 | 106 | 92 | 235 |
| Mycpn | 8 | 5 | 5 | 5 | 6 | 6 | 6 | 8 | 5 | 5 | 6 | 14 | 10 | 9 | 7 | 5 | 8 | 10 | 6 | 4 | 14 | 13 | 10 | 9 | 10 | 14 | 14 | 18 | 228 | 203 | 138 | 119 | 63 | 100 | 95 | 74 | 66 | 66 | 61 | 110 |
| Mycge | 8 | 5 | 5 | 6 | 6 | 6 | 5 | 7 | 5 | 6 | 6 | 14 | 10 | 8 | 6 | 5 | 8 | 10 | 6 | 5 | 15 | 13 | 10 | 9 | 9 | 13 | 13 | 17 | 87 | 208 | 133 | 118 | 62 | 97 | 93 | 72 | 67 | 67 | 62 | 109 |
| Ureur | 7 | 4 | 6 | 6 | 7 | 7 | 6 | 7 | 5 | 5 | 5 | 12 | 11 | 9 | 6 | 5 | 8 | 9 | 5 | 5 | 13 | 16 | 11 | 9 | 9 | 12 | 13 | 16 | 47 | 48 | 201 | 117 | 62 | 100 | 89 | 75 | 65 | 64 | 57 | 113 |
| Myctu | 10 | 16 | 11 | 7 | 8 | 5 | 8 | 14 | 13 | 13 | 20 | 12 | 13 | 13 | 17 | 24 | 17 | 15 | 27 | 28 | 10 | 12 | 15 | 26 | 26 | 20 | 24 | 14 | 9 | 9 | 9 | 1188 | 255 | 444 | 125 | 127 | 133 | 132 | 163 | 289 |
| SynPC | 7 | 8 | 10 | 8 | 8 | 8 | 11 | 12 | 8 | 8 | 12 | 8 | 10 | 11 | 13 | 14 | 13 | 11 | 16 | 16 | 11 | 10 | 17 | 13 | 14 | 11 | 12 | 10 | 8 | 8 | 8 | 16 | 620 | 255 | 76 | 83 | 72 | 69 | 140 | 165 |
| Deira | 13 | 15 | 14 | 11 | 12 | 7 | 9 | 18 | 13 | 14 | 19 | 10 | 14 | 14 | 17 | 23 | 16 | 15 | 23 | 24 | 11 | 13 | 17 | 23 | 24 | 19 | 21 | 16 | 8 | 8 | 9 | 25 | 18 | 998 | 136 | 118 | 124 | 122 | 156 | 269 |
| Borbu | 8 | 5 | 8 | 9 | 9 | 7 | 7 | 9 | 6 | 6 | 9 | 17 | 13 | 11 | 11 | 9 | 12 | 11 | 9 | 8 | 14 | 17 | 14 | 12 | 12 | 11 | 12 | 15 | 20 | 21 | 20 | 9 | 8 | 11 | 322 | 191 | 104 | 100 | 87 | 152 |
| Trepa | 8 | 5 | 7 | 10 | 8 | 7 | 8 | 9 | 6 | 6 | 8 | 15 | 10 | 10 | 9 | 7 | 11 | 13 | 8 | 7 | 12 | 17 | 15 | 10 | 10 | 10 | 9 | 13 | 15 | 16 | 17 | 9 | 9 | 9 | 43 | 312 | 94 | 94 | 93 | 161 |
| Chlpn | 9 | 6 | 6 | 7 | 7 | 6 | 6 | 7 | 7 | 7 | 8 | 16 | 13 | 12 | 9 | 7 | 12 | 14 | 8 | 8 | 16 | 15 | 13 | 8 | 9 | 10 | 11 | 12 | 15 | 16 | 16 | 10 | 8 | 10 | 21 | 19 | 267 | 245 | 75 | 123 |
| Chltr | 9 | 6 | 7 | 7 | 7 | 5 | 6 | 7 | 7 | 7 | 7 | 15 | 12 | 11 | 9 | 7 | 12 | 14 | 8 | 7 | 16 | 15 | 12 | 8 | 8 | 9 | 10 | 12 | 15 | 16 | 16 | 10 | 8 | 10 | 20 | 19 | 87 | 258 | 73 | 121 |
| Aquae | 8 | 8 | 10 | 7 | 7 | 8 | 9 | 8 | 7 | 8 | 9 | 12 | 9 | 9 | 10 | 9 | 13 | 12 | 11 | 9 | 12 | 18 | 17 | 9 | 10 | 9 | 9 | 8 | 10 | 10 | 9 | 11 | 15 | 12 | 13 | 14 | 12 | 11 | 432 | 163 |
| Thema | 13 | 16 | 14 | 14 | 16 | 10 | 15 | 12 | 11 | 11 | 17 | 16 | 16 | 17 | 17 | 15 | 16 | 14 | 15 | 17 | 10 | 15 | 19 | 22 | 25 | 23 | 23 | 18 | 12 | 12 | 12 | 17 | 13 | 17 | 15 | 17 | 13 | 13 | 15 | 791 |
Distributions of identity percentage between probable orthologs from complete prokaryotic genomes
Figure 2 shows a sampling of the distributions of identity percentage between pairs of apparent orthologs identified as reciprocal best hits from a range of genome pairs separated by varying phylogenetic distances. Most of the distributions are clearly unimodal, and the distributions for pairs of phylogenetically distant genomes, such as those from different major bacterial lineages or bacteria versus archaea, have their modes within a relatively narrow range around 33% identity (Figure 2).
Figure 2.
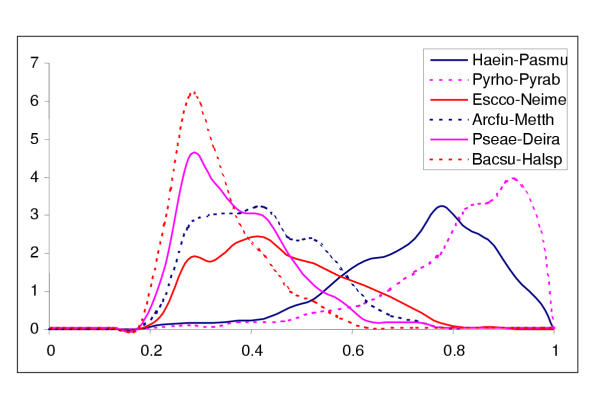
Distribution of identity percentage between probable orthologs in genome pairs. The distributions are for the sets of probable orthologs detected with an e-value cut-off of 0.001. For species name abbreviations, see Materials and Methods.
The use of reciprocal best hits is a conservative way to identify the set of probable orthologs between pairs of genomes because some of the orthologs are missed due to complex relationships between groups of paralogs. Nevertheless, all genome-to-genome comparisons included at least 100 (for the smallest genomes such as the mycoplasmas), and typically, a considerably greater number of protein pairs ([11] and data not shown). This suggests that parameters of the distributions of the similarity level between probable orthologs identified in this fashion could potentially serve as useful measures of the evolutionary distance between genomes.
Genome trees constructed with three different approaches
Genome trees were generated using the approaches described under Material and Methods. All the trees showed a clear separation of the two major prokaryotic domains, Bacteria and Archaea (Fig. 3,4,5). Several terminal bifurcations that reflect clustering of relatively close species, such as three mycoplasmas (M. genitalium, M. pneumoniae and U. urealiticum), two spirochetes (B. burgdorferi and T. pallidum), and H. pylori and C. jejuni, are also reproduced in all trees (Fig. 3,4,5). This retention of both the deepest and the terminal branchings shows that all types of data used for tree construction contained at least a crude phylogenetic signal. However, beyond these obvious aspects of topology, and in particular with respect to clustering of distantly related bacteria and archaea, the trees produced with different approaches showed significant differences, which appear to reflect the relative contributions of phenotypic and phylogenetic signals. A quantitative comparison of the tree topologies using the symmetric distance method showed that the presence-absence tree was most different from the trees made by the other methods (Table 2).
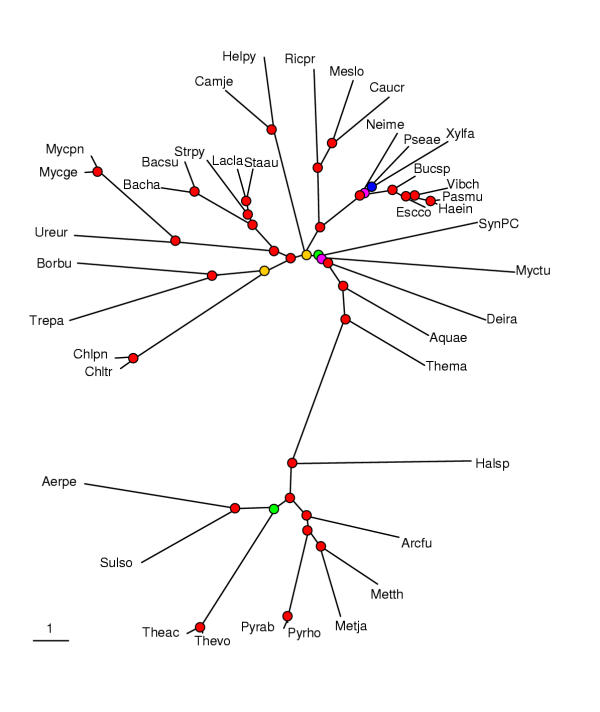
Figure 3.

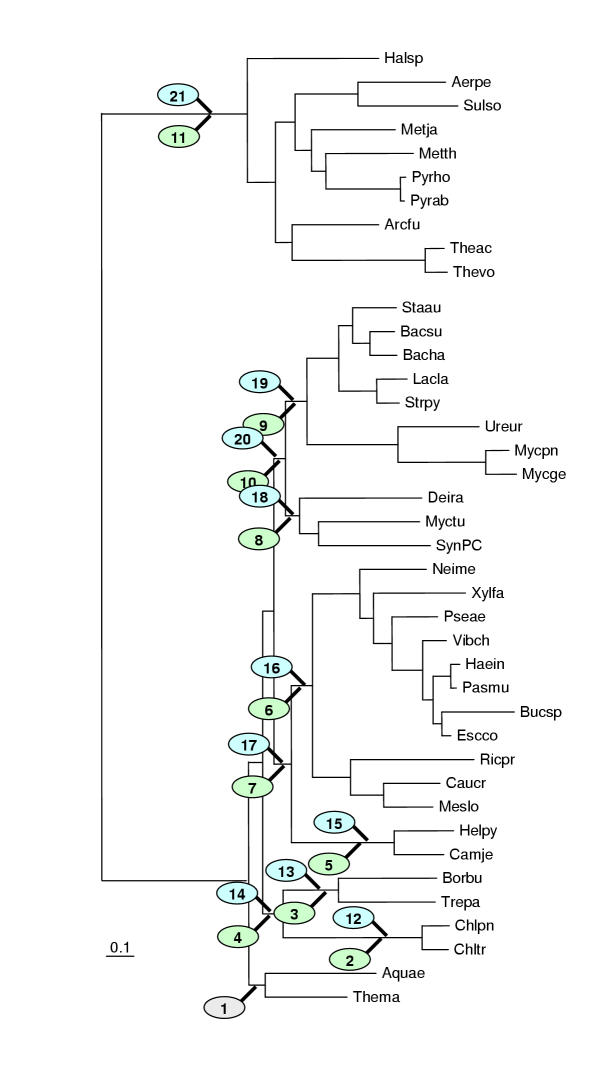
Maximum parsimony tree (Dollo parsimony) based on absence-presence of genomes in orthologous gene sets. The tree is unrooted. The circles indicate the level of bootstrap support, with the following color coding: red: 90–100%, yellow: 80–90%, green: 70–80%, blue: 60–70%, magenta: 40–60%. The nodes with <40% support are unmarked.
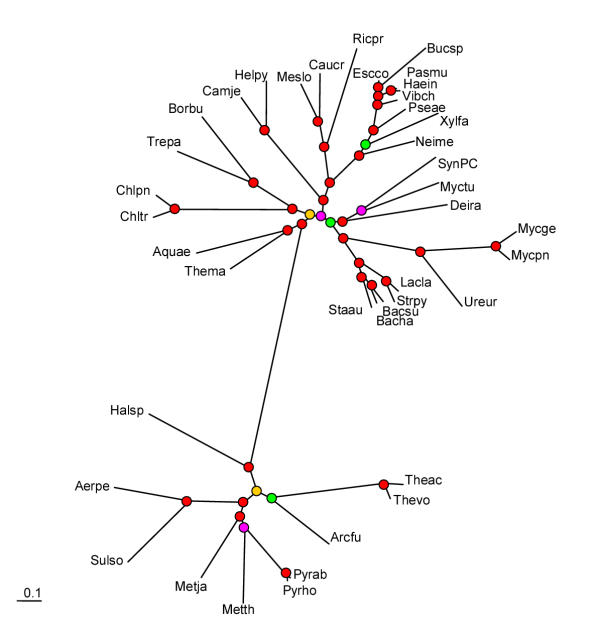
Figure 4.

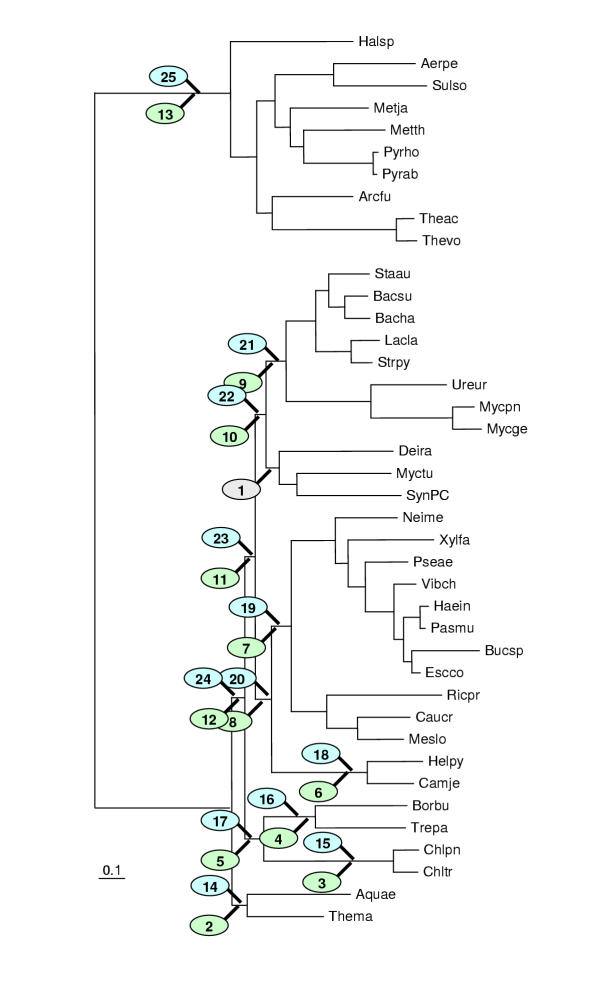
Maximum parsimony tree (Dollo parsimony) of prokaryotes based on presence-absence of gene pairs in genomes. The designations are as in Fig. 3.
Figure 5.
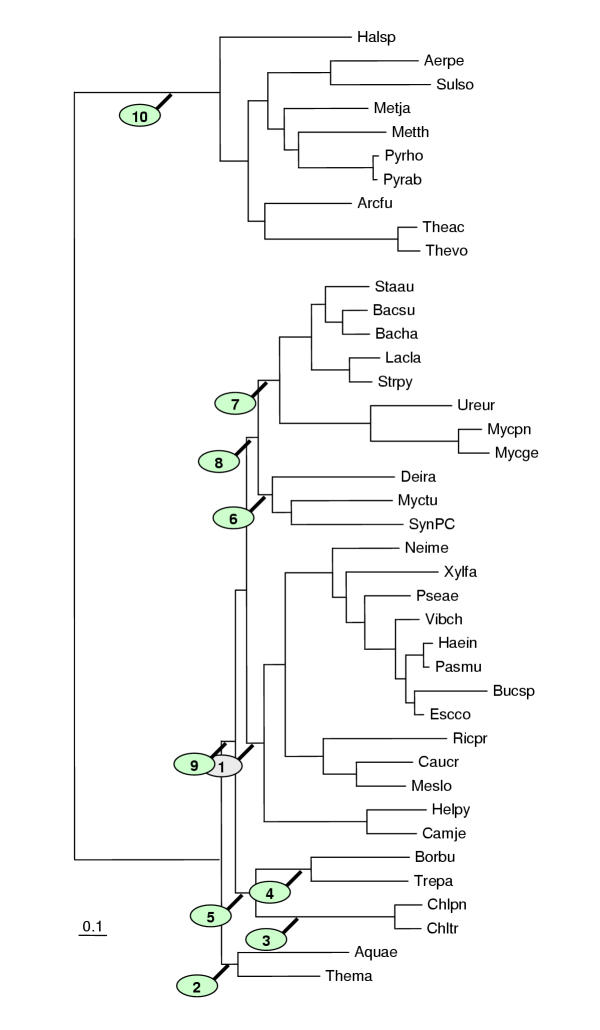
Distance tree constructed using the median of the percent identity distribution between probable orthologs for evolutionary distance calculation. An E-value cut-off of 0.001 was used to identify bidirectional best hits between proteins encoded in all pairs of genomes. Distances were calculated using the logarithmic formula. The designations are as in Fig. 3.
Table 2.
Symmetric distances between genome-trees constructed with different methods.
| Gene presence-absence | Conserved gene pairs | Identity distributions | |
|---|---|---|---|
| Symmetric distancea | |||
| Gene presence-absence | |||
| Conserved gene pairs | 52 | ||
| Identity distributions | 54 | 44 | |
| Concatenated ribosomal | 56 | 44 | 38 |
| proteins |
Presence-absence of genomes in COGs
The topology of the parsimony tree built using this criterion appears to reflect primarily the phenotypes of the respective organisms (Fig. 3). This is most clearly manifest in the two major bacterial clusters that appear in this tree, each with a strong bootstrap support:
i) bacteria with large genomes, namely E. coli, B. subtilis, Synechocystis sp., Deinococcus radiodurans and Mycobacterium tuberculosis, and free-living bacteria with small genomes, A. aeolicus and T. maritima
ii) parasites with small genomes (mycoplasmas, spirochetes, chlamydia and rickettsia)
Parasites with moderate-sized genomes (H. influenzae, N. meningitidis, and P. multocida; H. pylori and C. jejuni) formed two distinct groups. Thus, well-established phylogenetic relationships between free-living and parasitic bacteria, such as those within the Proteobacteria (E. coli-H. influenzae-P. multocida-N. meningitidis) and within low-GC Gram-positive bacteria (B. subtilis-mycoplasmas), are not reflected accurately in this tree topology. The two free-living bacteria with small genomes, the hyperthermophiles A. aeolicus and T. maritima, did not join either the free-living or the parasitic bacterial cluster, despite their small number of genes similar to that in bacterial parasites (Fig. 3). That these bacteria do not group with the parasites despite similar genome sizes, suggests that it is not the number of genes per se, but rather the degree of genome degradation and the loss of coherent sets of genes that affect the topology of the presence-absence tree. The inclusion of the parasites M. tuberculosis and Pseudomonas aeruginosa in the cluster of bacteria with large genomes probably reflects the recent origin of parasitism in these lineages. It is further notable that, in this tree, the two representative of Crenarchaeota (A. pernix and S. solfataricus) do not comprise a sister group of the Euryarchaeota (the remaining archaeal species), but rather for am branch within the Euryarchaeal cluster (see discussion below).
In previous studies that employed similar approaches to genome-tree building, phylogenetically reasonable clades were observed after a simple omission of parasitic species [8,9]. Such an operation could be applied to the tree shown in Fig. 3, indeed resulting in the correct recovery of the proteobacterial and Gram-positive bacterial lineages. However, it seems that, because known natural groups could be reproduced by this approach only after omission of certain species on the basis of independent prior knowledge, this method hardly can be useful for delineating new, phylogenetically sound clades.
Conserved gene pairs
The topology of the tree based on gene pair conservation seems to carry a stronger phylogenetic signal than the gene presence-absence tree because it correctly groups together related free-living and parasitic bacteria despite major differences in gene repertoires (Fig. 4). The bacterial side of this tree consists of three major clades: i) proteobacterial clade that, in addition to bona fide Proteobacteria, includes also A. aeolicus, M. tuberculosis, D. radiodurans, and Synechocystis sp, ii) Gram-positive clade that additionally includes T. maritima, and iii) an unexpected clade that unites spirochetes and chlamydia. In the archaeal domain, the two species of the Crenarchaeota did not form a clade, but instead were present as separate branches interspersed with euryarchaeal species. To further assess the robustness of the obtained tree, we varied the parameters of the included conserved pairs by allowing distances between the genes comprising a pair from 0 to 5 and changing the minimal number of genomes, in which a conserved gene pair had to be present, from 2 to 4. These changes did not significantly affect the tree topology (data not shown). The topology of a neighbor-joining tree constructed by using the number of gene pairs shared by two genomes to calculate the evolutionary distance between them was similar to the topology of the maximum parsimony tree (Table 2 and data not shown).
At least some unusual aspects of this tree's the topology could be explained by horizontal transfer of operons between particular bacterial and archaeal lineages. Specifically, it has been noticed previously that T. maritima shares a considerable number of genes and operons with Gram-positive bacteria, to the exclusion of other bacteria [21]; this seems to be compatible with the position of T. maritima with the Gram-positive cluster. Similarly, considerable horizontal gene transfer appear to have occurred between the Sulfolobus and Thermoplasma lineages, which cluster together in the archaeal part of this tree. The presence of extra species in the proteobacterial cluster is more surprising because no obvious trend for operon transfer between these bacteria and bona fide Proteobacteria has been noticed during systematic genome comparisons; however, a considerable number of shared gene pairs was detected during the present analysis (Table 1). Artifacts of tree construction could also contribute to these associations. In contrast, the spirochete-chlamydia clade might reflect a deep phylogenetic relationship (see discussion below).
Parameters of percent identity distributions between orthologs
Different characteristics of the distributions of percent identity between the probable orthologs, such as the mean, the median, the mode and various quantiles, were used to calculate distances between genomes and construct phylogenetic trees. Trees built with different cut-off values for symmetrical best hits, four different formulas for the evolutionary distance calculation (see Materials and Methods) and different parameters of the distributions showed essentially the same topology, with strong bootstrap support for most of the clades (Fig. 5 and data not shown). The complete proteobacterial and Gram-positive bacterial clusters were recovered in this tree as well as the unexpected grouping of chlamydia with spirochete noticed above in the tree based on conserved gene pairs (Fig. 4,5). Also similarly to the previous two trees, the Crenarchaea grouped with Thermoplasma within the archaeal part of the tree. Beyond these groupings, the tree appeared conservative in the sense that the unassigned bacterial species formed separate branches near the root of the bacterial subtree. The closest to the root were the two hyperthermophilic species, A. aeolicus and T. maritima, which is compatible with the standard view of their phylogenetic position [1,26].
Alignment-based approaches to the construction of a species tree
The above three approaches involve construction of genome trees "par excellence", i.e. based on integral characteristics of genomes (or, more precisely, gene sets) that are not directly related to more traditional, alignment-based measures, which are usually employed for calculating evolutionary distances or for parsimony analysis. These genome tree raise several interesting phylogenetic questions, for example, do spirochetes and chlamydia indeed share a common ancestor, and are Euryarchaeota, in fact, a paraphyletic group with respect to the Crenarchaeota. However, the reliability of the conclusions drawn from the topology of these trees remains uncertain. Therefore we decided to complement these genome-oriented approaches with more traditional ones applied on a large scale.
Concatenated alignments of ribosomal proteins
The alignments of the 32 ribosomal proteins conserved in all bacterial and archaeal species were concatenated head-to-tail and treated as a single alignment containing 4821 columns. The underlying assumption is that the genes coding for ribosomal proteins that function as components of a large macromolecular complex are unlikely to undergo horizontal transfer, which tends to confound comparisons of the tree topologies for other protein families and would invalidate the concatenation approach. The resulting maximum-likelihood tree contains the complete proteobacterial and Gram-positive bacterial clusters as well as the spirochete-chlamydia cluster noticed in the genome-trees. In addition to the spirochetes-chlamydia clade, the following non-trivial affinities were detected with strong bootstrap support: i) a cluster of the two hyperthemophiles, A. aeolicus and T. maritima, ii) a cluster including D. radiodurans, Synechocystis, and M. tuberculosis, which, at a deeper level, joined the Gram-positive bacterial branch (Fig. 6). Similar tree topologies were obtained when the ribosomal protein data were analyzed using the neighbor-joining method and when bacterial phylogeny was analyzed separately by using a concatenated alignments of 51 ribosomal proteins shared by all bacteria (data not shown). Notably, in the quantitative comparison of tree topologies, the tree made of concatenated ribosomal protein alignments showed the closest similarity to the genome-tree based on the distributions of percent identity between orthologs (Table 2).
Figure 6.
Maximum-likelihood tree produced from concatenated alignments of the universal subset of ribosomal proteins. The designations are as in Fig. 3.
The reliability of the observed non-trivial groupings was further examined by using a maximum likelihood approach (the Kishino-Hasegawa test). For each clade (usually, species) forming the group to be tested, trees with alternative topologies were manually constructed by joining the clade in question to every other major group in the tree. For example, to assess the support for the spirochetes-chlamydia grouping, spirochetes were placed, sequentially, with Thermotoga, Aquifex, the Thermotoga-Aquifex branch, ε-proteobacteria, the αβγ-proteobacterial branch, Proteobacteria, the Deinococcus-Synechocystis-Mycobacterium cluster, the low G+C Gram-positive cluster, the branch that unites the latter two clusters, and between bacteria and archaea (to the bacterial root). The same alternatives were tested for chlamydia. Alternative topologies were compared either directly, using the ProtML program, or were subjected to local rearrangement first. In cases when the topology did not revert to the original one, the final, "optimized" topology was used for the comparison. These tests showed high stability of the Thermotoga-Aquifex and Deinococcus-Synechocystis-Mycobacterium groupings (no competing topologies with likelihood within 1 SD unit from the original; Fig. 7,8, Table 3,4,5,6). The affinity of the Deinococcus-Synechocystis-Mycobacterium with Gram-positive bacteria also was supported, although an alternative topology, with this cluster joining Proteobacteria could not be ruled out (Fig. 9, Table 7). Assessment of the spirochete-chlamydia grouping revealed two competing topologies, albeit unusual ones. Specifically, moving ε-proteobacteria from the proteobacterial branch to the spirochete branch or, alternatively, moving spirochetes with ε-p roteobacteria and simultaneously moving chlamydia to the bacterial root results in statistically acceptable topologies (Fig. 10; Table 8,9). Also, a minor rearrangement of the topology within the euryarchaeal branch allowed for a reasonable alternative to the topology in Fig. 8 (euryarchaeal paraphyly), with the Crenarchaea-Euryarchaea radiation at the archaeal root (Fig. 11, Table 10).
Figure 7.
The Kishino-Hasegawa test for the Aquifex-Thermotoga clade. "1" indicates the original position of the tested clade in the concatenated ribosomal proteins tree (Fig. 6). The remaining numbers show the alternative positions tested for each of these species (in green ovals for Aquifex and blue for Thermotoga). For the likelihood values and RELL bootstrap values for each of the corresponding topologies, see Table 3A.
Figure 8.
The Kishino-Hasegawa test for the Deinococcus-Mycobacterium-Synechocystis clade. The identical scheme of producing alternative topologies was used for each of the three species. For example for Deinococcus (see Table 4) the green ovals (## 2 to 13) indicate alternative placements of Deinococcus with Mycobacterium and Synechocystis occupying the original position and the blue ovals (## 14 to 25) indicate alternative placements of the Mycobacterium-Synechocystis pair with Deinococcus left in the original position. The same was done with Mycobacterium versus Deinococcus-Synechocystis pair (Table 5) and Synechocystis versus Deinococcus-Mycobacterium pair (Table 6).
Table 3.
Testing non-trivial groupings from the concatenated ribosomal protein tree with the Kishino-Hasegawa testa
| (A) | ||||
|---|---|---|---|---|
| Aquifex-Thermotoga | ||||
| # | Likelihood | ΔLb | σΔLc | RELL-BPd |
| 1 | -242983.7 | best | N/A | 0.9251 |
| 2 | -243174.6 | -190.9 | 38.5 | 0.0000 |
| 3 | -243185.0 | -201.3 | 38.0 | 0.0000 |
| 4 | -243146.1 | -162.5 | 32.1 | 0.0000 |
| 5 | -243267.6 | -283.9 | 49.0 | 0.0000 |
| 6 | -243293.3 | -309.7 | 49.0 | 0.0000 |
| 7 | -243218.8 | -235.2 | 41.8 | 0.0000 |
| 8 | -243301.0 | -317.3 | 45.7 | 0.0000 |
| 9 | -243315.4 | -331.8 | 45.0 | 0.0000 |
| 10 | -243242.8 | -259.1 | 40.0 | 0.0000 |
| 11 | -243005.7 | -22.0 | 12.2 | 0.0227 |
| 12 | -243196.1 | -212.4 | 39.2 | 0.0000 |
| 13 | -243201.5 | -217.9 | 38.8 | 0.0000 |
| 14 | -243157.9 | -174.3 | 32.2 | 0.0000 |
| 15 | -243318.8 | -335.1 | 49.8 | 0.0000 |
| 16 | -243355.8 | -372.1 | 48.3 | 0.0000 |
| 17 | -243247.1 | -263.4 | 42.1 | 0.0000 |
| 18 | -243236.5 | -252.8 | 51.2 | 0.0000 |
| 19 | -243232.0 | -248.3 | 51.1 | 0.0000 |
| 20 | -243207.0 | -223.3 | 45.0 | 0.0000 |
| 21 | -243002.6 | -19.0 | 12.8 | 0.0522 |
Table 4.
| (B) | ||||
|---|---|---|---|---|
| Deinococcus radiodurans | ||||
| # | Likelihood | ΔL | σΔL | RELL-BP |
| 1 | -242983.7 | best | N/A | 0.8239 |
| 2 | -243091.1 | -107.4 | 40.8 | 0.0002 |
| 3 | -243122.6 | -138.9 | 43.0 | 0.0000 |
| 4 | -243135.8 | -152.1 | 43.1 | 0.0000 |
| 5 | -243088.1 | -104.5 | 36.3 | 0.0000 |
| 6 | -243037.3 | -53.7 | 41.0 | 0.0775 |
| 7 | -243064.0 | -80.4 | 40.2 | 0.0020 |
| 8 | -243024.5 | -40.9 | 31.8 | 0.0574 |
| 9 | -243030.9 | -47.3 | 19.0 | 0.0011 |
| 10 | -243017.6 | -33.9 | 20.8 | 0.0090 |
| 11 | -243052.1 | -68.4 | 30.3 | 0.0010 |
| 12 | -243070.6 | -86.9 | 37.3 | 0.0013 |
| 13 | -243066.1 | -82.5 | 40.4 | 0.0122 |
| 14 | -243143.1 | -159.4 | 39.6 | 0.0000 |
| 15 | -243151.3 | -167.7 | 43.3 | 0.0000 |
| 16 | -243186.7 | -203.0 | 42.2 | 0.0000 |
| 17 | -243102.9 | -119.3 | 36.6 | 0.0001 |
| 18 | -243167.6 | -184.0 | 37.8 | 0.0000 |
| 19 | -243155.4 | -171.7 | 38.9 | 0.0000 |
| 20 | -243065.3 | -81.7 | 29.6 | 0.0007 |
| 21 | -243017.6 | -33.9 | 20.8 | 0.0121 |
| 22 | -243030.9 | -47.3 | 19.0 | 0.0006 |
| 23 | -243068.3 | -84.7 | 29.9 | 0.0009 |
| 24 | -243103.9 | -120.3 | 36.7 | 0.0000 |
| 25 | -243135.2 | -151.5 | 39.0 | 0.0000 |
Table 5.
| (C) | ||||
|---|---|---|---|---|
| Mycobacterium tuberculosis | ||||
| # | Likelihood | ΔL | σΔL | RELL-BP |
| 1 | -242983.7 | best | N/A | 0.8589 |
| 2 | -243160.7 | -177.0 | 46.5 | 0.0000 |
| 3 | -243192.5 | -208.9 | 48.9 | 0.0000 |
| 4 | -243216.2 | -232.5 | 48.6 | 0.0000 |
| 5 | -243140.3 | -156.6 | 44.1 | 0.0000 |
| 6 | -243146.6 | -163.0 | 48.1 | 0.0000 |
| 7 | -243153.9 | -170.3 | 48.0 | 0.0000 |
| 8 | -243071.4 | -87.7 | 41.0 | 0.0013 |
| 9 | -243023.4 | -39.7 | 34.2 | 0.0443 |
| 10 | -243037.2 | -53.5 | 33.3 | 0.0052 |
| 11 | -243098.4 | -114.7 | 39.6 | 0.0000 |
| 12 | -243126.1 | -142.4 | 44.5 | 0.0000 |
| 13 | -243146.5 | -162.8 | 46.9 | 0.0000 |
| 14 | -243087.0 | -103.3 | 52.5 | 0.0010 |
| 15 | -243128.5 | -144.8 | 54.7 | 0.0000 |
| 16 | -243150.8 | -167.2 | 54.1 | 0.0000 |
| 17 | -243079.5 | -95.9 | 49.1 | 0.0014 |
| 18 | -243136.6 | -153.0 | 50.5 | 0.0000 |
| 19 | -243152.6 | -168.9 | 49.7 | 0.0000 |
| 20 | -243062.9 | -79.3 | 41.5 | 0.0012 |
| 21 | -243037.2 | -53.5 | 33.3 | 0.0059 |
| 22 | -243023.4 | -39.7 | 34.2 | 0.0327 |
| 23 | -243047.8 | -64.1 | 43.2 | 0.0209 |
| 24 | -243062.5 | -78.8 | 49.7 | 0.0192 |
| 25 | -243076.6 | -93.0 | 51.9 | 0.0080 |
Table 6.
| (D) | ||||
|---|---|---|---|---|
| Synechocystis sp. | ||||
| # | Likelihood | ΔL | σΔL | RELL-BP |
| 1 | -242983.7 | best | N/A | 0.9617 |
| 2 | -243118.5 | -134.8 | 47.5 | 0.0000 |
| 3 | -243077.9 | -94.3 | 51.4 | 0.0265 |
| 4 | -243115.8 | -132.1 | 50.9 | 0.0000 |
| 5 | -243084.6 | -101.0 | 46.4 | 0.0031 |
| 6 | -243184.5 | -200.8 | 46.3 | 0.0000 |
| 7 | -243208.1 | -224.4 | 45.5 | 0.0000 |
| 8 | -243135.7 | -152.1 | 38.1 | 0.0000 |
| 9 | -243072.3 | -88.6 | 32.1 | 0.0006 |
| 10 | -243083.7 | -100.0 | 31.6 | 0.0000 |
| 11 | -243099.4 | -115.7 | 40.6 | 0.0000 |
| 12 | -243102.5 | -118.8 | 45.2 | 0.0003 |
| 13 | -243097.2 | -113.5 | 47.6 | 0.0030 |
| 14 | -243204.5 | -220.8 | 48.0 | 0.0000 |
| 15 | -243279.8 | -296.2 | 49.3 | 0.0000 |
| 16 | -243288.4 | -304.7 | 49.4 | 0.0000 |
| 17 | -243194.3 | -210.7 | 42.9 | 0.0000 |
| 18 | -243180.8 | -197.1 | 49.5 | 0.0000 |
| 19 | -243177.5 | -193.8 | 49.4 | 0.0000 |
| 20 | -243090.1 | -106.4 | 41.4 | 0.0038 |
| 21 | -243083.7 | -100.0 | 31.6 | 0.0000 |
| 22 | -243072.3 | -88.6 | 32.1 | 0.0010 |
| 23 | -243129.2 | -145.5 | 38.5 | 0.0000 |
| 24 | -243165.6 | -181.9 | 45.1 | 0.0000 |
| 25 | -243195.5 | -211.9 | 47.6 | 0.0000 |
Figure 9.

The Kishino-Hasegawa test for the unification of the Deinococcus-Mycobacterium-Synechocystis clade with Gram-positive bacteria. See Table 7.
Table 7.
| (E) | ||||
|---|---|---|---|---|
| The Demococcus-Mycobacterium-Synechocystis clade | ||||
| # | Likelihood | ΔL | σΔL | RELL-BP |
| 1 | -242983.7 | 0.0 | <-best | 0.7280 |
| 2 | -243065.3 | -81.7 | 34.7 | 0.0000 |
| 3 | -243122.4 | -138.8 | 37.2 | 0.0000 |
| 4 | -243148.7 | -165.1 | 35.8 | 0.0000 |
| 5 | -243053.8 | -70.1 | 28.9 | 0.0001 |
| 6 | -243103.1 | -119.5 | 33.6 | 0.0000 |
| 7 | -243096.4 | -112.7 | 34.1 | 0.0001 |
| 8 | -243003.1 | -19.4 | 23.2 | 0.1697 |
| 9 | -243010.5 | -26.9 | 21.5 | 0.0560 |
| 10 | -243028.9 | -45.3 | 31.2 | 0.0419 |
| 11 | -243054.3 | -70.7 | 34.7 | 0.0042 |
Figure 10.

The Kishino-Hasegawa test for the Spirochete-Chlamydia clade. Green ovals: chlamydia, blue ovals: spirochetes. See Table 8.
Table 8.
| (F) | ||||
|---|---|---|---|---|
| The spirochaete-chlamydia clade | ||||
| # | Likelihood | ΔL | σΔL | RELL-BP |
| 1 | -242983.7 | best | N/A | 0.6173 |
| 2 | -243055.2 | -71.5 | 21.5 | 0.0000 |
| 3 | -243050.7 | -67.1 | 34.7 | 0.0078 |
| 4 | -243096.8 | -113.2 | 33.0 | 0.0000 |
| 5 | -243045.5 | -61.9 | 25.0 | 0.0007 |
| 6 | -243066.5 | -82.8 | 32.8 | 0.0012 |
| 7 | -243072.2 | -88.5 | 32.4 | 0.0006 |
| 8 | -243049.0 | -65.3 | 25.2 | 0.0005 |
| 9 | -243036.7 | -53.1 | 21.7 | 0.0016 |
| 10 | -243057.4 | -73.7 | 21.9 | 0.0000 |
| 11 | -242998.3 | -14.6 | 40.2 | 0.3605 |
| 12 | -243086.4 | -102.7 | 36.2 | 0.0000 |
| 13 | -243024.8 | -41.1 | 28.0 | 0.0071 |
| 14 | -243146.2 | -162.5 | 31.4 | 0.0000 |
| 15 | -243130.7 | -147.0 | 32.9 | 0.0000 |
| 16 | -243077.2 | -93.6 | 23.4 | 0.0000 |
| 17 | -243036.9 | -53.3 | 22.1 | 0.0027 |
Table 9.
| (G) | ||||
|---|---|---|---|---|
| ε-proteobacteria | ||||
| # | Likelihood | ΔL | σΔL | RELL-BP |
| 1 | -242983.7 | best | N/A | 0.5482 |
| 2 | -243093.9 | -110.3 | 32.7 | 0.0000 |
| 3 | -243009.8 | -26.1 | 39.6 | 0.0417 |
| 4 | -242991.7 | -8.0 | 41.2 | 0.3788 |
| 5 | -243007.7 | -24.0 | 34.1 | 0.0308 |
| 6 | -243121.1 | -137.4 | 30.3 | 0.0000 |
| 7 | -243112.4 | -128.7 | 31.1 | 0.0000 |
| 8 | -243076.4 | -92.8 | 22.0 | 0.0000 |
| 9 | -243071.1 | -87.4 | 29.7 | 0.0000 |
| 10 | -243055.0 | -71.4 | 33.4 | 0.0005 |
Figure 11.
The Kishino-Hasegawa test for the unification of ε-proteobacteria with the rest of Proteobacteria. See Table 9.
Table 10.
| (H) | ||||
|---|---|---|---|---|
| Crenarchaeota and Euryarchaeota | ||||
| # | Likelihood | ΔL | σΔL | RELL-BP |
| 1 | -242983.7 | best | N/A | 0.5840 |
| 2 | -242993.2 | -9.5 | 33.7 | 0.4160 |
A census of protein families
Another approach to the "species tree" problem involves analysis of phylogenetic trees for as many individual protein families as possible, in an attempt to identify a prevailing topology or at least common phylogenetic patterns. A survey of the COG data set identified 132 COGs, each of which included a large number of bacterial and archaeal species, but no or few paralogs and thus appeared to be amenable to a large-scale phylogenetic analysis (Table 11). Maximum-likelihood trees were constructed for each of these COGs, and a breakdown of nearest neighbors was derived for species and groups involved in each of the non-trivial or questionable branchings discussed above (Crenarchaea, Thermotoga, Aquifex, Deinococcus, Mycobacterium, Synechocystis, spirochetes, chlamydia, and ε-proteobacteria). In each case, a wide spread of topologies was observed, but the grouping that is observed in the concatenated ribosomal proteins tree was encountered most often, although, for example, for the spirochete-chlamydia cluster, the lead over other topologies was slim (Fig. 13,14,15).
Table 11.
COGs used for the comparative analysis of Maximum Likelihood trees for individual protein families
| COG | speca | protb | Name |
|---|---|---|---|
| COG0012 | 40 | 41 | Predicted GTPase |
| COG0013 | 40 | 40 | Alanyl-tRNA synthetase |
| COG0016 | 40 | 40 | Phenylalanyl-tRNA synthetase alpha submit |
| COG0018 | 40 | 41 | Arginyl-tRNA synthetase |
| COG0020 | 37 | 40 | Undecaprenyl pyrophosphate synthase |
| COG0048 | 39 | 39 | Ribosomal protein S12 |
| COG0049 | 40 | 41 | Ribosomal protein S7 |
| COG0051 | 40 | 40 | Ribosomal protein S10 |
| COG0052 | 40 | 40 | Ribosomal protein S2 |
| COG0060 | 40 | 40 | Isoleucyl-tRNA synthetase |
| COG0061 | 37 | 40 | Predicted kinase |
| COG0064 | 30 | 30 | Asp-tRNAAsn/Glu-tRNAGIn amidotransferase B subunit (PET 112 homolog) |
| COG0072 | 40 | 40 | Phenylalanyl-tRNA synthetase beta subunit |
| COG0080 | 40 | 41 | Ribosomal protein LI 1 |
| COG0081 | 40 | 40 | Ribosomal protein LI |
| COG0082 | 33 | 33 | Chorismate synthase |
| COG0085 | 40 | 40 | DNA-directed RNA polymerase beta subunit/140 kD subunit (split gene in |
| Mjan, Mthe, Aful) | |||
| COG0087 | 40 | 40 | Ribosomal protein L3 |
| COG0088 | 40 | 40 | Ribosomal protein L4 |
| COG0090 | 40 | 40 | Ribosomal protein L2 |
| COG0091 | 40 | 40 | Ribosomal protein L22 |
| COG0092 | 40 | 40 | Ribosomal protein S3 |
| COG0093 | 39 | 39 | Ribosomal protein LI 4 |
| COG0094 | 40 | 40 | Ribosomal protein L5 |
| COG0096 | 40 | 40 | Ribosomal protein S8 |
| COG0097 | 40 | 40 | Ribosomal protein L6 |
| COG0098 | 40 | 40 | Ribosomal protein S5 |
| COG0099 | 40 | 40 | Ribosomal protein S13 |
| COG0100 | 39 | 39 | Ribosomal protein S11 |
| COG0101 | 38 | 38 | Pseudouridylate synthase (tRNA psi55) |
| COG0102 | 40 | 40 | Ribosomal protein LI 3 |
| COG0103 | 40 | 40 | Ribosomal protein S9 |
| COG0104 | 31 | 31 | Adenylosuccinate synthase |
| COG0105 | 33 | 33 | Nucleoside diphosphate kinase |
| COG0126 | 39 | 39 | 3-phosphoglycerate kinase |
| COG0127 | 34 | 35 | Xanthosine triphosphate pyrophosphatase |
| COG0128 | 33 | 35 | 5-enolpyruvylshikimate-3-phosphate synthase |
| COG0130 | 37 | 37 | Pseudouridine synthase |
| COG0134 | 30 | 30 | Indole-3-glycerol phosphate synthase |
| COG0135 | 30 | 30 | Phosphoribosylanthranilate isomerase |
| COG0143 | 40 | 41 | Methionyl-tRNA synthetase |
| COG0148 | 39 | 43 | Enolase |
| COG0149 | 39 | 41 | Triosephosphate isomerase |
| COG0151 | 30 | 30 | Phosphoribosylamine-glycine ligase |
| COG0152 | 30 | 32 | Phosphoribosylaminoimidazolesuccinocarboxamide (SAICAR) synthase |
| COG0159 | 31 | 31 | Tryptophan synthase alpha chain |
| COG0162 | 40 | 43 | Tyrosyl-tRNA synthetase |
| COG0164 | 35 | 35 | Ribonuclease HII |
| COG0166 | 35 | 35 | Glucose-6-phosphate isomerase |
| COG0167 | 32 | 37 | Dihydroorotate dehydrogenase |
| COG0169 | 33 | 39 | Shikimate 5-dehydrogenase |
| COG0171 | 35 | 37 | NAD synthase |
| COG0172 | 40 | 40 | Seryl-tRNA synthetase |
| COG0173 | 30 | 30 | Aspartyl-tRNA synthetase |
| COG0178 | 31 | 33 | Excinuclease ATPase submit |
| COG0180 | 40 | 43 | Tryptophanyl-tRNA synthetase |
| COG0190 | 33 | 33 | 5,10-methylene-tetrahydrofolate dehydrogenase |
| COG0193 | 30 | 30 | Peptidyl-tRNA hydrolase |
| COG0197 | 40 | 40 | Ribosomal protein L16/L10E |
| COG0198 | 40 | 40 | Ribosomal protein L24 |
| COG0200 | 40 | 40 | Ribosomal protein LI 5 |
| COG0201 | 40 | 41 | Preprotein translocase subunit SecY |
| COG0202 | 40 | 40 | DNA-directed RNA polymerase alpha subunit/40 kD subunit |
| COG0203 | 30 | 30 | Ribosomal protein LI 7 |
| COG0215 | 38 | 39 | Cysteinyl-tRNA synthetase |
| COG0216 | 30 | 30 | Protein chain release factor A |
| COG0221 | 31 | 31 | Inorganic pyrophosphatase |
| COG0222 | 30 | 30 | Ribosomal protein L7/L12 |
| COG0223 | 30 | 34 | Methionyl-tRNA formyltransferase |
| COG0231 | 40 | 46 | Translation elongation factor P/translation initiation factor eIF-5A |
| COG0233 | 30 | 30 | Ribosome recycling factor |
| COG0237 | 39 | 41 | Dephospho-CoA kinase |
| COG0242 | 30 | 35 | N-formylmethionyl-tRNA deformylase |
| COG0244 | 40 | 40 | Ribosomal protein L10 |
| COG0250 | 40 | 43 | Transcription antiterminator |
| COG0256 | 40 | 40 | Ribosomal protein LI 8 |
| COG0258 | 40 | 47 | 5'-3' exonuclease (including N-terminal domain of Poll) |
| COG0261 | 30 | 30 | Ribosomal protein L21 |
| COG0264 | 30 | 30 | Translation elongation factor Ts |
| COG0272 | 30 | 31 | NAD-dependent DNA ligase (contains BRCT domain type II) |
| COG0275 | 30 | 30 | Predicted S-adenosylmethionine-dependent methyltransferase involved in cell |
| envelope biogenesis | |||
| COG0284 | 32 | 32 | Orotidine-5'-phosphate decarboxylase |
| COG0290 | 30 | 30 | Translation initiation factor IF3 |
| COG0292 | 30 | 30 | Ribosomal protein L20 |
| COG0294 | 33 | 36 | Dihydropteroate synthase |
| COG0305 | 30 | 31 | Replicative DNA helicase |
| COG0313 | 30 | 31 | Predicted methyltransferases |
| COG0319 | 30 | 30 | Predicted metal-dependent hydrolase |
| COG0335 | 30 | 30 | Ribosomal protein LI 9 |
| COG0336 | 30 | 30 | tRNA-(guanine-N1)-methyltransferase |
| COG0340 | 32 | 34 | Biotin-(acetyl-CoA carboxylase) ligase |
| COG0343 | 35 | 36 | Queuine/archaeosine tRNA-ribosyltransferase |
| COG0351 | 31 | 34 | Hydroxymethylpyrimidine/phosphomethylpyrimidine kinase |
| COG0359 | 30 | 30 | Ribosomal protein L9 |
| COG0441 | 40 | 43 | Threonyl-tRNA synthetase |
| COG0442 | 40 | 40 | Prolyl-tRNA synthetase |
| COG0452 | 32 | 32 | Phosphopantothenoylcysteine synthetase/decarboxylase |
| COG0461 | 33 | 34 | Orotate phosphoribosyltransferase |
| COG0462 | 37 | 40 | Phosphoribosylpyrophosphate synthetase |
| COG0481 | 30 | 30 | Membrane GTPase LepA |
| COG0495 | 40 | 41 | Leucyl-tRNA synthetase |
| COG0504 | 38 | 38 | CTP synthase (UTPammonia lyase) |
| COG0519 | 33 | 33 | GMP synthase – PP-ATPase domain |
| COG0522 | 40 | 40 | Ribosomal protein S4 and related proteins |
| COG0525 | 40 | 40 | Valyl-tRNA synthetase |
| COG0528 | 40 | 40 | Uridylate kinase |
| COG0532 | 40 | 40 | Translation initiation factor 2 (GTPase) |
| COG0533 | 40 | 40 | Metal-dependent proteases with possible chaperone activity |
| COG0536 | 30 | 30 | Predicted GTPase |
| COG0540 | 30 | 30 | Aspartate carbamoyltransferase, catalytic chain |
| COG0541 | 40 | 40 | Signal recognition particle GTPase |
| COG0544 | 30 | 30 | FKBP-type peptidyl-prolyl cis-trans isomerase (trigger factor) |
| COG0547 | 30 | 35 | Anthranilate phosphoribosyltransferase |
| COG0552 | 40 | 40 | Signal recognition particle GTPase |
| COG0556 | 31 | 31 | Helicase subunit of the DNA excision repair complex |
| COG0571 | 30 | 30 | dsRNA-specific ribonuclease |
| COG0573 | 30 | 34 | ABC-type phosphate transport system, permease component |
| COG0576 | 34 | 35 | Molecular chaperone GrpE (heat shock protein) |
| COG0581 | 30 | 34 | ABC-type phosphate transport system, permease component |
| COG0587 | 30 | 35 | DNA polymerase III alpha subunit |
| COG0597 | 30 | 30 | Lipoprotein signal peptidase |
| COG0653 | 30 | 32 | Preprotein translocase subunit SecA (ATPase, RNA helicase) |
| COG0682 | 30 | 30 | Prolipoprotein diacylglyceryltransferase |
| COG0691 | 30 | 30 | tmRNA-binding protein |
| COG0706 | 30 | 34 | Preprotein translocase subunit YidC |
| COG0781 | 30 | 30 | Transcription termination factor |
| COG0858 | 30 | 30 | Ribosome-binding factor A |
| COG1160 | 30 | 30 | Predicted GTPases |
| COG1214 | 30 | 30 | Inactive homologs of metal-dependent proteases, putative molecular chaperones |
| COG1466 | 30 | 30 | DNA polymerase III delta subunit |
| COG1488 | 32 | 35 | Nicotinic acid phosphoribosyltransferase |
| COG2812 | 30 | 30 | DNA polymerase III, gamma/tau subunits |
Figure 13.
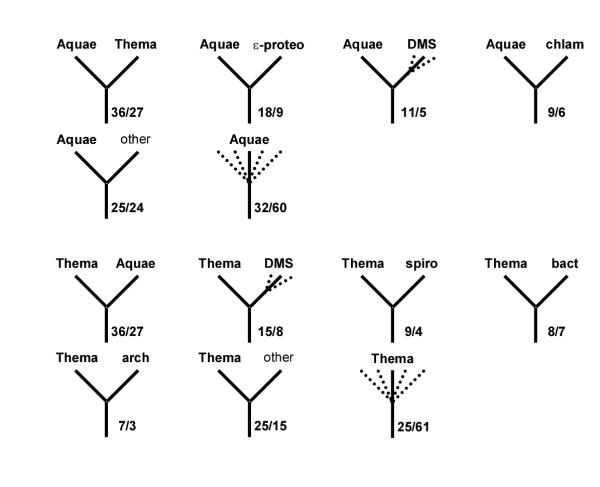
A census of the topologies of maximum-likelihood trees for individual protein families.Thermotoga and Aquifex. In each panel, the left top icon shows the grouping tested and the remaining icons show the most common alternative topologies for the given species/group. Dotted lines indicate optional presence of (possibly several) members of the indicated group (e.g. "proteo" with several dotted lines leading to it means that any number and combination of proteobacterial proteins could be present on the given branch). For each icon, the number of COG trees with the given topology (upper number) and the size of the subset supported by at least 70% bootstrap values (lower number) are indicated. Uncertain topologies (lacking clearly defined taxonomic units on the other side of the subtree or those without bootstrap support) are indicated by multiple dotted lines without indication of the neighbor. Abbreviations: TA – Thema and/or Aquae; DMS – any combination of Deira, Myctu and SynPC. Note that, in some cases, which involve taxonomic clades rather than single organisms (e.g. spirochetes), failure of the corresponding species to form a clade in the given tree may lead to asymmetrical counts of topologies. For example, if a particular tree has a (Deira,(Trepa, Borbu)) branch, this tree will be included in both the Deira-spiro and spiro-Deira tallies. If, however, the subtree ((Deira, Trepa),(Aquae, Borbu)) is present, then the Deira-spiro and Aquae-spiro tallies gain one count each, but the spiro-Deira and spiro-Aquae tallies do not; instead, a case of spirochete polyphyly is registered.
Figure 14.

A census of the topologies of maximum-likelihood trees for individual protein families.Deinococcus, Mycobacterium and Synechocystis. The designations are as in Fig. 3.
Figure 15.
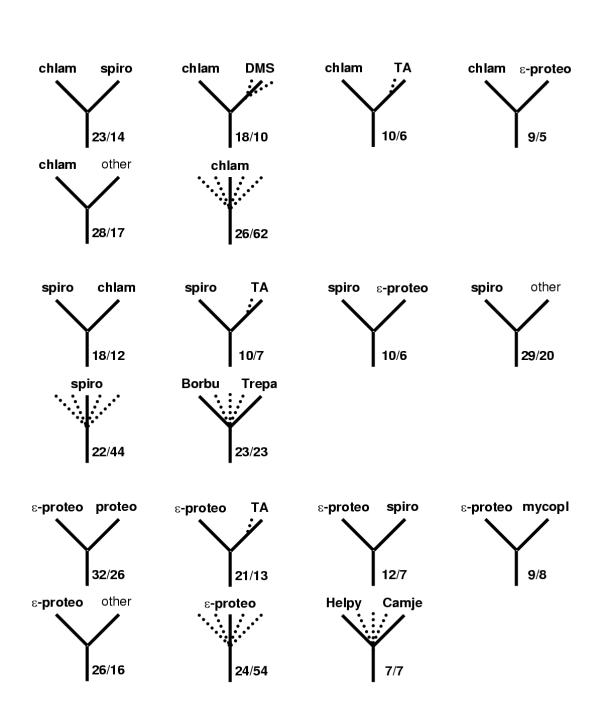
A census of the topologies of maximum-likelihood trees for individual protein families. Spirochetes, chlamydia and epsilon-protoebacteria. The designations are as in Fig. 3.
Figure 12.
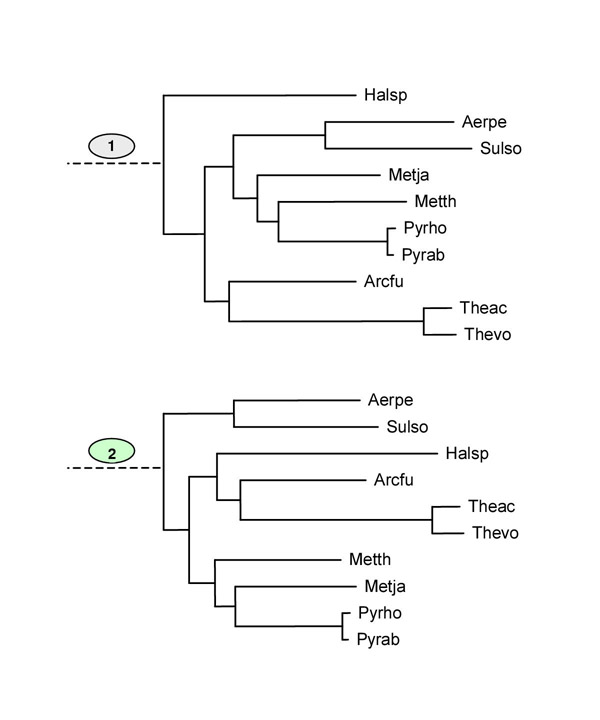
The Kishino-Hasegawa test for position of Crenarchaeota with respect to Euryarchaeota. Position of Crenarchaeota with respect to Euryarchaeota (1) – the maximum-likelihood tree topology; (2) – the competing topology with Crenarchaeota and Euryarchaeota as sister groups. See Table 10
Discussion and Conclusions
The trees constructed with each of the four approaches employed here reflect both the phylogenetic signal and the phenotypic (life style) similarities or differences between organisms, but the relative contributions of these two types of information appear to differ substantially. The gene presence-absence analysis seemed to be dominated by the phenotypic signal, primarily that from gene loss. The tree based on conserved gene pairs appeared to combine phylogenetic information with major effects of horizontal transfer of operons. In contrast, the trees based on the distributions of the identity level of orthologs appear to be more meaningful phylogenetically as indicated by the recovery of established high-level phylogenetic groups of bacteria, such as Proteobacteria and Gram-positive bacteria. The ability to correctly identify these major bacterial subdivisions and the absence of obviously wrong groupings confer credibility to non-trivial clades present in these trees, in particular the spirochete-chlamydia clade. The same logic applied to the tree made of concatenated ribosomal protein sequences, which included two other non-trivial bacterial groupings, Aquifex-Thermotoga and Synechocystis-Mycobacterium-Deinococcus, the latter joining the Gram-positive branch. Furthermore, extensive testing of alternative topologies using the Kishino-Hasegawa test largely supported these new bacterial branches. The nature of this support becomes clearer when one examines the results of the protein family census. Each of the potential new clades was indeed most common among the observed topologies, but in no case, was the excess of this topology overwhelming. Taken together, these results seem to shed light on the very notion of a "species tree". It appears that, at best, a species tree can be viewed as a prevailing phylogenetic trend, which, as far as deep branchings are concerned, may not even apply to a majority of the genes in a genome.
The potential new, deep relationships between bacterial lineages revealed during this analysis should be considered preliminary and treated with caution. Nevertheless, an evolutionary affinity between Cyanobacteria (Synechocystis) and Actinomycetes (Mycobacterium) appears plausible, particularly given the presence, in these bacterial groups, of well-developed and partly similar signal transduction systems [27]. The connection between two hyperthermophilic bacteria, Aquifex and Thermotoga, also has obvious biological meaning, although, in this case, particular caution is due, given the possibility of preferential horizontal gene exchange between these organisms that inhabit similar environments. However, the strong support for this grouping obtained in the analysis of concatenated ribosomal proteins argues against horizontal transfer as the primary cause for the observed topology. Although recent studies on the phylogeny of ribosomal proteins suggest some horizontal transfer events, these seem to be largely restricted to bacteria-specific ribosomal proteins. In the universal set of ribosomal proteins, only one, S14, showed clear signs of horizontal transfer [28]. The potential deep phylogenetic connections uncovered during this analysis call for detailed genome comparisons in search of potential shared derived characters, such as unique protein domain architectures, that could support the new clades.
The major bacterial lineages are poorly resolved in rRNA-based trees [2,29] and those built using alignments of RNA polymerase subunits [30] and translation elongation factors [29,31]. In the currently accepted taxonomy, which is based primarily (but not exclusively) on 16S RNA phylogenetic analysis, bacterial lineages that are suggested by this analysis to form higher-level clusters, tend to form primary nodes under Bacteria (Chlamydiales, Spirochetales, Cyanobacteria, the Thermus-Deinococcus group, Aquificales, Thermotogales). Thus, the genome trees primarily suggest (however tentatively) new unifications based on deep phylogenetic connections, rather than split already established clades. A notable exception is the traditional unification of Actinomycetes, or High G+C gram-positive bacteria (represented here by Mycobacterium), with low G+C Gram-positive bacteria (the Bacillus-Clostridium group) under Firmicutes (Gram-positive bacteria). Such a connection was not supported by any of the trees analyzed here, and it is also poorly, if at all, supported by the latest consensus trees for 16S RNA, 23 S RNA and translation factor EF-Tu [29]. Therefore it seems likely that the Firmicutes clade, at least in its present composition, does not exist. The new clade that might replace it consists of low-GC Gram-positive bacteria and the potential Actinomycetes-Deinococcales-Cyanobacteria group (Fig. 6). All methods of tree analysis applied here also challenge the traditional division of the archaeal kingdom into Euryarchaeota and Crenarchaeota, suggesting instead that Euryarchaeota could be a paraphyletic group with respect to Crenarchaeota, or in other words, that Crenarchaeota might have evolved from within the Euryarchaeota. However, the existence of a statis tically supported alternative topology, with a sister-group relationship between Euryarchaeota and Crenarchaeota allows for the possibility that the apparent paraphyly of Euryarchaea is an artifact caused by rapid evolution in some Euryarchaeal lineages, such as Halobacterium and Thermoplasma.
An independent phylogenetic study of concatenated ribosomal proteins has been recently published [32]. The main specific conclusion reported in this study was the apparent association of Synechocystis with Gram-positive bacteria, although instability of the tree topology dependent on the subset of sites used for analysis was noticed. Another recent study addressed the issue of a global tree through phylogenetic analysis of 14 concatenated sets of orthologous proteins, for which no strong evidence of horizontal transfer was available [33]. Notably, some of the unexpected groupings within the bacterial domain reported in this study coincide or overlap with those described here, namely, a spirochete-chlamydial clade and a Deinococcales-Cyanobacteria clade. The grouping of the latter clade with Actinomycetes, the unification of the Deinococcales-Cyanobacteria-Actinomycetes clade with Gram-positive bacteria and the grouping of the two bacterial hyperthermophiles were not reproduced in the work of Brown and co-workers. The differences between the results of the two studies could owe to the differences between data sets analyzed, the methods used or, most likely, both. We should note that the present study engaged a substantially broader data set and more diverse methods for tree construction. We believe, however, that, in terms of the potential contribution of genome-wide phylogenetic analysis to phylogenetic taxonomy, the areas where different methods and independent analyses by different groups converge might be more important than the areas of discrepancy. It appears that potential new clades revealed in such independent studies are strong candidates for new, high-level taxa.
The results of the present study suggest that genome trees based on new, integral criteria do not provide substantial advantages in phylogenetic reconstruction over more traditional, alignment-based methods expanded to the genomic scale. In fact, the latter seem to be more sensitive in detecting potential deep evolutionary relationships and this is expected to further improve with the increasing number of completely sequenced genomes becoming available for analysis. We believe, however, that this conclusion does not necessarily indicate that genome trees, such as those based on representation of genomes in orthologous sets or conservation of gene pairs, are useless. In addition to revealing some new phylogenetic affinities, they are capable of alerting researchers to other evolutionary phenomena, such as loss of similar gene sets in different organisms and preferential horizontal gene exchange between certain lineages.
Material and Methods
Sequence data
The sequences of the proteins encoded in complete genomes were extracted from the Genome division of the Entrez retrieval system [34]. The analyzed genomes included those of 30 bacteria: Aquifex aeolicus (Aquae), Bacillus halodurans (Bacha), Bacillus subtilis (Bacsu), Borrelia burgdorferi (Borbu), Buchnera sp. (Bucsp), Campylobacter jejunii (Camje), Caulobacter crescentus (Caucr), Chlamydia trachomatis (Chltr), Chlamydophila pneumoniae (Chlpn), Deinococcus radiodurans (Deira), Escherichia coli (Escco), Haemophilus influenzae (Haein), Helicobacter pylori (Helpy), Lactococcus lactis (Lacla), Mesorhizobium loti (Meslo), Mycoplasma genitalium (Mycge), Mycoplasma pneumoniae (Mycpn), Mycobacterium tuberculosis (Myctu), Neisseria meningitidis (Neime), Pasteurella multocida (Pasmu), Psudomonas aeruginosa (Pseae), Rickettsia prowazekii (Ricpr), Staphyloccocus aureus (Staau), Streptococcus pyogenes (Strpy), Synechocystis PCC6803 (SynPC), Thermotoga maritima (Thema), Treponema pallidum (Trepa), Ureaplasma urealyticum (Ureur), Vibrio cholerae (Vibch), Xylella fastidiosa (Xylfa), and ten archaea: Aeropyrum pernix (Aerpe), Archaeoglobus fulgidus (Arcfu), Halobacterium sp. (Halsp), Methanobacterium thermoautotrophicum (Metth), Methanococcus jannaschii (Metja), Pyrococcus horikoshii (Pyrho), Pyrococcus abyssi (Pyrab), Sulfolobus solfataricus (Sulso), Thermoplasma acidophilum (Theac), Thermoplasma volcanium (Thevo).
Phylogenetic tree construction
Parsimony trees based on the presence-absence of conserved gene pairs in prokaryotic genomes
The database of Clusters of Orthologous Groups of proteins (COGs) was used as the source of information on orthologous genes in prokaryotic genomes [35,36]. Briefly, the COGs were constructed from the results of all-against-all BLAST [37] comparison of proteins encoded in complete genomes by detecting consistent groups of genome-specific best hits (BeTs). The COG construction procedure does not rely on any preconceived phylogenetic tree of the included species except that certain obviously related genomes (for example, two species of mycoplasmas or pyrococci) were grouped prior to the analysis, to eliminate strong dependence between BeTs. In order to avoid spurious occurrence of the same gene pair, only gene pairs conserved in three or more genomes were considered. A pair of genes from two COGs was considered to be conserved if the respective genes were adjacent in at least one genome and were separated by no more than two genes in at least two additional genomes. This relaxed definition of a conserved gene pair was adopted to take into account the high level of recombination in prokaryotic genomes. From the data on the presence-absence of each conserved gene pair in the analyzed genomes (excluding pairs of closely related species: E. coli-Buchnera sp., H. influenzae-P. multocida, C. trachomatis-C. pneumoniae, P. horikoshii-P. abyssi, M. genitalium-M. pneumoniae-U. urealyticum, H. pyroli – C. jejuni, T. acidophilum-T. volcanium), a 0/1 matrix analogous to the one used for the presence-absence of individual genes was constructed, and a tree was built using Dollo parsimony [38]. A parsimony method was chosen for this analysis because the presence-absence of a conserved gene pair in a genome can be naturally treated in terms of character states. The Dollo model is based on the assumption that each derived character state (in this case, the presence of a gene pair) originates only once, and homoplasies exist only in the form of reversals to the ancestral condition (absence of a gene pair) [38]. In other words, parallel or convergent gains of the derived condition are assumed to be highly unlikely. The Dollo parsimony method is not sensitive to gene loss which is extremely common in evolution of prokaryotes, but the results can be affected by independent acquisition of the same gene pair by different genome via horizontal gene transfer. Phylogenetic analysis was performed by using the PAUP 4.0 program [39], with 1000 bootstrap replicates performed to assess the reliability of the tree topology. In addition, the tree topology was analyzed using the neighbor-joining method [40].
Parsimony trees based on the representation of genomes in orthologous gene sets
The information on orthologous genes in prokaryotic genomes and the yeast genome was derived from the COGs as in the previous approach, and the orthology data were similarly represented as a 0/1 matrix of presence-absence of the analyzed genomes in the COGs. A Dollo parsimony tree was constructed and the reliability of its topology was assessed using the bootstrap method as described above.
Distance trees based on distributions of identity percentage between orthologous protein sequences
The sequences of all proteins encoded in the analyzed genomes were compared to each other using the gapped BLASTP program [37]. Reciprocal, genome-specific BeTs were collected at different expectation (E) value cutoffs (0.01, 0.001, 0.0001, 0.00001). This method for identification of probable orthologs is, in principle, similar to the method employed in COG construction, but differs in that there is no requirement for the formation of triangles of consistent BeTs. The result of this procedure is a conservative selection of orthologous pairs because the cases of lineage-specific duplication that result in non-symmetrical BeTs are excluded and so are orthologous pairs with very low sequence similarity. However, the limitation of the COG system, namely the requirement that each orthologous group is represented in at least three genomes, is avoided. The distributions of identity percentage among the reciprocal best hits were derived for each pair of species. The mean, mode, median and different quantiles of the identity percentage distributions were used for estimating evolutionary distances. Four distance measures were used, namely: i) P-distances calculated as the fraction of different residues: d = 1-q, ii) Poisson distances d = -1n_u,_ iii) geometric distances calculated using the formula d = 1/u_-1, and iv) logarithmic distances found as a solution of the equation u = ln(1+2_d)/(2_d_), where d is the evolutionary distance, q is percent identity, and u = (_q_-0.05)/0.95 [41,42][43]. Trees were constructed from the distance matrices obtained with the above distance estimates using the neighbor-joining method [40] as implemented in the NEIGHBOR program of the PHYLIP package [44]. Bootstrap values were estimated by resampling the set of orthologs identified for each pair of genomes 1000 times and reconstructing trees from the distributions of the distances from these resampled sets.
Maximum Likelihood trees based on concatenated alignments of ribosomal proteins
Sets of orthologous ribosomal proteins were extracted from the COG database, and their amino acid sequences were aligned using the T-Coffee program [45], with subsequent manual validation and removal of poorly aligned regions. The alignments are available upon request. Pairwise evolutionary distances between the sequences in concatenated alignments were calculated using the Dayhoff PAM model as implemented in the PROTDIST program of the PHYLIP package [44]. A distance tree was constructed from the resulting distance matrix by using the least-square [46] method as implemented in the FITCH program of PHYLIP [44]. The maximum likelihood tree was constructed with the JTT-F model of amino acid substitutions [47], as implemented in the ProtML program of the MOLPHY package [48], by optimizing the least squares tree with local rearrangements. Alternative topologies were created manually by modifications of the original tree and directly compared by ProtML. Bootstrap analysis was performed by using the Resampling of Estimated Log-Likelihoods (RELL) method as implemented in ProtML [48,49].
Comparative analysis of Maximum Likelihood trees for individual protein families
The representative families were selected from the COG database according to the following criteria: i) at least 30 species are represented; ii) no more than two paralogs in any of the species; iii) no more than 1.2 paralogs per genome on average; iv) at least 100 positions in the alignment containing less than 30% of gaps. This selection procedure resulted in a set of 132 families (COGs). Alignments and ML trees were constructed for these families as described above for the concatenated ribosomal proteins.
Quantitative comparison of tree topologies
To compare tree topologies quantitatively, the symmetric distance between trees [50] was computed using the TREEDIST program of the PHYLIP package (version 3.6a). Briefly, each of the two compared trees is divided by each internal branch into two partitions. The symmetric distance is the number of partitions that are found in one tree but not the other.
Acknowledgments
Acknowledgements
We thank M. Nei for simulating discussions about the Dollo parsimony analysis, J. Felsenstein for alerting us of the inclusion of the TREEDIST program in PHYLIP3.6a and D. Leipe for discussions on taxonomy.
Contributor Information
Yuri I Wolf, Email: wolf@ncbi.nlm.nih.gov.
Igor B Rogozin, Email: rogozin@ncbi.nim.nih.gov.
Nick V Grishin, Email: grishin@chop.swmed.edu.
Roman L Tatusov, Email: tatusov@ncbi.nlm.nih.gov.
Eugene V Koonin, Email: koonin@ncbi.nlm.nih.gov.
References
- Woese CR. Bacterial evolution. Microbiol Rev. 1987;51:221–271. doi: 10.1128/mr.51.2.221-271.1987. [DOI] [PMC free article] [PubMed] [Google Scholar]
- Olsen GJ, Woese CR, Overbeek R. The winds of (evolutionary) change: breathing new life into microbiology. J Bacteriol. 1994;176:1–6. doi: 10.1128/jb.176.1.1-6.1994. [DOI] [PMC free article] [PubMed] [Google Scholar]
- Doolittle RF, Feng DF, Tsang S, Cho G, Little E. Determining divergence times of the major kingdoms of living organisms with a protein clock. Science. 1996;271:470–477. doi: 10.1126/science.271.5248.470. [DOI] [PubMed] [Google Scholar]
- Teichmann SA, Mitchison G. Is there a phylogenetic signal in prokaryote proteins? J Mol Evol. 1999;49:98–107. doi: 10.1007/pl00006538. [DOI] [PubMed] [Google Scholar]
- Sicheritz-Ponten T, Andersson SG. A phylogenomic approach to microbial evolution. Nucleic Acids Res. 2001;29:545–552. doi: 10.1093/nar/29.2.545. [DOI] [PMC free article] [PubMed] [Google Scholar]
- Doolittle WF. Phylogenetic classification and the universal tree. Science. 1999;284:2124–2129. doi: 10.1126/science.284.5423.2124. [DOI] [PubMed] [Google Scholar]
- Doolittle WF. Lateral genomics. Trends Cell Biol. 1999;9:M5–8. doi: 10.1016/S0962-8924(99)01664-5. [DOI] [PubMed] [Google Scholar]
- Snel B, Bork P, Huynen MA. Genome phylogeny based on gene content. Nat Genet. 1999;21:108–110. doi: 10.1038/5052. [DOI] [PubMed] [Google Scholar]
- Fitz-Gibbon ST, House CH. Whole genome-based phylogenetic analysis of free-living microorganisms. Nucleic Acids Res. 1999;27:4218–4222. doi: 10.1093/nar/27.21.4218. [DOI] [PMC free article] [PubMed] [Google Scholar]
- Tekaia F, Dujon B. Pervasiveness of gene conservation and persistence of duplicates in cellular genomes. J Mol Evol. 1999;49:591–600. doi: 10.1007/pl00006580. [DOI] [PubMed] [Google Scholar]
- Grishin NV, Wolf YI, Koonin EV. From complete genomes to measures of substitution rate variability within and between proteins. Genome Res. 2000;10:991–1000. doi: 10.1101/gr.10.7.991. [DOI] [PMC free article] [PubMed] [Google Scholar]
- Dobzhansky T, Sturtevant AH. Inversions in the chromosomes of Drosophila pseudoobscura. Genetics. 1938;23:28–64. doi: 10.1093/genetics/23.1.28. [DOI] [PMC free article] [PubMed] [Google Scholar]
- Hannenhalli S, Chappey C, Koonin EV, Pevzner PA. Genome sequence comparison and scenarios for gene rearrangements: a test case. Genomics. 1995;30:299–311. doi: 10.1006/geno.1995.9873. [DOI] [PubMed] [Google Scholar]
- Sankoff D, Blanchette M. Phylogenetic invariants for genome rearrangements. J Comput Biol. 1999;6:431–445. doi: 10.1089/106652799318373. [DOI] [PubMed] [Google Scholar]
- Mushegian AR, Koonin EV. Gene order is not conserved in bacterial evolution. Trends Genet. 1996;12:289–290. doi: 10.1016/0168-9525(96)20006-X. [DOI] [PubMed] [Google Scholar]
- Dandekar T, Snel B, Huynen M, Bork P. Conservation of gene order: a fingerprint of proteins that physically interact. Trends Biochem Sci. 1998;23:324–328. doi: 10.1016/S0968-0004(98)01274-2. [DOI] [PubMed] [Google Scholar]
- Huynen MJ, Snel B. Gene and context: integrative approaches to genome analysis. Adv Prot Chem. 2000;54:345–379. doi: 10.1016/s0065-3233(00)54010-8. [DOI] [PubMed] [Google Scholar]
- Tatusov RL, Mushegian AR, Bork P, Brown NP, Hayes WS, Borodovsky M, Rudd KE, Koonin EV. Metabolism and evolution of Haemophilus influenzae deduced from a whole-genome comparison with Escherichia coli. Curr Biol. 1996;6:279–291. doi: 10.1016/s0960-9822(02)00478-5. [DOI] [PubMed] [Google Scholar]
- Overbeek R, Fonstein M, D'Souza M, Pusch GD, Maltsev N. The use of gene clusters to infer functional coupling. Proc Natl Acad Sci USA. 1999;96:2896–2901. doi: 10.1073/pnas.96.6.2896. [DOI] [PMC free article] [PubMed] [Google Scholar]
- Fujibuchi W, Ogata H, Matsuda H, Kanehisa M. Automatic detection of conserved gene clusters in multiple genomes by graph comparison and P-quasi grouping. Nucleic Acids Res. 2000;28:4029–4036. doi: 10.1093/nar/28.20.4029. [DOI] [PMC free article] [PubMed] [Google Scholar]
- Wolf YI, Rogozin IB, Kondrashov AS, Koonin EV. Genome alignment, evolution of prokaryotic genome organization and prediction of gene function using genomic context. Genome Res. 2001. [DOI] [PubMed]
- Koonin EV, Mushegian AR, Galperin MY, Walker DR. Comparison of archaeal and bacterial genomes: computer analysis of protein sequences predicts novel functions and suggests a chimeric origin for the archaea. Mol Microbiol. 1997;25:619–637. doi: 10.1046/j.1365-2958.1997.4821861.x. [DOI] [PubMed] [Google Scholar]
- Aravind L, Tatusov RL, Wolf YI, Walker DR, Koonin EV. Evidence for massive gene exchange between archaeal and bacterial hyperthermophiles. Trends Genet. 1998;14:442–444. doi: 10.1016/S0168-9525(98)01553-4. [DOI] [PubMed] [Google Scholar]
- Nelson KE, Clayton RA, Gill SR, Gwinn ML, Dodson RJ, Haft DH, Hickey EK, Peterson JD, Nelson WC, Ketchum KA, McDonald L, Utterback TR, Malek JA, Linher KD, Garrett MM, Stewart AM, Cotton MD, Pratt MS, Phillips CA, Richardson D, Heidelberg J, Sutton GG, Fleischmann RD, Eisen JA, Fraser CM, et al. Evidence for lateral gene transfer between Archaea and bacteria from genome sequence of Thermotoga maritima. Nature. 1999;399:323–329. doi: 10.1038/20601. [DOI] [PubMed] [Google Scholar]
- Martin W. Mosaic bacterial chromosomes: a challenge en route to a tree of genomes. Bioessays. 1999;21:99–104. doi: 10.1002/(SICI)1521-1878(199902)21:2<99::AID-BIES3>3.3.CO;2-2. [DOI] [PubMed] [Google Scholar]
- Pace NR. A molecular view of microbial diversity and the biosphere. Science. 1997;276:734–740. doi: 10.1126/science.276.5313.734. [DOI] [PubMed] [Google Scholar]
- Ponting CP, Aravind L, Schultz J, Bork P, Koonin EV. Eukaryotic signalling domain homologues in archaea and bacteria. Ancient ancestry and horizontal gene transfer. J Mol Biol. 1999;289:729–745. doi: 10.1006/jmbi.1999.2827. [DOI] [PubMed] [Google Scholar]
- Brochier C, Philippe H, Moreira D. The evolutionary history of ribosomal protein RpS14: horizontal gene transfer at the heart of the ribosome. Trends Genet. 2000;16:529–533. doi: 10.1016/S0168-9525(00)02142-9. [DOI] [PubMed] [Google Scholar]
- Ludwig W, Strunk 0, Klugbauer S, Klugbauer N, Weizenegger M, Neumaier J, Bachleitner M, Schleifer KH. Bacterial phylogeny based on comparative sequence analysis. Electrophoresis. 1998;19:554–568. doi: 10.1002/elps.1150190416. [DOI] [PubMed] [Google Scholar]
- Gruber TM, Bryant DA. Molecular systematic studies of eubacteria, using sigma70-type sigma factors of group 1 and group. J Bacteriol. 1997;179:1734–1747. doi: 10.1128/jb.179.5.1734-1747.1997. [DOI] [PMC free article] [PubMed] [Google Scholar]
- Baldauf SL, Palmer JD, Doolittle WF. The root of the universal tree and the origin of eukaryotes based on elongation factor phylogeny. Proc Natl Acad Sci USA. 1996;93:7749–7754. doi: 10.1073/pnas.93.15.7749. [DOI] [PMC free article] [PubMed] [Google Scholar]
- Hansmann S, Martin W. Phylogeny of 33 ribosomal and six other proteins encoded in an ancient gene cluster that is conserved across prokaryotic genomes: influence of excluding poorly alignable sites from analysis. Int J Syst Evol Microbiol. 2000;50:1655–1663. doi: 10.1099/00207713-50-4-1655. [DOI] [PubMed] [Google Scholar]
- Brown JR, Douady CJ, Italia MJ, Marshall WE, Stanhope MJ. Universal trees based on large combined protein sequence data sets. Nat Genet. 2001;28:281–285. doi: 10.1038/90129. [DOI] [PubMed] [Google Scholar]
- Tatusova TA, Karsch-Mizrachi I, Ostell JA. Complete genomes in WWW Entrez: data representation and analysis. Bioinformatics. 1999;15:536–543. doi: 10.1093/bioinformatics/15.7.536. [DOI] [PubMed] [Google Scholar]
- Tatusov RL, Koonin EV, Lipman DJ. A genomic perspective on protein families. Science. 1997;278:631–637. doi: 10.1126/science.278.5338.631. [DOI] [PubMed] [Google Scholar]
- Tatusov RL, Galperin MY, Natale DA, Koonin EV. The COG database: a tool for genome-scale analysis of protein functions and evolution. Nucleic Acids Res. 2000;28:33–36. doi: 10.1093/nar/28.1.33. [DOI] [PMC free article] [PubMed] [Google Scholar]
- Altschul SF, Madden TL, Schaffer AA, Zhang J, Zhang Z, Miller W, Lipman DJ. Gapped BLAST and PSI-BLAST: a new generation of protein database search programs. Nucleic Acids Res. 1997;25:3389–3402. doi: 10.1093/nar/25.17.3389. [DOI] [PMC free article] [PubMed] [Google Scholar]
- Farris JS. Phylogenetic analysis under Dollo's Law. Syst. 1977;26:77–88. [Google Scholar]
- Swofford DL. PAUP: phylogenetic analysis using parsimony (and other methods) Sunderland, MD: Sinauer; 1998.
- Saitou N, Nei M. The neighbor-joining method: a new method for reconstructing phylogenetic trees. Mol Biol Evol. 1987;4:406–425. doi: 10.1093/oxfordjournals.molbev.a040454. [DOI] [PubMed] [Google Scholar]
- Grishin NV. Estimation of the number of amin acid substitutions per site when the substitution rate varies among the sites. J Mol Evol. 1995;41:675–679. doi: 10.1007/BF00175826. [DOI] [PubMed] [Google Scholar]
- Grishin NV. Estimation of evolutionary distances from protein spatial structures. J Mol Evol. 1997;45:359–369. doi: 10.1007/pl00006241. [DOI] [PubMed] [Google Scholar]
- Feng DF, Doolittle RF. Converting amino acid alignment scores into measures of evolutionary time: a simulation study of various relationships. J Mol Evol. 1997;44:361–370. doi: 10.1007/pl00006155. [DOI] [PubMed] [Google Scholar]
- Felsenstein J. Inferring phylogenies from protein sequences by parsimony, distance, and likelihood methods. Methods Enzymol. 1996;266:418–427. doi: 10.1016/s0076-6879(96)66026-1. [DOI] [PubMed] [Google Scholar]
- Notredame C, Higgins DG, Heringa J. T-Coffee: A novel method for fast and accurate multiple sequence alignment. J Mol Biol. 2000;302:205–217. doi: 10.1006/jmbi.2000.4042. [DOI] [PubMed] [Google Scholar]
- Fitch WM, Margoliash E. Construction of phylogenetic trees. Science. 1967;155:279–284. doi: 10.1126/science.155.3760.279. [DOI] [PubMed] [Google Scholar]
- Jones DT, Taylor WR, Thornton JM. The rapid generation of mutation data matrices from protein sequences. Comput Appl Biosci. 1992;8:275–282. doi: 10.1093/bioinformatics/8.3.275. [DOI] [PubMed] [Google Scholar]
- Adachi J, Hasegawa M. MOLPHY: Programs for Molecular Phylogenetics Tokyo: Institute of Statistical Mathematics; 1992.
- Kishino H, Miyata T, Hasegawa M. Maximum likelihood inference of protein phylogeny and the origin of chloroplasts. J Mol Evol. 1990;31:151–160. [Google Scholar]
- Robinson DF, Foulds LR. Comparison of phylogenetic trees. Math Biosci. 1981;53:131–147. doi: 10.1016/0025-5564(81)90043-2. [DOI] [Google Scholar]
- Sneath PHA, Sokal RR. Numerical Taxonomy San Francisco: W H Freeman; 1973.