TDP-43 and RNA form amyloid-like myo-granules in regenerating muscle (original) (raw)
. Author manuscript; available in PMC: 2019 Apr 30.
Published in final edited form as: Nature. 2018 Oct 31;563(7732):508–513. doi: 10.1038/s41586-018-0665-2
Summary
A dominant histopathological feature in neuromuscular diseases including amyotrophic lateral sclerosis and inclusion body myopathy is cytoplasmic aggregation of the RNA-binding protein TDP-43. Although rare protein-misfolding mutations in TDP-43 often cause protein aggregation, most patients do not have a TDP-43 mutation suggesting aggregates of wild-type TDP-43 arise by an unknown mechanism. Here we show TDP-43 is an essential protein for normal skeletal muscle formation that unexpectedly forms cytoplasmic, amyloid-like oligomeric assemblies, termed myo-granules, during skeletal muscle regeneration in mice and humans. Myo-granules bind mRNAs encoding sarcomeric proteins and are cleared as myofibers mature. Although myo-granules occur during normal skeletal muscle regeneration, myo-granules can seed TDP-43 amyloid fibrils in vitro, and are increased in a mouse model of inclusion body myopathy. Therefore, heightened assembly or decreased clearance of functionally normal myo-granules could be the source of cytoplasmic TDP-43 aggregates common to neuromuscular disease.
The function and aggregation of the RNA-binding protein, TAR DNA-binding Protein 43 (TDP-43), in multinucleated skeletal muscle cells (myofibers) is of interest for two reasons. First, TDP-43 aggregates accumulate in the skeletal muscle of patients with inclusion body myopathy (IBM), oculopharyngeal muscular dystrophy (OPMD), and distal myopathies1,2. These aggregates appear similar to the cytoplasmic TDP-43 aggregates found in the neurons of patients with amyotrophic lateral sclerosis (ALS) and frontotemporal lobar degeneration (FTLD), suggesting a common mechanism in muscle and neurons leading to histopathological, cytoplasmic TDP-43 aggregation2,3,4. Second, reducing TDP-43 levels leads to age-related muscle weakness in mice5, muscle degeneration and sarcomere disruption in zebrafish6, and age-related muscle weakness in Drosophila wing muscles7,8. Given the requirement for TDP-43 in muscle function, and its potential to form cytoplasmic aggregates in muscle diseases, we examined TDP-43 function during normal mammalian skeletal muscle formation.
Cytoplasmic TDP-43 myo-granules
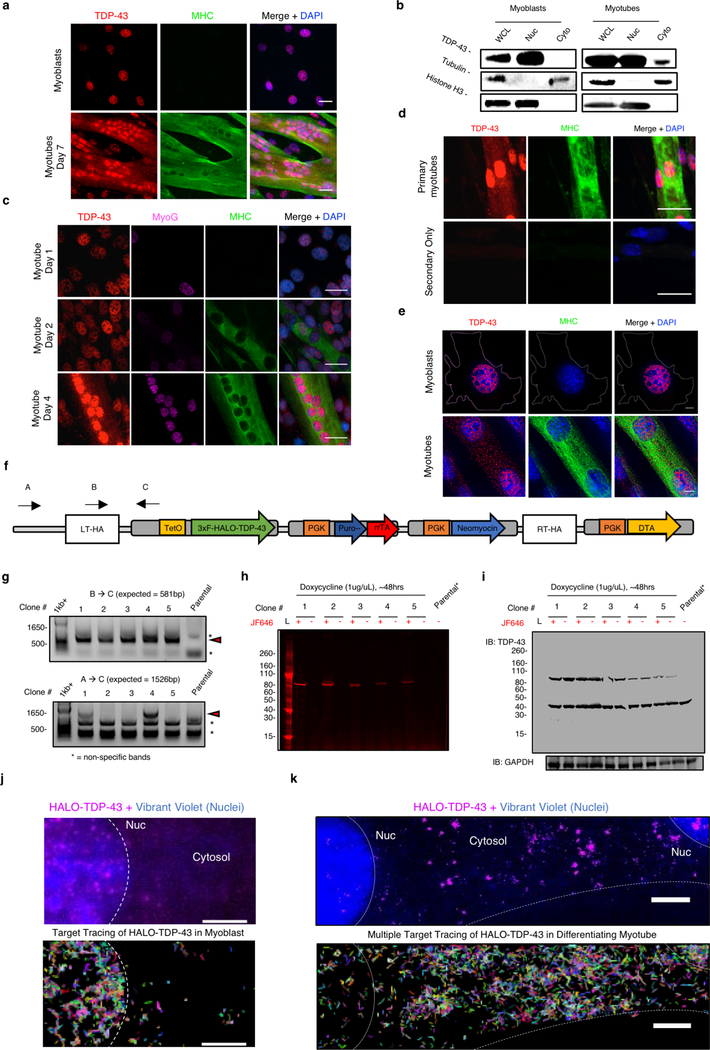
We first examined the subcellular distribution of TDP-43 in cultured skeletal muscle cells and found abundant nuclear TDP-43 in C2C12 myoblasts, a mouse muscle cell line (Extended Data Fig. 1a)9. However, during differentiation of C2C12 myoblasts and isolated primary mouse myoblasts into multinucleated myotubes, we observed an increase in cytoplasmic TDP-43 by immunofluorescence and by subcellular fractionation (Extended Data Fig. 1a–e). Further, live cell single molecule imaging of HALO-tagged TDP-43 revealed increased cytosolic HALO-TDP-43 in differentiating myotubes compared to myoblasts (Extended Data Fig. 1f-S1k, Video 1, 2).
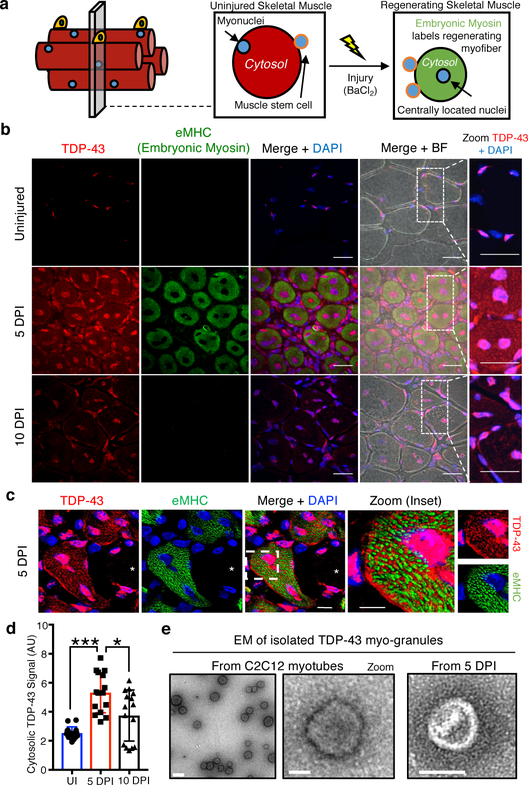
We next examined the subcellular distribution of TDP-43 in uninjured tibialis anterior muscle and tibialis anterior muscle that was chemically injured with barium chloride (BaCl2) and allowed to regenerate (Fig 1a)10, 11. Although we observed primarily nuclear TDP-43 in uninjured muscle, at five days post-injury (dpi) TDP-43 was upregulated and in both the myonuclei and cytoplasm of newly forming myofibers identified by embryonic myosin heavy chain (eMHC) immunoreactivity (Fig. 1b, Extended Data Fig. 2a). Super resolution microscopy reveals TDP-43 is predominately localized to myonuclei in uninjured myofibers, while in regenerating myofibers, cytoplasmic TDP-43 localizes to regions surrounding eMHC (Fig. 1c), which are sites of newly formed sarcomeres12. By 10 dpi, cytosolic TDP-43 levels decline and localize around the centrally-located nuclei, while by 30 dpi, TDP-43 re-localizes to the nucleus (Fig. 1b, d, Extended Data Fig. 2b). Thus, cytosolic TDP-43 increases during skeletal muscle cell formation in culture and in mice.
Fig 1. TDP-43 adopts higher-ordered state during normal skeletal muscle formation.
(a) Schematic for regeneration of skeletal muscle injuries in wild type mice. (b) TDP-43 immunoreactivity following BaCl2-induced tibialis anterior (TA) muscle injury. Embryonic myosin heavy chain (eMHC) in regenerating myofibers with nuclei counterstained with DAPI. Scale bar is 25μm in merged and zoom panels (n = 5 mice per condition providing similar results). (c) Super resolution imaging of TDP-43 immunoreactivity around nascent sarcomeres in the cytoplasm during muscle regeneration. Scale bar is 10μm in merged panels and 5μm in zoom panels. Asterisk identifies an uninjured myofiber lacking eMHC and TDP-43 cytosolic signal. Nuclei are counterstained with DAPI (n=3 biologically independent experiments providing similar results) (d) Quantification of cytoplasmic TDP-43 signal in skeletal muscle myofibers using unpaired two-tailed t-tests for each individual comparison: 5dpi vs UI p-value = 4.36 × 10⁻⁸ (***); 5dpi vs 10dpi p-value = 0.011(*); 10dpi vs UI p-value = 0.015 (not shown) (n=3 biological replicates, n=5 myofibers per replicate). Data are mean ± s.d. (e) Electron microscopy of myo-granules isolated by TDP-43 immunoprecipitation from C2C12 myotubes and from mouse 5dpi TA muscle (n=3 biologically independent experiments providing similar results).
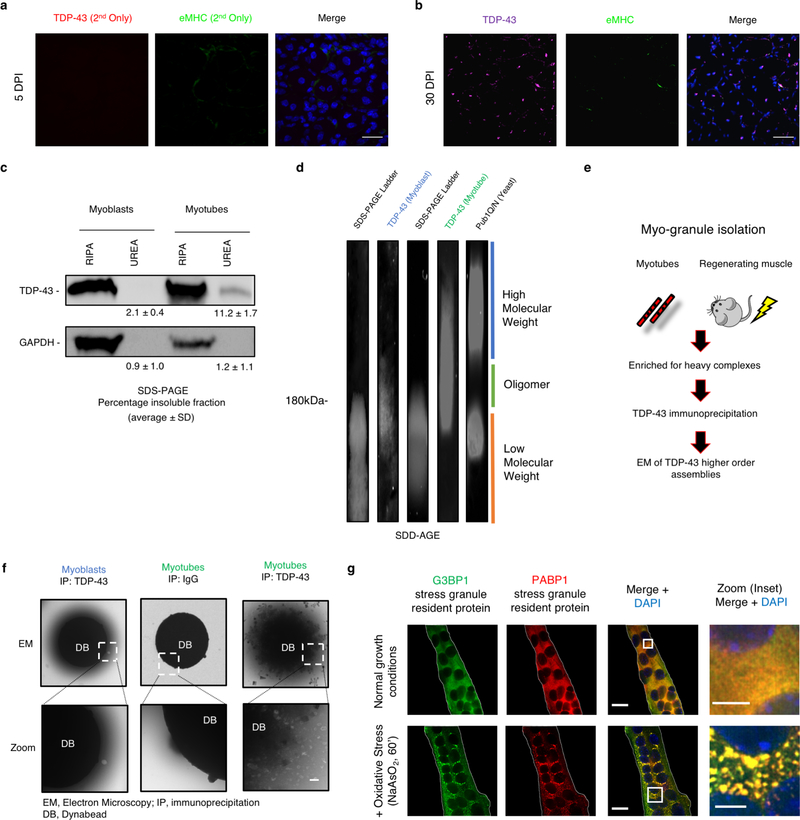
Since cytoplasmic TDP-43 localization is associated with pathological aggregation, we asked if the cytoplasmic TDP-43 identified in skeletal muscle formation adopts a higher order, oligomeric state. We detected an increase in UREA-insoluble TDP-43 in myotubes compared to myoblasts and observed higher molecular weight SDS-resistant TDP-43 assemblies unique to differentiating myotubes by SDD-AGE (Semi-Denaturing Detergent Agarose Gel Electrophoresis) (Extended Data Fig. 2c, d). Further, immunoprecipitation of TDP-43 from myotubes and from tibialis anterior mouse muscle at 5dpi, followed by electron microscopy (EM) reveals the presence of 50–250 nm assemblies that are not detected in undifferentiated myoblasts or in uninjured skeletal muscle (Fig. 1e, Extended Data Fig. 2e, f). The EM structure is similar to previously characterized TDP-43 oligomers, albeit roughly two-fold larger in diameter13. To exclude the possibility that the TDP-43 assemblies in skeletal muscle are stress granules we assayed C2C12 myotubes for the stress granule markers G3BP1 and Pabp1. Stress granules were not present during normal myotube formation (Extended Data Fig. 2g). Thus, during muscle formation, TDP-43 exists as a component of an SDS-resistant oligomeric assembly distinct from stress granules, which we refer to as “myo-granules.”
Myo-granules are amyloid-like assemblies
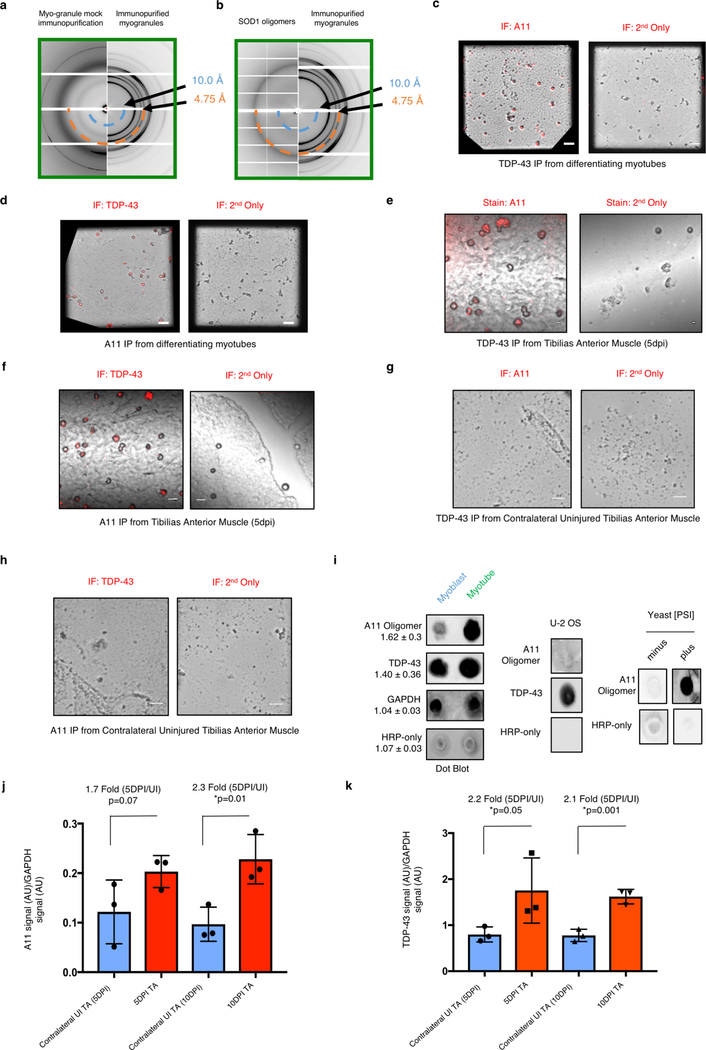
Their SDS-resistance suggests myo-granules have amyloid-like properties, which is supported by two observations. First, X-ray diffraction on lyophilized myo-granules revealed a diffraction pattern with a 4.8 Å reflection, indicating a beta-rich complex that is not observed in control samples. Myo-granules lacked a 10 Å reflection implying a lack of mated cross beta-sheets, similar to previously described amyloid-like oligomers (Fig. 2a, Extended Data Fig. 3a, b)14. Second, immunopurified myo-granules from C2C12 myotubes and regenerating mouse tibialis anterior muscle are also immunoreactive for A11, a conformation specific antibody that recognizes beta-rich structures including amyloid-like oligomers (Extended Data Fig. 3c–h)15.
Fig 2. Myo-granules containing TDP-43 are amyloid-like oligomers.
(a) X-ray diffraction on myo-granules immunoprecipitated from C2C12 myotubes. Two rings at ~4.8 Å (orange) and ~10 Å (blue) are drawn on the bottom half to highlight locations of these reflections. One sample per condition was used. Two diffraction images at different rotations were taken per sample and each image gave similar results. (b) A11 immunoreactivity during TA muscle regeneration and uninjured muscle (n = 4 mice per condition). Regenerating myofibers are immunoreactive for eMHC. Scale bars = 25μm. (c) Quantification of A11 and TDP-43 co-localization and A11 and eMHC co-localization in 5 dpi skeletal muscle. Unpaired two-tailed t-test (***) p-value = 6.3 × 10⁻¹⁷. n = 3 mice, n = 5 myofibers per mouse. Data are mean ± s.d. (d) Representative deconvolution image of A11 and TDP-43 co-localization in 5dpi mouse TA myofibers quantified in (c). Scale bar is 3μm and 1μm (zoomed inset) (n = 3 mice providing similar results).
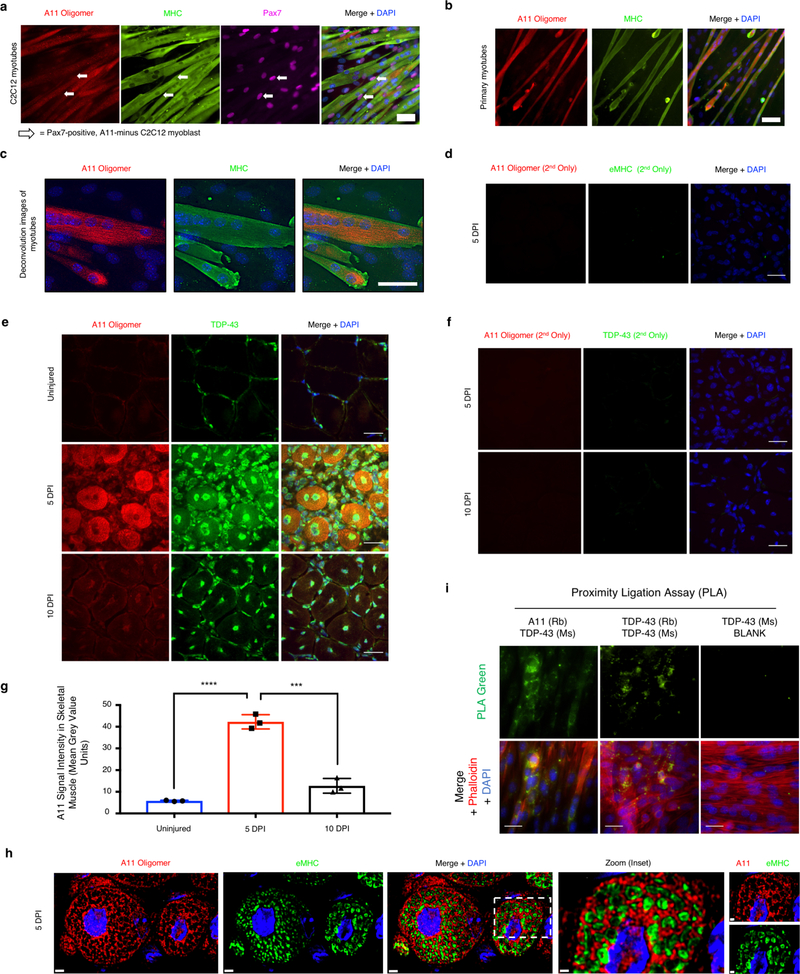
Similar to TDP-43, A11 immunoreactivity increases in myotubes in culture and in regenerating mouse tibialis anterior muscle (Extended Data Fig. 3i–k). In developing myotubes in culture, A11 immunoreactivity is cytoplasmic and correlates with cytoplasmic TDP-43 immunoreactivity (Extended Data Fig.4a–c). During muscle regeneration, A11 immunoreactivity correlates with TDP-43 cytoplasmic immunoreactivity increasing in the cytoplasm at 5dpi but dissipating by 10dpi (Fig. 2b, Extended Data Fig.4d–g). At 5dpi in mice, more than 80% of A11 immunoreactivity is co-localized with cytosolic TDP-43 immunoreactivity (Fig. 2c, d, Extended Data Fig. 4h). Further, cytoplasmic TDP-43 exists as a component of an A11-reactive complex revealed by proximity ligation assays in differentiating C2C12 myotubes (Extended Data Fig. 4i). These observations argue cytoplasmic myo-granules contain TDP-43 in an amyloid-like oligomer conformation during skeletal muscle formation.
Myo-granules contain sarcomeric mRNAs
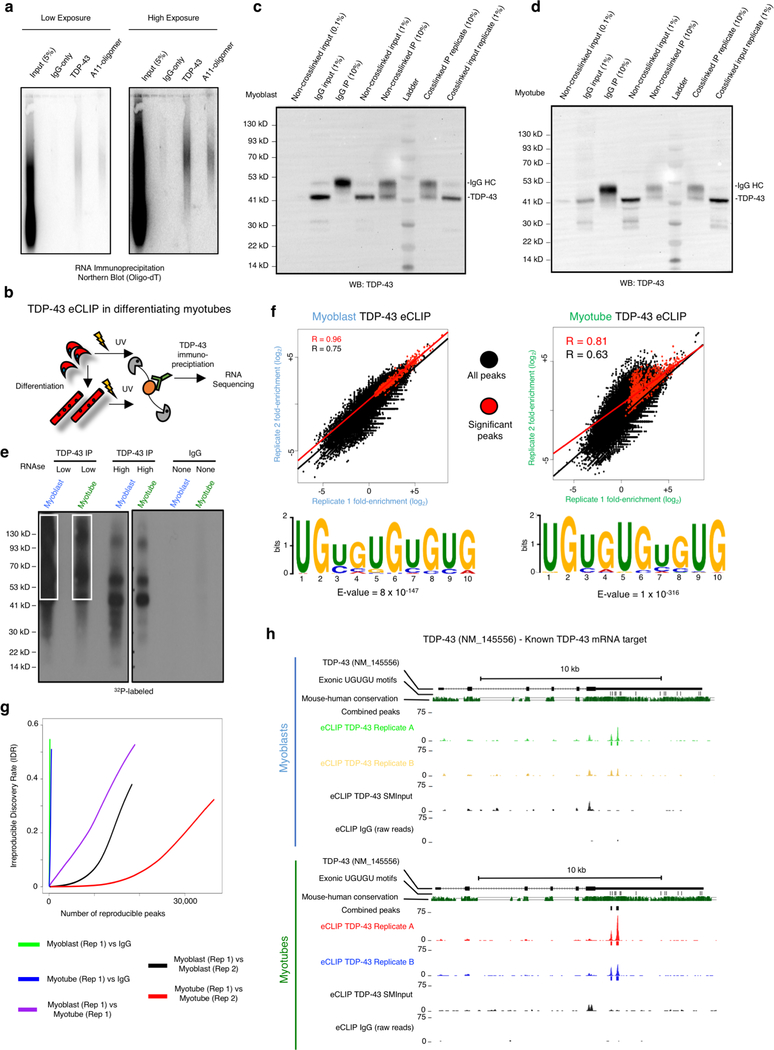
As TDP-43 is an RNA-binding protein, we examined if myo-granules include RNA. Immunoprecipitation of myo-granules with TDP-43 or A11 antibodies followed by oligo-dT Northern blot analysis reveals that TDP-43 and A11 associate with mRNA in myotubes (Extended Data Fig. 5a). To identify the mRNAs bound by TDP-43 during muscle formation, we constructed transcriptome-wide maps of TDP-43 binding sites in undifferentiated myoblasts and in myotubes using eCLIP (enhanced UV crosslinking and immunoprecipitation) (Extended Data Fig. 5b–e)16. We identified a total of 556 binding sites across 174 genes for myoblasts and a total of 975 binding sites across 320 genes for myotubes as significantly enriched over size matched input (SMinput, which reflects all RNA-protein interactions in the input). The binding sites were highly correlated between biological replicates, revealed enrichment for the TDP-43 UG-rich consensus sequence, exhibited thousands of reproducible CLIP clusters by irreproducible discovery rate analysis, and identified known TDP-43 mRNA targets including the 3’ UTR of TDP-43 (Extended Data Fig. 5f–h)17. We also observed that the mRNAs bound to TDP-43 changed significantly during skeletal muscle differentiation (Extended Data Fig. 6a).
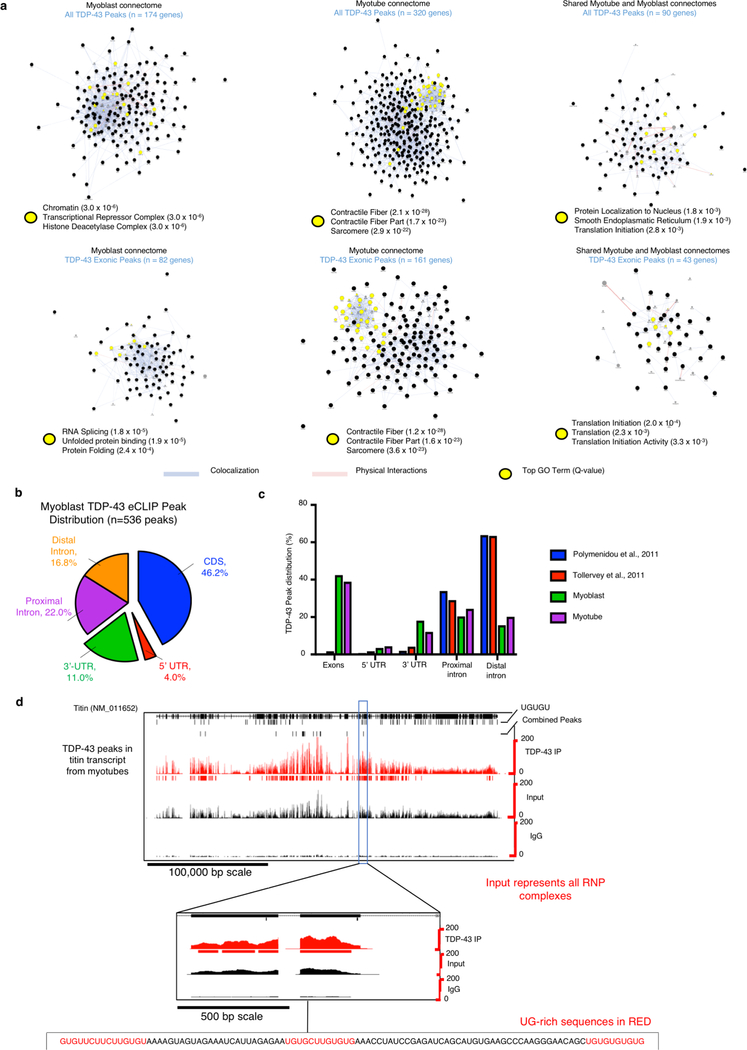
A majority of the TDP-43 binding sites in myoblasts and myotubes are in exons of protein coding transcripts, suggesting TDP-43 may be associating with mature mRNAs (Fig. 3a, Extended Data Fig. 6b, c). In contrast, TDP-43 binding sites in neurons were predominantly mapped to introns18, 19. The difference may reflect cell state, where TDP-43 binds more processed cytoplasmic RNAs in newly forming tissue and more nuclear, intronic RNA in post-mitotic mature cells. Connectome and gene ontology analysis of TDP-43 exonic target transcripts in myotubes, which are likely to constitute interactions with cytoplasmic mRNAs, revealed TDP-43 binds to a network of transcripts associated with the sarcomere (Fig. 3b, Extended Data Fig. 6a). TDP-43 target RNAs identified by eCLIP in myotubes often have multiple TDP-43 exonic binding sites in close proximity19. For example, in the titin mRNA numerous TDP-43 exon binding sites are distributed across the transcript, and within single exons we observed multiple UG-rich stretches with several TDP-43 binding sites (Extended Data Fig. 6d). These observations argue TDP-43 adopts new functionality during myogenesis by binding to structural mRNAs required for skeletal muscle formation, while retaining canonical nuclear functions such as splicing and nuclear cytoplasmic shuttling.
Fig 3. TDP-43 binds select sarcomeric mRNA transcripts during muscle formation.
(a) Distribution of TDP-43 RNA binding identified by eCLIP in C2C12 myotubes (b) TDP-43 eCLIP myotube exonic peaks identified in select sarcomeric mRNA transcripts. All listed genes are found in at least one eCLIP replicate, * = identified in two replicates, red = gene associated with muscle disease. Sarcomere schematic is adapted from38 (c) Single molecule FISH (smFISH) for embryonic myosin heavy chain (Myosin-3) and Troponin C1 (Tnnc1) mRNA co-localized with cytoplasmic and nuclear TDP-43 immunoreactivity in C2C12 myotubes (n=3 biologically independent experiments). (d) SmFISH for Titin mRNA co-localized with both A11 and TDP-43 immunoreactivity in cytoplasm of myosin heavy chain-positive C2C12 myotubes (n=3 biologically independent experiments). Scale bar is 10 μm for merged panels, 0.5 μm for insets for (c, d). (e) Representative images of CRISPR-Cas9 TDP-43 scramble sgRNA (top panel) and TDP-43 knockout sgRNA (bottom panel) C2C12 cells showing TDP-43 immunoreactivity and EdU incorporation. Scale bar is 50μm. Cells counterstained with DAPI (n=3 biologically independent experiments each giving similar results). (f) Quantification of EdU incorporation in TDP-43 knockout (sgTDP-43) and scramble (sgScr) C2C12 cells after 7 days in culture (n = 3 independent experiments). Unpaired two-tailed t-test *** p-value = 0.0007. Data are mean ± s.d. (g) Representative images at 10 dpi regenerating TA muscle reveals reduced myofiber feret diameter in TDP-43 haploinsufficient Pax7iresCre;TDP-43flox/wt mice. Laminin immunoreactivity identifies myofibers and nuclei are counterstained with DAPI. Scale bar is 50 μm (n = 3 mice per condition). (h) Myofiber feret diameter frequency distribution in Pax7iresCre;TDP-43flox/wt mice at 10dpi compared to Pax7iresCre;TDP-43wt/wt controls (> 450 myofibers quantified per condition from n = 3 mice).
To validate that the sarcomeric mRNAs identified by eCLIP bind to cytoplasmic TDP-43 during muscle formation we used single molecule fluorescence in situ hybridization (smFISH). We found that TDP-43 protein co-localizes with mRNAs for myosin-3 and troponin-c in the cytoplasm of myotubes (Fig. 3c). In addition, smFISH for titin mRNA reveals co-localization of both TDP-43 and A11 immunoreactivity with titin mRNA in myotubes (Fig. 3d). These observations demonstrate TDP-43 binds to sarcomeric mRNAs in the cytosol, and can form A11-positive myo-granules in association with those mRNAs, perhaps because of the high local concentration of TDP-43 proteins on a single mRNA molecule19, 20.
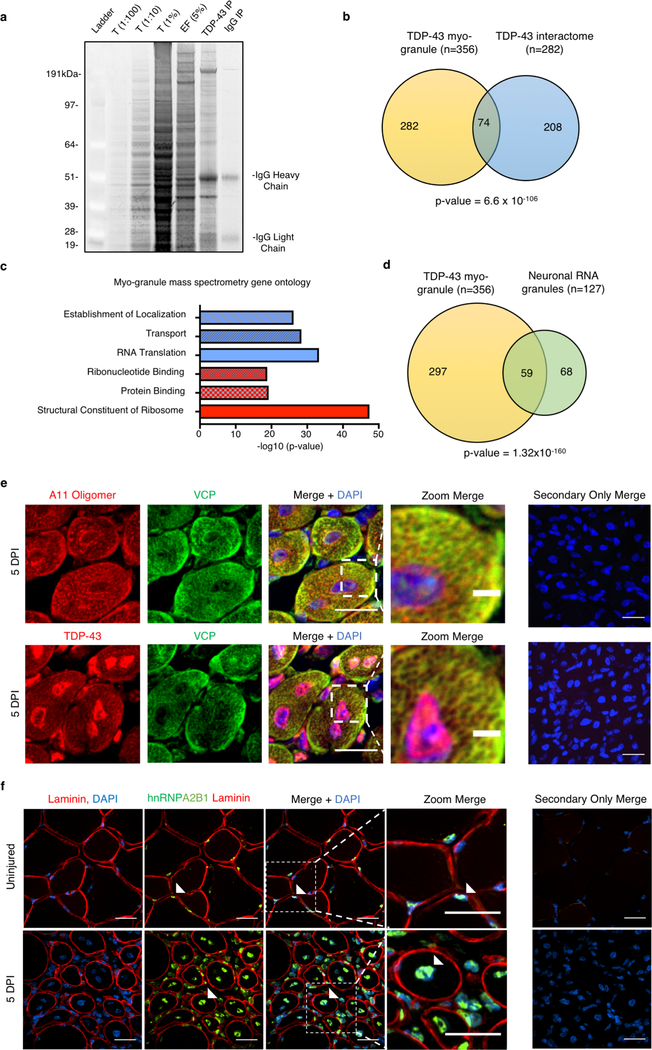
The association of TDP-43 myo-granules with sarcomeric mRNAs during muscle formation is analogous to the role of TDP-43 in forming cytoplasmic neuronal messenger ribonucleoprotein (mRNP) granules for local translation of mRNAs in neurons21. Consistent with this similarity, mass spectrometry of purified myo-granules identified 356 proteins enriched in proteins involved in RNA localization and translation, which overlaps with the TDP-43 interactome22 and the neuronal RNA granule proteome23 (Extended Data Fig.7a–d, Supplementary Table 1, 2). Myo-granules include valosin containing protein (VCP), a protein linked to neuromuscular degeneration24, which we validated by co-localization of VCP with A11 and TDP-43 in the cytoplasm of regenerating muscle (Extended Data Fig. 7e). However, hnRNPA2B1, an RNA-binding protein associated with neuromuscular degeneration25, is not identified in myo-granules and remains nuclear during muscle regeneration (Extended Data Fig. 7f). Therefore, myo-granules associate with a specific set of proteins that may help localize and regulate sarcomeric mRNAs during skeletal muscle formation.
TDP-43 is essential for muscle formation
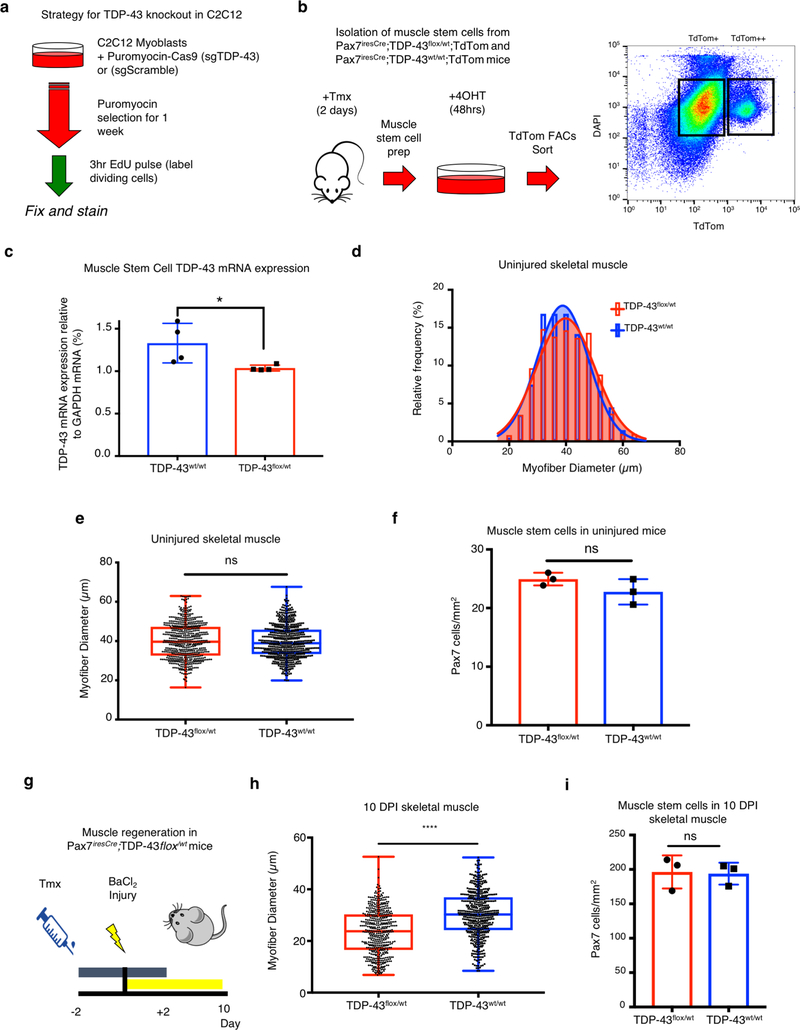
If TDP-43 containing myo-granules are sarcomeric mRNPs, then genetic depletion of TDP-43 may disrupt skeletal muscle myofiber formation. CRISPR-Cas9-mediated deletion of TDP-43 in C2C12 cells arrested growth of C2C12 myoblasts leading to cell death and preventing myoblast differentiation (Fig. 3e, f, Extended Data Fig. 8a). Since TDP-43 appears essential for myoblast proliferation and survival, we asked whether removing one copy of the TDP-43 gene in muscle stem cells using Pax7iresCre recombination impaired muscle regeneration (Extended Data Fig. 8b, c)26, 27. The myofiber size and muscle stem cell number is unaffected when one copy of TDP-43 is deleted from muscle stem cells (Extended Data Fig. 8d–f). However, following injury, mice with one TDP-43 allele in muscle stem cells have significantly smaller myofibers than in wild type mice (Fig. 3g, h, Extended Data Fig. 8g–i). Since there was no detectable change in a muscle stem cell numbers when one TDP-43 allele was deleted, we posit the regeneration defect is in part due to loss of TDP-43 function during myofiber formation. Thus, TDP-43 is essential for skeletal muscle cell differentiation in culture and required for skeletal muscle regeneration.
Myo-granules in humans and disease
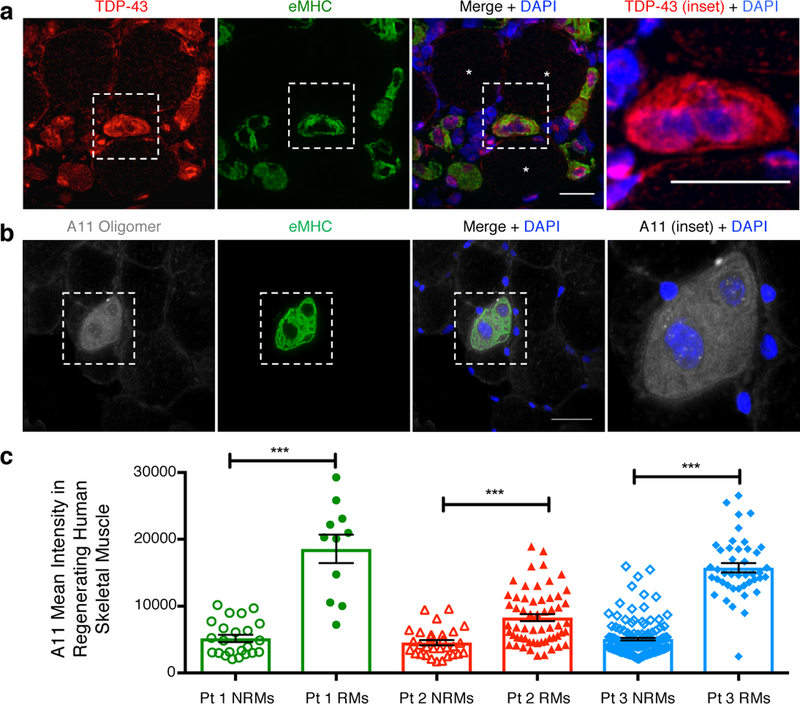
To determine if cytoplasmic TDP-43 and myo-granules are conserved in human muscle regeneration, we examined human muscle biopsies from patients with different clinical and pathological features of necrotizing myopathy. In each patient, we observed increased cytoplasmic TDP-43 and A11 amyloid oligomer staining in the regenerating muscle, suggesting myo-granules form in regenerating human myofibers and are not present in non-regenerating myofibers (Fig. 4, Extended Data Fig. 9a). It is possible that myo-granules formed during normal regeneration may seed the aggregates seen in human muscle diseases.
Fig. 4. Myo-granules form during human muscle regeneration.
(a) Representative image of cytoplasmic TDP-43 in regenerating human skeletal muscle from patient with necrotizing myopathy (n = 3 individual patient skeletal muscle biopsies gave similar results). Scale bar is 50μm. (b) Representative image of A11 immunoreactivity in regenerating human skeletal muscle from patient with necrotizing myopathy (n = 3 individual patient skeletal muscle biopsies gave similar results). Scale bar is 100μm. (c) Quantification of A11 immunoreactive intensity in regenerating myofibers (RM = eMHC+) compared to non-regenerating myofibers (NRMs = eMHC-) from three patients (Pt) with necrotizing myopathy. Unpaired two-tailed t-test used for each individual comparison: For Pt 1 NRMs (n = 23) vs RMs (n = 11) *** p-value = 2.54 × 10⁻⁹; For Pt 2 NRMs (n = 31) vs RMs (n = 59) *** p-value = 7.89 × 10⁻⁶; For Pt 3 NRMs (n = 146) vs RMs (n = 44) *** p-value = 6.17 × 10−49. Data are mean ± s.e.m.
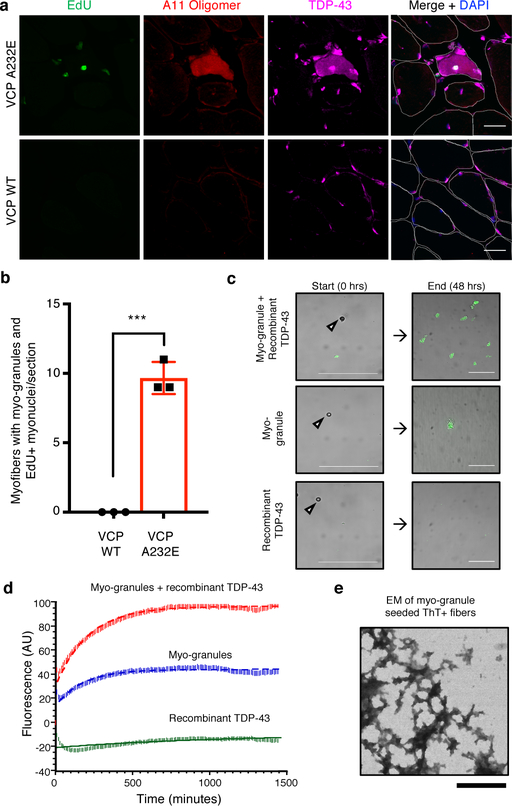
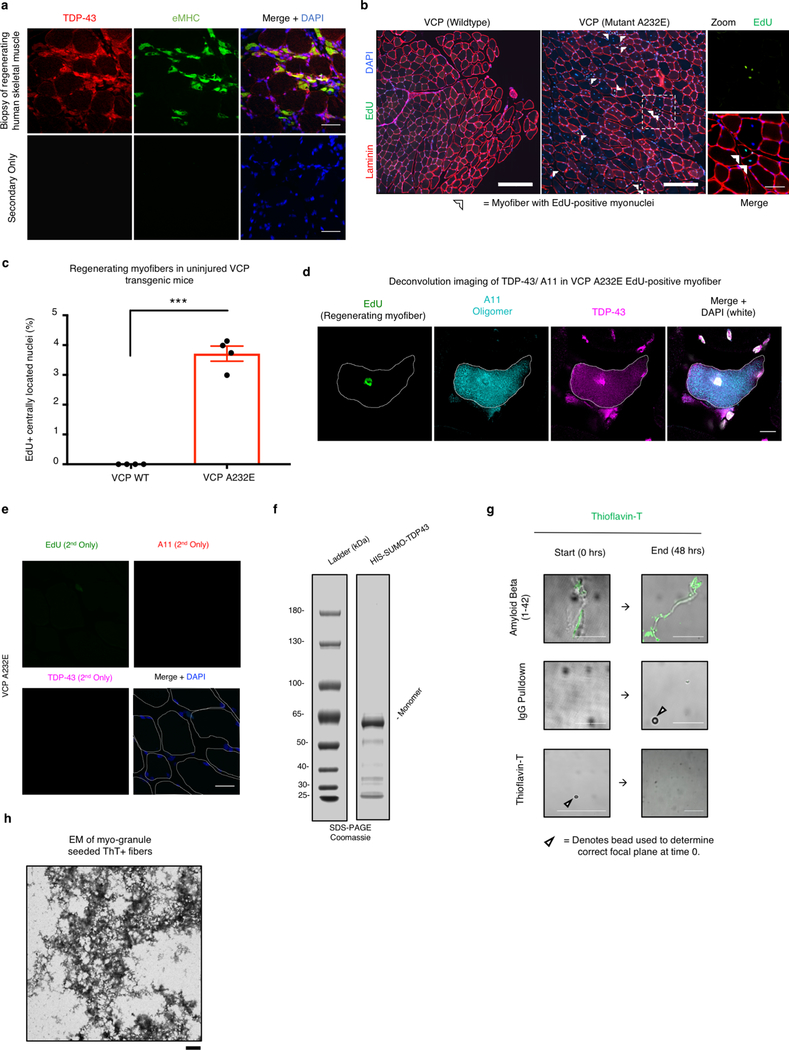
Since myo-granules containing TDP-43 form during human skeletal muscle regeneration and TDP-43 aggregates are found in skeletal muscle diseases, then the increased regeneration occurring in diseases may promote TDP-43 aggregation. Indeed, cytoplasmic TDP-43 aggregates in skeletal muscle diseases are often seen in myofibers with centrally-located nuclei, a hallmark of regeneration1, 28. Therefore, we tested whether cytoplasmic myo-granules accumulate in newly regenerated myofibers of VCP mutant mice, a model of multisystem proteinopathy (MSP) and IBM characterized by TDP-43 aggregation29. When uninjured VCP mutant and wild-type mice were treated with 5-ethynyl-2’-deoxyuridine (EdU), which identifies actively regenerating myofibers containing newly fused nuclei arising from muscle stem cells, VCP mutant mice possessed more EdU+ centrally-located myonuclei compared to VCP wildtype mice (Extended Data Fig. 9b, c). Moreover, in the myofibers with EdU+ centrally-located nuclei, we detect increased cytoplasmic TDP-43 and A11 amyloid oligomer staining, correlating the cytoplasmic TDP-43 aggregation with increased muscle regeneration in VCP mutant mice (Fig. 5a, b, Extended Data Fig. 9d, e).
Fig 5. Myo-granules are increased in VCP disease and are capable of seeding amyloid-like fibers.
(a) Uninjured VCP A232E TA muscle (top panel) and uninjured VCP wild type (WT) TA muscle (bottom panel) probed for EdU incorporation into centrally-located nuclei and immunostained for A11 and TDP-43. Cells counterstained with DAPI and myofibers outlined in white. Scale bar is 25μm. (b) Quantification of myofibers with EdU+ centrally-located myonuclei, A11 immunoreactivity and cytoplasmic TDP-43 in VCP A232E and VCP WT mice. Unpaired two-tailed t-test p-value = 1.3 × 10⁻⁴ (n = 3 mice, 1 tibialis anterior cross section quantified per mouse). Data are mean ± s.d. (c) Representative images of purified myo-granules from C2C12 myotubes incubated with or without recombinant TDP-43 and Thioflavin-T (ThioT) reveals formation of higher order ThioT-positive amyloid-like fibers. Scale bar is 25 μm (n=3 biologically independent experiments). (d) Plot of kinetics for fiber aggregation determined by ThioT incorporation measured in 10-minute intervals. Rates derived by fitting time points to single exponential rate equation: Myo-granule + recombinant TDP-43 R2 = 0.96; kobs × 10−4 (min−1) = 47 ± 1.6; Myo-granule R2 = 0.92; kobs × 10−4 (min−1) = 56 ± 2.9; Recombinant TDP-43 R2 = 0.47; kobs × 10−4 (min−1) = 8.5 ± 4.9) (n=3 biologically independent experiments, background corrected arbitrary units, AU). (e) Representative transmission electron microscopy images of ThioT-positive fibers formed from isolated myo-granules (n=3 biologically independent experiments). Scale bar is 1μm.
Consistent with the hypothesis that myo-granules may seed the aggregates seen in disease, myo-granules isolated from C2C12 myotubes were capable of transitioning to a Thioflavin-T (ThioT)-positive aggregate (amyloid-like fibers) over time (Fig. 5c, d). Moreover, addition of recombinant TDP-43 to isolated myo-granules increased the amount of ThioT-positive aggregates formed without affecting their initial rate of assembly (Fig. 5c, d, Extended Data Fig. 9f, g). Electron microscopy of ThioT-positive TDP-43 aggregates formed from myo-granules reveals fibrous structures morphologically similar to previously reported TDP-43 amyloid fibers (Fig. 5e)30. This suggests that the failure to dissipate myo-granules during normal muscle formation may seed the formation of cytoplasmic TDP-43 aggregates in diseased muscle. Whether the oligomerization of TDP-43 in myo-granules involves its N-terminal oligomerization domain20, the C-terminal prion-like domain that is prone to aggregation and fiber formation31, 32, or both, remains to be established.
Discussion
We uncover two important properties of TDP-43 in the formation of skeletal muscle. First, TDP-43 is an essential protein that associates with select sarcomeric mRNAs and localizes to sites of newly forming sarcomeres during skeletal muscle formation. Second, TDP-43 is a component of a higher order, amyloid-like myo-granule assembled during normal skeletal muscle formation. Purified myo-granules from cultured myotubes are capable of seeding amyloid-like fibrils in vitro suggesting a link between the normal biological functions of TDP-43 and pathological TDP-43 aggregates.
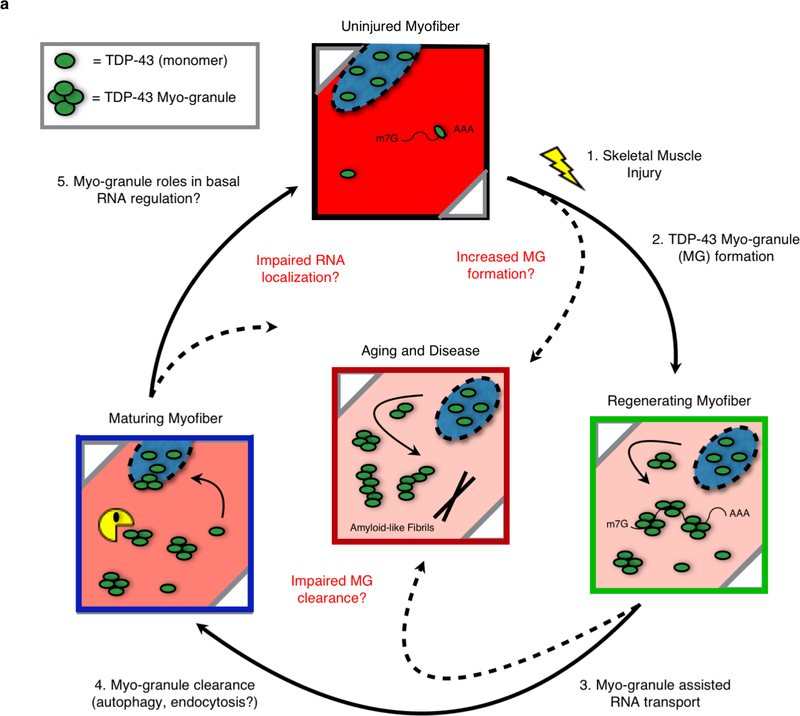
We propose a model whereby myo-granules containing TDP-43 are increased in damaged tissues with elevated regeneration, thereby enhancing the possibility of amyloid fiber formation and/or aggregation of TDP-43 in disease (Extended Data Fig. 10). Since the triggering event in this model is elevated muscle regeneration, it explains why TDP-43 aggregates occur in genetically diverse diseases including IBM28, which can be caused by mutations in the ubiquitin segregase VCP29, OPMD, caused by Ala expansions in PABPN11, and DMRV, caused by mutations in the UDP-N-acetylglucosamine 2-epimerase gene (GNE)33. Moreover, the seeding of TDP-43 aggregates by TDP-43 oligomers may also occur in neurons since reversible cytoplasmic TDP-43 accumulation occurs in models of acute neuronal injury in vivo (e.g. axotomy or traumatic brain injury)34, 35. TDP-43 aggregates are also frequently observed on autopsy in neurologically normal elderly individuals36. The age-dependent accumulation of TDP-43 aggregates may be caused by a failure to clear TDP-43, or other amyloid-like assemblies that formed during tissue repair. Over a lifetime, failures in proteostatic control mechanisms, including autophagy or endocytosis37, could increase the likelihood that functional, amyloid-like assemblies transition into pathological aggregates.
Methods
Mice
Mice were bred and housed according to National Institutes of Health (NIH) guidelines for the ethical treatment of animals in a pathogen-free facility at the University of Colorado at Boulder (Wild-type, Pax7iresCre, TDP-43flox/flox and VCP-A232E lines). The University of Colorado Institutional Animal Care and Use Committee (IACUC) approved all animal protocols and procedures and studies complied with all ethical regulations. Wild-type mice were C57Bl/6 (Jackson Labs, ME, USA) and VCP-A232E, VCP-WT29, and TDP-43flox/flox mice26 were previously described. Crossing mice into Pax7iresCre mice27 generated conditional TDP-43flox/WT mice. Cells and tibialis anterior (TA) muscles were isolated from 3–6-month-old male and female wild-type and Pax7iresCre; TDP-43flox/WT mice. TA or gastrocnemius muscles were isolated from 9-month-old male VCP-A232E mice. Control mice were randomly assigned against age and sex matched from the mice and crosses described above. Sample sizes were set at n = 3 unless otherwise noted.
Mouse Injuries and Tamoxifen injections
Mice at 3–6 months old were anesthetized with isofluorane and the left TA muscle was injected with 50μL of 1.2% BaCl2 and then the injured and contralateral TA muscles were harvested at the indicated time points. Intraperitoneal (IP) administration of tamoxifen (Sigma), re-suspended in sterile corn oil (Sigma), was given to 3–6-month-old mice at a volume of 0.075mg of tamoxifen per gram of mouse weight. Muscle injuries were blinded against genotype.
Human Muscle Biopsy Tissue
Under an IRB-approved protocol at Johns Hopkins University and complying with all ethical regulations, a clinical muscle biopsy database was searched for patients who were clinically diagnosed with rhabodmyolysis and/or pathologically diagnosed with necrotizing myopathy with evidence of myofiber regeneration. Informed consent was obtained for all study participants. Patient muscle tissue leftover from diagnostic biopsy was stored frozen at −80 C for less than two years, and samples were cryo-sectioned for immunohistochemical analysis.
Immunofluorescence staining of tissue sections
TA or gastrocnemius muscles were dissected, fixed on ice for 2hrs with 4% paraformaldehyde, and then transferred to PBS with 30% sucrose at 4°C overnight. Muscle was mounted in O.C.T. (Tissue-Tek®) and cryo-sectioning was performed on a Leica cryostat to generate 10μm thick sections. Tissues and sections were stored at −80°C until staining. Tissue sections were post-fixed in 4% paraformaldehyde for 10 minutes at room temperature (RT) and washed three times for 5 min in PBS. Immunostaining with anti-Pax7, anti-Laminin, anti-eMHC, anti-TDP-43 and A11 antibodies required heat-induced epitope retrieval where post-fixed slides were placed in citrate buffer, pH 6.0, and subjected to 6 min of high pressure-cooking in a Cuisinart model CPC-600 pressure cooker. For immunostaining, tissue sections were permeabilized with 0.25% Triton-X100 (Sigma) in PBS containing 2% bovine serum albumin (Sigma) for 60 min at RT. Incubation with primary antibody occurred at 4°C overnight followed by incubation with secondary antibody at room temperature (RT) for 1hr. Primary antibodies included mouse anti-Pax7 (Developmental Studies Hybridoma Bank, University of Iowa, USA) at 1:750, rabbit anti-laminin (Sigma-Aldrich) at 1:200, rabbit anti-TDP-43 (ProteinTech) at 1:200, mouse anti-TDP-43 (Abcam) at 1:200, rabbit A11 (Sigma-Aldrich) at 1:200, mouse anti-VCP (ThermoFisher Scientific) at 1:400 and a mouse anti-eMHC (Developmental Studies Hybridoma Bank, University of Iowa, USA) at 1:5. Alexa secondary antibodies (Molecular Probes) were used at a 1:1000 dilution. For analysis that included EdU detection, EdU staining was completed prior to antibody staining using the Click-iT EdU Alexa fluor 488 detection kit (Molecular Probes) following manufacturer protocols. Sections were incubated with 1 μg/mL DAPI for 10 min at room temperature then mounted in Mowiol supplemented with DABCO (Sigma-Aldrich) or ProLong Gold (Thermo) as an anti-fade agent.
Isolation of Primary Muscle Stem Cells
Gastrocnemius, extensor digitorum longus (EDL), TA and all other lower hindlimb muscles were dissected from wild-type mice. The muscle groups from both hind limbs were separated and digested in 3.6mL of F12-C (Gibco) with penicillin/streptavidin (Gibco) and 400uL 10× collagenase (Worthington) for 90 minutes at 37°C on a slow rotisserie. In a biosafety cabinet, muscles were settled for 5 minutes, undisturbed, and then as much of the liquid was removed without disturbing the muscle groups. F12-C with penicillin/streptavidin and 15% horse serum was added and the muscles rocked for 1 minute. Then, 3mL of growth media was added to each tube (F12-C with penicillin/streptavidin, 15% horse serum (Gibco), 20% fetal bovine serum (Sigma), 1% Chick Embryo Extract (Antibody Production Services Ltd.). The digest was poured onto a (Corning) 10cm tissue culture plate with Matrigel in 10mL of growth media. Growth media was added as necessary to keep the muscle chunks submerged. Muscles chunks were incubated in growth media with FGF-2 (50nM working concentration) for 72 hours at 37°C in 6% O2, 5% CO2. After 72 hours, muscle stem cells have migrated out onto the Matrigel and the muscle chunks and media were removed. The plate containing attached muscle stem cells was rinsed with sterile PBS and 10mL warm growth media added supplemented with 50nM FGF-2. Colonies of myoblasts formed by 4 days of culture and were expanded by passaging with 0.25% Trypsin-EDTA (Sigma).
Cell culture.
Primary Muscle Stem Cells: After initial isolation, primary myoblasts were maintained on Matrigel-coated tissue culture plastic plates or gelatin-coated coverslips at 37°C with 6% O2, 5% CO2 in growth media as described above. Media was changed only during cell passaging. To promote myoblast fusion, cells at 75% confluency were washed three times with PBS and media switched to DMEM (Gibco) with 5% horse serum (Gibco), 1% penicillin/streptavidin and 1% Insulin-Transferrin-Selenium (Gibco). To induce stress granule formation, primary myotubes were stressed with 0.5mM sodium arsenite for 1hr at 37°C.
C2C12 cells: Immortalized murine myoblasts (American Type Culture Collection) were maintained on uncoated standard tissue culture plastic or gelatin-coated coverslips at 37°C with 5% CO2 in DMEM with 20% fetal bovine serum and 1% penicillin/streptavidin. To promote myoblast fusion when the C2C12 cells reached confluence, they were switched to 5% horse serum, 1% penicillin/streptavidin and 1% Insulin-Transferrin-Selenium in DMEM. To induce stress granule formation, C2C12 myotubes were stressed with 0.5mM sodium arsenite for 1hr at 37°C.
U-2 OS: Human osteosarcoma cells were maintained in DMEM, High Glucose, GlutaMAX with 10% fetal bovine serum, 1% penicillin/streptomycin, and 1mM sodium pyruvate at 37°C/5% CO2.
Yeast: For the experiments presented in Fig 1, BY4741 yeast was transformed with a single plasmid expressing Pub1Q/N-GFP (pRP1689) were grown at 30°C in minimal media with 2% glucose as a carbon source and with leucine dropout to maintain the plasmid. For experiments presented in Fig S3, SUP35 [PSI+] (5V-H19A) and SUP35 [psi-] (yAV831) stains were grown in minimal media supplemented with a complete set of amino acids and 2% Dextrose at 30°C.
Immunofluorescence Staining of Cells and Proximity Ligation Assay
Primary and immortalized cells were washed with PBS in a laminar flow hood and fixed with 4% Paraformaldehyde for 10 min at room temperature in a chemical hood. Cells were permeabilized with 0.25% Triton-X100 in PBS containing 2% bovine serum albumin (Sigma) for 1 hour at RT. Incubation with primary antibody occurred at 4°C overnight followed by incubation with secondary antibody at room temperature for 1hr. Primary antibodies included mouse anti-Pax7 (Developmental Studies Hybridoma Bank, University of Iowa, USA) at 1:750, rabbit anti-TDP-43 (ProteinTech) at 1:200, mouse anti-TDP-43 (Abcam) at 1:200, rabbit A11 (Sigma-Aldrich) at 1:200, and a mouse anti-MHC (MF-20, Developmental Studies Hybridoma Bank, University of Iowa, USA) at 1:1. Alexa secondary antibodies (Molecular Probes) were used at a 1:1000 dilution. All antibodies were diluted in with 0.125% Triton-X100 in PBS containing 2% bovine serum albumin. For analysis that included EdU detection, EdU staining was completed prior to antibody staining using the Click-iT EdU Alexa fluor 488 detection kit (Molecular Probes) following the manufacturer’s protocol. Cells were incubated with 6.6mM Phalloidin (Thermo Scientific) for 20 minutes and/or 1 μg/mL DAPI for 10 min at room temperature then mounted in Mowiol supplemented with DABCO (Sigma-Aldrich) as an anti-fade agent.
For the proximity ligation assay, samples were incubated with indicated antibodies at the concentrations listed above. Secondary antibody incubation and Duolink proximity ligation assays were performed according to the manufacturer’s protocol (Sigma).
Subcellular fractionation
Nuclear/cytosolic fractionation was performed to determine localization of soluble TDP-43 in C2C12 myoblasts and differentiating myotubes. In brief, myoblasts or differentiating myotubes (day 4) were trypsinized, washed with phosphate-buffered solution (PBS), and pelleted by centrifugation at 1000×g, 5 min. Cells were subsequently washed in PBS and divided into a whole lysate fraction (WCL, 1/3 total) or a cytosolic/nuclear fraction (Cyto/Nuc, 2/3 total). Both cellular fractions were pelleted by centrifugation at 1000×g, 5 mi. The WCL fraction was suspended into RIPA buffer [50 mM Tris pH 7.5, 1% NP-40, 0.5% sodium deoxycholate, 0.05% SDS, 1 mM EDTA, 150 mM NaCl, protease inhibitors (Roche)] and placed on ice. The Cyto/Nuc fraction was suspended in a hypotonic lysis buffer [10mM Tris HCL 7.5, 10mM NaCl, 3mM MgCl2, 0.5% NP40, protease inhibitors (Roche)] and placed on ice for 4 minutes. Nuclei were then pelleted by centrifugation at 500×g for 5 minutes. The supernatant [cytosolic fraction (Cyto)] was removed. The pellet [nuclear fraction] was then suspended in nuclear lysis buffer [50mM Tris HCL 7.4, 120mM NaCl, 1% SDS, 1mM EDTA, 50mM DTT, protease inhibitors (Roche)]. Nuclei were lysed with 5 passages through an 18G needle. Cellular debris was cleared from collected fractions with centrifugation at 1000×g, 5min. Equal volumes (20uL) of fractions were then resolved on a 4–12% Bis-Tris SDS-PAGE and transferred to nitrocellulose membrane (Bio-Rad). Western blotting was performed according to standard procedures.
Single Molecule Imaging of endogenous HALO-TDP-43
A tetracycline inducible HALO-Tagged (Promega) TDP-43 fusion protein was knocked into the ROSA26 safe harbor locus using CRISPR/Cas940. Knock-in cells were selected using puromyocin and proper genomic integration was confirmed by PCR and western blotting. For live cell single molecule imaging studies, puromyocin-resistant myoblasts or differentiating myotubes were grown on collagen treated, 35mm imaging dishes (MatTek). HALO-TDP-43 was induced for 48hrs using doxycycline (1 μg/mL). HALO-TDP-43 molecules were labeled with 50pM JF646 dye (a generous gift from Luke Lavis) for 15 minutes in culture media41. After the pulse, cells were washed three times with media and incubated with Vibrant Violet (1:400) containing media to visualize myonuclei for at least 1 hour prior to image acquisition. All single molecule live imaging was performed under HILO conditions (highly inclined and laminated optical sheet) on a Nikon N-STORM microscope equipped with TIRF illuminator, an environmental chamber, two iXon Ultra 897 EMCCD cameras (Andor), a 100× oil-immersion objective (Nikon, NA = 1.49), two filter wheels, appropriate filter sets, and 405 nm (20mW), 488 nm (50 mW), 561 nm (50 mW), and 647 nm (125 mW) laser lines. Differentiating myotubes were identified by visualizing fused myonuclei with 405nm laser line (1% laser power). To image HALO-TDP-43, cells were imaged continuously with 647nm (40% laser power) for 15s at an effective frame rate of 100 frames per s. Single particle tracks were generated using Matlab.
Biochemical characterization of TDP-43 during myogenesis
For RIPA/urea solubility assays C2C12 myoblasts and myotubes were lysed with RIPA buffer (50 mM Tris pH 7.5, 1% NP-40, 0.5% sodium deoxycholate, 0.05% SDS, 1 mM EDTA, 150 mM NaCl). Protein concentrations were determined using BCA assay (Thermo Scientific) according to standard procedures. Lysates were centrifuged at 18,000 × g for 20 minutes at 4°C. The supernatant represented the RIPA soluble fraction while the pellet was solubilized in 7M Urea in TBE and represents the UREA soluble fraction. Western blotting was performed following resolution of protein lysates on SDS-PAGE.
Semi-Denaturating Detergent Agarose Gel Electrophoresis (SDD-AGE) was conducted as previous described42. In brief, C2C12 myoblasts and myotubes were lysed with RIPA buffer, protein concentrations were standardized using BCA assay, diluted to 1× in loading buffer (2× TAE, 20% glycerol, 8% SDS, bromophenol blue) and separated across a 1.5% agarose gel containing 0.1% SDS. Gels were transferred by capillary transfer overnight to nitrocellulose in TBS. Standard western blotting procedures were performed.
Fractionation of TDP-43 oligomers across sucrose gradients (10–35%). Fractions were collected and equal volume was loaded for SDD-AGE analysis. Immunoprecipitation followed by scanning electron microscopy of TDP-43 SDS-resistant fraction was performed as below.
Dot blots on C2C12 protein lysates or whole muscle lysates were conducted according to standard procedures43. Both C2C12 cells and whole muscle were lysed in RIPA buffer, protein concentrations were normalized using BCA and were spotted onto nitrocellulose membranes.
Isolation of myo-granules
A protocol for isolating myo-granules from myotubes was modified from existing protocols for isolating heavy RNP complexes44. In brief, myotubes or whole TA muscle were lysed under non-denaturing conditions using CHAPS lysis buffer (10 mM Tris-HCl pH 7.5, 1 mM MgCl2, 1 mM EGTA, 0.5% CHAPS, 10% glycerol, 1 mM PMSF, 1 mM DTT) or RIPA buffer and spun to remove heavy cellular debris (250×g, 5 minutes). Successive centrifugation was used to enrich for heavy complexes (18,000×g, 20 minutes). The pellet was resuspended into immunoprecipitation buffer (10mM Tris HCL 7.5; 25mM NaCl; 0.005% NP40) to create an “myo-granule enriched fraction”. The enriched fraction was precleared for 30 minutes with immunoprecipitation buffer equilibrated dynabeads and then incubated overnight with antibodies against either TDP-43 (Proteintech) or A11 (Thermo Scientific). Myo-granules were immunopurified on equilibrated dynabeads, washed in immunoprecipitation buffer, and eluted using Pierce Gentle Ag/Ab Buffer (Thermo Scientific) as previously described43. Buffer was exchanged using a 10K MW spin column (Millipore Amicon).
RNA extraction and oligo-dT Northern analysis of myo-granules
RNA was isolated from myo-granules bound to dynabeads by Trizol extraction followed by ethanol precipitation. RNA was run on a 1.25% formaldehyde agarose gel, transferred to nitrocellulose membrane and hybridized with a αP32 labeled oligo-dT probe at room temperature overnight. Membrane was exposed on phosphorimager screen either for 1 hour (low exposure) or overnight (high exposure) and imaged on a Typhoon FLA 9500 phosphorimager.
Electron Microscopy
Electron microscopy sample preparation and image acquisition was performed as previously described unless otherwise specified45. For experiments wherein immunofluorence on EM grids was performed, Carbon type B 300 mesh Copper TEM grids (Ted Pella) were Poly-Lysine (Sigma) treated for 30 minutes, washed three times in phosphate buffered saline (PBS), and immunopurified myo-granules (diluted 1:50) were adhered to grid for 1 hour at room temperature. TEM grids with myo-granules were blocked in 3% bovine serum albumin (BSA) for 1 hour at room temperature. Primary antibody incubation was performed at 1:100 dilution in 3% BSA for 1 hour at room temperature. Grids were then washed three times in PBS and incubated with secondary antibodies at 1:250 dilution in 3% BSA. Secondary only controls were performed at the same concentration without addition of primary antibody. Grids were washed three times with PBS and placed onto microscopy slides. Images were acquired using a DeltaVision Elite microscope with a 100× objective. Grids were stained with uranyl actetate and immunopositive myo-granules were examined by TEM.
Myo-granule Electron Diffraction
Lyophilized myo-granules and SOD1 segment oligomers (prepared as in14) were mounted for diffraction by dipping a nylon loop in glycerol and sticking some of the lyophilized sample to the glycerol46. Samples were carefully aligned to avoid the nylon loop entering the X-ray beam when diffraction images were taken. All samples were shot at the Advanced Photon Source (Argonne National Laboratory, Lemont, IL) beamline 24-E with a 50-micron aperture. Samples were rotated 5 degrees over a 4 second exposure at 295K and images analyzed with ADXV.
TDP-43 eCLIP-seq
C2C12 myoblasts were seeded at 6 × 10⁶ cells per 15 cm plate, grown 24hrs at 37°C, 5% CO2 and either harvested (undifferentiated myoblasts) or differentiated in differentiation media for 7 days. TDP-43 enhanced CLIP (eCLIP) was performed according to established protocols16.
In brief, TDP-43-RNA interactions were stabilized with UV crosslinking (254 nm, 150mJ/cm2). Cell pellets were collected and snap frozen in liquid N2. Cells were thawed, lysed in eCLIP lysis buffer (50 mM Tris-HCl pH 7.4, 100 mM NaCl, 1% NP-40, 0.1% SDS, 0.5% sodium deoxycholate, and 1× protease inhibitor) and sonicated (Bioruptor). Lysate was RNAse I (Ambion, 1:25) treated to fragment RNA. Protein-RNA complexes were immunoprecipitated using indicated antibody. One size-matched input (SMInput) library was generated per biological replicate using an identical procedure without immunoprecipitation. Stringent washes were performed as described, RNA was dephosphylated (FastAP, Fermentas), T4 PNK (NEB), and a 3’ end RNA adaptor was ligated with T4 RNA ligase (NEB). Protein-RNA complexes were resolved on an SDS-PAGE gel, transferred to nitrocellulose membranes, and RNA was extracted from membrane. After RNA precipitation, RNA was reverse transcribed using SuperScript IV (Thermo Fisher Scientific), free primer was removed, and a 3’ DNA adapter was ligated onto cDNA products with T4 RNA ligase (NEB). Libraries were PCR amplified and dual-indexed (Illumina TruSeq HT). Pair-end sequencing was performed on Illumina NextSeq sequencer.
Bioinformatics and Statistical analysis
Read processing and cluster analysis for TDP-43 eCLIP was performed as previously described16. Read processing and cluster analysis for TDP-43 eCLIP was performed as previously described. Briefly, 3’ barcodes and adapter sequences were removed using standard eCLIP scripts. Reads were trimmed, filtered for repetitive elements, and aligned to the mm9 reference sequence using STAR. PCR duplicate reads were removed based on the read start positions and randomer sequence. Bigwig files for genome browser display were generated based on the location of the second of the paired end reads. Peaks were identified using the encode_branch version of CLIPPER using the parameter “-s mm9.” Peaks were normalized against size matched input by calculating fold enrichment of reads in IP versus input, and were designated as significant if the number of reads in the IP sample was greater than in the input sample, with a Bonferroni corrected Fisher exact p-value less than 10–8.
Microscopy and image analyses
Images were captured on a Nikon inverted spinning disk confocal microscope or a DeltaVision Elite microscope. Objectives used on the Nikon were: 10×/o.45NA Plan Apo, 20×/0.75NA Plan Apo and 40×/0.95 Plan Apo. Confocal stacks were projected as maximum intensity images for each channel and merged into a single image. Brightness and contrast were adjusted for the entire image as necessary. Both muscle stem cell numbers and average fiber diameter were counted manually using Fiji ImageJ. Objectives used on the DeltaVision Elite microscope were 100× using a PCO Edge sCMOS camera. At least 3 images were taken for each experiment comprising of 8 or 10 Z-sections each. Images were processed using Fiji ImageJ. For super resolution imaging, microscopy was performed using a Leica TCS SP8 White Light Laser with 63× 1.4 NA Oil objective coupled to HyVolution (SVI Huygens based deconvolution) and special Leica Hybrid Detectors. Image quantification was performed using Imaris imaging software.
Sequential immunofluorescence and single molecule FISH
Sequential immunofluorescence (IF) and smFISH on fixed myotubes was performed. Briefly, C2C12 myotubes were differentiated for 7 days in differentiation media, fixed in 4% paraformaldehyde (4%) for 10 minutes, and washed in PBS. The following antibodies were used for immunofluorescence: rabbit anti-TDP-43 (Proteintech, 1:400), rabbit anti-A11 oligomer (Thermo Fisher Scientific, 1:400), goat anti-rabbit Alexa 647 (Abcam, 1:1000), goat anti-mouse IgG1 Alexa 488 (Thermo Fisher Scientific, 1:1000). All IFs were performed sequentially except for staining with mouse anti-myosin heavy chain, F59 (DSHB) which was diluted (1:10) in hybridization buffer. Custom Stellaris FISH probes were designed against mouse Titin, Myosin-3, Troponin C1 and labeled with Quasar 570 Dye using Stellaris RNA FISH Probe Designer (Biosearch Technologies, Petaluma, CA).
Mass spectroscopy
Mass spectrometry was performed as previously described44. In brief, samples were immunoprecipitated on dynabeads as described above. Samples were washed with 0.1 M ammonium bicarbonate (ABC), and resuspended in 100 μL of 0.1 M ABC, 0.2% sodium deoxycholate, 6M guanidine HCL. Samples were reduced and alkylated with 5 mM TCEP, 40 mM chloroacetamide at 65 °C for 20 min in darkness. Samples were trypsinized with 0.5 μg of trypsin at 37 °C for overnight. Proteolysis reaction was quenched by acidification using formic acid. Deoxycholic acid was removed by phase-transfer using ethyl acetate, as previously described. Tryptic peptides were desalted using in-house stop-and-go extraction (STAGE) tips, speed-vac to dryness, and samples were stored at −80 °C.
Samples were resolved by UPLC in the direct injection mode using a Waters nanoACQUITY system. Samples were resuspended in 12 μL of buffer A (0.1% formic acid/water), of which 5 μL (42% of total) was loaded onto a Symmetry C18 nanoACQUITY trap column (130 Å, 5 μm, 180 μm 20 mm) with 15 μL/min of 99.5% buffer A and 0.5% buffer B (0.1% formic acid/acetonitrile) for 3 min. Samples were then eluted and resolved on a BEH130 C18 analytical column (130 Å, 1.7 μm, 75 μm × 250 mm) using a gradient with 3–8% buffer B between 0–3 min, 8–28% buffer B between 2–185 min, and 28–60% buffer B between 185–190 min (0.3 μL/min). MS/MS was performed using an LTQ Orbitrap Velos, scanning MS between 400–1800 m/z (1 × 10⁶ ions, 60,000 resolution) in FT, and selecting the 20 most intense MH22+ and MH33+ ions for MS/MS in LTQ with 180 s dynamic exclusion, 10 ppm exclusion width, repeat count = 1. Maximal injection time was 500 ms for FT precursor scans with one microscan, and 250 ms for LTQ MS/MS with one microscan and AGC 1 × 10⁴. The normalized collision energy was 35%, with activation Q=0.25 for 10 ms.
Raw data from mass spectrometry were processed using MaxQuant/Andromeda (ver 1.5.0.12) and searched against Uniprot mouse database (downloaded on October 2015, 46,471 entries) with common contaminant entries. The search used trypsin specificity with maximum two missed cleavages, included carbamidomethylation on Cys as a fixed modification, and N-terminal acetylation and oxidation on Met as variable modifications. Andromeda used seven ppm maximum mass deviation for the precursor ion, and 0.5 Da as MS/MS tolerance, searching eight top MS/MS peaks per 100 Da. False discovery rates were set to 0.01 for both protein and peptide identifications, with seven amino acid minimum peptide length, and two minimum total peptides.
TDP-43 CRISPR-Cas9 knockout and EdU incorporation
CRISPR-Cas9 knockout was performed in C2C12 myoblasts. Single guide RNA (sgRNA) against TDP-43 (5’- GTGTATGAGAGGAGTCCGAC) were designed using (crispr.mit.edu) and cloned into pSpCas9(BB)-2A-Puro (PX459). T7 endonuclease assays (T7EN) was used to confirm correct targeting to the TDP-43 locus. C2C12 myoblasts were transfected with JetPrime using standard protocols. Myoblasts were selected with puromyocin (1 μg/mL) for one week. C2C12 myoblasts were incubated with 10uM 5-ethynyl-2’-deoxyuridine (EdU – Life Technologies) for three hours. Cells were washed, fixed and stained using the methods described above.
Recombinant TDP-43 Purification
Full-length human TDP-43 was subcloned into pE-SUMO (LifeSensors). His6-SUMO N-terminally tagged TDP-43 was transformed in BL21(DE3)RIL E. coli, which were grown up from an overnight culture in LB-amp at 37°C until an OD600 of 0.3 was reached. At this time, the culture was shifted to 15°C and grown until the OD600 was 0.4–0.5. TDP-43 was then induced with 1mM IPTG for 16 hours at 15°C. The E. coli cells were then lysed by sonication on ice in 50mM HEPES (pH 7.5), 2% Triton X-100, 500mM NaCl, 30mM imidazole, 5% glycerol, 2mM β-mercaptoethanol, and protease inhibitors (cOmplete, EDTA-free, Roche). TDP-43 was purified over Ni-NTA agarose beads (Qiagen) and eluted from the beads using 50mM HEPES (pH 7.5), 500 mM NaCl, 300mM imidazole, 5% glycerol, and 5mM DTT. The protein was subsequently buffer exchanged into 50mM HEPES (pH 7.5), 500mM NaCl, 5% glycerol, and 5mM DTT, flash frozen in liquid N2, and stored as aliquots in −80°C until use. Protein concentration was determined by Bradford assay (Bio-Rad). The purity of TDP-43 was confirmed on a 4–20% polyacrylamide gel.
Thioflavin-T incorporation
Myo-granules were isolated from myotubes and diluted in phosphate buffered saline. Three separate biological replicates were performed constituting purification from three separate myotube cultures. 25 uM Thioflavin-T (Abcam) was added to recombinant 15uM HIS-SUMO-TDP-43, myo-granule, or myo-granule plus recombinant 15uM HIS-SUMO-TDP-43. Surface denaturation was performed with continuous shaking at 37°C with Thioflavin-T incorporation monitored every 10 minutes at 495 nm after excitation at 438 nm on a Gen5 microplate reader (BioTek). Raw fluorescence values obtained for experimental conditions were background subtracted and plotted as a function of time. The resulting curves were fit to following single exponential rate equation (Equation 1) using Kaleidagraph (Synergy Software).
| −A*e(−kobs × t)+B. | Equation 1 |
|---|
where A is amplitude, kobs (min−1) is single exponential rate constant, and B represents maximal amount of fluorescence detected.
Extended Data
Extended Data Fig. 1. TDP-43 adopts higher-ordered state during normal skeletal muscle formation. (Related to Fig. 1).
(a) Nuclear localization of TDP-43 immunofluorescence in C2C12 myoblasts and both nuclear and cytoplasmic localization in C2C12 myotubes differentiated for 7 days (n = 3 independent experiment). Myosin heavy chain (MHC) identifies differentiated cells. Scale bar is 25μm (b) Subcellular fractionation reveals increased cytosolic TDP-43 in differentiating myotubes (Cyto MB, 5.0 ± 2.1%; Cyto MT,19.7 ± 3.1%; n=3 biologically independent experiments giving similar results, unpaired two-tailed t-test, p-value = 2.0 × 10⁻³). (c) Time-course of TDP-43 immunoreactivity during skeletal muscle differentiation (n = 3 independent experiments with similar results). Myogenin (MyoG) immunoreactivity (magenta) and MHC immunoreactivity (green), identify differentiated cells. Nuclei counterstained with DAPI. Scale bar is 25μm (d) TDP-43 immunoreactivity in primary myotubes derived from muscle stem cells differentiated in culture for 4 days (n = 3 independent experiments with similar results). Images for a secondary antibody control on the lower panel. Scale bar is 25 μm. (e) Deconvolution microscopy of TDP-43 immunoreactivity in C2C12 myotubes differentiated for 5 days (n=3 independent experiments with similar results). (f) CRISPR/Cas9-mediated genomic integration of tetracycline inducible HALO-TDP-43 into the ROSA26 safe harbor locus in C2C12 myoblasts. (g) PCR of C2C12 myoblast gDNA for the presence of the HALO-TDP-43 construct (top panel) and for integration into the ROSA26 locus (bottom panel) using the primers mapped in (f) (n=3 independent experiments with similar results**). Red arrowheads point to the expected PCR product for ROSA26 integration. Subsequent live-imaging experiments were performed using clones 1 and 4. (h) Detection of fluorescently labeled HALO-tagged TDP-43 in C2C12 myoblasts following induction resolved on SDS-PAGE. Janelia Fluor® 646 (JF646) (n = 3 independent experiments with similar results). (i) Detection of both HALO-tagged TDP-43 and endogenous TDP-43 in selected C2C12 cell clones (n=3 independent experiments with similar results). (j) Representative myoblast and (k) multinucleated myotube image of individual HALO-TDP-43 molecules. Top panels are taken from start of acquisition (frame 1). Nuclei (Nuc) and cytosolic borders are demarcated with white dotted lines (n=3 independent experiments with similar results)**. Lower panels show dynamic mapping of single TDP-43 molecule tracks using multiple target tracing Matlab script39. Vibrant Violet was used to detect myonuclei. Scale is 5 μm.
Extended Data Fig. 2. TDP-43 adopts higher-ordered state during normal skeletal muscle formation (Related to Fig 1).
(a) Secondary antibody control for 5 dpi TDP-43 staining in TA muscle sections. (n = 5 mice per condition providing similar results). eMHC (embryonic myosin heavy chain) immunoreactivity in regenerating myofibers with nuclei counterstained with DAPI. (b) Immunoreactive TDP-43 in 30dpi TA muscle sections with nuclei counterstained with DAPI (n = 4 mice). Scale bar is 50 μm. (c) RIPA-UREA assay reveals presence of a urea insoluble TDP-43 fraction isolated from C2C12 myotubes differentiated for 7 days but not in C2C12 myoblasts (n=3 independent experiments, each giving similar results, unpaired two-tailed t-test, p-value = 0.0008). GAPDH remains RIPA-soluble in both myoblasts and myotubes (n = 3 independent experiments, each giving similar results, unpaired two-tailed t-test, p-value = 0.7443) (d) Higher molecular weight SDS-resistant TDP-43 assemblies present in differentiating C2C12 myotubes resolved by SDD-AGE (Semi-Denaturing Detergent Agarose Gel Electrophoresis) (n = 3 independent experiments). Pub1 Q/N-GFP from yeast forms higher molecular weight SDS-resistant assemblies than TDP-43 assemblies. (e) Schematic for the isolation of myo-granules containing TDP-43 during skeletal muscle formation (f) Immunoprecipitation (IP) of TDP-43 on dynabeads (DB) reveals oligomers isolated from C2C12 myotubes but absent in myoblasts as observed by electron microscopy (EM) (n = 3 independent experiments). (g) Stress granule formation in multinucleated myotubes derived from C2C12 cells. Immunofluorescence using antibodies against stress granule proteins, G3BP1 and Pabp1, after ± NaAsO2 treatment for 60min (n=3 independent experiments, each giving similar results**)**. Zoom represents magnified inset. Scale bars are 5μm and 20μm, respectively.
Extended Data Fig. 3. Myo-granules containing TDP-43 are amyloid-like oligomers. (Related to Fig 2).
(a-b) X-ray diffraction on immunoprecipitated myo-granules (right half of both panels) compared to the diffraction of mock IgG immunoprecipitation (left half of panel a) and to the diffraction of super oxide dismutase 1 (SOD1) amyloid oligomers (left half of panel b). In all diffraction patterns two rings at ~4.8 Å and ~10 Å are drawn on the bottom half to highlight absence of an ~4.8 Å reflection in the mock immunoprecipitation and a similar ~4.8 Å reflection with a ~10 Å reflection absence in the SOD1 diffraction. One sample per condition was used. Two diffraction images at different rotations were taken per sample and each image gave similar results. (c) Complexes immunopurified using TDP-43 or (d) A11 isolated from C2C12 myotubes are immunoreactive for A11 and TDP-43 respectively, while immunopurified TDP-43 or A11 myo-granules immunostained with secondary antibodies lack signal (red) (n=3 independent experiments). Scale bar is 1 μm. (e) Complexes immunopurified using TDP-43 or (f) A11 isolated from 5 dpi TA muscle are immunoreactive for A11 and TDP-43 respectively, while immunopurified TDP-43 or A11 myo-granules immunostained with secondary antibodies lack signal (red) (n=3 mice). Scale bar is 0.05 μm. (g) TDP-43 immunopurified complexes isolated from an uninjured TA muscle (contralateral to the 5dpi muscle) reveal no complexes with an A11 oligomeric confirmation (n = 3 mice). Scale bar is 0.05 μm. (h) A11 immunopurified complexes from an uninjured TA muscle (contralateral to the 5dpi muscle) reveal no complexes containing TDP-43 (n = 3 mice). Scale bar is 0.05 μm. (i) Dot blot A11 immunoreactivity in C2C12 cells differentiated into myotubes as compared to myoblasts. Quantification reflects fold change in dot blot signal from myoblast to myotube. Data are mean ± s.d. (n=3 independent experiments) (j) Quantification of dot blot signal for A11 conformation complexes and TDP-43 (k) during skeletal muscle regeneration at 5dpi and at 10dpi compared to contralateral uninjured TA muscle and normalized to HRP-only signal. Quantification reflects fold change in dot blot signal. Data are mean ± s.d., n = 3 mice, p-value are unpaired two-tailed t-test.
Extended Data Fig. 4. Myo-granules containing TDP-43 are amyloid-like oligomers. (Related to Fig 2).
(a) C2C12 myotubes differentiated for 7 days reveal strong A11 immunoreactivity in myosin heavy chain (MHC)-positive myotubes but no A11 immunoreactivity in undifferentiated Pax7-positive myoblasts (n=3 independent experiments). (b) Muscle stem cells isolated from 4-month old C57/BL6 mice were differentiated in culture for 5 days and reveal cytoplasmic and nuclear immunoreactivity for A11 oligomer. Myotubes are immunoreactive for MHC (n = 3 mice). (c) Deconvolution microscopy of C2C12 myotubes differentiated for 7 days reveal punctate A11 staining in myosin heavy chain (MHC)-positive myotubes but no A11 signal in undifferentiated myoblasts (n=3 independent experiments). (d) Secondary antibody control for 5 dpi A11 in TA muscle sections. Nuclei counterstained with DAPI. Scale bars are 25 μm (n = 4 mice). (e) Representative images of A11 and TDP-43 colocalization in uninjured, 5 dpi and 10 dpi TA muscle (n=3 mice). (f) Secondary antibody control for 5 dpi and 10dpi A11-TDP-43 colocalization in TA muscle section reveals lack of signal. Nuclei counterstained with DAPI. Scale bars are 25 μm (n = 3 mice). (g) Quantification of A11 signal intensity in myofibers from (e). Unpaired two-tailed t-test for uninjured vs 5dpi p-value = 4.4 × 10⁻⁵ (****); 5dpi vs 10dpi p-value = 4.1 × 10⁻⁴ (***); 10dpi vs uninjured p-value = 0.024 (not shown). n = 3 mice per condition, n = 10 myofibers averaged per mouse. Data are mean ± s.d. (h) Representative deconvolution image of A11 and eMHC immunoreactivity in 5dpi mouse TA myofibers quantified in Fig. 2c (n = 3 mice providing similar results). Scale bar is 2μm and 0.8μm (zoomed inset). (i) Proximity ligation assays (PLAs) reveal complexes of TDP-43 and A11 (green) in C2C12 myotubes counterstained with phalloidin (red). A PLA positive control with two antibodies that recognize different epitopes of TDP-43 are positive, whereas complexes are absent if one primary antibody is omitted (n = 3 independent experiments per condition).
Extended Data Fig. 5. TDP-43 binds select sarcomeric mRNA transcripts during muscle formation (Related to Fig 3).
(a) RNA immunoprecipitation (RIP) from C2C12 myotubes, followed by oligo-dT Northern blot reveals A11 and TDP-43 associate with poly-A RNA (n = 3 biologically independent samples). (b) Schematic of enhanced CLIP (eCLIP) protocol for cultured C2C12 myoblasts and myotubes. (c) Immunoprecipitation of TDP-43 complexes used for eCLIP in C2C12 myoblast (n = 2 biologically independent samples). (d) Same as in (B) but for C2C12 myotubes (n = 2 biologically independent samples). (e) Autoradiogram of 32P-labeled TDP-43 - RNA complexes fractionated by PAGE. White box indicates the area cut and used for eCLIP library preparation (n=1 library prepared per condition). (f) Scatterplots indicate correlation between significant TDP-43 eCLIP peaks in biological replicates. Scatterplot represents fold enrichment for each region in TDP-43 eCLIP relative to paired size matched input (SMInput) with significant peaks in red (p ≤ 10−8 over SMIput). P-values for each peak to determine significance were calculated by Yates’ Chi-Square test (Perl) or Fisher Exact Test (R computing software) when the expected or observed read number was below five16. For myoblasts R values calculated using n = 511137 non-significant peaks and n = 596 significant peaks. For myotubes R values calculated using n = 413368 non-significant peaks and n = 1501 significant peaks. UG-rich motif is significantly enriched in clusters from ORFs and UTRs (p-value determined by DREME software tool). (g) Irreproducible discovery rate (IDR) analysis comparing peak fold enrichment across indicated datasets. (h) TDP-43 eCLIP reveals TDP-43 binds to 3’UTR of TDP-43 transcript in myoblasts (top panel) and myotubes (bottom panel) (n=3 biologically independent experiments giving similar results).
Extended Data Fig. 6. TDP-43 binds select sarcomeric mRNA transcripts during muscle formation (Related to Fig 3).
(a) Myoblast (left column), myotube (middle column) and shared (right column) connectome analysis for all TDP-43 eCLIP peaks (top row) and TDP-43 exonic peaks (bottom row). (b) TDP-43 binds predominantly in exons of protein coding RNAs in C2C12 myoblasts. (c) Peak distribution for significantly enriched TDP-43 peak locations in myoblasts and myotubes across the transcriptome reveal increased exonic and 3’-UTR association compared to neuronal TDP-43 peaks identified in18 and in19. (d) Identification of multiple TDP-43 binding sites across and within exons of Titin. Zoomed region is representative of multiple UG-rich sequences within single exon (n=3 biologically independent experiments giving similar results).
Extended Data Fig. 7. TDP-43 binds select sarcomeric mRNA transcripts during muscle formation (Related to Fig 3).
(a) SDS-PAGE gel stained with SYPRO Ruby reveals enrichment for select proteins during fractionation of total cell lysate (T) from C2C12 myotubes, enriched fraction (EF) and TDP-43 immunoprecipitation (IP) (n=3 biologically independent experiments giving similar results). TDP-43 IP and IgG control IP are representative of the fractions used for mass spectrometry. (b) Venn diagram showing significant overlap between the myo-granule proteome and TDP-43 interactome (defined by22) (p-value determined using hypergeometric test). (c) Gene Ontology of myo-granules reveals enrichment for processes relating to the localization and translation of RNA (n=356 proteins, p-value determined using hypergeometric test with Benjamini & Hochberg False Discovery Rate (FDR) correction). (d) Venn diagram showing significant overlap between myo-granules and neuronal RNA granule proteomes (defined by23) (p-value determined using hypergeometric test). (e) VCP, a top hit in the myo-granule proteome, colocalizes with cytoplasmic TDP-43 and A11 signal in 5dpi mouse skeletal muscle (n = 3 mice). (f) The RNA-binding protein hnRNPA2B1 is not associated with the myo-granule proteome and remains localized to myonuclei in injured (5 dpi) and uninjured TA muscle (n = 3 mice).
Extended Data Fig. 8. TDP-43 binds select sarcomeric mRNA transcripts during muscle formation (Related to Fig 3).
(a) Schematic for the approach used to knockout TDP-43 and quantify C2C12 myoblast proliferation. (b) Schematic for the isolation and fluorescence activated cell sorting (FACS) of muscle stem cells from Pax7_iresCre_;TDP-43_flox/wt_;TdTom and Pax7_iresCre_;TDP-43wt_/wt_;TdTom mice. (>125k muscle stem cells collected per mouse from two populations defined in (b) as TdTom+ and TdTom++). (c) TDP-43 mRNA expression relative to GAPDH mRNA expression from isolated muscle stem cells from (b) (n = 4 independent experiments, each a mean of technical triplicates, from n = 2 mice). Unpaired, two-tailed t-test (*) p-value = 0.0469). (d) Myofiber feret diameter frequency distribution in uninjured Pax7iresCre;TDP-43flox/wt mice compared to Pax7iresCre;TDP-43wt/wt controls (n = 3 mice, 600 myofibers quantified per condition). (e) Quantification of myofiber feret diameter in (c). Box plot horizontal bars represent mean, 25th and 75th percentile ± minima/maxima (n = 3 mice, 600 myofibers per condition). Unpaired, two-tailed, t-test p-value = 0.5925 is not significant (n.s.). (f) Pax7+ muscle stem cell numbers in uninjured Pax7iresCre;TDP-43flox/wt mice compared to Pax7iresCre;TDP-43wt/wt controls (n = 3 mice). Unpaired two-tailed, t-test p-value = 0.1963 (n.s.). Data are mean ± s.d. (g) Schematic for TDP-43 depletion in Pax7+ muscle stem cells during muscle regeneration in Pax7iresCre;TDP-43flox/wt and Pax7iresCre;TDP-43wt/wt mice (Tmx, Tamoxifen). (h) Quantification of myofiber feret diameter from Fig. 3h at 10 dpi in in muscle stem cell TDP-43 haploinsufficient mice compared to wild type control. Box plot horizontal bars represent mean, 25th and 75th percentile ± minima/maxima from n = 489 myofibers from n = 3 mice per condition. Unpaired, two-tailed, t-test (****) p-value = 2.3 × 10⁻³⁰. (i) Similar Pax7+ muscle stem cell numbers at 10 dpi in muscle stem cell TDP-43 haploinsufficient mice compared to controls. Data are mean ± s.d. from n = 3 mice, Unpaired two-tailed, t-test p-value = 0.89 (n.s.).
Extended Data Fig. 9. Myo-granules are increased in VCP disease and are capable of seeding amyloid-like fibers (Related to Fig 4, 5).
(a) Representative image of TDP-43 immunoreactivity (top panel) and secondary antibody only control (bottom panel) in regenerating human skeletal muscle from patient with necrotizing myopathy (n = 3 independent patient biopsies each giving similar results). Scale bar is 50μm. (b) Representative TA cross-section images of uninjured VCP A232E and VCP WT mice labeled with EdU after 21 days of EdU given in the drinking water to mark division and fusion of muscle stem cells, visualized for laminin immunoreactivity to identify myofibers and stained with DAPI to identify nuclei. Arrowheads indicate myofibers with EdU+ centrally-located myonuclei (n = 3 mice each giving similar results). Scale bar is 200 μm and 50μm in inset. (c) Quantification of myofibers with EdU+ centrally-located myonuclei in VCP A232E and VCP WT mice (n = 4 mice, >1000 myofibers quantified per genotype). Data is mean ± s.d. Unpaired, two-tailed, t-test p-value = 6.5 ×10⁻⁶. (d) Representative deconvolution image of A11 and TDP-43 co-localization in a regenerating myofiber from a VCP A232E TA muscle (n = 3 mice each giving similar results). Scale bar is 10μm (e) Secondary antibody control for uninjured VCP A232E TA muscle section reveals lack of signal. Nuclei counterstained with DAPI and myofibers are outlined in white (n = 4 mice each giving similar results). Scale bar is 25μm. (f) Coomassie stained recombinant HIS-SUMO-TDP-43 used for Thioflavin-T assays resolved by SDS-PAGE (n=3 biologically independent experiments each giving similar results). (g) Thioflavin T (ThioT) incorporation reveals ThioT-positive amyloid-like fibers for recombinant Aβ1–42 and absence of ThioT signal for both IgG pulldown control and ThioT alone (n=3 biologically independent experiments each giving similar results). Scale bar is 10 μm. (e) Representative transmission electron microscopy image (zoomed out from Fig 5e) of ThioT-positive fibers formed from isolated myo-granules (n=3 biologically independent experiments). Scale bar is 1μm.
Extended Data Fig. 10. Myo-granules are increased in VCP disease and are capable of seeding amyloid-like fibers (Related to Fig 4).
(a) Schematic of TDP-43 oligomerization and aggregation in wild type, aging and diseased skeletal muscle myofibers.
Supplementary Material
1
4
SI Figure 1
SI tables
Source Data Gels - Uncropped gels in pdf forma
Sup Vid 1
Sup Vid 2
Acknowledgements
We thank the Joe Dragavon, Jian Wei Tay, James Orth and Garry Morgan for help with microscopy. We thank Charles Glabe for A11 antibodies, Philip Wong for TDP-43flox mice, Tiffany Elston for FACS help, Thomas Lee for mass spectrometry help and Matthew Wicklund, Steven Ringel and Shelly Reed for work with patient samples. The research was supported by NIH-T32GM008497 (J.R.W., E.N., T.O.V., E.L.), NIH-F30NS093682 (J.R.W.), NIH-F30AR068881 (T.O.V.), NIH-GM045443 (R.P.), the Howard Hughes Medical Institute (R.P., D.E., J.P.T,), NIH-R35GM119575 (A.M.J), Paul O’Hara II Seed Grant from ACS-IRG Grant Program (A.M.J.), University of Colorado Cancer Center Genomics Core (supported by NIH-P30CA46934), NIH-AR049446 and NIH-AR070360 (B.B.O.), Glenn Foundation for Biomedical Research (B.B.O.), Beverly Sears Grant (J.R.W), and a Butcher Innovation Award NSF IGERT 1144807 (J.R.W., T.O.V.).
Footnotes
Data Availability
Enhanced CLIP data is available on GEO (https://www.ncbi.nlm.nih.gov/geo/query/acc.cgi?acc=GSE104796) under accession number GEO: GSE104796. Source data are provided for Fig. 1d, 2c, 3f, 3h, 4c, 5b, 5c and Extended Data Fig. 1b, 2c, 3i–k, 4g, 7c, 7f, 7h, 7i, 8c and 9c. All other data supporting the findings of this study are available within the article supplemental materials. Data are available upon request from the corresponding authors.
Author Information
The authors declare no competing interests.
References
- 1.Küsters B et al. TDP-43 accumulation is common in myopathies with rimmed vacuoles. Acta Neuropathol. (Berl.) 117, 209–211 (2009). [DOI] [PubMed] [Google Scholar]
- 2.Weihl CC et al. TDP-43 accumulation in IBM muscle suggests a common pathogenic mechanism with Frontotemporal dementia. J. Neurol. Neurosurg. Psychiatry 79, 1186–1189 (2008). [DOI] [PMC free article] [PubMed] [Google Scholar]
- 3.Neumann M et al. Ubiquitinated TDP-43 in frontotemporal lobar degeneration and amyotrophic lateral sclerosis. Science 314, 130–133 (2006). [DOI] [PubMed] [Google Scholar]
- 4.Renton AE, Chiò A & Traynor BJ State of play in amyotrophic lateral sclerosis genetics. Nat. Neurosci 17, 17–23 (2014). [DOI] [PMC free article] [PubMed] [Google Scholar]
- 5.Kraemer BC et al. Loss of murine TDP-43 disrupts motor function and plays an essential role in embryogenesis. Acta Neuropathol. (Berl.) 119, 409–419 (2010). [DOI] [PMC free article] [PubMed] [Google Scholar]
- 6.Schmid B et al. Loss of ALS-associated TDP-43 in zebrafish causes muscle degeneration, vascular dysfunction, and reduced motor neuron axon outgrowth. Proc. Natl. Acad. Sci. U. S. A 110, 4986–4991 (2013). [DOI] [PMC free article] [PubMed] [Google Scholar]
- 7.Diaper DC et al. Drosophila TDP-43 dysfunction in glia and muscle cells cause cytological and behavioural phenotypes that characterize ALS and FTLD. Hum. Mol. Genet 22, 3883–3893 (2013). [DOI] [PMC free article] [PubMed] [Google Scholar]
- 8.Llamusi B et al. Muscleblind, BSF and TBPH are mislocalized in the muscle sarcomere of a Drosophila myotonic dystrophy model. Dis. Model. Mech 6, 184–196 (2013). [DOI] [PMC free article] [PubMed] [Google Scholar]
- 9.Rodriguez-Ortiz CJ et al. Neuronal-Specific Overexpression of a Mutant Valosin-Containing Protein Associated with IBMPFD Promotes Aberrant Ubiquitin and TDP-43 Accumulation and Cognitive Dysfunction in Transgenic Mice. Am. J. Pathol 183, 504–515 (2013). [DOI] [PMC free article] [PubMed] [Google Scholar]
- 10.Caldwell CJ, Mattey DL & Weller RO Role of the basement membrane in the regeneration of skeletal muscle. Neuropathol. Appl. Neurobiol 16, 225–238 (1990). [DOI] [PubMed] [Google Scholar]
- 11.Hardy D et al. Comparative Study of Injury Models for Studying Muscle Regeneration in Mice. PloS One 11, e0147198 (2016). [DOI] [PMC free article] [PubMed] [Google Scholar]
- 12.Webster C, Silberstein L, Hays AP & Blau HM Fast muscle fibers are preferentially affected in Duchenne muscular dystrophy. Cell 52, 503–513 (1988). [DOI] [PubMed] [Google Scholar]
- 13.Johnson BS et al. TDP-43 Is Intrinsically Aggregation-prone, and Amyotrophic Lateral Sclerosis-linked Mutations Accelerate Aggregation and Increase Toxicity. J. Biol. Chem 284, 20329–20339 (2009). [DOI] [PMC free article] [PubMed] [Google Scholar]
- 14.Sangwan S et al. Atomic structure of a toxic, oligomeric segment of SOD1 linked to amyotrophic lateral sclerosis (ALS). Proc. Natl. Acad. Sci 114, 8770–8775 (2017). [DOI] [PMC free article] [PubMed] [Google Scholar]
- 15.Kayed R et al. Common structure of soluble amyloid oligomers implies common mechanism of pathogenesis. Science 300, 486–489 (2003). [DOI] [PubMed] [Google Scholar]
- 16.Van Nostrand EL et al. Robust transcriptome-wide discovery of RNA-binding protein binding sites with enhanced CLIP (eCLIP). Nat Methods 13, 508–14 (2016). [DOI] [PMC free article] [PubMed] [Google Scholar]
- 17.Ayala YM et al. TDP‐43 regulates its mRNA levels through a negative feedback loop. EMBO J. 30, 277–288 (2011). [DOI] [PMC free article] [PubMed] [Google Scholar]
- 18.Polymenidou M et al. Long pre-mRNA depletion and RNA missplicing contribute to neuronal vulnerability from loss of TDP-43. Nat. Neurosci 14, 459–468 (2011). [DOI] [PMC free article] [PubMed] [Google Scholar]
- 19.Tollervey JR et al. Characterizing the RNA targets and position-dependent splicing regulation by TDP-43. Nat. Neurosci 14, 452–458 (2011). [DOI] [PMC free article] [PubMed] [Google Scholar]
- 20.Afroz T et al. Functional and dynamic polymerization of the ALS-linked protein TDP-43 antagonizes its pathologic aggregation. Nat. Commun 8, 45 (2017). [DOI] [PMC free article] [PubMed] [Google Scholar]
- 21.Alami NH et al. Axonal transport of TDP-43 mRNA granules in neurons is impaired by ALS-causing mutations. Neuron 81, 536–543 (2014). [DOI] [PMC free article] [PubMed] [Google Scholar]
- 22.Freibaum BD, Chitta R, High AA & Taylor JP Global analysis of TDP-43 interacting proteins reveals strong association with RNA splicing and translation machinery. J. Proteome Res 9, 1104–1120 (2010). [DOI] [PMC free article] [PubMed] [Google Scholar]
- 23.Fatimy RE et al. Tracking the Fragile X Mental Retardation Protein in a Highly Ordered Neuronal RiboNucleoParticles Population: A Link between Stalled Polyribosomes and RNA Granules. PLOS Genet. 12, e1006192 (2016). [DOI] [PMC free article] [PubMed] [Google Scholar]
- 24.Taylor JP Multisystem proteinopathy: Intersecting genetics in muscle, bone, and brain degeneration. Neurology 10.1212/WNL.0000000000001862 (2015). doi: 10.1212/WNL.0000000000001862 [DOI] [PubMed] [Google Scholar]
- 25.Kim HJ et al. Mutations in prion-like domains in hnRNPA2B1 and hnRNPA1 cause multisystem proteinopathy and ALS. Nature 495, 467 (2013). [DOI] [PMC free article] [PubMed] [Google Scholar]
- 26.Chiang P-M et al. Deletion of TDP-43 down-regulates Tbc1d1, a gene linked to obesity, and alters body fat metabolism. Proc. Natl. Acad. Sci 107, 16320–16324 (2010). [DOI] [PMC free article] [PubMed] [Google Scholar]
- 27.Murphy MM, Lawson JA, Mathew SJ, Hutcheson DA & Kardon G Satellite cells, connective tissue fibroblasts and their interactions are crucial for muscle regeneration. Development 138, 3625–37 (2011). [DOI] [PMC free article] [PubMed] [Google Scholar]
- 28.Salajegheh M et al. Sarcoplasmic redistribution of nuclear TDP-43 in inclusion body myositis. Muscle Nerve 40, 19–31 (2009). [DOI] [PMC free article] [PubMed] [Google Scholar]
- 29.Custer SK, Neumann M, Lu H, Wright AC & Taylor JP Transgenic mice expressing mutant forms VCP/p97 recapitulate the full spectrum of IBMPFD including degeneration in muscle, brain and bone. Hum. Mol. Genet 19, 1741–1755 (2010). [DOI] [PubMed] [Google Scholar]
- 30.Mompeán M et al. Structural Evidence of Amyloid Fibril Formation in the Putative Aggregation Domain of TDP-43. (2015). doi: 10.1021/acs.jpclett.5b00918 [DOI] [PMC free article] [PubMed] [Google Scholar]
- 31.Chen AK-H et al. Induction of Amyloid Fibrils by the C-Terminal Fragments of TDP-43 in Amyotrophic Lateral Sclerosis. (2010). doi: 10.1021/ja9066207 [DOI] [PubMed] [Google Scholar]
- 32.Igaz LM et al. Expression of TDP-43 C-terminal Fragments in Vitro Recapitulates Pathological Features of TDP-43 Proteinopathies. J. Biol. Chem 284, 8516–8524 (2009). [DOI] [PMC free article] [PubMed] [Google Scholar]
- 33.Nishino I et al. Distal myopathy with rimmed vacuoles is allelic to hereditary inclusion body myopathy. Neurology 59, 1689–1693 (2002). [DOI] [PubMed] [Google Scholar]
- 34.Wiesner D et al. Reversible induction of TDP-43 granules in cortical neurons after traumatic injury. Exp. Neurol 299, 15–25 (2018). [DOI] [PubMed] [Google Scholar]
- 35.Moisse K et al. Divergent patterns of cytosolic TDP-43 and neuronal progranulin expression following axotomy: Implications for TDP-43 in the physiological response to neuronal injury. Brain Res. 1249, 202–211 (2009). [DOI] [PubMed] [Google Scholar]
- 36.Wilson RS et al. TDP-43 Pathology, Cognitive Decline, and Dementia in Old Age. JAMA Neurol. 70, 1418–1424 (2013). [DOI] [PMC free article] [PubMed] [Google Scholar]
- 37.Liu G et al. Endocytosis regulates TDP-43 toxicity and turnover. Nat. Commun 8, 2092 (2017). [DOI] [PMC free article] [PubMed] [Google Scholar]
- 38.Laing NG & Nowak KJ When contractile proteins go bad: the sarcomere and skeletal muscle disease. BioEssays 27, 809–822 (2005). [DOI] [PubMed] [Google Scholar]
- 39.Sergé Arnauld, et al. Dynamic multiple-target tracing to probe spatiotemporal cartography of cell membranes. Nature methods 5.8, 687 (2008). [DOI] [PubMed] [Google Scholar]
- 40.Platt RJ et al. CRISPR-Cas9 Knockin Mice for Genome Editing and Cancer Modeling. Cell 159, 440–455 (2014). [DOI] [PMC free article] [PubMed] [Google Scholar]
- 41.Grimm JB et al. A general method to improve fluorophores for live-cell and single-molecule microscopy. Nat. Methods 12, 244–250 (2015). [DOI] [PMC free article] [PubMed] [Google Scholar]
- 42.Halfmann R & Lindquist S Screening for Amyloid Aggregation by Semi-Denaturing Detergent-Agarose Gel Electrophoresis. J. Vis. Exp. JoVE (2008). doi: 10.3791/838 [DOI] [PMC free article] [PubMed] [Google Scholar]
- 43.Fang Y-S et al. Full-length TDP-43 forms toxic amyloid oligomers that are present in frontotemporal lobar dementia-TDP patients. Nat. Commun 5, 4824 (2014). [DOI] [PubMed] [Google Scholar]
- 44.Jain S et al. ATPase-Modulated Stress Granules Contain a Diverse Proteome and Substructure. Cell 164, 487–498 (2016). [DOI] [PMC free article] [PubMed] [Google Scholar]
- 45.Winey M, Meehl JB, O’Toole ET & Giddings TH Conventional transmission electron microscopy. Mol. Biol. Cell 25, 319–323 (2014). [DOI] [PMC free article] [PubMed] [Google Scholar]
- 46.Lovci MT et al. Rbfox proteins regulate alternative mRNA splicing through evolutionarily conserved RNA bridges. Nat. Struct. Mol. Biol 20, 1434–1442 (2013). [DOI] [PMC free article] [PubMed] [Google Scholar]
Associated Data
This section collects any data citations, data availability statements, or supplementary materials included in this article.
Supplementary Materials
1
4
SI Figure 1
SI tables
Source Data Gels - Uncropped gels in pdf forma
Sup Vid 1
Sup Vid 2
