The nucleotide sensor ZBP1 and kinase RIPK3 induce the enzyme IRG1 to promote an antiviral metabolic state in neurons (original) (raw)
. Author manuscript; available in PMC: 2020 Jan 15.
Summary
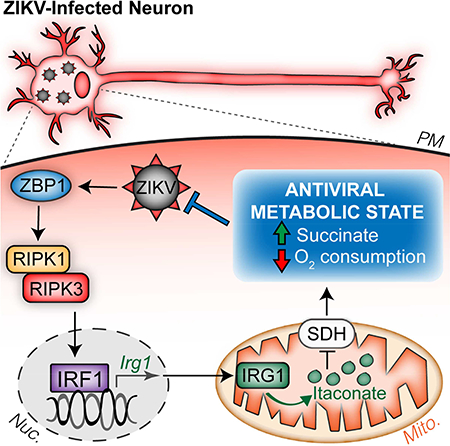
As long-lived post-mitotic cells, neurons employ unique strategies to resist pathogen infection while preserving cellular function. Here, using a murine model of Zika virus (ZIKV) infection, we identified an innate immune pathway that restricts ZIKV replication in neurons and is required for survival upon ZIKV infection of the central nervous system (CNS). We found that neuronal ZIKV infection activated the nucleotide sensor ZBP1 and the kinases RIPK1 and RIPK3, core components of virus-induced necroptotic cell death signaling. However, activation of this pathway in ZIKV-infected neurons did not induce cell death. Rather, RIPK signaling restricted viral replication by altering cellular metabolism via upregulation of the enzyme IRG1 and production of the metabolite itaconatemechanism of viral restriction during neur. Itaconate inhibited the activity of succinate dehydrogenase, generating a metabolic state in neurons that suppresses replication of viral genomes. These findings demonstrate an immunometabolic mechanism of viral restriction during neuroinvasive infection.
In Brief:
Daniels et al. find that molecules traditionally associated with necroptotic cell death engage a death-independent transcriptional program in neurons during Zika virus infection. This transcriptional program includes the enzyme IRG1, whose product, itaconate, reprograms neuronal metabolism in a manner that restricts Zika virus replication.
Graphical Abstract
Introduction
Zika virus (ZIKV) is an emerging flavivirus of global concern. After its recent introduction to the Western hemisphere, ZIKV has become a growing public health challenge throughout the Americas (Lazear and Diamond, 2016). Human infection during pregnancy has been linked to severe fetal abnormalities, including debilitating neuropathological outcomes and microcephaly (Costa and Ko, 2018; Coyne and Lazear, 2016). In adults, ZIKV infection can also result in rare but significant neurologic injury, including peripheral neuropathy and meningoencephalitis (Hygino da Cruz et al., 2018; Mehta et al., 2018). In some infected individuals, ZIKV accesses the central nervous system (CNS), where it infects neurons and neural progenitor cells (Miner and Diamond, 2017). However, despite intense investigation, the mechanisms that promote anti-ZIKV immunity in neurons remain to be fully elucidated. Though both innate and adaptive immune responses are required to control and clear CNS infections, neural tissues are both highly susceptible to immunologic injury and limited in their capacity for repair (Klein and Hunter, 2017). Immune responses in the CNS are therefore tightly regulated, and neural cells may employ antimicrobial strategies not observed in other tissues.
Mounting evidence demonstrates that immune activation is intricately linked with changes in cellular metabolism. Recently, the metabolite itaconate has gained attention as a key immunoregulatory molecule in myeloid cells (Cordes et al., 2016; Hall et al., 2013; Lampropoulou et al., 2016; Michelucci et al., 2013; Nair et al., 2018; Shen et al., 2017). Itaconate is produced from the tricarboxylic acid (TCA) cycle intermediate _cis_-aconitate by an enzyme encoded by immunoresponsive gene 1 (IRG1). The functions of itaconate in myeloid cells include direct dysregulation of bacterial metabolism (Michelucci et al., 2013; Naujoks et al., 2016), alteration of host cell transcription via effects on the Nrf2/Keap1 and IκBζ pathways (Bambouskova et al., 2018; Mills et al., 2018), and metabolic reprogramming via inhibition of succinate dehydrogenase (SDH) activity (Cordes et al., 2016; Lampropoulou et al., 2016). While studies of itaconate have predominantly focused on macrophages and models of bacterial infection, IRG1 was also identified in a screen for genes whose overexpression restricted RNA virus replication in neurons (Cho et al., 2013). However, a role for the IRG1-itaconate axis in antiviral defense in vivo has not been described.
Receptor interacting protein kinases −1 (RIPK1) and −3 (RIPK3) orchestrate a form of programmed cell death known as necroptosis via activation of the executioner molecule mixed lineage kinase domain-like protein (MLKL). Necroptosis can be triggered by various viral infections including influenza A virus (Nogusa et al., 2016), murine cytomegalovirus (Upton et al., 2012), herpes simplex virus (Huang et al., 2015), and vaccinia virus (Cho et al., 2009; Pan et al., 2014). In these contexts, the necroptotic death of infected cells is thought to contribute to pathogen elimination and host defense (Orozco and Oberst, 2017). However, we recently described a cell death-independent function for the necroptotic kinases RIPK3 and RIPK1 in the coordination of protective neuroinflammation during infection with West Nile virus (WNV) (Daniels et al., 2017).
Here, we describe a pathway of cell-intrinsic restriction of ZIKV that occurs in neurons. Mice lacking the RIPK-activating nucleotide sensor ZBP1, RIPK3, or the kinase activity of RIPK1 displayed ascending paresis upon peripheral ZIKV infection and rapid mortality upon direct infection of the CNS, despite intact type I IFN signaling. These phenotypes reflected a failure of cell-intrinsic ZIKV restriction in neurons, independent of the cell death-inducing functions of ZBP1, RIPK1, and RIPK3. Rather, we identified IRG1 as a key downstream target of a ZBP1- and RIPK-dependent transcriptional program that restricted ZIKV replication in neurons, but not myeloid cells. Production of itaconate by IRG1 inhibited SDH activity and altered neuronal metabolism, creating a cellular environment that suppressed viral replication. Together, these findings identify an immunometabolic program that protects against neuroinvasive ZIKV infection.
Results
RIPK signaling controls ZIKV pathogenesis independently of cell death
To assess roles for members of the necroptotic signaling pathway during ZIKV infection, we subcutaneously inoculated Ripk3 −/− and Mlkl −/− mice, along with mice expressing a kinase-dead version of RIPK1 (Ripk1 KD/KD) and congenic controls, with ZIKV and monitored mice for survival and the development of clinical signs of disease. Mice were infected with either the original African lineage strain ZIKV-MR766 (Uganda, 1947) or a contemporary Asian lineage strain, ZIKV-Fortaleza (Brazil, 2015). While subcutaneous infection did not result in death in any genotype, a large proportion of mice lacking RIPK3 (Figure 1A) or the kinase activity of RIPK1 (Figure 1B) developed clinical signs of paresis, while their respective wild type (WT) controls did not. These clinical signs of disease were chronic and occurred following infection with either ZIKV strain. In contrast, mice lacking the necroptotic effector protein MLKL (Figure 1C) did not exhibit significant clinical signs of paresis following infection. Moreover, neither Ripk3 −/− Casp8 −/− (Figure S1A) nor Mlkl −/− Casp8 −/− mice (Figure S1B) exhibited differential phenotypes compared to their littermate Ripk3 −/− or Mlkl −/− controls. These data suggest that RIPK signaling restricts ZIKV pathogenesis independently of MLKL- or Caspase 8-driven cell death. In support of this, we observed no evidence for RIPK3-dependent cell death in primary cultures of cerebral cortical neurons following infection with ZIKV-MR766 (Figure S1C).
Figure 1: RIPK signaling controls ZIKV pathogenesis following peripheral infection.

(A-C) Percentages of _Ripk3_−/− (A), Ripk1 KD/KD (B), or Mlkl −/− (C) mice and congenic C57BL/6NJ (B6/N) or C57BL/6J (B6/J) controls exhibiting clinical signs of paresis following subcutaneous inoculation with ZIKV-MR766 or ZIKV-Fortaleza (FZ). Signs of paresis included loss of tail tone, impaired righting reflex, irregular gait, and/or kinetic tremor. N= 10–20 mice per group.
(D-K) B6/N or _Ripk3_−/− mice were infected subcutaneously with ZIKV-MR766 (D-G) or ZIKV-Fortaleza (H-K). On indicated days following infection, the indicated tissues were assayed for ZIKV titers via qRT-PCR. qRT-PCR data are normalized against a standard curve of known viral titers to generate PFU equivalents.
*p<0.05, **p<0.01, ***p<0.001. Error bars represent SEM. Dotted lines indicate limits of detection. All data are pooled from two or three independent experiments. See also Figure S1.
We next measured viral burden in various tissue compartments following subcutaneous infection. We observed no differences in viral RNA in peripheral (non-CNS) compartments in Ripk3 −/− mice following infection with either ZIKV-MR766 (Figure S1D-I) or ZIKV-Fortaleza (Figure S1J-K). In contrast, Ripk3 −/− mice exhibited higher copy numbers of ZIKV RNA on day 7 following infection with ZIKV-MR766 in several CNS tissues, including cerebral cortex (Figure 1D), brainstem (Figure 1E), cerebellum (Figure 1F), and spinal cord (Figure 1G). Elevated viral RNA persisted in a subset of these tissues on days 14 and 42 post infection. Similar results were observed in identical studies using ZIKV-Fortaleza (Figure 1H-K). However, Mlkl −/− mice did not exhibit increased ZIKV RNA in either peripheral or CNS tissues following infection with ZIKV-MR766 (Figure S1L-M). Together, these data suggest that, while dispensable in non-nervous tissues, RIPK3 is required to restrict ZIKV replication within the CNS.
RIPK signaling exerts CNS-intrinsic restriction of ZIKV replication
To assess whether CNS-intrinsic RIPK signaling was required to control ZIKV infection, we inoculated mice intracranially with ZIKV-MR766, allowing us to study local CNS responses to infection. Both _Ripk3_−/− (Figure 2A) and _Ripk1_KD/KD (Figure 2B) mice exhibited accelerated and enhanced mortality compared to controls following intracranial infection, while _Mlkl_−/− mice did not (Figure 2C). As genetic deletion of RIPK3 increased susceptibility to intracranial ZIKV infection, we questioned whether overexpression of RIPK3 would be protective. We thus utilized a mouse expressing a chimeric version of RIPK3 (RIPK3–2xFV) fused to two FKBPF36V domains that drive enforced oligomerization of the protein following treatment with a dimerization drug (Orozco et al., 2014); however, RIPK3–2xFV maintains native function and can be coexpressed with endogenous RIPK3 in order to study the effects of RIPK3 overexpression using physiological stimuli. We used a mouse previously described by our laboratory (Daniels et al., 2017) that constitutively expresses RIPK3–2xFV in most cell types under the control of the Meox2 (Mox2) promoter (_Ripk3_-2xFVfl/fl _Mox2-_Cre+, Figure S2A). Remarkably, while littermate controls exhibited ~33% mortality following intracranial infection, _Ripk3_-2xFVfl/fl _Mox2-_Cre+ were completely protected from ZIKV-induced mortality (Figure 2D). This protective benefit of RIPK3 overexpression was independent of MLKL expression, as _Ripk3_-2xFVfl/fl _Mox2-_Cre+ _Mlkl_−/− were also completely protected following intracranial infection.
Figure 2: RIPK signaling exerts CNS-intrinsic restriction of ZIKV replication.

(A-C) Survival analysis in _Ripk3_−/− (A), Ripk1 KD/KD (B), or Mlkl −/− (C) mice and congenic controls following intracranial inoculation with ZIKV-MR766. N= 10–16 mice/genotype.
(D) Survival analysis in _Ripk3_-2xFVfl/fl _Mox2-_Cre+ and _Ripk3_-2xFVfl/fl _Mox2-_Cre+ _Mlkl_−/− mice along with Cre− littermate controls following intracranial inoculation with ZIKV-MR766. N= 9–15 mice/genotype.
(E-G) _Ripk3_−/− (E), Ripk1 KD/KD (F), or Mlkl −/− (G) mice and congenic controls were infected intracranially with ZIKV-MR766. On indicated days following infection, whole brains were assayed for ZIKV titers via plaque assay.
(H) Analysis of brain viral burden in _Ripk3_-2xFVfl/fl _Mox2-_Cre+ and _Ripk3_-2xFVfl/fl _Mox2-_Cre+ _Mlkl_−/− mice along with Cre− littermate controls following intracranial ZIKV-MR766 infection, as in (E-G).
(I-K) Multistep viral growth curve analysis (MOI 0.1) in primary cortical neurons isolated from _Ripk3_−/− (I), Ripk1 KD/KD (J), or Mlkl −/− (K) mice or congenic controls. N= 6 independent replicates.
(L) Multistep viral growth curve analysis (MOI 0.1) in primary cortical neurons isolated from _Ripk3_-2xFVfl/fl _Mox2-_Cre+ mice and Cre− littermate controls. Prior to infection, cultures were pretreated (2h) with AP1 or DMSO vehicle. N= 4 independent replicates.
*p<0.05, **p<0.01, ***p<0.001. Error bars represent SEM. Dotted lines indicate limits of detection. All data are pooled from two or three independent experiments. See also Figure S2.
We next assessed whether RIPK signaling restricted ZIKV replication within the CNS. Both _Ripk3_−/− (Figure 2E) and _Ripk1_KD/KD (Figure 2F) mice, but not _Mlkl_−/− mice (Figure 2G), exhibited increased viral titers in whole brain homogenates on days 2 and 4 following infection. Mice receiving intracranial administration of chemical inhibitors of RIPK1 or RIPK3 kinase activity (GSK 963 or GSK 843, respectively) also exhibited increased brain viral burden compared to vehicle treated controls (Figure S2B). Conversely, _Ripk3_-2xFVfl/fl _Mox2-_Cre+ mice exhibited significantly decreased brain viral burden following intracranial infection, and this protective benefit was independent of MLKL expression (Figure 2H). To further confirm the CNS-intrinsic nature of viral restriction by RIPK signaling, we performed multistep viral growth curve analysis in primary cortical neurons. Both _Ripk3_−/− (Figure 2I) and _Ripk1_KD/KD (Figure 2J) neuronal cultures exhibited significantly enhanced replication of ZIKV-MR766 compared to controls, while _Mlkl_−/− cultures (Figure 2K) did not. _Ripk3_−/− neuronal cultures also exhibited enhanced replication following infection with ZIKV-Fortaleza (Figure S2C), and WT neurons pretreated with GSK 963 or GSK 843 also exhibited enhanced replication following infection with either ZIKV-MR766 or ZIKV-Fortaleza (Figure S2D). We did not observe similar results using primary bone marrow-derived macrophages (BMDM) or dendritic cells (BMDC), as neither genetic nor pharmacological ablation of RIPK1, RIPK3, MLKL, or Caspase 8 signaling impacted ZIKV-MR766 replication in these cell types (Figure S2E-G). Similarly, _Ripk3_−/− microglial cultures did not exhibit increased ZIKV-MR766 replication following infection compared to controls (Figure S2H).
To test whether RIPK3 overexpression in neurons would impact ZIKV replication, we generated neuronal cultures from _Ripk3_-2xFVfl/fl _Mox2-_Cre+ mice. We additionally pretreated some cultures with the dimerization drug AP1 in order to prophylactically induce RIPK3 activation prior to infection with ZIKV. Overexpression of RIPK3 significantly inhibited ZIKV-MR766 replication in neuronal cultures, and enforced activation of RIPK3 prior to infection significantly enhanced this effect (Figure 2L). Together, these data demonstrate that RIPK signaling acts in a cell-intrinsic manner in neurons, but not myeloid cells, to restrict ZIKV replication.
Neuronal RIPK signaling is required to control ZIKV infection in the CNS
To confirm that RIPK signaling in neurons influences disease pathogenesis in vivo, we crossed _Ripk3_-2xFVfl/fl mice to a line expressing Cre under the CamkIIα promoter, which drives Cre-mediated recombination exclusively in a large population of adult excitatory forebrain neurons (Dragatsis and Zeitlin, 2000). As the RIPK3–2xFV transgene includes a T2A-mCherry reporter element, we confirmed the neuronal specificity of the CamKIIα line via immunohistochemical detection of mCherry. _Ripk3_-2xFVfl/fl _CamKIIα-_Cre+ mice exhibited mCherry expression in MAP2+ neurons throughout the forebrain, including the cerebral cortex (Figure 3A). As expected, we did not observe mCherry expression in the cerebellum (Figure S3A) or in GFAP+ cells (Figure S3B). Having confirmed the specificity of _CamKIIα-_Cre-mediated recombination, we used this system to assess the phenotype of mice overexpressing RIPK3 specifically in forebrain neurons. _Ripk3_-2xFVfl/fl _CamKIIα-_Cre+ exhibited enhanced survival (Figure 3B) and decreased brain viral burden (Figure 3C) following intracranial infection with ZIKV-MR766. To test whether deletion of RIPK3 from forebrain neurons would impact disease pathogenesis, we also crossed mice in which exons 2 and 3 of the endogenous Ripk3 locus are flanked by loxP sites (_Ripk3_fl/fl) (Newton et al., 2016) to the _CamKIIα-_Cre line. Mice with forebrain neuron-specific deletion of RIPK3 exhibited both markedly enhanced mortality (Figure 3D) and brain viral burden (Figure 3E) compared to littermate controls following intracranial infection with ZIKV-MR766, while expression of _CamKIIα-_Cre alone in the absence of any floxed alleles did not alter survival following infection (Figure S3C). Collectively, these data confirm that neuronal RIPK3 is required for the control of ZIKV infection within the CNS.
Figure 3: Neuronal RIPK3 signaling is required to control ZIKV infection in the CNS.

(A) Fluorescent immunohistochemical staining of mCherry (red), neuronal marker MAP2 (green) in cerebral cortices of a naïve _Ripk3_-2xFVfl/fl _CamkIIα-_Cre+ mouse and a Cre− littermate control. Images are representative of at least 2 sections analyzed from 3 independent mice per genotype. Scale bar= 50μm.
(B) _Ripk3_-2xFVfl/fl _CamkIIα-_Cre+ mice and Cre− littermate controls were infected intracranially with ZIKV-MR766 and monitored for survival. N= 10 (Cre−) and 14 (Cre+) mice.
(C) Mice as in (B) were infected intracranially with ZIKV-MR766. On indicated days following infection, whole brains were assayed for ZIKV titers via plaque assay.
(D-E) Survival (D) or tissue viral titers (E) in _Ripk3_fl/fl _CamkIIα-_Cre+ mice and Cre− littermate controls following intracranial infection with ZIKV-MR766. N= 11–12 mice/genotype.
(F) Primary human neuroblastoma lines (NB8, NB15, and NB16) were differentiated into neuron-like cells. Multistep growth curve analysis (MOI 0.1) was then performed following 2h pretreatment with the human RIPK3 inhibitor GSK 872 or a DMSO vehicle. N= 4 independent replicates.
**p<0.01, ***p<0.001. Error bars represent SEM. Dotted lines indicate limits of detection. All data are pooled from two or three independent experiments. See also Figure S3.
We next questioned whether RIPK signaling would impact ZIKV replication in human neural lineage cells. We thus performed multistep growth curve analysis in three independent primary human neuroblastoma lines (NB8, NB15, NB16). Pharmacological blockade of human RIPK3 signaling with the reagent GSK 872 significantly enhanced ZIKV replication in all three neuroblastoma lines (Figure 3F), analogous to our observations in primary murine neurons. These data suggest that both human and murine RIPK3 signaling restrict ZIKV replication in a cell-intrinsic manner in neural lineage cells.
ZBP1 drives RIPK3 activation and restricts neuronal ZIKV infection
To characterize the signals driving RIPK1 and RIPK3 activation during ZIKV infection, we intracranially inoculated mice lacking key components of pattern recognition receptor (PRR) signaling pathways known to detect RNA virus infection. While neither _Tlr3_−/− nor _Mavs_−/− mice experienced enhanced mortality compared to controls, mice lacking the Z-form nucleic acid sensor ZBP1 (also known as DAI) were markedly more susceptible to intracranial ZIKV infection, exhibiting both increased mortality (Figure 4A) and brain viral burden (Figure 4B). We also observed enhanced replication of ZIKV-MR766 in _Zbp1_−/− neuronal cultures (Figure 4C), suggesting that ZBP1 activation contributes to cell-intrinsic restriction of ZIKV replication. ZBP1 is known to activate RIPK1 and RIPK3 directly via RIP homotypic interaction motif (RHIM)-dependent interactions; thus, we questioned whether ZBP1 serves as an upstream activator of RIPK signaling during ZIKV infection. Zbp1 mRNA was upregulated in brain homogenates following intracranial infection (Figure 4D), as well as in infected primary neuronal cultures (Figure 4E). However, _Ripk3_−/− mice and neuronal cultures exhibited equivalent upregulation of Zbp1 expression as WT controls, suggesting that ZBP1 expression is not induced downstream of RIPK3 activation. We next tested whether loss of ZBP1 expression would impact RIPK3 activation using immunocytochemical detection of phosphorylated RIPK3 in primary neurons. While we observed similar overall RIPK3 protein expression (Figure 4F-G), we observed significantly decreased phosphorylated RIPK3 immunoreactivity in infected _Zbp1_−/− neuronal cultures compared to infected WT controls (Figure 4H-I). The specificity of phopho-RIPK3 staining was validated using Ripk3 −/− neuronal cultures (Figure S3D). Together, these data suggest that ZBP1 is a key apical sensor that drives RIPK signaling and restricts ZIKV replication in neurons.
Figure 4: ZBP1 signaling activates RIPK3 and restricts neuronal ZIKV infection.

(A) Survival analysis in _Mavs_−/−, Tlr3 −/−, or Zbp1 −/− mice and congenic WT controls following intracranial inoculation with ZIKV-MR766. N= 10 mice/genotype.
(B) _Zbp1_−/− mice and congenic controls were infected intracranially with ZIKV-MR766. On indicated days following infection, whole brains were assayed for ZIKV titers via plaque assay.
(C) Multistep viral growth curve analysis (MOI 0.1) in primary cortical neurons isolated from Zbp1 −/− mice or congenic controls. N= 6 independent replicates.
(D-E) qRT-PCR analysis of Zbp1 mRNA expression in whole brain homogenates 48h following intracranial ZIKV infection (D) or in primary cortical neurons 24h post infection (E).
(F-I) Fluorescent immunocytochemical detection of neuronal marker MAP2 (green) and RIPK3 (red, F) or phosphorylated RIPK3 (red, H) in primary cortical neurons isolated from Zbp1 −/− mice or congenic controls, 6h following infection with ZIKV-MR766 (MOI 10.0). Intensity quantifications in G and I represent integrated red pixel intensity values normalized to green pixel area. Nuclei are stained with DAPI (blue). Images are representative of at least 4 high power fields taken for each of 3 independent replicates. Scale bar= 10μm.
*p<0.05, **p<0.01, ***p<0.001. Error bars represent SEM. Dotted lines indicate limits of detection. All data are pooled from two or three independent experiments. See also Figure S3.
ZBP1, RIPK1, and RIPK3 induce antimicrobial gene expression in ZIKV-infected neurons
As the anti-ZIKV activity of RIPK3 was cell death-independent, we next questioned whether neuronal RIPK signaling shaped antimicrobial gene transcription. We thus performed microarray analysis of gene expression in WT and _Ripk3_−/− cortical neurons following infection with ZIKV-MR766. Two genes with known antimicrobial activity, Irg1 and Gbp4, were the 2nd and 3rd most differentially expressed transcripts in our study (Figure S4A). Though Irg1 and Gbp4 are both interferon stimulated genes (ISGs), _Ripk3_−/− neurons exhibited otherwise intact expression of many conventional ISGs (Figure S4B), suggesting that the antiviral activity of RIPK3 was not due to a global deficit in type I interferon signaling. We ultimately identified 5 genes with known antimicrobial activity that were significantly induced by ZIKV infection in WT but not _Ripk3_−/− neurons; these included Irg1 and Gbp4, as well as Tgtp1, Ifi44, Ifi47 (Figure 5A). While each of these genes were also highly induced by WNV infection in neurons, in this context their expression was independent of RIPK3 (Figure S4C). Subsequent qPCR analysis confirmed decreased expression of each of these genes in _Ripk3_−/− neurons following ZIKV infection (Figure 5B). We also confirmed decreased expression of all five genes in infected neuronal cultures lacking either RIPK1 kinase activity (Figure 5C) or ZBP1 (Figure 5D), further suggesting that both RIPK1 and ZBP1 are required for RIPK3-mediated responses to neuronal ZIKV infection. We next analyzed expression of these transcripts in vivo in whole brain homogenates following intracranial infection. _Ripk3_−/−, Ripk1 KD/KD, and _Zbp1_−/− mice all exhibited decreased expression of Irg1, Gbp4, Tgtp1, and Ifi47, while expression of Ifi44 did not differ from controls in brains of infected mice of any genotype (Figure 5E-G).
Figure 5: ZBP1/RIPK1/RIPK3 induce antiviral gene transcription in ZIKV-infected neurons.

(A) Heat map depicting relative expression values of 5 candidate antiviral genes exhibiting significantly different expression in microarray analysis of _Ripk3_−/− primary cortical neurons compared to WT controls 24h following ZIKV-MR766 infection (MOI 0.1).
(B-D) qRT-PCR analysis of mRNA expression of indicated genes in primary cortical neurons derived from Ripk3 −/− (B), Ripk1 KD/KD (C), or Zbp1 −/− (D) mice or congenic controls at 24h following infection with ZIKV-MR766 (MOI 0.1). N= 6 independent replicates.
(E-G) qRT-PCR analysis of mRNA expression of indicated genes in whole brain homogenates derived from Ripk3 −/− (E), Ripk1 KD/KD (F), or Zbp1 −/− (G) mice or congenic controls at 48h following intracranial infection with ZIKV-MR766. N= 6 independent replicates.
(H-I) qRT-PCR analysis of mRNA expression of indicated genes in primary cortical neurons derived from _Ripk3_-2xFVfl/fl _Mox2-_Cre+ mice or Cre− littermate controls at 24h following infection with 0.1 MOI ZIKV-MR766 (H) or 4h following treatment with AP1(I). N= 6 independent replicates.
*p<0.05, **p<0.01, ***p<0.001. Error bars represent SEM. Data in (B-G) are pooled from two or three independent experiments. See also Figure S4.
As overexpression of RIPK3 restricted ZIKV infection in neurons, we next tested whether RIPK3 overexpression would result in increased expression of the antimicrobial molecules identified by our microarray analysis. RIPK3-overexpressing _Ripk3_-2xFVfl/fl _Mox2-_Cre+ neurons exhibited increased induction of all five transcripts compared to Cre− control cultures (Figure 5H). We next tested whether RIPK3 activation alone, in the absence of other immune signals, was sufficient to drive expression of our target genes. We thus analyzed gene expression in uninfected _Ripk3_-2xFVfl/fl _Mox2-_Cre+ neurons after enforcing RIPK3 activation via AP1 administration. AP1 treatment significantly induced expression of both Irg1 and Gbp4 in _Ripk3-_2xFVfl/fl _Mox2-_Cre+ neurons, but not in Cre− controls, while Tgtp1, Ifi44, Ifi47 were not induced by AP1 administration in cultures of either genotype (Figure 5I). Together, these data suggest that a ZBP1-, RIPK1-, and RIPK3-dependent transcriptional program in neurons includes robust induction of a number of antimicrobial molecules.
IRG1 expression controls neurotropic flavivirus infection
To test whether any of the genes identified by our expression analysis exhibited anti-ZIKV activity, we used siRNA pools to knockdown each gene in primary neurons, which we confirmed via qPCR (Figure S5A). Knockdown of Irg1 significantly enhanced ZIKV replication compared to cultures receiving a nontargeting siRNA pool (Figure 6A), while knockdown of Gbp4, Tgtp1, Ifi44, and Ifi47 did not, identifying IRG1 expression as a potential mechanism underlying the anti-ZIKV activity of RIPK3. To test this idea, we performed siRNA-mediated knockdown of Irg1 in RIPK3 overexpressing _Ripk3_-2xFVfl/fl _Mox2-_Cre+ neuronal cultures. While, as expected, overexpression of RIPK3 decreased ZIKV replication in cultures receiving a nontargeting siRNA pool, knockdown of Irg1 abrogated this effect of RIPK3 overexpression (Figure 6B), suggesting that IRG1 is required for the anti-ZIKV activity of RIPK3 in neurons.
Figure 6: IRG1 restricts neurotropic flavivirus infection.

(A) WT B6/N primary cortical neurons were treated for 48h with siRNA pools (4 siRNAs per pool) targeted against indicated genes or a nontargeting control pool (Scr). Neurons were then infected with ZIKV-MR766 (MOI 0.1). Viral titers in supernatants at 24h post infection were quantified via plaque assay. N= 4 independent replicates.
(B) Primary cortical neurons derived from _Ripk3_-2xFVfl/fl _Mox2-_Cre+ mice or Cre− littermate controls were treated for 48h with an siRNA pool targeted against Irg1 or a nontargeting control pool (Scr). Cultures were then infected with ZIKV-MR766 (MOI 0.1) and viral titers in supernatants were measured at indicated hours post infection (hpi). N= 4 independent replicates.
(C) Cortical neuron cultures as in (A) were treated with siRNA pools targeted against indicated transcription factors. Neurons were then infected with ZIKV-MR766 (MOI 0.1) and Irg1 expression was assayed via qPCR. N= 4 independent replicates.
(D-E) Ripk3 −/− or B6/N cortical neurons were infected at MOI 10.0 with ZIKV-MR766 for 4h. Nuclear translocation of IRF1 was assayed via immunocytochemical staining. Data are quantified as normalized arbitrary colocalized signal between IRF1 (green) and cell nuclei (blue). Images are representative of at least 3 high power fields taken from each of 4 independent replicates. Scale bar= 20μm.
(F) Survival analysis in Irg1 −/− mice and congenic controls following intracranial inoculation with ZIKV-MR766. N= 15–18 mice/genotype.
(G) _Irg1_−/− mice and congenic WT controls were infected intracranially with ZIKV-MR766. On indicated days following infection, whole brains were assayed for ZIKV titers via plaque assay.
(H) Multistep viral growth curve analysis (MOI 0.1, ZIKV MR-766) in primary cortical neurons isolated from Zbp1 −/− mice or congenic controls. N= 4 independent replicates.
(I) B6/N mice were infected subcutaneously with WNV-TX and brains harvested on indicated days following infection. Irg1 expression was assayed in whole brain homogenates via qPCR. N=6 mice/time point.
(J-K) B6/N or Irg1 −/− mice were infected with WNV-TX as in (I) and monitored for survival (J) or clinical signs of disease (L). N=15 mice/genotype.
(L) Viral burden in brains of mice as in (J-K) were assayed via plaque assay on day 8 following infection with WNV-TX.
(M) Primary human neuroblastoma lines (NB8, NB15, and NB16) were differentiated into neuron-like cells. Human IRG1 mRNA expression was measured via qRT-PCR 24h following infection with ZIKV-MR766 (MOI 0.1). Prior to infection, cultures were pretreated for 2h with the human RIPK3 inhibitor GSK 872 or DMSO vehicle. N= 4 independent replicates.
(N) Neuroblastoma lines as in (M) were treated with an siRNA pool targeted against human IRG1 or a nontargeting control pool (Scr) for 48h. Multistep growth curve analysis was then performed following infection with ZIKV-MR766 (MOI 0.1). N= 4 independent replicates.
*p<0.05, **p<0.01, ***p<0.001. Error bars represent SEM. Dotted lines indicate limits of detection. All data are pooled from two or three independent experiments. See also Figure S5.
We next sought to determine the signaling mechanism by which RIPK3 activity induces expression of Irg1 following ZIKV infection. While RIPK1 and RIPK3 have been shown to drive NF-κB-dependent transcriptional programs in a variety of cell types, knockdown of the NF-κB subunit RelA did not impact Irg1 expression in ZIKV infected neurons (Figure 6C), nor was nuclear translocation of RelA altered following infection in Ripk3 −/− neurons (Figure S5C), suggesting that RIPK activity drives Irg1 expression independently of NF-κB. A previous report using gene network modeling identified IRF1 as a key transcriptional regulator of IRG1 expression (Tallam et al., 2016). Thus, we performed siRNA-mediated knockdown of Irf1 in neurons, which abolished upregulation of Irg1 expression following ZIKV infection (Figure 6C). Nuclear translocation of IRF1 was also significantly decreased in Ripk3 −/− neurons following ZIKV infection (Figure 6D-E). These data suggest that IRF1-dependent transcription drives Irg1 expression downstream of RIPK activation during neuronal ZIKV infection.
To establish whether IRG1 expression restricts ZIKV pathogenesis, we performed intracranial infection experiments in mice lacking IRG1 expression. _Irg1_−/− mice exhibited both enhanced mortality (Figure 6F) and increased brain viral burden (Figure 6G) following infection compared to WT controls. Multistep growth curve analysis also revealed enhanced ZIKV replication in _Irg1_−/− primary neurons (Figure 6H); however, while treatment with the RIPK3 inhibitor GSK 843 enhanced viral replication in WT neuronal cultures, it failed to induce any additional increase in viral replication in _Irg1_−/− cultures, further suggesting that the antiviral activity of RIPK3 acts via IRG1-dependent mechanisms. In contrast to our findings in neurons, ZIKV infection did not significantly induce Irg1 expression in primary BMDM or microglial cultures (Figure S5D), and, while Irg1 expression could be induced in these cell types following treatment with LPS, this upregulation was RIPK3-independent. Moreover, we observed no differences in ZIKV replication in _Irg1_−/− BMDM cultures compared to WT controls (Figure S5E).
We next questioned why RIPK3 activity was necessary for neuronal Irg1 expression following infection with ZIKV but not WNV (Figure S4C). We hypothesized that additional innate immune signals may drive redundant and/or compensatory Irg1 expression in RIPK3-deficient neurons during WNV infection. To test this, we performed siRNA-mediated knockdown of major components of the pattern recognition receptor (PRR) pathways known to sense flavivirus infection in neurons, including the PRRs TLR3, TLR7, RIG-I (Ddx58), and MDA5 (Ifih1), as well as the adaptor molecules TRIF (Ticam1), MyD88, and MAVS (Figure S5F). Only knockdown of TLR7 and its adaptor MyD88 significantly reduced Irg1 expression in WNV-infected neurons, and this reduction was further augmented in _Ripk3_−/− neurons (Figure S5G). These data suggest that both TLR7/MyD88- and RIPK3-dependent signals drive Irg1 expression in WNV-infected neurons, and that the requirement of RIPK3 activity to drive neuronal Irg1 transcription is likely dependent on the unique innate immune programs elicited by distinct neurotropic pathogens.
While RIPK3 was not absolutely required to drive neuronal Irg1 expression during WNV infection, we nevertheless questioned whether IRG1 could restrict neuroinvasive WNV infection. We confirmed that Irg1 expression was induced in vivo in the brains of WT mice following subcutaneous infection with WNV (Figure 6I). Irg1 −/− mice exhibited enhanced mortality (Figure 6J) and increased signs of neurologic disease (Figure 6K) compared to WT controls, as well as higher brain viral burden following subcutanous WNV infection (Figure 6L). Multistep growth curve analysis confirmed that WNV replication was enhanced in _Irg1_−/− neurons compared to WT controls (Figure S5H), while WNV replication was not impacted in _Irg1_−/− BMDMs (Figure S5I), similar to our findings with ZIKV. These data demonstrate that IRG1 exerts antiviral activity against distinct neurotropic flaviviruses in vitro and limits their pathogenesis in vivo.
We next questioned if IRG1 also exerted antiviral activity in human neural lineage cells. ZIKV infection induced upregulation of IRG1 expression in all three differentiated primary neuroblastoma lines in our study (Figure 6M), and this upregulation could be blocked in the presence of the human RIPK3 inhibitor GSK 872. To test whether human IRG1 impacted viral replication, we performed siRNA-mediated knockdown of IRG1 in each line (Figure S5J). Knockdown of IRG1 resulted in enhanced ZIKV replication in all three neuroblastoma lines (Figure 6N). Together, these data demonstrate that induction of IRG1 expression downstream of RIPK3 restricts ZIKV replication in both murine and human neural lineage cells; however, this signaling axis does not appear to be engaged in myeloid cells of either peripheral or CNS origin.
RIPK3 activation induces an antiviral metabolic state in neurons via IRG1
We next sought to identify mechanisms by which IRG1 activity restricts ZIKV infection in neurons. The metabolic product of IRG1, itaconate, has previously been shown to exert immunoregulatory activity in macrophages via activation of the transcription factor Nrf2 (Mills et al., 2018). However, we did not observe significant induction of known Nrf2 targets in our microarray analysis in either WT or _Ripk3_−/− neurons (Figure S6A-B). Further qPCR analysis also showed no differences in expression of the canonical Nrf2 targets Nqo1 (Figure S6C), Gclm (Figure S6D), and Hmox1 (Figure S6E) in _Ripk3_−/− or _Irg1_−/− neurons compared to WT controls, suggesting that modulation of Nrf2-dependent gene expression does not underlie the antiviral activity of IRG1 in neurons. We next questioned whether direct exposure to itaconate could inactivate ZIKV particles. To test this, we used a cell-free system in which a known concentration of ZIKV was incubated for 2h at 37°C in buffered media containing itaconate and tested for infectivity via standard plaque assay. Incubation with itaconate at neutral pH did not significantly neutralize ZIKV particles at any concentration tested (Figure S6F). While ZIKV samples were completely neutralized after incubation at low pH, this effect was not specific to itaconate, as identical results were obtained following incubation with another organic acid, citrate (Figure S6G). These data suggest that the antiviral activity of IRG1 is not likely mediated via direct viral neutralization by itaconate.
Itaconate has also been shown to modulate cellular metabolism via competitive inhibition of SDH, a component of both the TCA cycle and Complex II of the electron transport chain. Inhibition of SDH by itaconate in macrophages has been shown to alter both cellular metabolism and immune function due to an accumulation of intracellular succinate (Cordes et al., 2016; Lampropoulou et al., 2016). We thus performed comparative metabolomic analysis to assess the impact of RIPK3 and IRG1 on neuronal metabolism following ZIKV infection. Principle component analysis of metabolite concentrations showed distinct separation of infected WT neurons compared to both mock infected samples and infected _Ripk3_−/− or _Irg1_−/− samples (Figure 7A). Further analysis revealed that WT neurons underwent substantial metabolic changes in response to ZIKV infection (Figure S7A), exhibiting significantly different concentrations of 40 distinct metabolites compared to mock infected controls (Figure 7B). In contrast, neuronal metabolism was less strikingly altered in infected _Ripk3_−/− or _Irg1_−/− neurons, which exhibited only 10 and 21 differentially regulated metabolites, respectively.
Figure 7: IRG1 alters neuronal metabolism during ZIKV infection via production of itaconate.

(A) Principle component analysis following metabolomic profiling of primary cortical neurons isolated from Ripk3 −/− or Irg1 −/− mice or congenic controls at 24h post infection with ZIKV-MR766 (MOI 0.1).
(B) Expression profiles of 294 metabolites in cultures described in (A). Significant differences (>1.5 fold change, p<0.05) are noted in red (upregulated metabolites) or blue (downregulated metabolites).
(C-D) Relative ion intensities of indicated metabolites in cultures described in (A). (AUs: arbitrary units). N= 3 independent replicates.
(E) SDH activity in lysates derived from B6/N, Ripk3 −/−, or Irg1 −/− primary cortical neurons at 24h following infection with ZIKV-MR766 (MOI 0.1). Cultures were pretreated for 2h with medium containing itaconate or saline vehicle prior to infection. N= 4 independent replicates.
(F) Extracellular oxygen consumption rate (OCR) over 1h following 24h infection in neuronal cultures as described in (G). N= 4 independent replicates.
(G) B6/N, Ripk3 −/−, or Irg1 −/− primary cortical neurons were infected with ZIKV-MR766 (MOI 0.1) following 2h pretreatment with media containing malonate, lonidamine, or DMSO vehicle. Viral titers in supernatants were measured via plaque assay. N= 4 independent replicates.
(H) B6/N, Ripk3 −/−, or Irg1 −/− primary cortical neurons were infected with ZIKV-MR766 (MOI 10.0) following 2h pretreatment with media containing itaconate, citrate, or saline vehicle. Viral titers in supernatants at 24h post infection were measured via plaque assay. N= 4 independent replicates.
(I-K) Mice of the indicated genotype were incranially infected with ZIKV-MR766 (I-J) or WNV-TX (K) and viral titers were measured via plaque assay in whole brain homogenates 2 days following infection. For all animals, infection happened concurrently with intracranial administration of 4-octyl (4-O) itaconate or DMSO vehicle.
(L-M) WT B6/N mice were infected intracranially with ZIKV-MR766 (L) or WNV-TX (M) and brain viral burden was measured as in (I-K). Concurrent with infection, mice received intracranial administration of dimethylmalonate (DMM) or saline vehicle.
(N) Mice of the indicated genotype were incranially infected with ZIKV-MR766 and monitored for survival. Mice received one intracranial administration of 4-O itaconate or DMSO vehicle concurrently with infection, with a second administration on day 4 following infection. N= 10–12 mice per genotype and treatment group.
*p<0.05, **p<0.01, ***p<0.001. Error bars represent SEM. Data in (E-N) are pooled from two or three independent experiments. See also Figure S6 and Figure S7.
As expected, we observed significantly higher concentrations of itaconate in infected WT neurons compared to controls (Figure 7C), while infection failed to increase itaconate concentrations in either _Ripk3_−/− or _Irg1_−/− neurons. We also observed significant accumulation of succinate in infected WT neurons (Figure 7D), suggesting that production of itaconate during ZIKV infection did lead to inhibition of SDH. In support of this, we observed decreased concentrations of fumarate (Figure S7B) and malate (Figure S7C), the immediate downstream products of succinate oxidation, in infected WT neurons, while concentrations of the more distant TCA cycle intermediate citrate were unchanged (Figure S7D). Concentrations of succinate, fumarate, and malate were not significantly altered by infection in either _Ripk3_−/− or _Irg1_−/− neurons (Figure 7D, Figure S7B-C), further suggesting that RIPK3- and IRG1-dependent production of itaconate was required for this effect.
To confirm the impact of itaconate on neuronal SDH activity, we next measured rates of succinate oxidation directly in neurons following infection and/or treatment with exogenous itaconate. ZIKV infection of WT neurons resulted in significantly decreased rates of succinate oxidation (Figure 7E), while this effect was not observed in _Ripk3_−/− or _Irg1_−/− neurons. In contrast, treatment with exogenous itaconate inhibited succinate oxidation irrespective of genotype. As the relative permeability of different cell types to extracellular itaconate is unclear (Cordes et al., 2016; Mills et al., 2018; Nair et al., 2018), we performed identical experiments using the highly cell-permeable itaconate derivative 4-octyl (4-O) itaconate (Mills et al., 2018) and observed similar results (Figure S7E). We also observed decreased rates of extracellular oxygen consumption in infected WT neurons, but not in infected _Ripk3_−/− or _Irg1_−/− neurons, while treatment with itaconate decreased the rate of oxygen consumption in neurons of each genotype (Figure 7F). Together, these data suggest that RIPK3- and IRG1-mediated production of itaconate following ZIKV infection alters neuronal metabolism via inhibition of SDH activity, impacting both TCA cycle and electron transport chain function.
To test whether inhibition of SDH is sufficient to restrict ZIKV replication, we treated neurons with a competitive inhibitor of SDH activity, dimethyl malonate (DMM). DMM treatment both reduced rates of succinate oxidation (Figure S7F) and significantly inhibited ZIKV replication (Figure 7G) in WT, _Ripk3_−/−, and _Irg1_−/− neuronal cultures. Treatment with the the succinate-ubiquinone reductase inhibitor lonidamine also significantly inhibited ZIKV replication in neurons (Figure 7G), further confirming the antiviral effect of decreased SDH activity. To further characterize the mechanism of viral restriction arising from these processes, we pretreated neurons with either itaconate or citrate, followed by a high MOI (10.0) infection with ZIKV in order to analyze the virologic status of neurons in the context of uniform infection and a synchronous replication cycle. At 4h following infection, we detected equivalent copy numbers of ZIKV RNA in cell pellets of neurons irrespective of genotype or treatment (Figure S7G), suggesting that itaconate does not inhibit the steps of viral attachment or entry. However, at 24h post infection, we observed significantly higher copy numbers of viral RNA in cell pellets obtained from both _Ripk3_−/− and _Irg1_−/− neurons compared to WT, and these increased viral RNA copy numbers could be rescued in the presence of exogenous itaconate, but not citrate (Figure S7H). Analysis of infectious virus in culture supernatants at 24h post infection also revealed significantly higher viral titers in _Ripk3_−/− and _Irg1_−/− cultures, which were similarly rescued by itaconate, but not citrate, treatment (Figure 7H). To test if the decreased titers of infectious virus in the supernatants of itaconate-treated neurons were due to increased production of defective interfering particles, we compared PFU values to viral RNA genome copies obtained from matched supernatant samples. This analysis revealed no change to the genome copy/PFU ratio across genotypes and treatment groups (Figure S7I). Similarly decreased viral titers and unchanged genome/PFU ratios were observed in identical experiments using 4-O itaconate (Figure S7J-K). Together, these data suggest that the antiviral effects of itaconate do not arise from changes to the infectious potential of ZIKV particles; rather, changes to neuronal metabolism appear to exert a global suppression on replication of the viral genome, resulting in a concomitant decrease in the extracellular release of infectious particles.
To establish whether itaconate could restrict viral replication and pathogenesis in vivo, we next performed experiments in which mice were intracranially injected with ZIKV and 4-O itaconate concurrently. 4-O itaconate significantly reduced brain viral burden in WT mice and rescued the increased viral burden observed in Ripk3 −/− and Irg1 −/− mice (Figure 7I). Similarly, 4-O itaconate treatment also rescued the enhanced viral burden observed in _Ripk3_fl/fl _CamKIIα-_Cre+ mice following intracranial ZIKV infection (Figure 7J). To test whether itaconate also exerted CNS-intrinsic antiviral activity against WNV, we performed identical experiments in the context of intracranial WNV infection. Vehicle-treated Irg1 −/− mice exhibited significantly enhanced viral burden compared to WT controls, and this enhanced viral burden was rescued by administration of 4-O itaconate (Figure 7K). Similar experiments using intracranial injection of DMM confirmed that inhibition of SDH activity was sufficient to reduce viral burden following both intracranial ZIKV (Figure 7L) and WNV (Figure 7M) infection. 4-O itaconate treatment also significantly extended and enhanced survival in _Ripk3_fl/fl _CamKIIα-_Cre+ mice compared to those receiving vehicle treatment (Figure 7N). Together, these data suggest that inhibition of SDH activity by itaconate restricts flavivirus replication and ameliorates viral pathogenesis in the CNS in vivo, identifying IRG1 as a key antiviral effector molecule during neuroinvasive flavivirus infection.
Discussion
Our data indicate that IRG1 is a key target of a ZBP1-, RIPK1-, and RIPK3-dependent transcriptional program leading to ZIKV restriction in neurons, though the full nature of this program remains to be elucidated. While RIPK activation is a canonical inducer of NF-κB-dependent transcription (Orozco and Oberst, 2017), our data suggest that RIPK activity induces neuronal Irg1 expression via IRF1 and independently of NF-κB. IRF1 was previously identified by gene network modeling as a key regulator of IRG1 expression, and genetic silencing of IRF1 expression has been shown to suppress IRG1 expression in macrophages (Tallam et al., 2016). Our data suggest that IRF1 may be a previously unappreciated mediator of RIPK-dependent transcription in neurons.
We previously reported that neuronal RIPK3 signaling during WNV infection led to chemokine production and protective neuroinflammation, without exerting cell-intrinsic restriction of viral replication (Daniels et al., 2017). Our current findings show that, while RIPK3 is required for IRG1 expression during neuronal ZIKV infection, RIPK3-dependent induction of IRG1 in the context of neuronal WNV infection was only unmasked following knockdown of the TLR7/MyD88 axis. While TLR7 and MyD88 have been shown to restrict WNV neuropathogenesis (Szretter et al., 2010; Town et al., 2009), TLR signaling has thus far been reported to be less important for control of ZIKV infection (Piret et al., 2018; Yockey et al., 2016). Thus, differential activation of PRR signaling may underlie virus-specific engagement of IRG1 expression. While the mechanisms that shape pathogen-specific features of these responses in neurons require further investigation, our study nevertheless identifies IRG1 as a potent antiviral effector molecule that restricts replication of two distinct neurotropic flaviviruses.
We did not observe IRG1 upregulation upon ZIKV infection of microglia or BMDM cultures, and loss of IRG1 in the latter had no effect on ZIKV replication. Another recent report found also found no overt phenotype in _Irg1_−/− mice infected intranasally with influenza A virus (Nair et al., 2018). These findings suggest that metabolic reprogramming via IRG1 may represent an antiviral strategy that is engaged preferentially in neurons. Why evolution has favored this strategy in neurons remains an open question. One possibility is that the intrinsic resistance of neurons to traditional forms of pathogen control such as programmed cell death (Kole et al., 2013) necessitate alternative innate antiviral strategies. Another, non-exclusive possibility is that metabolic strategies for pathogen restriction avoid immunopathology in a highly sensitive organ system (Klein and Hunter, 2017).
Itaconate has received significant recent attention as a key link between metabolism and immune state in macrophages responding to bacterial infection (Lampropoulou et al., 2016; Michelucci et al., 2013; Nair et al., 2018). In this context, itaconate has been proposed to have direct bacteriostatic activity (Michelucci et al., 2013; Naujoks et al., 2016), as well as anti-inflammatory transcriptional effects through modulation of the Nrf2/Keap1 pathway (Mills et al., 2018). In the context of neuronal ZIKV infection however, we observe neither direct antiviral effects of itaconate, nor RIPK3- or IRG1-depedent modulation of Nrf2-responsive genes. These findings likely highlight tissue- and pathogen-specific effects of this metabolite. However, we did find that supraphysiological activation of the IRG1-itaconate pathway via RIPK3 overexpression, or direct administration of a cell-permeable derivative of itaconate, restricted ZIKV replication in vitro and promoted survival following intracranial ZIKV challenge in vivo. These findings suggest that interventions that enhance neuronal IRG1 expression and/or itaconate concentrations within the CNS could present novel therapeutic strategies for the treatment of neuroinvasive viral infections.
STAR METHODS
CONTACT FOR REAGENT AND RESOURCE SHARING
Requests for resources and reagents should be directed to and will be fulfilled by the Lead Contact, Andrew Oberst (oberst@uw.edu).
EXPERIMENTAL MOEL AND SUBJECT DETAILS
Mice
Ripk3 −/−, Mlkl_−/−, Casp8_−/−, RIPK1 KD/KD , Zbp1 −/− , Mavs −/− , Tlr3 −/−, Irg1 −/− (Jackson Laboratories 029340), RIPK3–2xFVfl/fl, _Mox2_-Cre (Jackson Laboratories 003755), and _CamKIIα_-Cre (Jackson Laboratories 005359) mice in this study were bred and housed under specific-pathogen free conditions at the University of Washington. C57BL/6NJ (B6/N) and C57BL/6J (B6/J) controls were either obtained commercially (Jackson Laboratories) or, for control animals in experiments using transgenic mouse strains, WT mice were bred in-house. Ripk3 −/− and Irg1 −/− animals were congenic to the C57BL/6NJ background, while all other strains were congenic to the C57BL/6J background. All transgenic mouse strains in this study were backcrossed >10 generations to their respective WT background strains. All mouse studies were performed in 5–6 week old (ZIKV studies) or 8 week old (WNV studies) animals of both sexes, following protocols approved by the University of Washington Animal Care and Use Committee (IACUC).
Viruses and virologic assays
ZIKV strain MR766 was provided by the World Reference Center for Emerging Viruses and Arboviruses (WRCEVA). The Brazilian strain ZIKV-Fortaleza (GenBank accession number KX811222) was isolated from a human microcephaly case in 2015 (Grant et al., 2016). WNV strain TX 2002-HC (WNV-TX) (Keller et al., 2006) was plaque purified and passaged twice before use in this study. Viral titers of stocks and experimental samples were performed via plaque assay on Vero cells (African Green Monkey epithelial cells) as previously described with WNV (Brien et al., 2013), with modifications for ZIKV. For plaque assays, serial dilutions of ZIKV-containing samples were added to 70% confluent Vero monolayers and incubated at 37C for 2h. Vero monolayers were then rinsed 3 times in sterile PBS, then overlayed with 2% LMP Agarose in MEM. Cultures were then incubated at 37C for 4d, followed by fixation for 1 hour in 4% paraformaldehyde and staining with crystal violet. Viral stocks were generated by infecting Vero cells (MOI 0.01) and harvesting supernatants at 72h.
Cell culture and infections
Primary macrophage and dendritic cell cultures were generated from bone marrow as described (Szretter et al., 2010), with modifications. Briefly, macrophages were differentiated in 40 ng/ml M-CSF (Peprotech), while DCs were differentiated in 40 ng/ml GM-CSF and 40 ng/ml IL-4 (Peprotech). Primary microglial cultures were generated from P1-P3 embryos as described (Williams et al., 2014). Primary cerebral cortical neurons were generated using E15 embryos as described (Daniels et al., 2017). All primary mouse cells were generated using pooled tissues derived from both male and female animals. Human neuroblastoma cell lines NB8, NB15, NB16 were maintained in a 1:1 mixture of DMEM and Ham’s F-12 Nutrient Mix (ThermoFisher). Neuroblastoma cells were differentiated into neuron-like cells by supplementing culture medium with 10μm all-trans retinoic acid (Sigma-Aldrich) and 50ng/ml recombinant human BDNF (Peprotech), as described (Daniels et al., 2017). The sex of the original donors for the neuroblastoma cell lines used in this study is not available. For ZIKV infection experiments, macrophage, microglia, and dendritic cell cultures were infected at MOI 1.0, while primary neurons and neuroblastoma cultures were infected at MOI 0.1, unless otherwise noted. Primary neuronal cultures infected with WNV-TX were at infected at MOI 0.001, while BMDM cultures were infected at MOI 0.01.
METHOD DETAILS
Cell death assays
Cell viability was evaluated using a cell impermeable dye (Sytox Green, Life Technologies) and a 2-color IncuCyte Zoom in-incubator imaging system (Essen Biosciences), as described (Daniels et al., 2017; Orozco et al., 2014). Briefly, dead cells were detected by measuring uptake of the cell impermeable dye Sytox Green (Life Technologies). Cell death was quantified as a percent of Sytox+ cell nuclei out of total cell nuclei (Syto Green+) in culture.
Mouse infections and intracranial injections
Subcutaneous infections were performed by injection of 103 PFU ZIKV or 102 PFU WNV in 50 μl of HBSS into a rear footpad. For intracranial infection, 103 PFU ZIKV or 101 PFU WNV was injected in 5 μl of HBSS into the third cerebral ventricle with a guided 29G needle. For studies in which intracranial infection was paired with administration of RIPK inhibitors, 4-octyl itaconate, or dimethyl malonate, viral inocula and drug treatments were prepared in the same 5 μl bolus to minimize injection volumes. Infected mice were weighed and monitored daily for clinical signs of disease, as described (Daniels et al., 2017). Mice appearing moribund or losing more than 20% of initial body weight were euthanized.
Tissue preparation
Mouse tissues harvested for qRT-PCR or virologic analysis were extracted following cardiac perfusion with 30 mls of sterile PBS. Extracted tissues were weighed and homogenized using 1.0 mm diameter zirconia/silica beads (Biospec) in sterile PBS or RA1 lysis buffer (for RNA isolation, Macherey-Nagel).
Gene expression analysis
Viral RNA in serum was isolated using a Viral RNA Mini Kit (Qiagen). Total RNA from tissues and cell cultures was isolated using a Nucleospin RNA Kit (Macherey-Nagel). cDNA was synthesized using oligo(dT) random hexamers and SuperScript III Reverse Transcriptase (Life Technologies). Fluorogenic quantitative reverse transcriptase PCR (qRT-PCR) analysis was performed using Sybr Green reagents and a ViiA 7 Real-Time PCR System (Applied Biosystems). Primer sequences for gene targets in this study are listed in Table S1. Cycle threshold (CT) values for analyzed genes were normalized to CT values of the housekeeping gene Gapdh (CTTarget – CT_Gapdh_ = ΔCT). Some data were additionally normalized to baseline control values (ΔCTexperimental – ΔCTcontrol = ΔΔCT. Viral transcript data were normalized against a standard curve of known viral titers to generate PFU-equivalent values. Microarray analysis was conducted using Agilent Whole Mouse Genome arrays (Agilent Technologies) according to manufacturer’s instructions.
siRNA knockdowns
Primary neuron or neuroblastoma cultures were treated with 25nM siRNA SMARTpools against target genes or a nontargeting control pool (ON-TARGET_plus_, ThermoScientific). siRNA pools were delivered in a 1:500 dilution of DharmaFect 1 transfection reagent (ThermoScientific) in antibiotic-free culture medium for 48 hours. Following siRNA treatment, cells were rinsed and returned to normal culture medium for further experimentation.
Immunofluorescence staining and analysis
Fluorescent immunohistochemistry and immunocytochemistry were performed following fixation in 4% paraformaldehyde and blocking in 10% goat serum, as described (Williams et al., 2014). The following primary antibodies: rabbit anti-mCherry (Rockland, 600–401-P16), chicken anti-MAP2 (Abcam, ab5392), rat anti GFAP (ThermoFisher, 13–0300), rabbit anti-RIPK3 (Genentech), rat anti-phospho RIPK3 (Genentech), rabbit anti-IRF1 (Cell Signaling Technology, 8478S), rabbit anti-RelA (Abcam, ab16502). Secondary detection was performed with the following antibodies: goat anti-rabbit 594 (ThermoFisher, A-11012), goat anti-chicken 488 (ThermoFisher, A-11039), goat anti-rabbit 488 (Abcam, ab150077), goat anti-rat 594 (Abcam ab150160). Nuclei were visualized via staining with DAPI (ThermoFisher). Images were analyzed with ImageJ software.
Metabolic Analyses
SDH activity was measured in neuronal cultures using a Succinate Dehydrogenase Assay Kit (Sigma MAK197) according to manufacturer’s instructions. Oxygen consumption rates were measured in neuronal cultures using an Extracellular Oxygen Consumption Assay (Abcam, ab197243) according to manufacturer’s instructions. For metabolomic analysis, polar metabolites were extracted from neuronal cultures by scraping in ice cold 80% methanol and concentrated using a vacuum concentrator, as described (Gao et al., 2018). Metabolite concentrations were quantified using combined mass spectrometry and hydrophilic interaction liquid chromatography as described (Liu et al., 2014). Briefly, an Xbridge amide column was employed for compound separation at room temperature. The mobile phase A was 20 mM ammonium acetate and 15 mM ammonium hydroxide in water with 3% acetonitrile, pH 9.0. Mobile phase B was acetonitrile. The flow rate was 0.15 mL/min from 0 to 10 min and 15 to 20 min and 0.3 mL/min from 10.5 to 14.5 min. Raw data collected from the LC-QE-MS were processed on Sieve 2.0 (Thermo Scientific). Peak alignment and detection were performed according to manufacturer protocols
Chemical reagents
The following chemical reagents were used in cell culture experiments: LPS-EB Ultrapure (1 μg/ml, Invivogen), zVAD (50 μm, SM Biochemicals), GSK 963 (100nM, GlaxoSmithKline), GSK 843 (100nM, GlaxoSmithKline), GSK 872 (100nM, GlaxoSmithKline), AP1 (100 nM, ClonTech, sold as “B/B Homodimerizer”), itaconate (1mM, Sigma), citrate (1mM, Sigma), dimethyl malonate (1mM, Sigma), 4-octyl itaconate (1mM, provided by Luke O’Neill, Trinity College, Dublin). For in vivo intracranial injections, the following concentrations were used: GSK 963 and GSK 843, 800nM; dimethyl malonate and 4-octyl itaconate, 8mM.
QUANTIFICATION AND STATISTICAL ANALYSIS
Survival experiments were analyzed via log-rank test. ZIKV titers in mouse tissues were analyzed via nonparametric Mann-Whitney U test. All other experiments were compared with parametric tests, including 2-tailed student’s t-test or 2-way ANOVA, with appropriate corrections for repeated measures and multiple comparisons. Principle component analysis was performed with MetaboAnalyst software (metaboanalyst.ca). Other statistical analyses were performed using GraphPad Prism software.
DATA AND SOFTWARE AVAILABILITY
Raw data are available upon request to the Lead Contact. No proprietary software or algorithms were used in this study. Raw microarray data have been deposited in NCBI’s Gene Expression Omnibus and can be accessed under accession number GSE122121.
ADDITIONAL RESOURCES
The following resources were used under material transfer agreement (MTA): _Mlkl_−/− mice (Walter and Elizabeth Hall Institute, Australia), _Casp8_−/− mice (University of California, San Diego), _Ripk3_−/− mice (GlaxoSmithKline), _Ripk1_KD/KD mice (GlaxoSmithKline), _Ripk3_fl/fl mice (Genentech), GSK inhibitors (GlaxoSmithKline), total and phosphorylated RIPK3 antibodies (Genentech), 4-octyl itaconate (University of Edinburgh), and neuroblastoma cell lines NB8, NB15, and NB16 (St. Jude Children’s Research Hospital).
Supplementary Material
1
2
Highlights:
- Components of the necroptotic cell death pathway limit neuronal Zika virus infection.
- Viral control is due to cell-intrinsic limitation of viral growth, not cell death.
- Upregulation of the metabolic enzyme IRG1 in neurons underlies viral restriction.
- Itaconate, the product of IRG1, induces an antiviral metabolic state in neurons.
Acknowledgements
The authors thank Pooja Ralli-Jain and Tayla Olsen for technical assistance. We thank Kevin Gerrish and Rick Fannin in the Molecular Genomics Core at the National Institute of Environmental Health Sciences for microarray support, John Bertin (GlaxoSmithKline) for providing RIPK1 and RIPK3 inhibitors and _Ripk1_KD/KD mice used in this study, and Luke O’Neill (Trinity College, Dublin) for providing 4-octyl itaconate. This work was supported by NIH grants R01 AI132595 (AO), R21 NS101542 (AO), U19 AI083019 (MG), F32 AI129254 (BPD), T32 GM007270 (SBK and AGS), and the NIH Intramural Research Program ZIA ES10328601 (JM). AGS was also supported by a National Science Foundation Graduate Research Fellowship (DGE-1256082). XG was supported by a fellowship from the Canadian Institutes of Health Research (reference number 146818).
Footnotes
Declaration of Interests
Drs. Daniels and Oberst hold a provisional patent describing the use of itaconate as an antiviral molecule in the context of neuroinvasive infection.
Publisher's Disclaimer: This is a PDF file of an unedited manuscript that has been accepted for publication. As a service to our customers we are providing this early version of the manuscript. The manuscript will undergo copyediting, typesetting, and review of the resulting proof before it is published in its final citable form. Please note that during the production process errors may be discovered which could affect the content, and all legal disclaimers that apply to the journal pertain.
References
- Bambouskova M, Gorvel L, Lampropoulou V, Sergushichev A, Loginicheva E, Johnson K, Korenfeld D, Mathyer ME, Kim H, Huang LH, et al. (2018). Electrophilic properties of itaconate and derivatives regulate the IkappaBzeta-ATF3 inflammatory axis. Nature 556, 501–504. [DOI] [PMC free article] [PubMed] [Google Scholar]
- Brien JD, Lazear HM, and Diamond MS (2013). Propagation, quantification, detection, and storage of West Nile virus. Current protocols in microbiology 31, 15D 13 11–15D 13 18. [DOI] [PubMed] [Google Scholar]
- Cho H, Proll SC, Szretter KJ, Katze MG, Gale M Jr., and Diamond MS (2013). Differential innate immune response programs in neuronal subtypes determine susceptibility to infection in the brain by positive-stranded RNA viruses. Nat Med 19, 458–464. [DOI] [PMC free article] [PubMed] [Google Scholar]
- Cho YS, Challa S, Moquin D, Genga R, Ray TD, Guildford M, and Chan FK (2009). Phosphorylation-driven assembly of the RIP1-RIP3 complex regulates programmed necrosis and virus-induced inflammation. Cell 137, 1112–1123. [DOI] [PMC free article] [PubMed] [Google Scholar]
- Cordes T, Wallace M, Michelucci A, Divakaruni AS, Sapcariu SC, Sousa C, Koseki H, Cabrales P, Murphy AN, Hiller K, et al. (2016). Immunoresponsive Gene 1 and Itaconate Inhibit Succinate Dehydrogenase to Modulate Intracellular Succinate Levels. J Biol Chem 291, 14274–14284. [DOI] [PMC free article] [PubMed] [Google Scholar]
- Costa F, and Ko AI (2018). Zika virus and microcephaly: where do we go from here? Lancet Infect Dis 18, 236–237. [DOI] [PubMed] [Google Scholar]
- Coyne CB, and Lazear HM (2016). Zika virus - reigniting the TORCH. Nature reviews Microbiology 14, 707–715. [DOI] [PubMed] [Google Scholar]
- Daniels BP, Snyder AG, Olsen TM, Orozco S, Oguin TH 3rd, Tait SW, Martinez J, Gale M Jr., Loo YM, and Oberst A (2017). RIPK3 Restricts Viral Pathogenesis via Cell Death-Independent Neuroinflammation. Cell 169, 301–313 e311. [DOI] [PMC free article] [PubMed] [Google Scholar]
- Dragatsis I, and Zeitlin S (2000). CaMKIIalpha-Cre transgene expression and recombination patterns in the mouse brain. Genesis 26, 133–135. [DOI] [PubMed] [Google Scholar]
- Gao X, Lee K, Reid MA, Sanderson SM, Qiu C, Li S, Liu J, and Locasale JW (2018). Serine Availability Influences Mitochondrial Dynamics and Function through Lipid Metabolism. Cell reports 22, 3507–3520. [DOI] [PMC free article] [PubMed] [Google Scholar]
- Grant A, Ponia SS, Tripathi S, Balasubramaniam V, Miorin L, Sourisseau M, Schwarz MC, Sanchez-Seco MP, Evans MJ, Best SM, et al. (2016). Zika Virus Targets Human STAT2 to Inhibit Type I Interferon Signaling. Cell Host Microbe 19, 882–890. [DOI] [PMC free article] [PubMed] [Google Scholar]
- Hall CJ, Boyle RH, Astin JW, Flores MV, Oehlers SH, Sanderson LE, Ellett F, Lieschke GJ, Crosier KE, and Crosier PS (2013). Immunoresponsive gene 1 augments bactericidal activity of macrophage-lineage cells by regulating beta-oxidation-dependent mitochondrial ROS production. Cell Metab 18, 265–278. [DOI] [PubMed] [Google Scholar]
- Huang Z, Wu SQ, Liang Y, Zhou X, Chen W, Li L, Wu J, Zhuang Q, Chen C, Li J, et al. (2015). RIP1/RIP3 binding to HSV-1 ICP6 initiates necroptosis to restrict virus propagation in mice. Cell Host Microbe 17, 229–242. [DOI] [PubMed] [Google Scholar]
- Hygino da Cruz LC Jr., Nascimento OJM, Lopes F, and da Silva IRF (2018). Neuroimaging Findings of Zika Virus-Associated Neurologic Complications in Adults. AJNR Am J Neuroradiol. [DOI] [PMC free article] [PubMed] [Google Scholar]
- Keller BC, Fredericksen BL, Samuel MA, Mock RE, Mason PW, Diamond MS, and Gale M Jr. (2006). Resistance to alpha/beta interferon is a determinant of West Nile virus replication fitness and virulence. J Virol 80, 9424–9434. [DOI] [PMC free article] [PubMed] [Google Scholar]
- Klein RS, and Hunter CA (2017). Protective and Pathological Immunity during Central Nervous System Infections. Immunity 46, 891–909. [DOI] [PMC free article] [PubMed] [Google Scholar]
- Kole AJ, Annis RP, and Deshmukh M (2013). Mature neurons: equipped for survival. Cell Death Dis 4, e689. [DOI] [PMC free article] [PubMed] [Google Scholar]
- Lampropoulou V, Sergushichev A, Bambouskova M, Nair S, Vincent EE, Loginicheva E, Cervantes-Barragan L, Ma X, Huang SC, Griss T, et al. (2016). Itaconate Links Inhibition of Succinate Dehydrogenase with Macrophage Metabolic Remodeling and Regulation of Inflammation. Cell Metab 24, 158–166. [DOI] [PMC free article] [PubMed] [Google Scholar]
- Lazear HM, and Diamond MS (2016). Zika Virus: New Clinical Syndromes and Its Emergence in the Western Hemisphere. J Virol 90, 4864–4875. [DOI] [PMC free article] [PubMed] [Google Scholar]
- Liu X, Ser Z, and Locasale JW (2014). Development and quantitative evaluation of a highresolution metabolomics technology. Anal Chem 86, 2175–2184. [DOI] [PMC free article] [PubMed] [Google Scholar]
- Mehta R, Soares CN, Medialdea-Carrera R, Ellul M, da Silva MTT, Rosala-Hallas A, Jardim MR, Burnside G, Pamplona L, Bhojak M, et al. (2018). The spectrum of neurological disease associated with Zika and chikungunya viruses in adults in Rio de Janeiro, Brazil: A case series. PLoS Negl Trop Dis 12, e0006212. [DOI] [PMC free article] [PubMed] [Google Scholar]
- Michelucci A, Cordes T, Ghelfi J, Pailot A, Reiling N, Goldmann O, Binz T, Wegner A, Tallam A, Rausell A, et al. (2013). Immune-responsive gene 1 protein links metabolism to immunity by catalyzing itaconic acid production. Proc Natl Acad Sci U S A 110, 7820–7825. [DOI] [PMC free article] [PubMed] [Google Scholar]
- Mills EL, Ryan DG, Prag HA, Dikovskaya D, Menon D, Zaslona Z, Jedrychowski MP, Costa ASH, Higgins M, Hams E, et al. (2018). Itaconate is an anti-inflammatory metabolite that activates Nrf2 via alkylation of KEAP1. Nature 556, 113–117. [DOI] [PMC free article] [PubMed] [Google Scholar]
- Miner JJ, and Diamond MS (2017). Zika Virus Pathogenesis and Tissue Tropism. Cell Host Microbe 21, 134–142. [DOI] [PMC free article] [PubMed] [Google Scholar]
- Nair S, Huynh JP, Lampropoulou V, Loginicheva E, Esaulova E, Gounder AP, Boon ACM, Schwarzkopf EA, Bradstreet TR, Edelson BT, et al. (2018). Irg1 expression in myeloid cells prevents immunopathology during M. tuberculosis infection. J Exp Med 215, 1035–1045. [DOI] [PMC free article] [PubMed] [Google Scholar]
- Naujoks J, Tabeling C, Dill BD, Hoffmann C, Brown AS, Kunze M, Kempa S, Peter A, Mollenkopf HJ, Dorhoi A, et al. (2016). IFNs Modify the Proteome of Legionella-Containing Vacuoles and Restrict Infection Via IRG1-Derived Itaconic Acid. PLoS Pathog 12, e1005408. [DOI] [PMC free article] [PubMed] [Google Scholar]
- Newton K, Dugger DL, Maltzman A, Greve JM, Hedehus M, Martin-McNulty B, Carano RA, Cao TC, van Bruggen N, Bernstein L, et al. (2016). RIPK3 deficiency or catalytically inactive RIPK1 provides greater benefit than MLKL deficiency in mouse models of inflammation and tissue injury. Cell death and differentiation 23, 1565–1576. [DOI] [PMC free article] [PubMed] [Google Scholar]
- Nogusa S, Thapa RJ, Dillon CP, Liedmann S, Oguin TH 3rd, Ingram JP, Rodriguez DA, Kosoff R, Sharma S, Sturm O, et al. (2016). RIPK3 Activates Parallel Pathways of MLKL-Driven Necroptosis and FADD-Mediated Apoptosis to Protect against Influenza A Virus. Cell Host Microbe 20, 13–24. [DOI] [PMC free article] [PubMed] [Google Scholar]
- Orozco S, and Oberst A (2017). RIPK3 in cell death and inflammation: the good, the bad, and the ugly. Immunol Rev 277, 102–112. [DOI] [PMC free article] [PubMed] [Google Scholar]
- Orozco S, Yatim N, Werner MR, Tran H, Gunja SY, Tait SW, Albert ML, Green DR, and Oberst A (2014). RIPK1 both positively and negatively regulates RIPK3 oligomerization and necroptosis. Cell death and differentiation 21, 1511–1521. [DOI] [PMC free article] [PubMed] [Google Scholar]
- Pan Q, Huang Y, Chen L, Gu J, and Zhou X (2014). SMAC-armed vaccinia virus induces both apoptosis and necroptosis and synergizes the efficiency of vinblastine in HCC. Human cell 27, 162–171. [DOI] [PubMed] [Google Scholar]
- Piret J, Carbonneau J, Rheaume C, Baz M, and Boivin G (2018). Predominant role of IPS-1 over TRIF adaptor proteins in early innate immune response against Zika virus in mice. J Gen Virol 99, 209–218. [DOI] [PubMed] [Google Scholar]
- Shen H, Campanello GC, Flicker D, Grabarek Z, Hu J, Luo C, Banerjee R, and Mootha VK (2017). The Human Knockout Gene CLYBL Connects Itaconate to Vitamin B12. Cell 171, 771–782 e711. [DOI] [PMC free article] [PubMed] [Google Scholar]
- Szretter KJ, Daffis S, Patel J, Suthar MS, Klein RS, Gale M, and Diamond MS (2010). The Innate Immune Adaptor Molecule MyD88 Restricts West Nile Virus Replication and Spread in Neurons of the Central Nervous System. Journal of Virology 84, 12125–12138. [DOI] [PMC free article] [PubMed] [Google Scholar]
- Tallam A, Perumal TM, Antony PM, Jager C, Fritz JV, Vallar L, Balling R, Del Sol A, and Michelucci A (2016). Gene Regulatory Network Inference of Immunoresponsive Gene 1 (IRG1) Identifies Interferon Regulatory Factor 1 (IRF1) as Its Transcriptional Regulator in Mammalian Macrophages. PLoS One 11, e0149050. [DOI] [PMC free article] [PubMed] [Google Scholar]
- Town T, Bai F, Wang T, Kaplan AT, Qian F, Montgomery RR, Anderson JF, Flavell RA, and Fikrig E (2009). Toll-like receptor 7 mitigates lethal West Nile encephalitis via interleukin 23-dependent immune cell infiltration and homing. Immunity 30, 242–253. [DOI] [PMC free article] [PubMed] [Google Scholar]
- Upton JW, Kaiser WJ, and Mocarski ES (2012). DAI/ZBP1/DLM-1 complexes with RIP3 to mediate virus-induced programmed necrosis that is targeted by murine cytomegalovirus vIRA. Cell Host Microbe 11, 290–297. [DOI] [PMC free article] [PubMed] [Google Scholar]
- Williams JL, Patel JR, Daniels BP, and Klein RS (2014). Targeting CXCR7/ACKR3 as a therapeutic strategy to promote remyelination in the adult central nervous system. J Exp Med 211, 791–799. [DOI] [PMC free article] [PubMed] [Google Scholar]
- Yockey LJ, Varela L, Rakib T, Khoury-Hanold W, Fink SL, Stutz B, Szigeti-Buck K, Van den Pol A, Lindenbach BD, Horvath TL, et al. (2016). Vaginal Exposure to Zika Virus during Pregnancy Leads to Fetal Brain Infection. Cell 166, 1247–1256 e1244. [DOI] [PMC free article] [PubMed] [Google Scholar]
Associated Data
This section collects any data citations, data availability statements, or supplementary materials included in this article.
Supplementary Materials
1
2
Data Availability Statement
Raw data are available upon request to the Lead Contact. No proprietary software or algorithms were used in this study. Raw microarray data have been deposited in NCBI’s Gene Expression Omnibus and can be accessed under accession number GSE122121.