A novel 3D mouse embryo atlas based on micro-CT (original) (raw)
Abstract
The goal of the International Mouse Phenotyping Consortium (IMPC) is to phenotype targeted knockout mouse strains throughout the whole mouse genome (23,000 genes) by 2021. A significant percentage of the generated mice will be embryonic lethal; therefore, phenotyping methods tuned to the mouse embryo are needed. Methods that are robust, quantitative, automated and high-throughput are attractive owing to the numbers of mice involved. Three-dimensional (3D) imaging is a useful method for characterizing morphological phenotypes. However, tools to automatically quantify morphological information of mouse embryos from 3D imaging have not been fully developed. We present a representative mouse embryo average 3D atlas comprising micro-CT images of 35 individual C57BL/6J mouse embryos at 15.5 days post-coitum. The 35 micro-CT images were registered into a consensus average image with our automated image registration software and 48 anatomical structures were segmented manually. We report the mean and variation in volumes for each of the 48 segmented structures. Mouse organ volumes vary by 2.6-4.2% on a linear scale when normalized to whole body volume. A power analysis of the volume data reports that a 9-14% volume difference can be detected between two classes of mice with sample sizes of eight. This resource will be crucial in establishing baseline anatomical phenotypic measurements for the assessment of mutant mouse phenotypes, as any future mutant embryo image can be registered to the atlas and subsequent organ volumes calculated automatically.
Keywords: Atlas, Mouse embryo, Micro-CT, 3D imaging
INTRODUCTION
With the human genome project complete, the sequence and the location of each gene within the genome are now known. However, an understanding of the relationship between the genotype and its corresponding expressed phenotype in humans is still in its infancy. A large portion of the planned research investigating this relationship will be carried out in the mouse, mainly owing to the 99% genetic homology between mice and humans (Mouse Genome Sequencing Consortium, 2002) and the development of sophisticated techniques to manipulate mice genetically that cannot be undertaken in humans for both technical and ethical reasons. In an attempt to better understand the role of each gene in the development of an individual, the International Knockout Mouse Consortium (IKMC, www.knockoutmouse.org) (International Mouse Knockout Consortium, 2007) is in the process of knocking out each of the ∼23,000 genes in the mouse, one at a time, and generating resulting mouse lines. This will require a massive phenotyping effort to characterize each mouse line, prompting the establishment of the International Phenotyping Mouse Consortium (IMPC, http://www.mousephenotype.org/), which is still in its planning stages. To date, 30% of the single gene knockout mice produced by the IKMC are embryonic lethal, prompting the need for phenotypic characterization of normal and mutant mouse embryos.
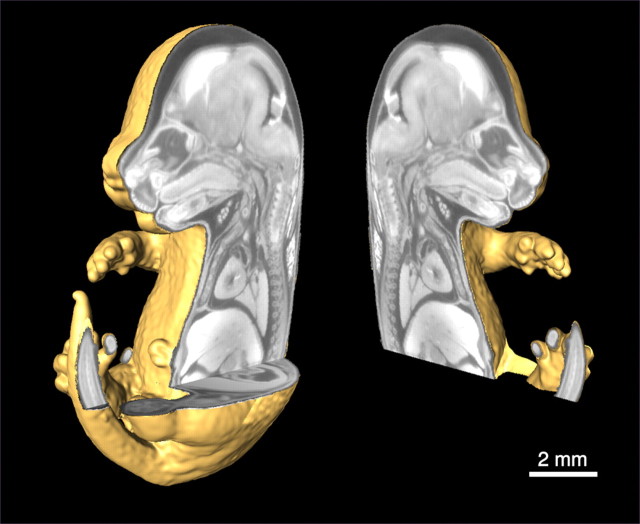
Three-dimensional (3D) volumetric imaging is an attractive option for analyzing mouse embryo morphological phenotypes (Nieman et al., 2011), particularly when used as a primary phenotypic screen, because of its whole embryo coverage. Single gene mutations can cause multi-organ abnormalities that single tissue or two-dimensional (2D) sections can easily miss. Another benefit of 3D imaging is that the resulting image comprises digital data that can be manipulated for optimal viewing. 3D whole embryo imaging can be viewed in numerous ways, allowing for viewing of any preferred slice regardless of angle (Fig. 1). Additionally, digital data imaging lends itself to quantitative analysis, in which automated computer algorithms can extract essential information such as significant differences in anatomical volumes between two classes of mice using statistical measures (Spring et al., 2007). Such analyses can be performed using current algorithms, but the data can also be archived for future ‘data mining’ using more sophisticated algorithms as they become available. Technical advances in parallel imaging, imaging hardware and acquisition software are enabling increased throughput, making analysis of large numbers of mouse embryos feasible (Schneider et al., 2004; Zhang et al., 2010). The IMPC has recognized the value of 3D imaging and has established it as the primary screen for abnormal morphological phenotypes at either E15.5 or E9.5, depending on the stage of lethality (InfraComp Workshop on IMPC Embryonic Lethal Screening, London, UK, 2012).
Fig. 1.
Three-dimensional volume rendering of an individual E15.5 mouse embryo image acquired by micro-CT. One of the benefits of 3D digital data is the ability to section the dataset using software in any desired orientation. Sectioning the 3D volume digitally eliminates the restriction of acquiring a 2D section in only one orientation, especially when using a destructive imaging assay like histology. The image is presented at an isotropic voxel size of 28 μm3.
In order to differentiate between normal and mutant mouse embryonic development, especially morphologically, it is necessary to characterize the variability within the normal population. It is not feasible to manually segment out every organ in every mouse embryo image within a suitable sample size in order to extract average volumes and intrinsic variation within a wild-type population. An analogous problem of analyzing the different regions within the adult mouse brain was presented by Dorr et al. (Dorr et al., 2008). A consensus average mouse brain image derived from 40 adult mouse brain magnetic resonance (MR) images was created using image registration followed by manual segmentation of 64 regions within this average image. The result was an adult mouse brain representative average atlas, which could be back-projected onto the 40 individual input C57BL/6 mouse brain images that contributed to the atlas. From this, average brain region volumes and their variation were automatically calculated (Dorr et al., 2008).
Image registration has been successfully performed on MR images of mouse embryos at 15.5 days post-coitum (dpc), demonstrating the feasibility of morphing these images (Zamyadi et al., 2010; Cleary et al., 2011). As a consequence, each homologous anatomical point resides in the same position in space, resulting in a high-quality consensus average image. However, the segmentation and annotation of a consensus wild-type mouse embryo average image into a 3D atlas akin to that of Dorr et al. has not previously been demonstrated for calculating the average and the variation of organ volumes in a whole mouse embryo. This information is essential in order to recognize the extent of a morphological abnormality and to show that it is beyond the variation seen in normal development.
The imaging data in this study are acquired with micro-computed tomography (micro-CT), an imaging modality based on the attenuation of X-rays. This modality has recently been utilized to acquire high-quality and high-resolution images of the mature mouse embryo, in which individual organs can be easily identified. Imaging the mouse embryo ex vivo with micro-CT was not seen as a viable option owing to its intrinsic insensitivity to soft tissue. However, taking a cue from a study that imaged the postmortem mouse brain with micro-CT after immersion in iodine (de Crespigny et al., 2008), a different iodine staining method using Lugol solution (2:1 potassium iodide:elemental iodine in water) was applied to the mouse embryo (Metscher, 2009b; Metscher, 2009a), demonstrating remarkable contrast and image quality. Although the immersion staining technique is simple, optimization of Lugol solution potency and immersion time is necessary to provide appropriate contrast and to minimize tissue shrinkage that would complicate intersample statistical comparisons (Degenhardt et al., 2010).
The present study provides an atlas based on the mature 15.5 dpc C57BL/6J mouse embryo that includes, in our opinion, all the distinguishable organs and tissue types for which structural boundaries can be identified within a consensus average micro-CT image. The large sample size of 35 mouse embryos coupled with the acquisition of 28 μm3 resolution 3D micro-CT images and the manual segmentation of a total of 48 anatomical structures, 25 within the brain alone, results in the most comprehensive mouse embryo representative average atlas in the literature. In addition, the atlas demonstrates successful implementation of whole body image registration of micro-CT mouse embryo data. This atlas provides an essential advance in the automation of mouse embryo morphological phenotyping using micro-CT and image registration methods. The atlas is available (http://www.mouseimaging.ca/technologies/mouse_embryo_atlas.html) to the research community along with the 35 individual source images from which it was compiled, so that others can further develop computer analysis methods to characterize the normal mouse embryo.
MATERIALS AND METHODS
Sample preparation
For this study, C57BL/6 mice were mated and the detection of a vaginal plug the following day at noon was considered to be 0.5 dpc. At 15.5 dpc, pregnant mice were sacrificed by cervical dislocation. The embryos were then dissected and fixed in 4% paraformaldehyde overnight and then transferred to PBS and stored until Lugol staining. A total of 35 mouse embryos from five litters were used. The Lugol staining protocol was adapted from published methods (Metscher, 2009a; Degenhardt et al., 2010), with modifications to ensure penetration of the iodine into tissue and minimization of tissue shrinkage to control intersample variation. Each sample was immersed in 15 ml stock Lugol solution (L6146, Sigma-Aldrich, St Louis, MO, USA) overnight (17±1 hours). The samples were then embedded in 1% agarose (Bioshop, Burlington, ON, Canada) in 11-mm centrifuge tubes (Beckman Instruments, Palo Alto, CA, USA) prior to micro-CT imaging.
Micro-CT imaging
3D datasets were acquired for each specimen using an MS-9 micro-CT scanner (GE Medical Systems, London, ON, Canada). The performance of this specimen-scanning system has previously been evaluated and described (Marxen et al., 2004). With the X-ray source at 80 kVp and 80 mA and the specimen positioned for a magnification of 3.47, each specimen was rotated 360° around the vertical axis, generating 720 views in 2 hours. These views were reconstructed using the Feldkamp algorithm (Feldkamp and Davis, 1984) for cone beam CT. The acquired 3D data block contained 1000×1000×1000 voxel elements of 14 μm and was later binned by two to limit the total size of the data for image processing, resulting in a 500×500×500 3D image with 28 μm isotropic voxels.
Consensus population average image of 35 mouse embryos
An unbiased model-independent average of the 35 micro-CT images was generated through a published algorithm (Kovacevic et al., 2005; Zamyadi et al., 2010). All images were normalized for intensity inhomogeneity using the N3 method (Sled et al., 1998) and linearly translated and rotated in three dimensions toward a model E15.5 mouse embryo image to establish orientation and location. This step was required only for the initial rigid body registration and does not therefore create a bias. Subsequently, to complete the linear registration, all possible (N=35×34) pairwise 12-parameter registrations (three rotations, three translations, three scales and three shearing) were computed to account for variation in overall embryo size. The average of the 34 transforms per mouse embryo image was calculated and the residual transforms applied to each respective embryo image, and then a final average intensity image calculated from the summed linearly transformed images. Then, an iterative five-generation multiscale non-linear alignment procedure was performed in which each mouse was registered towards the average of the linear registrations, and then subsequently towards the atlas of the previous non-linear registration. The image registration was executed using MNI AUTOREG tools (Collins et al., 1994). The end result was a deformation of each of the individual 35 micro-CT images into exact alignment with one another in an unbiased fashion in which all homologous points in anatomy are in accordance with each other spatially (Fig. 2). It is evident that the boundaries and details of the major organ structures, such as the vertebrae, lobes of the lung and ventricles of the heart, displayed in one individual micro-CT image (Fig. 2A-C) remain visible and distinguishable in the population average image that comprises an average of all 35 mouse embryos (Fig. 2D-F). However, anatomical structures that do not have specific 3D patterning, such as the intestines, are blurred out.
Fig. 2.
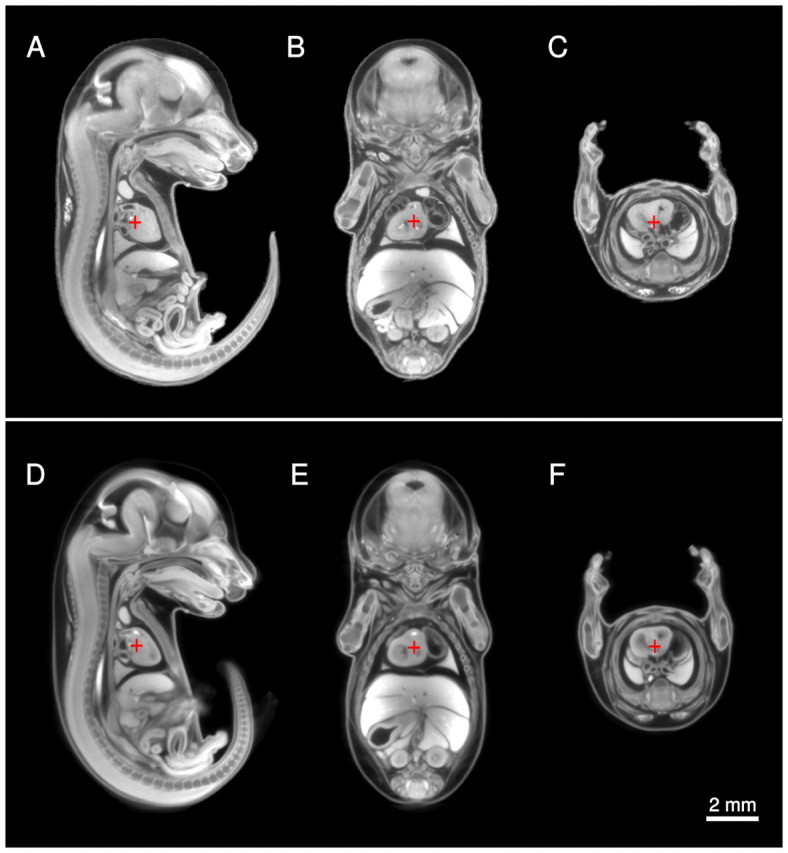
Input and output images of the image registration of 35 mouse embryo micro-CT images into a consensus average. (A-F) Sagittal (A,D), coronal (B,E) and axial (C,F) sections through a single mouse embryo image before image registration (A-C) and at analogous locations of the average image comprising 35 individual mouse embryo images (D-F). The red cross-hair denotes a homologous point as determined by the registration algorithm in all sections. The average image retains gross structural details and retains organ boundaries from the individual mouse embryo images; however, anatomy that is random in position and size, such as the intestines, is blurred in the registered average image.
Segmentation of mouse embryo anatomical structures
The segmentation of 48 mouse embryonic structures was performed by one individual on the single average image formed through image registration. The segmentation process is identical to that described previously for brain (Dorr et al., 2008). A histological atlas of mouse development at stage E15.5 (Kaufman, 1992) was used for guidance to accurately identify, demarcate and segment each individual embryonic structure. The mouse embryonic brain at 15.5 dpc is still in development; therefore, both the Kauffman atlas and the Electronic Prenatal Mouse Brain Atlas (EPMBA, www.epmba.org) were needed to best distinguish the 25 individual structures within the brain. Several brain regions outlined in the reference histological atlases are not observable in the micro-CT images. Therefore, irresolvable brain structures were grouped into larger regions that could be manually segmented with confidence. Once all 48 distinguishable mouse embryonic anatomical structures had been manually segmented, the average annotated atlas was remapped onto the 35 mouse embryo images from which it was compiled. The volumes of the resampled, back-projected anatomical labels were calculated resulting in a set of 35 volume measurements for each of the 48 segmented embryonic organ structures.
RESULTS
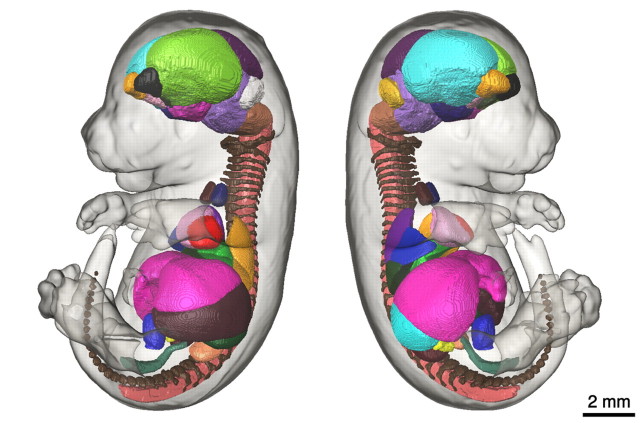
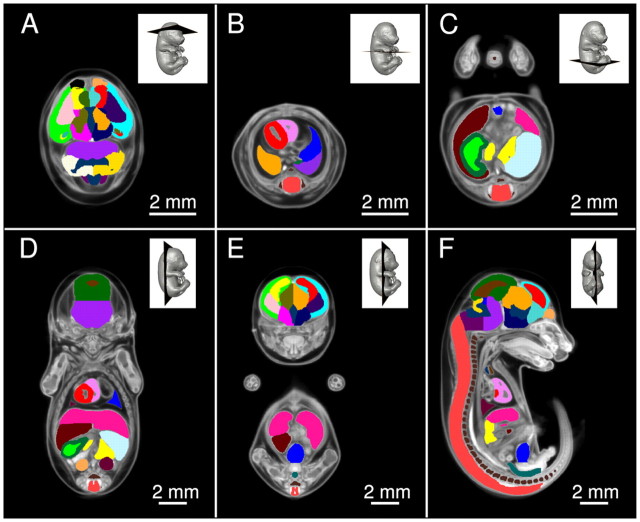
The final result of the manual segmentation is a whole volume E15.5 mouse embryo atlas consisting of 48 structures (Figs 3, 4). The manual segmentation took ∼400 hours to ensure accuracy and consistently smooth boundaries in all dimensions. Fig. 3 displays each of the 48 labeled structures in the average mouse embryo atlas in views from the left and right sides of the embryo. Individual axial slices through the brain, thoracic cavity and gut (Fig. 4A-C), two coronal slices (Fig. 4D,E) and one mid-sagittal slice (Fig. 4F) display some anatomical labels that are hidden in the 3D context of Fig. 3. The color map is identical for the structures presented in Figs 3 and 4 to provide visual correspondence between the 2D sections and the 3D volume rendering.
Fig. 3.
Three-dimensional visualization of the 48 segmented anatomical structures in the E15.5 mouse embryo atlas. A 3D representation of the mouse embryo atlas in which each volume is shown, in different colors, in its native location within the whole mouse embryo volume (semi-transparent). Many of the segmented labels cannot be displayed because they are embedded within other structures, especially in the brain.
Fig. 4.
Two-dimensional sections that illustrate details of the mouse embryo atlas. Axial sections of (A) brain, (B) thoracic cavity and (C) abdomen. Also shown are (D,E) two coronal sections and (F) a mid-sagittal section. It is easier to appreciate the detail of this mouse embryo atlas in this fashion as each structure is painted slice by slice, culminating in hundreds of slices in each dimension. Such manual segmentation of a consensus average image would not be possible without successful image registration to produce an average image that is representative of an individual.
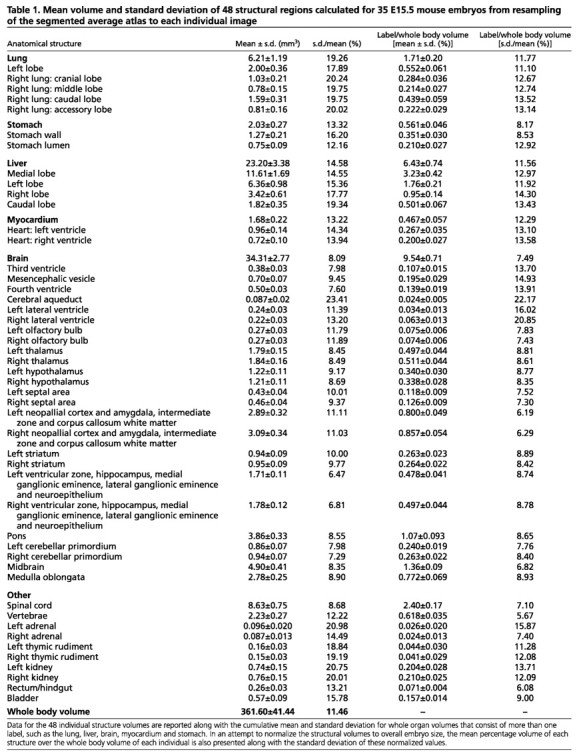
The mean and standard deviation of each segmented mouse embryo structure volume are presented in Table 1. To account for the variation that results from differences in whole body volume among the set of 35 embryos, also included in Table 1 is the percentage volume of each segmented structure normalized to the whole body volume.
Table 1.
Mean volume and standard deviation of 48 structural regions calculated for 35 E15.5 mouse embryos from resampling of the segmented average atlas to each individual image
The accuracy of the back-projection and resampling of the anatomical labels to the 35 individual source images is illustrated in Fig. 5. The five lobes of the mouse embryo lung in the atlas (Fig. 5C) are remapped onto the native space of each source mouse embryo micro-CT image (only three individual embryo images are shown, Fig. 5D-F). It is visually evident that the back-projected labels accurately coincide with the underlying source image data when the two datasets are superimposed onto each other, as the colored labels clearly outline the respective lobes despite differences in their shape and location.
Fig. 5.
Accuracy of resampling the segmented atlas onto the individual E15.5 mouse embryo images. The accuracy of back-projection onto each single mouse embryo image is illustrated with the five lobes of the lung. (A,B) The left lobe (purple), right cranial lobe (green), right middle lobe (red), right caudal lobe (blue), and right-accessory lobe (gold) labels are shown as 3D volume renderings ventrally (A) and dorsally (B). (C) Its 2D representation superimposed on the average consensus image. (D-F) Three different mouse embryos of the set of 35 from which the average image is composed are shown in an equivalent manner. The colored labels show remarkable correspondence with the underlying structure seen in the grayscale image, giving credence to the image registration algorithm.
DISCUSSION
E15.5 is a good developmental stage to ensure successful image registration
The reasons for the selection of E15.5 as the gestational stage to develop a segmented atlas are numerous. A shift away from organogenesis and toward growth and development starts at ∼E14.0. Image registration cannot align anatomy that is not homologous in shape or form, for example owing to its absence at earlier stages of development. Dissecting mouse embryos at 15.5 dpc results in a set of samples that range from E15-16 depending on the uncertainty that exists for the time of conception and variation in individual growth rates. However, assuming that the morphological change in this range is primarily growth and not due to organogenesis, the image registration algorithm can cope with variation in size using linear transformations that scale the mouse embryos to an equivalent size before the multiscale non-linear iterative transformations. A later gestational stage is more problematic for image registration because of variation in morphology due to crowding within the abdominal cavity. If registration was attempted at earlier time points, images would have to be binned into specific developmental time points through somite counting or limb bud formation to ensure that the embryos are at the equivalent stage of organogenesis for image registration to be successful. In addition, a segmented atlas of an earlier, E9-13 embryo would be difficult because of the lack of consistent nomenclature and boundary definitions for the transitional morphology that exists at this time of rapid development.
Mice lacking essential genes for early cardiac development constitute a significant portion of all embryonic lethalities occurring in early organogenesis (E8-10.5), along with gene knockouts that perturb yolk sac circulation and chorioallantoic placenta establishment (Copp, 1995). Investigation into the cause of these embryonic lethalities with 3D imaging is best suited to higher resolution systems that are tailored to image smaller specimens, such as optical projection tomography (OPT) (Sharpe et al., 2002). Conversely, embryonic lethalities occurring in the mid-fetal period due to abnormalities of the central nervous system, limbs, lungs, gut and liver (Copp, 1995) can be readily detected through micro-CT imaging and image registration. Genetic mutations that cause mice to die immediately after birth can also make use of this atlas to investigate whether earlier fetal morphological aberrations might explain the lethality.
Intersample variation of anatomical structure volumes
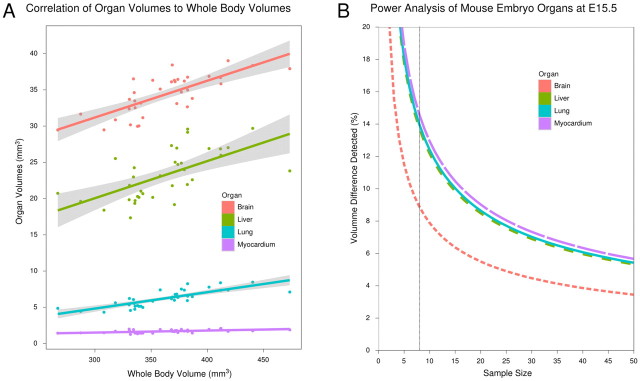
It is evident through the information reported in Table 1 that the variation in organ volumes among E15.5 C57BL/6 mouse embryos is moderate, with a standard deviation that is ∼10-20% of the reported mean, depending on the structure. The main source for this variation in structural volumes is imprecision in the time point of conception and variation in embryonic growth rate among mouse embryos excised at a specific dpc. It is evident from the volume data that the organ volumes calculated correlate well with whole embryo volume (Fig. 6A) and, therefore, the variation due to differences in the state of growth among this population could be accounted for by normalizing the structure volumes by embryo size. Normalizing the calculated organ volumes to the whole body volume of each mouse embryo reduces the standard deviation by approximately a factor of two. Now, the majority of structures report a standard deviation of 8-13% when whole body volume is considered, demonstrating a tight distribution among mouse embryo structural volumes. It should be noted that 8-13% in volume corresponds on a linear scale to 2.6-4.2% in each of the three dimensions.
Fig. 6.
Analysis of intrinsic variation of organ volumes among E15.5 C57BL/6 embryos. (A) Correlation between individual organ volumes and their corresponding whole embryo volumes. A scatter plot of the organ volumes of the brain, liver, lung and myocardium as a function of whole embryo volume. Included is a linear fit and 95% confidence intervals are presented in gray. R2 values for the best-fit linear regression lines are 0.76, 0.52, 0.63 and 0.81 for brain, myocardium, liver and lung, respectively. (B) Power analysis of change in volume as a function of sample size in E15.5 C57BL/6 mouse embryo micro-CT images. The curves are based on a one-sample _t_-test with P<0.05 and a study power of 0.9. A sample size of eight is sufficient to allow detection of a volume change of 9-14% depending on the organ in question.
A power analysis based on each of the organ volume distributions reveals that small deviations in volume due to an aberration in development or mutant morphological phenotype can be detected with modest sample sizes (Fig. 6B). For example, a sample size of eight mouse embryos is adequate to detect a volume change as a percentage of whole body volume (14% in the lung, liver and myocardium and 9% in the brain). These values compare favorably to those published previously (Zamyadi et al., 2010), wherein it was reported that a volume change of 8% and 20% could be detected in the brain and lung, respectively, with a sample size of eight. It is promising that a relatively small perturbation in volume can be detected at a reasonable sample size, as numbers can quickly become unmanageable when one phenotypes the 20,000 or more mouse lines planned by the IMPC.
Micro-CT is a viable option for mouse embryo phenotyping
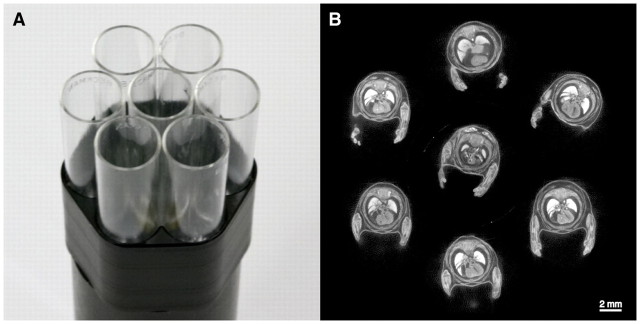
This is the first study to extract quantitative volume information from mouse embryo micro-CT images using a semi-automatic computer algorithm. Volumes of specific organs of mouse embryos have been calculated previously through image registration using MRI images (Zamyadi et al., 2010; Cleary et al., 2011). MRI is advantageous due to its ability to image soft tissue and also because the gadolinium contrast agents used do not distort or perturb the natural, fixed mouse embryo shape. However, the cost of an MRI system is considerably more than that of a micro-CT scanner, not including the dedicated housing, engineering and specialized personnel needed to run the system. Micro-CT systems are already readily available as stand-alone machines that can be installed in any laboratory and, if the demand is present, the engineering of new systems that are dedicated to imaging and phenotyping the mouse embryo will no doubt be considered. The MRI scan time required to reach an image resolution that rivals that of a dedicated micro-CT machine is usually overnight; however, groups have overcome this to some degree by imaging multiple samples at a time (Bock et al., 2003; Schneider et al., 2004; Cleary et al., 2011). This could also be done in micro-CT, with the fabrication of custom holders that arrange the embryos suitably for imaging multiple embryos at once. We have fashioned such a holder for our micro-CT scanner, with which we can scan seven embryos at once in the same time as it would take for single embryo image acquisition with a minimal compromise in image resolution (Fig. 7). It was, until now, unknown whether the contrast and image quality of micro-CT mouse embryo scans would be amenable to these image-processing techniques allowing for automatic organ volume calculation. In this study, we show that micro-CT of mouse embryos immersed in Lugol solution is just as appropriate for our image registration tools as MRI of adult mouse brains (Dorr et al., 2008) and of embryos of the same stage of development (Zamyadi et al., 2010).
Fig. 7.
Multiple mouse embryo micro-CT imaging. (A) Dedicated holder to image seven E15.5 mouse embryos at one time. (B) Axial cross-section through the thoracic cavity of seven mouse embryos imaged with micro-CT using the holder presented in A. This is an example of how throughput can be easily increased through simple modification of existing micro-CT systems.
Potential sources of inaccuracy and limitations
Although image registration coupled with manual segmentation of organs and subsequent resampling back to individual mouse embryo micro-CT images demonstrates a fast and strikingly accurate method for volume measurements (Fig. 5), there are possible sources of error. First, as previously stated, Lugol staining promotes dehydration of embryonic tissue and could consequently introduce variation among samples, especially in such as the brain and lung as structures most susceptible to dehydration. Optimization of the Lugol potency and staining duration to minimize tissue shrinkage, along with ensuring that each embryo is subjected to the same preparation protocol, aim to maintain the endogenous anatomical state of each mouse embryo or, at least, ensure that there is approximately equivalent shrinkage among all samples.
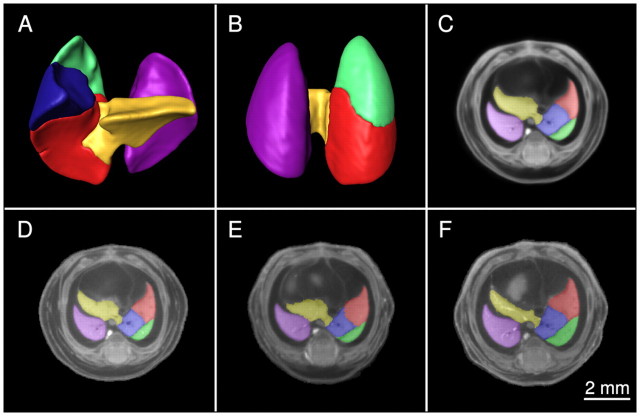
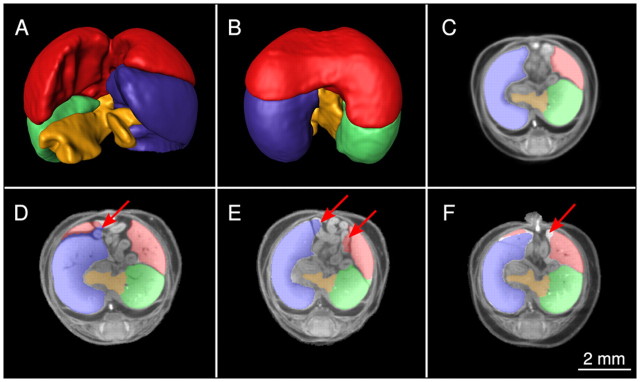
Furthermore, this process to extract volumes from individual mouse embryo images is contingent upon accurate registration of each homologous point of anatomy to the same location in space. This condition is difficult to uphold in the abdomen, specifically the liver, of the relatively mature E15.5 mouse embryo owing to variation in intestinal position and volume. Homologous points in the liver might not exist among a set of mouse embryos owing to its readily deformable nature and the pressure the intestines place upon it posteriorly. This results in an average image in which the liver boundaries are not sharp due to a less than optimal registration, making manual segmentation difficult, as seen in Fig. 8C. The liver labels that are back-projected onto the individual mouse embryo images are not entirely accurate: arrows indicate an overestimation in volume in Fig. 8D,E and an underestimation in Fig. 8F. Although the resultant liver volumes may not be significantly affected owing to the small boundary discrepancy compared with the whole 3D volume, better methods need to be investigated to properly segment and extract liver volumes. Despite the imperfect image registration in the liver, the other structural regions segmented on the average image and resampled onto the individuals show good agreement (Fig. 5).
Fig. 8.
An example of inaccuracy in image registration in the abdominal cavity of the mature mouse embryo. Variation in intestinal position and size is coupled to liver position in the abdomen, leading to a blurrier average image and an inaccurate calculation of volumes. (A,B) The medial lobe (red), left lobe (blue), right lobe (green) and caudate lobe (gold) are shown as 3D volume renderings ventrally (A) and dorsally (B). (C) Its 2D representation superimposed on the average consensus image. (D-F) Three different mouse embryos of the set of 35 from which the average image is composed are shown in an equivalent manner. The arrows point to sources of volume overestimation (D,E) and underestimation (F) resulting from the less than optimal image registration of the boundaries of the liver.
It is important to note that the ventricles within the brain are the only structural regions where volumes do not decrease in variance when expressed as a ratio of the whole body volume. These regions are also the only segmented label volumes that do not correlate significantly with whole body volumes when the correlation coefficient is used as the measure (_P_>0.05). This could be attributed to the fact that, unlike conditions in vivo, brain ventricles no longer have the pressure to maintain their in vivo shape when fixed and imaged ex vivo with micro-CT. The usefulness of extracting brain ventricle volumes in ex-vivo mouse embryo imaging as part of a primary screen might be limited by this phenomenon.
Males and females show similar morphogenesis at E15.5
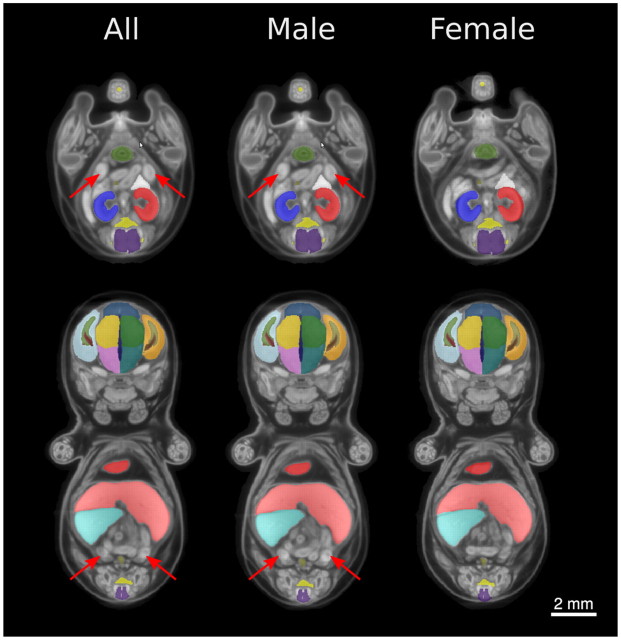
The atlas was created and analyzed without regard to the sex of the embryo. This simplifies volumetric measurements by eliminating the need to parse through individual images to identify sex organs. However, it assumes that the development of other organ structures and tissues does not vary with sex. Retrospectively, by identifying the testis or ovaries, we identified 11 female and 24 male embryos within the 35-embryo set that populated the final atlas. We separated the embryo images into male and female groups and re-registered them into their respective population averages using the same registration algorithm that was used to create the atlas. Axial and coronal sections of the results are presented in Fig. 9 in grayscale, with the atlas superimposed in color. It is visually evident that the atlas was primarily composed of male images, as the testicles indicated by the red arrows are observed in both the full atlas and the male population average. Obviously, and assuringly, the female average image does not present testes. The morphology of the gonads and the difference in sex do not appear to affect the morphology of the structures segmented in the atlas. Visually, the colored labels still show good accordance with both the male and female grayscale average images (Fig. 9). This information suggests that mouse embryo organ morphology at E15.5 does not differ appreciably with sex and that future analyses of different sets of mouse embryos can use this representative atlas irrespective of gender. It is also of note that if one wanted to analyze males and females separately, the sex organs are identifiable in micro-CT images.
Fig. 9.
Organ morphology is similar regardless of embryo sex apart from the reproductive organs. Axial (top) and coronal (bottom) sections taken from the average image of all 35 mouse embryos, male consensus average and female consensus average image at a level equivalent to the testes (arrows). The superimposed colored labels are from the presented representative atlas. It is visually evident that the labels show good accordance with both male-only and female-only average images, suggesting that tissue morphology is very similar in the two sexes. Testicular volume could be easily identified by registering male-only images into a consensus average.
Using the atlas for morphological measurements of future sets of mouse embryos
Although the report of the variances of the volumes of 48 different structural regions in C57BL/6 E15.5 mouse embryos and the compatibility of micro-CT image data with our image registration software for quantitative analysis are important, more important is the ability to register future sets of gene knockout mouse embryos and their wild-type counterparts to this atlas. This will allow automatic volume measurements of the 48 segmented anatomical structures through the aforementioned back-projection and resampling process. This has been successful in identifying significant volume differences within the adult mouse brain between two classes of mice using the atlas created by Dorr and colleagues (Dorr et al., 2008). Significant differences in brain regional volumes were calculated in mouse models of autism (Ellegood et al., 2010; Ellegood et al., 2011), between male and female mice (Spring et al., 2007) and mouse models of learning and behavior (Lerch et al., 2011) using the mouse brain atlas of Dorr and colleagues. A semi-automatic method to extract volume information for all the major organs of the E15.5 mouse embryo will be beneficial as a primary screen for the gene knockouts analyzed by the IMPC, as it will drive subsequent focused secondary and tertiary phenotyping of the organ systems where significant differences in volumes are detected between mutant and wild-type embryos. It will be interesting to test these image registration methods for their ability to extract morphological abnormalities, through analysis based on both organ volume and deformation, between mutant mouse embryos and their wild-type counterparts.
Extensions – the potential and limitations of image registration
Abnormal anatomy and morphology extend much further than differences in the overall volume of anatomical structures. The mouse embryo atlas presented here does not include every organ and tissue type throughout the whole embryo volume. Some aberrations in morphology that do not manifest in global organ volume changes or which are not located in the labeled areas in the atlas can still be identified by deformation-based morphometry. This has been demonstrated by a computer-automated method to calculate local anatomical differences in the brain between two classes of mice (Spring et al., 2010; Lerch et al., 2008). This analysis compares the magnitude of the change in volume that each voxel underwent in every source image throughout image registration to reach the final average image. Voxels that increased or decreased significantly in volume in a mutant compared with the wild type are attributed to localized smaller or larger anatomy, respectively. Zamyadi et al. have presented anatomical differences between C57BL/6J and 128S1/SvImJ E15.5 mouse embryos using this type of analysis (Zamyadi et al., 2010).
A morphological phenotype such as an absence or addition of one or more lobes in the lung cannot be identified using the presented atlas or the aforementioned deformation-based analysis. If homologous points in anatomy do not exist between images during image registration, it fails to align that anatomy locally, while successfully registering anatomy where homology does exist. An inability to register can also be used to identify these defects. One can essentially subtract mouse embryo images that do not show homology post-image registration to highlight these areas. A more sophisticated approach is to extract the intensity value at each point in the 3D image post-registration, and use a _t_-test to evaluate whether that intensity value is significantly different between a set of mutant and wild-type mice. One could also extract the cross-correlation value, i.e. the goodness of fit parameter that the image registration algorithm attempts to maximize, over a volume centered on each voxel in the image to highlight local areas that do not register well.
Although it was previously argued that E15.5 is a good developmental stage to screen because there is minimal variation in growth from E15-16, there will still be a significant number of mutant mouse embryos that will be developmentally delayed compared with their wild-type counterparts. The presented atlas could not be mapped onto seriously developmentally delayed mouse embryos due to the lack of homology. Generating a representative average image at discrete developmental stages throughout gestation would be beneficial. One could then slide a developmentally delayed E15.5 mouse embryo through a series of atlases at different time points. It is even possible to register the average images of two full days of gestation, such as E13.5 and E14.5, and interpolate between them to develop a continuous timecourse throughout development against which a developmentally delayed embryo, such as an embryo that appears to be E13.75, may be compared.
Certain mutant morphological phenotypes cannot be characterized by image registration alone. These are usually those that are: (1) randomized in position and texture, such as the intestines and developing trabeculae of the heart; (2) where image resolution is insufficient to resolve the phenotype; and (3) where the features are subtle such that only an expert would have knowledge of its presence, as with valve and septal defects in the heart. Imaging modalities capable of acquiring higher resolution, such as conventional histology, episcopic fluorescence image capturing (EFIC) (Weninger and Mohun, 2002) and high-resolution episcopic microscopy (HREM) (Weninger et al., 2006), have been successful in presenting mouse embryo morphology in exquisite and remarkable detail. These higher-resolution imaging systems could be used in a secondary screen to observe in much more detail structures identified through the use of the presented atlas or the other image analyses described here. Alternatively, higher-resolution systems, such as HREM, could enhance the primary screen when coupled with detailed qualitative analysis from trained experts.
Footnotes
Funding
Funding was provided by Genome Canada.
Competing interests statement
The authors declare no competing financial interests.
References
- Bock N. A., Konyer N. B., Henkelman R. M. (2003). Multiple-mouse MRI. _Magn. Reson. Med._49, 158–167. [DOI] [PubMed] [Google Scholar]
- Cleary J. O., Modat M., Norris F. C., Price A. N., Jayakody S. A., Martinez-Barbera J. P., Greene N. D. E., Hawkes D. J., Ordidge R. J., Scambler P. J., et al. (2011). Magnetic resonance virtual histology for embryos: 3D atlases for automated high-throughput phenotyping. _Neuroimage_54, 769–778. [DOI] [PubMed] [Google Scholar]
- Collins D. L., Neelin P., Peters T. M., Evans A. C. (1994). Automatic 3D intersubject registration of MR volumetric data in standardized Talairach space. _J. Comput. Assist. Tomogr._18, 192–205. [PubMed] [Google Scholar]
- Copp A. J. (1995). Death before birth: clues from gene knockouts and mutations. _Trends Genet._11, 87–93. [DOI] [PubMed] [Google Scholar]
- de Crespigny A., Bou-Reslan H., Nishimura M. C., Phillips H., Carano R. A. D., D’Arceuil H. E. (2008). 3D micro-CT imaging of the postmortem brain. _J. Neurosci. Methods_171, 207–213. [DOI] [PMC free article] [PubMed] [Google Scholar]
- Degenhardt K., Wright A. C., Horng D., Padmanabhan A., Epstein J. A. (2010). Rapid 3D phenotyping of cardiovascular development in mouse embryos by micro-CT with iodine staining. _Circ. Cardiovasc. Imaging_3, 314–322. [DOI] [PMC free article] [PubMed] [Google Scholar]
- Dorr A. E., Lerch J. P., Spring S., Kabani N., Henkelman R. M. (2008). High resolution three-dimensional brain atlas using an average magnetic resonance image of 40 adult C57Bl/6J mice. _Neuroimage_42, 60–69. [DOI] [PubMed] [Google Scholar]
- Ellegood J., Pacey L. K., Hampson D. R., Lerch J. P., Henkelman R. M. (2010). Anatomical phenotyping in a mouse model of fragile X syndrome with magnetic resonance imaging. _Neuroimage_53, 1023–1029. [DOI] [PubMed] [Google Scholar]
- Ellegood J., Lerch J. P., Henkelman R. M. (2011). Brain abnormalities in a Neuroligin3 R451C knockin mouse model associated with autism. _Autism Res._4, 368–376. [DOI] [PubMed] [Google Scholar]
- Feldkamp L., Davis L. (1984). Practical cone-beam tomography. _J. Opt. Soc. Am. A_1, 612–619. [Google Scholar]
- International Mouse Knockout Consortium (2007). A mouse for all reasons. _Cell_128, 9–13. [DOI] [PubMed] [Google Scholar]
- Kaufman M. H. (1992). The Atlas of Mouse Development. London: Academic Press. [Google Scholar]
- Kovacevic N., Henderson J. T., Chan E., Lifshitz N., Bishop J., Evans A. C., Henkelman R. M., Chen X. J. (2005). A three-dimensional MRI atlas of the mouse brain with estimates of the average and variability. _Cereb. Cortex_15, 639–645. [DOI] [PubMed] [Google Scholar]
- Lerch J. P., Carroll J. B., Spring S., Bertram L. N., Schwab C., Hayden M. R., Henkelman R. M. (2008). Automated deformation analysis in the YAC128 Huntington disease mouse model. _Neuroimage_39, 32–39. [DOI] [PubMed] [Google Scholar]
- Lerch J. P., Yiu A. P., Martinez-Canabal A., Pekar T., Bohbot V. D., Frankland P. W., Henkelman R. M., Josselyn S. A., Sled J. G. (2011). Maze training in mice induces MRI-detectable brain shape changes specific to the type of learning. _Neuroimage_54, 2086–2095. [DOI] [PubMed] [Google Scholar]
- Marxen M., Thornton M. M., Chiarot C. B., Klement G., Koprivnikar J., Sled J. G., Henkelman R. M. (2004). MicroCT scanner performance and considerations for vascular specimen imaging. _Med. Phys._31, 305–313. [DOI] [PubMed] [Google Scholar]
- Metscher B. D. (2009a). MicroCT for comparative morphology: simple staining methods allow high-contrast 3D imaging of diverse non-mineralized animal tissues. _BMC Physiol._9, 11. [DOI] [PMC free article] [PubMed] [Google Scholar]
- Metscher B. D. (2009b). MicroCT for developmental biology: a versatile tool for high-contrast 3D imaging at histological resolutions. _Dev. Dyn._238, 632–640. [DOI] [PubMed] [Google Scholar]
- Mouse Genome Sequencing Consortium (2002). Initial sequencing and comparative analysis of the mouse genome. _Nature_420, 520–562. [DOI] [PubMed] [Google Scholar]
- Nieman B. J., Wong M. D., Henkelman R. M. (2011). Genes into geometry: imaging for mouse development in 3D. Curr. Opin. Genet. Dev. 21, 638–646. [DOI] [PubMed] [Google Scholar]
- Schneider J. E., Böse J., Bamforth S. D., Gruber A. D., Broadbent C., Clarke K., Neubauer S., Lengeling A., Bhattacharya S. (2004). Identification of cardiac malformations in mice lacking Ptdsr using a novel high-throughput magnetic resonance imaging technique. _BMC Dev. Biol._4, 16. [DOI] [PMC free article] [PubMed] [Google Scholar]
- Sharpe J., Ahlgren U., Perry P., Hill B., Ross A., Hecksher-Sørensen J., Baldock R., Davidson D. (2002). Optical projection tomography as a tool for 3D microscopy and gene expression studies. _Science_296, 541–545. [DOI] [PubMed] [Google Scholar]
- Sled J. G., Zijdenbos A. P., Evans A. C. (1998). A nonparametric method for automatic correction of intensity nonuniformity in MRI data. _IEEE Trans. Med. Imaging_17, 87–97. [DOI] [PubMed] [Google Scholar]
- Spring S., Lerch J. P., Henkelman R. M. (2007). Sexual dimorphism revealed in the structure of the mouse brain using three-dimensional magnetic resonance imaging. _Neuroimage_35, 1424–1433. [DOI] [PubMed] [Google Scholar]
- Spring S., Lerch J. P., Wetzel M. K., Evans A. C., Henkelman R. M. (2010). Cerebral asymmetries in 12-week-old C57Bl/6J mice measured by magnetic resonance imaging. _Neuroimage_50, 409–415. [DOI] [PubMed] [Google Scholar]
- Weninger W. J., Mohun T. (2002). Phenotyping transgenic embryos: a rapid 3-D screening method based on episcopic fluorescence image capturing. _Nat. Genet._30, 59–65. [DOI] [PubMed] [Google Scholar]
- Weninger W. J., Geyer S. H., Mohun T. J., Rasskin-Gutman D., Matsui T., Ribeiro I., Costa L. F., Izpisúa-Belmonte J. C., Müller G. B. (2006). High-resolution episcopic microscopy: a rapid technique for high detailed 3D analysis of gene activity in the context of tissue architecture and morphology. _Anat. Embryol. (Berl.)_211, 213–221. [DOI] [PubMed] [Google Scholar]
- Zamyadi M., Baghdadi L., Lerch J. P., Bhattacharya S., Schneider J. E., Henkelman R. M., Sled J. G. (2010). Mouse embryonic phenotyping by morphometric analysis of MR images. _Physiol. Genomics_42A, 89–95. [DOI] [PMC free article] [PubMed] [Google Scholar]
- Zhang X., Schneider J. E., Portnoy S., Bhattacharya S., Henkelman R. M. (2010). Comparative SNR for high-throughput mouse embryo MR microscopy. _Magn. Reson. Med._63, 1703–1707. [DOI] [PubMed] [Google Scholar]
