Computational Optics Enables Breast Cancer Profiling in Point-of-Care Settings (original) (raw)
. Author manuscript; available in PMC: 2019 May 15.
Published in final edited form as: ACS Nano. 2018 Aug 20;12(9):9081–9090. doi: 10.1021/acsnano.8b03029
Abstract
The global burden of cancer, severe diagnostic bottlenecks in underserved regions, and underfunded health care systems are fueling the need for inexpensive, rapid and treatment-informative diagnostics. Based on advances in computational optics and deep learning, we have developed a low-cost digital system, termed AIDA (artificial intelligence diffraction analysis), for breast cancer diagnosis of fine needle aspirates. Here, we show high accuracy (>90%) in (i) recognizing cells directly from diffraction patterns and (ii) classifying breast cancer types using deep-learning based analysis of sample aspirates. The image algorithm is fast, enabling cellular analyses at high throughput (~3 sec per 1000 cells), and the unsupervised processing allows use by lower skill health care workers. AIDA can perform quantitative molecular profiling on individual cells, revealing intratumor molecular heterogeneity and has the potential to improve cancer diagnosis and treatment. The system could be further developed for other cancers and thus find widespread use in global health.
Keywords: breast cancer, diagnostics, global health, artificial intelligence, deep learning
Graphical Abstract
The global burden of cancer, severe pathology bottlenecks in underserved regions, evolving medical knowledge, and availability of targeted therapeutics have increased the need for inexpensive and rapid diagnostic approaches that can be used in point-of-care settings to deliver the right medicine to the right patient. Breast cancer is a prime example. Although generally thought of as a disease of developed countries, there were nearly 883,000 new breast cancer cases in 2012 in less developed countries as opposed to 788,000 new cases in developed countries.1–3 While histopathological subtyping and molecular genetic analysis are routine in developed countries,4 developing nations frequently experience pathologist shortages, underfunded health care systems, unavailability of modern diagnostics, and more limited therapeutic options.5 It is therefore not surprising that there exist enormous differences in survival rates ranging from as low as 10 deaths per 100,000 cases in some developed countries to almost twice the number in developing countries in Africa and Asia.1, 2 One of the biggest bottlenecks in developing countries has been access to accurate and affordable molecular diagnostics, essential in providing optimal care.
There are several different types of breast cancer but invasive adenocarcinoma is the most common (~85%) in underdeveloped regions.6, 7 In order to provide the most appropriate treatment, cancers are biopsied to determine the hormone and growth factor receptor status. Specifically, nuclear estrogen (ER) or progesterone receptors (PR) are investigated to determine whether a cancer will respond to anti-estrogens such as tamoxifen, fulvestrant or aromatase inhibitors. Similarly, human epidermal growth factor receptor 2 (HER2) is a tyrosine kinase receptor on the surface of breast cancer cells and HER2-positive cancers are much more likely to benefit from anti-HER2 treatment with Herceptin. Better understanding the composition of cellular receptors and tumoral heterogeneity could improve survivorship, as these factors have effects on drug resistance and tumor relapse following therapy.8, 9 Molecular profiling on breast cancer cells, therefore, can prevent breast cancer deaths by detecting the cancer at an early stage when treatment is more effective.3, 10
Advances in digital sensors and computation have introduced new capabilities in microscopy. Defined as computational optics, the new strategies overcome fundamental limits of conventional optics by capturing optically-coded digital images and numerically decoding them.11 Recently, lens-free on-chip imaging strategies based on digital holography and optoelectronic sensor arrays (lens-free digital in-line holography; LDIH) have been used to record an object’s diffraction pattern to then reconstruct its image.12–19 We have recently developed a portable imaging system based on the computational analyses of holographic diffraction patterns of objects to yield high-resolution (~1 µm), large field-of-view (FOV) images.20–23 This system utilized immuno-microbeads to detect molecular information on putative cancer cells. This approach, however, ultimately proved difficult for analysis of intracellular and nuclear biomarkers, had limited capability of multiplexing, and required extensive computational power that limits point-of-care operation of the technology. For these reasons, we set out to develop an alternative strategy to impart molecular information onto holographic images.
Here, we report a next generation diffraction analysis platform, termed AIDA (artificial intelligence diffraction analysis), for automated, rapid, high-throughput, and accurate cancer cell analysis. AIDA is equipped with the following features, advancing lensless detection platforms closer to an automated imaging cytometer. First, a dual-color staining holography method was devised to detect multiple markers (membrane and intracellular) on the same cell. This allowed for quantitative molecular profiling on individual cells and revealed cellular heterogeneity. Second, deep neural networks were developed to perform fast image analyses, namely cell recognition and color classification, directly on diffraction patterns (i.e., eliminating reconstruction steps). We reasoned that digital holography would be ideally suited for deep learning analyses because raw diffraction patterns contain rich information (size, shape, amplitude, phase contrast) in the frequency domain and are hard to be recognized by human vision and cognition. We optimized AIDA to analyze fine needle aspirates of breast lesions, as ultrasound guided aspiration is often performed by health care workers in developing countries.24, 25 Once cells were harvested and immunostained for ER/PR and HER2, their diffraction images were acquired. Deep-learning algorithms then analyzed individual cells and grouped them according to their molecular expressions. We show proof-of-principle of classifying freshly sampled breast lesions into therapeutically actionable categories. Ultimately, this approach could be further expanded to additional targets and other cancers and find widespread use in resource limited settings.
RESULTS
AIDA system for breast cancer detection
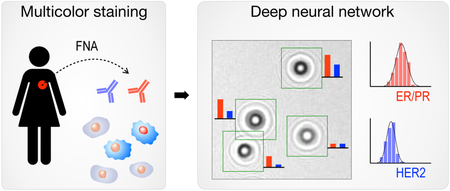
Figure 1a shows the AIDA schematic for breast cancer analysis. Cells freshly obtained by fine needle aspiration (FNA) are immunostained against ER, PR, and HER2 (Fig. 1a, i), and diffraction patterns of color-stained cells are recorded by a portable imaging system. A custom-developed deep-learning (DL) algorithm then analyzes raw images: the DL algorithm (i) identifies cancer cells directly from diffraction patterns, and (ii) extracts color intensities to report ER/PR and HER2 expressions at a single-cell level (Fig. 1a, ii). Molecular profiles on ER/PR and HER2 expression is used to mechanistically group breast cancers into four subtypes (Fig. 1a, iii): (ER/PR)+(HER2)+, (ER/PR)+(HER2)−, (ER/PR)−(HER2)+, and (ER/PR)−(HER2)−. Such classification would inform the most appropriate treatment. ER/PR positive patients would benefit from treatment with anti-estrogens (e.g., tamoxifen, fulvestrant) or aromatase inhibitors. Similarly, HER2-positive cancers are much more likely to benefit from anti-HER2 treatment.
Fig 1. Artificial Intelligence Diffraction Analysis (AIDA) architecture for breast cancer diagnoses.

(a) Schematic of the work-flow. (i) Cellular samples obtained from breast cancer patients via fine-needle aspiration are immunostained for triple markers: ER/PR in red and HER2 in blue. (ii) Diffraction patterns of stained and unstained cells are imaged by the AIDA device. (iii) Deep learning algorithms based on convolutional neural networks are applied to identify cancer cells and extract their color information directly from raw images. The ER/PR and HER2 expression levels are analyzed to classify breast cancer subtypes. (b) Disposable sample cartridge for cell capture and staining. A silicone gasket is placed between a glass slide and a plastic top for a watertight sealing. Cells are captured on the glass slide. (c) AIDA imaging system. The device is equipped with a high-resolution CMOS imager and a dual-LED (λ = 470 nm, 625 nm) light source. The dichromatic mirror (DIC, 550 nm cutoff) centers light inputs to an aperture with normal incidence angle. The system body was fabricated in a photopolymer resin via 3d-printing.
We first developed the AIDA imaging hardware. A plastic cartridge was designed to facilitate reliable sample handling (Fig. 1b). The cartridge housed a glass slide sealed by a silicone gasket, which formed a fluidic chamber for cell capture and staining. Samples and reagents were injected using a disposable fluidic dispensers (i.e., no need for external pumps); captured cells were then imaged through the optical window. For multiplexed molecular analyses, we built a dual-color imaging system that consisted of two light-emitting diodes (LEDs), a dichromatic mirror, an aperture, and a complementary metal–oxide–semiconductor (CMOS) imager (Fig. 1c and Fig. S1). The dichromatic mirror was used to keep the light incidence from LEDs normal to the aperture; this scheme simplified image analyses by eliminating shadow artifacts coming from different illumination angles. The interference patterns between the incident light and the scattered light from cells were directly recorded by the imager positioned underneath the sample. The imaging system was compact (11.8 × 12.3 × 15.6 cm3) and cost-effective ($345) with no intermediate optical components (e.g., lenses, filters) necessary (Table S1). It also offered a wide field-of-view (25 mm2) benefitting from lensless, unit-magnification imaging.
Assay optimization
We next optimized the assay process. For dual color-staining on cells, we tested 10 different chromogenic substrates (Fig. S2a) that are either reactive with horseradish peroxidase (HRP) or alkaline phosphatase (AP). Among substrates tested, the combination of HRP-NovaRed and AP-Blue showed the highest contrast with minimal spectral overlap (Fig. S2b). The maximum signal contrast could be achieved at the illumination wavelengths of 475 nm for HRP-NovaRED and of 620 nm for AP-Blue (Fig. S2c). As light sources, we therefore used 470 and 625 nm LEDs that are commercially available. We assigned HRP-NoVaRed to ER/PR staining, as the reagent produced higher signal for intracellular/nuclear targets; AP-Blue was used for HER2 staining.
We captured breast cancer cells on a glass slide coated with antibodies against HER2, EpCAM, EGFR, and MUC1 (Fig. 2a). This “quad-marker” combination has been shown to effectively identify and differentiate cancer cells from normal host ones.26–29 Since these markers are expressed on cell surface, they provide an efficient handle to immuno-capture putative cancer cells. Indeed, when tested with breast cancer cells, the capture yield was >90% with the quad-marker coated surface; non-specific binding was <10% (Fig. S3). We further immobilized the captured cells with a bioadhesive (3,4-dihydroxyphenylalanine, DOPA) to prevent cell loss, and subsequently performed immunostaining (in red for ER/PR and in blue for HER2). A glycerol-based index-matching solution was then applied to reduce light scattering from cells, thereby decreasing the intrinsic background signals in unstained cells (Fig. 2b); this strategy significantly enhance the color contrast between stained and unstained cells (Fig. 2b and Fig. S4).
Fig. 2. Assay development.

(a) Cell capture and staining. Immunolabeled cancer cells are captured on a glass surface conjugated with a cocktail of antibodies against EpCAM, EGFR, HER2, and MUC1. Capture cells are further immobilized by applying a 3,4-dihydroxyphenylalanine (DOPA)-based bioadhesive. Cells are then immunostained for ER/PR and HER2 expression. (b) Applying index-matching solution to the samples improved the signal-to-noise ratio (SNR) more than 3-fold compared to using PBS buffer. (c) Field of view (FOV) comparison between AIDA and bright-field microscopy (BFM). The entire FOV of AIDA was ~25 mm2, about 100 times larger than the FOV of conventional BFM (a 20× objective). In one example (inset), AIDA imaged ~2,000 cells per acquisition, whereas the imaged cell numbers with BFM were ~60 cells. (d) The AIDA signals strongly correlated with those measured by BFM (Pearson correlation coefficient r = 0.95). (e) Comparison between BFM image and pseudo-colored reconstruction image from AIDA.
We benchmarked AIDA imaging performance against conventional bright-field microscopy (BFM). Immunostained cell samples were prepared and imaged both with the AIDA imaging system and a bright-field microscope. We compared AIDA with 20× BFM as they have a similar spatial resolution. AIDA had about 100-fold larger FOV than BFM (Fig. 2c), offering much higher throughput in cellular analyses. For example, AIDA could image >2,000 cells with a single acquisition, whereas the BFM, with a comparable accuracy (20× objective), imaged ~60 cells (Fig. 2c inset). We next tested whether dual-color diffraction patterns can be used to extract color information on cells. Stained cells were imaged at 470 and 625 nm before and after staining to obtain absorbance changes at the respective wavelengths. For BFM, we obtained the same metrics by measuring red and blue levels in micrographs. The AIDA intensity profiles showed a high correlation with those from microscopy (Pearson correlation coefficient r = 0.95; P < 0.0001; Fig. 2d). Numerically reconstructed images also matched well with conventional micrographs (Fig. 2e), confirming that diffraction imaging maintain color information of stained cells.
AIDA molecular profiling
We validated AIDA for quantitative molecular profiling on breast cancer cells. We first generated calibration curves between absorbances and chromogen concentrations (Fig. S5a). These fitted curves (r 2 = 0.99) were then used to extract dual color intensities and convert them to respective target marker levels (red for ER/PR, blue for HER2). Specifically, we decoupled two absorbance values, each measured at 470 nm or 625 nm illumination, to the net absorbance of red and blue dyes; this was possible as the total absorbance is the sum of individual absorbances of constituting species (Beer’s law). From the net absorbance, the dye concentration could be estimated (Fig. S5b).
Applying the developed method, we analyzed a panel of cell lines that represents different breast cancer subtypes: MDA-MB-231, triple negative; T47D and MCF7, (ER/PR)+(HER2)−; SkBr3 and BT474, (ER/PR)−(HER2)+. Cells were immunostained against ER/PR and HER2, and their diffraction patterns were recorded by the AIDA system (Fig. 3a). We then constructed ER/PR and HER2 profile distributions (Fig. 3b). These profiles were used to set cut-off levels for ER/PR (0.175) and HER2 (0.22) positivity (mean + 2 × standard deviation, negative reference cell lines).30 We further compared AIDA with the gold standard flow cytometry. The scatter plots from AIDA and flow cytometry showed good concordance (Figs. 3c, d), delineating different cell populations. The mean expression levels of ER/PR and HER2 also matched between these methods (Fig. 3e), which confirmed AIDA’s analytical accuracy.
Fig. 3. Quantitative molecular profiling with AIDA.

(a) Breast cancer cell lines representing four subtypes (MDA-MB-231, (ER/PR)−(HER2)−; T47D, (ER/PR)+(HER2)−; SkBr3, (ER/PR)−(HER2)+; and BT474, (ER/PR)+(HER2)+) were stained for ER/PR (red) and HER2 (blue), and imaged via bright field microscopy (BFM) and AIDA. (b) ER/PR and HER2 expression profiles were obtained from diffraction images. (c) AIDA simultaneously measured ER/PR and HER2 on at the single cell level, generating a 2-dimensional population density plot. Cell lines with different molecular profiles formed separate clusters. For each cell line, the distribution was normalized to its maximum value. (d) A density plot was generated for the same five cell lines using flow cytometry. (e) The average expression levels of ER/PR and HER2 were measured by AIDA (left) and the gold-standard flow cytometry (FCM; right). The results showed a good match.
Deep-learning algorithm
The previous approach for diffraction analyses involved computationally intensive image-reconstruction and cell counting. Executing these steps required a powerful local server (equipped with graphical processing units, GPU) or cloud computing, both of which are impractical in resource limited settings. In LMIC, high-speed data connection can be unavailable or expensive for large file transfer, and dropped communications can be a source of error. We reasoned that the deep-learning based approach could overcome such challenges: after initial learning processes in a central server, the developed algorithms can be installed in local, regular computers (or micro-controllers) for on-site execution.
The deep learning algorithm had two modules, cell recognition (Fig. 4a and Fig. S6a) and classification (Fig. 4b and Fig. S6b). The cell recognition module used a convolutional neural network (CNN) to identify diffraction patterns from cell. The network was trained with annotated diffraction images of cells (9,795 images) and non-cell objects (e.g., dust, artifacts; 9,795 images; see the Method section for details). After 150 epoch, the accuracy reached 99% (Fig. 4c and Fig. S7). Importantly, the module efficiently excluded large artifacts, such as air bubbles or dusts, and seemingly cell-like diffraction patterns (Fig. 4e).
Fig. 4. Deep learning algorithms for AIDA.

(a) Cell detection network. The input to this module was a “cell-like” diffraction image (taken at 470 nm; 64 × 64 pixels) proposed by a maximally stable extremal region blob detection algorithm. The image was processed through a trained convolutional neural network (CNN) consisting of two convolutional layers (Conv2D), two pooling layers (Max pool), and two fully connected layers (FC). The CNN labeled the image as a cell (1) or a non-cell (0) diffraction pattern. ReLU, rectified linear unit; P d, dropout rate. (b) Diffraction images classified as cells from (a) entered the next module for color classification. For dual color recognition, we concentrated a matching pair of diffraction patterns taken at 470 and 625 nm illumination. The color classification CNN had eight Conv2D and three FC layers, and produced the final output of 4 classes (breast cancer subtypes). PReLU, parametric ReLU. (c) The cell detection CNN was trained with 9795 cellular and 9795 non-cellular diffraction patterns. The accuracy reached 99%. (d) A representative diffraction image wherein cells were identified automatically (green boxes). Note the exclusion of an air bubble and a dust. (e) The color classification network was trained with 7718 diffraction images. The accuracy for color classification was 90.2%. (f) The entire network was used to analyze diffraction patterns from five breast cancer cell lines (MDA-MB-231, (ER/PR)−(HER2)−; MCF-7, (ER/PR)+(HER2)−; T47D, (ER/PR)+(HER2)−; SkBr3, (ER/PR)−(HER2)+; and BT474, (ER/PR)+(HER2)+). (g) The image analysis time with the trained neural network was 3 sec on a personal computer. Conventional analyses based on diffraction reconstruction were >400-fold slower.
The color classification module used a second CNN for color recognition (Fig. 4b and Fig. S6b). We trained the network with 7,718 diffraction pairs taken at 470 and 625 nm. Ground-truth training labels were created based on molecular expressions from numerical image reconstruction (Fig. S8). Passing through the classification module, each cell was assigned to one of four breast cancer subtypes: (ER/PR)+(HER2)+; (ER/PR)+(HER2)−; (ER/PR)−(HER2)+; (ER/PR)−(HER2)−. After 1,500 epoch, the training accuracy reached 90.2% (Fig. 4e). The cause of our accuracy loss could be attributed to (i) the uneven distribution of each cell type in the training set (Fig. S8), which could skew the network’s resolving power; and (ii) intrinsic variations in input images (e.g., background noise) adding fuzziness or margin of errors.
We applied the developed algorithm to analyze raw images from model cell lines. The fully trained network automatically analyzed full diffraction images (2,592 × 1,944 pixels per image) as an input, identified individual cells, and classified them into four subtypes (Fig. 4f). The AIDA results were in concordance with flow cytometry-based subtyping (Fig. S9). Importantly, the analysis time was ~3 sec even on a regular computer (2.4 GHz CPU, 8 GB RAM) without using a GPU; the speed enhancement was 400-fold compared to the conventional reconstruction/counting method (1,200 sec, Fig. 4g).
Proof-of-principle testing in FNA
We next applied AIDA to the clinical scenario testing for molecular markers in hundreds of cells obtained from two breast cancer patients who were referred for clinically indicated image-guided aspiration and biopsy of palpable lumps suspicious for breast cancer. Aspirated cells were immuno-stained against ER/PR (red) and HER2 (blue) and images were acquired by the AIDA prototype. We applied the AIDA algorithms to (i) identify cancer cells and (ii) extract ER/PR and HER2 expressions based on their diffraction patterns without image reconstruction. With cut-off values established in cell line experiments, we measured percentile of ER/PR and HER2 positive/negative cells. Clinical pathology data were used as gold standard. Figure 5a shows AIDA readouts for two representative clinical samples. Patient 01 exhibited low expression in both ER/PR and HER2 (triple negative), whereas Patient 02 showed high ER/PR but low HER2 expression levels. We further analyzed aliquots of samples via flow cytometry. The quad marker profile (EpCAM, EGFR, HER2, MUC1; i.e. singular markers or combinations) had previously been identified as a universal signature of epithelial cancers.29 The quad marker signature was indeed elevated in the patient samples, which supports the rationale for capturing cancer cells using these markers (Fig. S10). The expression profiles of ER/PR and HER2 (Fig. 5b) also matched well with AIDA results. The automated AIDA completes image analysis of large FOV images (25 mm2) within a few seconds without the need of high-end computing power and its results were well aligned with clinical pathology reports.
Fig. 5. AIDA readouts for clinical samples obtained by fine-needle aspirates.

(a) Examples of AIDA results for two patient samples. Patient #1 showed low ER/PR and low HER2 levels, (ER/PR)− (HER2)−; Patient #2 showed high ER/PR and low HER2 levels, (ER/PR)+(HER2)−. (b) Correlative results obtained by flow cytometry.
DISCUSSION
The global burden of cancer is immense and it is estimated that by 2020, there will be a 50% rise in cancer cases over the current 2 billion cases.8, 31 These factors are due to population growth, aging of the population and increasing numbers of cancer survivors. Choosing the most appropriate treatment for a given patient (precision medicine), evaluating treatment efficacy longitudinally, and detecting cancer early rely on sophisticated diagnostic capabilities. These challenges are increasingly well met in developed countries, but unfortunately represent a severe bottleneck in developing countries. For example, it is estimated that there can be fewer than 1 pathologist per 1,000,000 inhabitants in some of African countries32, 33 whereas there are ~50 per 1,000,000 in the US.34 Needless to say, there is a need to advance technologies to bypass labor intensive tests and make them affordable at the same time. Based on advances in computational optics and deep learning, we advanced AIDA as a low-cost digital system for breast cancer diagnosis of fine needle aspirates. We believe that this system could potentially address multiple global challenges particularly with further validation and expansion to other cancer types.
AIDA combines lens-less microscopy with deep learning-based computational analyses. Lens-less microscopy (digital inline microholography) has been used to observe large objects such as C. elegans,35 tissue sections,14 S. aureus,36 cells,18 and other small objects (nanospheres).37 More recently, it has become apparent that the approach could be also used to obtain molecular information. Using immunobeads was one way to change the holographic patterns of targets cells.20 One of the challenges with the bead-based method is that intracellular biomarkers can be hard to detect. This is particularly the case for low abundant targets, intra-nuclear proteins or when cells are small. In the current work, we therefore adapted immunochromogenic staining to micro-holography.
The main advantage of AIDA over conventional microscopy is its low cost and the fact that it does not require specialists to determine a diagnosis. Furthermore, the developed system can interrogate a much larger number of cells with a single image acquisition because of the optical configuration and absence of magnifying lenses. For example we have shown that it is possible to acquire and analyze ~1,000 individual cells within 3 sec. Such a capacity surpasses even flow cytometers or skilled cytopathologists scanning across slides, and importantly could elucidate intratumor heterogeneity. Better understanding of intratumor molecular heterogeneity during disease progression and treatment will undoubtedly improve cancer diagnosis and the design of therapies, leading the way to more personalized medicine. In essence, combined with a trained neural network, AIDA can automatically extract clinically relevant information with minimal human curation in short periods of time. Note that a deep learning algorithm is typically specific to a given imaging setup (e.g., the pixel size in an imager, distance between the imager and samples), and changes in imaging hardware may require training a new neural network. In our case, one can apply the “transfer learning” approach,39 which uses pre-existing neural networks as a starting basis to reduce training time.
The current work was designed to prove the overall AIDA concept (i.e., cancer cell capture, multicolor diffraction imaging, deep learning algorithms). As such, extensive clinical and field testing was beyond the scope of this developmental study. The data obtained with the first prototype indicated that future systems could be further improved. This includes implementing a higher degree of multiplexing capabilities. Technical challenges to overcome are (i) aligning different light sources (≥3) in the same optical path to minimize shadowing effect (e.g., by using optical fibers), and (ii) finding/expanding orthogonal chromogenic substrates for different colors (e.g., red, blue, and green). Another important direction is to implement a miniaturized lens-less fluorescent system.38 Exploring and adapting the neural network with additional training samples would likely allow for further improved image analysis and diagnostic accuracy. Particularly, using a larger number of patient samples will likely be necessary to fine tune the system for clinical uses. In this regard, we started the process of accruing additional breast cancer samples. The test results will be used to obtain rigorous performance statistics as well as to further train current neural networks. Finally, we expect that systems and assays will become cheaper as they will be scaled up. We currently estimate the component costs to be <$350 and reagent costs to be <$10 per assay (Table S1).
CONCLUSION
In summary, we have advanced the AIDA platform for point-of-care cancer detection. Key features include multiplexed diffraction imaging, surface chemistry for microfluidics, direct recognition of cells via deep learning, and automated cancer classification. These features, combined with advantages of lens-less imaging, enable cost-effective, rapid, and on-site cancer diagnostics without requiring specialists. As proof-of-concept, we have applied AIDA for breast cancer detection and classification. With further clinical validation and expansion to other cancer types, we envision AIDA as a valuable tool to address global cancer challenges particularly in low and middle income countries.
METHODS AND EXPERIMENTAL
AIDA imaging system
The light source had two LEDs (M470D2, M625D2, Thorlabs) with emission wavelengths of 470 nm and 625 nm, respectively, and a dichromatic mirror (550 nm cutoff). A 220-grit optical diffuser (DGUV10) was placed between the mirror and a 50-µm aperture (Thorlabs). Optical components were aligned inside a custom-made holder. Diffraction Images were recorded by a monochromatic 10-megapixel CMOS imager (MT9P031, On-Semiconductor) mounted on a USB 3.0 interface board (Imaging Source). The pixel size was 2.2 µm, and the field of view 5.7 × 4.3 mm2. We made a device body using a 3-dimension printer (Formlabs), and light-proofed its inside with flocking papers (Edmund Optics). The entry door to the sample loading was snap-fastened to the body via four pairs of disc magnets (diameter, 3.2 mm). The overall size of the device was 11.8 (L) × 12.3 (W) × 15.6 (H) cm3.
Deep learning algorithm – cell recognition
The detection routine consisted of three sub-routines: a maximally stable extremal regions (MSER) blob detection algorithm, a faster non-maximum suppression algorithm, and a convolutional neural network (CNN). The MSER blob detection algorithm found cell-like regions in the diffraction images. We optimized nine parameters (delta, minimum area, maximum area, maximum variation, minimum diversity, maximum evolution, area threshold, minimum margin, and edge blur size) which are all available parameters in OpenCV library. We determined the value of each parameter through a brute-force grid search algorithm. Once regions were proposed by the MSER algorithm, the bounding box coordinates were filtered by the non-maximum suppression algorithm with a maximum overlap cut-off of 0.25. The remaining boundary box coordinates were mapped to a diffraction input image, and each region (64 × 64 pixels) was passed as an input to the CNN that was trained to classify a region as either containing cells, or containing no cells. We prepared training datasets from annotated diffraction images. The true identity (cell vs. no cell) of each diffraction pattern was manually confirmed by checking its reconstructed objective image or a micrograph. We generated 19,592 annotated images: 9,796 from cells and 9,796 from non-cell objects (e.g., debris, air bubble, dust). Of these, we used 6,857 cell and 6,857 non-cell images as a training set (70% total); the rest was used as a testing (validation) set. We applied the Adam optimization algorithm40 that iteratively tune the weights in each layer of the CNN by minimizing the Binary Cross-Entropy loss function. All codes were written using Python 3.6.1 and run on a computer with an Intel i7–7700HQ CPU at 2.80GHz. Keras with Tensorflow was used to build and train the models.
Deep learning algorithm – color classification
The color classification model had eight convolutional layers with the final layer flattened to a vector of size 768. This vector is the input to three fully connected layers which produce the final output of four classes: (ER/PR)+(HER2)+, (ER/PR)+(HER2)−, (ER/PR)−(HER2)+, (ER/PR)−(HER2)−. Each convolutional layer used a parameterized rectified linear unit (PReLU) activation function. Batch normalization was applied after each convolutional layer, and a single dropout layer (dropout rate, 0.25) was used after the 6th convolutional layer to reduce overfitting (Fig. S6). The input to the network was a pair of cell diffraction patterns measured at 625 nm and 470 nm illumination; these two images for a given cell were normalized and concatenated (128 × 64 pixels). We used 7718 concatenated diffraction images for the network training. When constructing the training set, we applied data augmentation techniques (random rotations, horizontal mirroring, vertical mirroring of images) to ensure translation invariance of the network output. The ground truth for each input image (i.e., color intensities) was obtained by performing mathematical reconstruction of diffraction patterns; the mean pixel intensity inside each reconstructed cell image was calculated and converted to a molecular expression value. The prepared images were split into two sets (a 7:3 ratio) for training and validation, respectively. The model was trained for 1,500 iterations with a batch size of 64 samples. Each input image was categorized into one of four classes. We applied the Adam optimization algorithm40 to iteratively tune the weights in each layer by minimizing the categorical cross-entropy loss function.
Cell lines
A panel of breast cancer cell lines that express different levels of triple markers (ER, PR, HER2), were used for assay validation: MCF7, T47D, BT474, SkBr3, MDA-MB-231. All cell lines were purchased from the American Type Culture Collection (ATCC). MCF7 and MDA-MB-231 were maintained in DMEM; SkBr3 in McCoys 5A; T47D and BT474 in RPMI-1640. All media were supplemented with 10% fetal bovine serum (FBS) and penicillin streptomycin (Cellgro). All cell lines were routinely tested using MycoAlert mycoplasma detection kit (Lonza).
Clinical samples
FNA samples were obtained as part of a standard-of-care, clinically indicated image guided biopsy. Ultrasound or computed tomography guidance was used to confirm correct 18G needle position within a given mass lesion. Two coaxial 20G FNA passes were made to yield material for cytopathology and AIDA analysis. Additional core biopsies were obtained for conventional pathology work-up which served as the gold standard. FNA samples were fixed in CytoLyt and then processed as described for cell lines. AIDA analyses were conducted blinded to conventional pathology and vice versa.
Chromogenic staining
We performed a thorough screening test for assay optimization and validation in cell lines before moving to clinical samples. Specifically we tested (i) different antibodies from multiple vendors (Table S2), (ii) different substrates and combinations (Fig. S2), and (iii) different staining conditions (sequence, time). In general, harvested cells were fixed and permed with BD fix/perm (BD Biosciences) for 15 min followed by blocking with Assay buffer supplemented with 2% bovine serum albumin (BSA) and 5% normal goat serum for 15 min. Cells were labeled with anti-ER, anti-PR, and anti-HER2 (10 µg/mL) for 30 min followed by a 30-min incubation in a 1:1 (v/v) mix of HRP anti-rabbit and AP anti-rat IgG secondary antibody. The labeled cells were then captured on the surface using a cocktail of antibodies against EpCAM, EGFR, HER2, and MUC1, and unbound cells were removed by washing with fresh PBS. The captured cells were incubated with the 3,4-dihydroxyphenylalanine (DOPA)-based bioadhesive (Cell-Tak, Corning) to tightly bind to the surface. The cells were sequentially stained with Immpact NovaRed Peroxidase (HRP) and Vector Blue Alkaline Phosphatase (AP) substrates (Vector Labs). Right before imaging, the captured and stained cells were placed in a glycerol-based mounting solution (80% glycerol) to optically match the refractive index of cells. Two images per sample (pre- and post-staining) were taken using the AIDA device at 470 and 625 nm wavelengths. Antibodies used are listed in Table S4. Assay buffer was BD perm/wash buffer (BD Biosciences).
Flow cytometry
We performed flow cytometry to benchmark AIDA measurements. About 106 cells were prepared in the same way as for AIDA, except secondary antibodies conjugated with fluorescent dyes were used instead of the HRP or AP secondary antibodies. Fluorescent signals were measured using BD LSRII Flow Cytometer (BD Biosciences). and normalized against isotope controls.
Statistics
The Spearman correlation coefficient was used to quantify the correlations. Group differences were tested using unpaired _t_-test. All tests were two-sided, and a P value of <0.05 was considered statistically significant. The positive cut-offs for ER/PR and HER2 expression levels were determined according to the conventional criterion: (mean + 2× standard deviation) from the marker expression profiles of negative cell lines.
Supplementary Material
SI
ASSOCIATED CONTENT
The Supporting Information is available free of charge on the ACS Publications website at DOI: . The supporting materials include the followings:
Fig. S1: Stand-alone AIDA device.
Fig. S2. Chromogenic substrate screening.
Fig. S3. Cancer cell capture with the quad-marker combination.
Fig. S4. Index matching strategy.
Fig. S5. Converting raw absorbances to dye concentrations.
Fig. S6. Architecture of AIDA neural networks.
Fig. S7. Model loss for deep neural networks.
Fig. S8. Training data for deep learning.
Fig. S9. Flow cytometry-based subtyping.
Fig. S10. Representative flow cytometry histograms of patient FNA samples.
Table S1. Cost breakdown for AIDA imaging system and reagent costs per single assay.
Table S2. List of antibodies used in this study.
ACKNOWLEDGEMENT
The authors were supported in part by 5UH2CA202637 (R.W.), a grant from the V-Foundation for Cancer Research (R.W., C.M.C.) and 4R00CA201248 (H.I.); in part by R21-CA205322, R01-HL113156, MGH scholar fund, and the National Research Foundation of Korea (NRF-2017M3A9B4025699, NRF- 2017M3A9B4025709).
ABBRIVIATIONS
AIDA
Artificial Intelligence Diffraction Analysis
POC
point-of-care
ER
estrogen receptor
PR
progesterone receptor
HER2
human epidermal growth factor receptor 2
BFM
bright-field microscopy
LMIC
low and middle income countries
Footnotes
The authors declare no competing financial interest.
REFERENCES
- (1).Bray F; Ren JS; Masuyer E; Ferlay J Global Estimates of Cancer Prevalence for 27 Sites in the Adult Population in 2008. Int. J. Cancer 2013, 132, 1133–1145. [DOI] [PubMed] [Google Scholar]
- (2).Ferlay J; Soerjomataram I; Dikshit R; Eser S; Mathers C; Rebelo M; Parkin DM; Forman D; Bray F Cancer Incidence and Mortality Worldwide: Sources, Methods and Major Patterns in Globocan 2012. Int. J. Cancer 2015, 136, E359–E386. [DOI] [PubMed] [Google Scholar]
- (3).Torre LA; Siegel RL; Ward EM; Jemal A Global Cancer Incidence and Mortality Rates and Trends--an Update. Cancer Epidemiol Biomarkers Prev. 2016, 25, 16–27. [DOI] [PubMed] [Google Scholar]
- (4).Ludwig JA; Weinstein JN Biomarkers in Cancer Staging, Prognosis and Treatment Selection. Nat. Rev. Cancer 2005, 5, 845–856. [DOI] [PubMed] [Google Scholar]
- (5).Zotov V; Shyyan R Introduction of Breast Cancer Screening in Chernihiv Oblast in the Ukraine: Report of a Path Breast Cancer Assistance Program Experience. Breast J. 2003, 9, S75–S80. [DOI] [PubMed] [Google Scholar]
- (6).Awadelkarim KD; Arizzi C; Elamin EO; Hamad HM; De Blasio P; Mekki SO; Osman I; Biunno I; Elwali NE; Mariani-Costantini R; et al. Pathological, Clinical and Prognostic Characteristics of Breast Cancer in Central Sudan Versus Northern Italy: Implications for Breast Cancer in Africa. Histopathology 2008, 52, 445–456. [DOI] [PubMed] [Google Scholar]
- (7).Fregene A; Newman LA Breast Cancer in Sub-Saharan Africa: How Does it Relate to Breast Cancer in African-American Women. Cancer 2005, 103, 1540–1550. [DOI] [PubMed] [Google Scholar]
- (8).Martelotto LG; Ng CK; Piscuoglio S; Weigelt B; Reis-Filho JS Breast Cancer Intra-Tumor Heterogeneity. Breast Cancer Res. 2014, 16, 210. [DOI] [PMC free article] [PubMed] [Google Scholar]
- (9).Beca F; Polyak K Intratumor Heterogeneity in Breast Cancer. Adv. Exp. Med. Biol. 2016, 882, 169–189. [DOI] [PubMed] [Google Scholar]
- (10).Pace LE; Keating NL A Systematic Assessment of Benefits and Risks to Guide Breast Cancer Screening Decisions. JAMA 2014, 311, 1327–1335. [DOI] [PubMed] [Google Scholar]
- (11).Zheng G; Horstmeyer R; Yang C Wide-Field, High-Resolution Fourier Ptychographic Microscopy. Nat. Photonics 2013, 7, 739–745. [DOI] [PMC free article] [PubMed] [Google Scholar]
- (12).Bishara W; Su TW; Coskun AF; Ozcan A Lensfree on-Chip Microscopy Over a Wide Field-of-view Using Pixel Super-Resolution. Opt. Express 2010, 18, 11181–11191. [DOI] [PMC free article] [PubMed] [Google Scholar]
- (13).Fang Y; Yu N; Jiang Y; Dang C High-Precision Lens-Less Flow Cytometer on a Chip. Micromachines 2018, 9, 227. [DOI] [PMC free article] [PubMed] [Google Scholar]
- (14).Greenbaum A; Zhang Y; Feizi A; Chung PL; Luo W; Kandukuri SR; Ozcan A Wide-Field Computational Imaging of Pathology Slides Using Lens-Free on-Chip Microscopy. Sci. Transl. Med. 2014, 6, 267ra175. [DOI] [PubMed] [Google Scholar]
- (15).Luo W; Greenbaum A; Zhang Y; Ozcan A Synthetic Aperture-Based on-Chip Microscopy. Light: Sci. Appl. 2015, 4, e261. [Google Scholar]
- (16).Mudanyali O; Tseng D; Oh C; Isikman SO; Sencan I; Bishara W; Oztoprak C; Seo S; Khademhosseini B; Ozcan A Compact, Light-Weight and Cost-Effective Microscope Based on Lensless Incoherent Holography for Telemedicine Applications. Lab Chip 2010, 10, 1417–1428. [DOI] [PMC free article] [PubMed] [Google Scholar]
- (17).Sobieranski AC; Inci F; Tekin HC; Yuksekkaya M; Comunello E; Cobra D; von Wangenheim A; Demirci U Portable Lensless Wide-Field Microscopy Imaging Platform Based on Digital Inline Holography and Multi-Frame Pixel Super-Resolution. Light: Sci. Appl. 2015, 4, 24681. [DOI] [PMC free article] [PubMed] [Google Scholar]
- (18).Wei Q; McLeod E; Qi H; Wan Z; Sun R; Ozcan A On-Chip Cytometry Using Plasmonic Nanoparticle Enhanced Lensfree Holography. Sci. Rep. 2013, 3, 1699. [DOI] [PMC free article] [PubMed] [Google Scholar]
- (19).Zhang J; Sun J; Chen Q; Li J; Zuo C Adaptive Pixel-Super-resolved Lensfree in-Line Digital Holography for Wide-Field on-Chip Microscopy. Sci. Rep 2017, 7, 11777. [DOI] [PMC free article] [PubMed] [Google Scholar]
- (20).Im H; Castro CM; Shao H; Liong M; Song J; Pathania D; Fexon L; Min C; Avila-Wallace M; Zurkiya O; et al. Digital Diffraction Analysis Enables Low-Cost Molecular Diagnostics on a Smartphone. Proc. Natl. Acad. Sci. U. S. A 2015, 112, 5613–5618. [DOI] [PMC free article] [PubMed] [Google Scholar]
- (21).Im H; Park YI; Pathania D; Castro CM; Weissleder R; Lee H Digital Diffraction Detection of Protein Markers for Avian Influenza. Lab Chip 2016, 16, 1340–1345. [DOI] [PMC free article] [PubMed] [Google Scholar]
- (22).Pathania D; Im H; Kilcoyne A; Sohani AR; Fexon L; Pivovarov M; Abramson JS; Randall TC; Chabner BA; Weissleder R; et al. Holographic Assessment of Lymphoma Tissue (HALT) for Global Oncology Field Applications. Theranostics 2016, 6, 1603–1610. [DOI] [PMC free article] [PubMed] [Google Scholar]
- (23).Song J; Leon Swisher C; Im H; Jeong S; Pathania D; Iwamoto Y; Pivovarov M; Weissleder R; Lee H Sparsity-Based Pixel Super Resolution for Lens-Free Digital in-Line Holography. Sci. Rep 2016, 6, 24681. [DOI] [PMC free article] [PubMed] [Google Scholar]
- (24).Anderson BO; Ilbawi AM; El Saghir NS Breast Cancer in Low and Middle Income Countries (LMICs): A Shifting Tide in Global Health. Breast J. 2015, 21, 111–118. [DOI] [PubMed] [Google Scholar]
- (25).Chandika AB; Gakwaya AM; Kiguli-Malwadde E; Chalya PL Ultrasound Guided Needle Aspiration Versus Surgical Drainage in the Management of Breast Abscesses: A Ugandan Experience. BMC Res. Notes 2012, 5, 12. [DOI] [PMC free article] [PubMed] [Google Scholar]
- (26).Castro CM; Ghazani AA; Chung J; Shao H; Issadore D; Yoon TJ; Weissleder R; Lee H Miniaturized Nuclear Magnetic Resonance Platform for Detection and Profiling of Circulating Tumor Cells. Lab Chip 2014, 14, 14–23. [DOI] [PMC free article] [PubMed] [Google Scholar]
- (27).Ghazani AA; McDermott S; Pectasides M; Sebas M; Mino-Kenudson M; Lee H; Weissleder R; Castro CM Comparison of Select Cancer Biomarkers in Human Circulating and Bulk Tumor Cells Using Magnetic Nanoparticles and a Miniaturized Micro-NMR System. Nanomedicine 2013, 9, 1009–1017. [DOI] [PMC free article] [PubMed] [Google Scholar]
- (28).Ghazani AA; Pectasides M; Sharma A; Castro CM; Mino-Kenudson M; Lee H; Shepard JA; Weissleder R Molecular Characterization of Scant Lung Tumor Cells Using Iron-Oxide Nanoparticles and Micro-Nuclear Magnetic Resonance. Nanomedicine 2014, 10, 661–668. [DOI] [PMC free article] [PubMed] [Google Scholar]
- (29).Haun JB; Castro CM; Wang R; Peterson VM; Marinelli BS; Lee H; Weissleder R Micro-NMR for Rapid Molecular Analysis of Human Tumor Samples. Sci. Transl. Med 2011, 3, 71ra16. [DOI] [PMC free article] [PubMed] [Google Scholar]
- (30).Greiner M; Sohr D; Göbel P A Modified Roc Analysis for the Selection of Cut-Off Values and the Definition of Intermediate Results of Serodiagnostic Tests. J. Immunol. Methods 1995, 185, 123–132. [DOI] [PubMed] [Google Scholar]
- (31).Weir HK; Thompson TD; Soman A; Møller B; Leadbetter S The Past, Present, and Future of Cancer Incidence in the United States: 1975 Through 2020. Cancer 2015, 121, 1827–1837. [DOI] [PMC free article] [PubMed] [Google Scholar]
- (32).Adesina A; Chumba D; Nelson AM; Orem J; Roberts DJ; Wabinga H; Wilson M; Rebbeck TR Improvement of Pathology in Sub-Saharan Africa. Lancet Oncol. 2013, 14, e152–e157. [DOI] [PubMed] [Google Scholar]
- (33).Nelson AM; Milner DA; Rebbeck TR; Iliyasu Y Oncologic Care and Pathology Resources in Africa: Survey and Recommendations. J. Clin. Oncol 2016, 34, 20–26. [DOI] [PubMed] [Google Scholar]
- (34).Wilson ML; Fleming KA Global Cancer Care: The Role of Pathology. Am. J. Clin. Pathol 2016, 145, 6–7. [DOI] [PubMed] [Google Scholar]
- (35).Cui X; Lee LM; Heng X; Zhong W; Sternberg PW; Psaltis D; Yang C Lensless High-Resolution on-Chip Optofluidic Microscopes for Caenorhabditis Elegans and Cell Imaging. Proc. Natl. Acad. Sci. U. S. A 2008, 105, 10670–10675. [DOI] [PMC free article] [PubMed] [Google Scholar]
- (36).Veli M; Ozcan A Computational Sensing of Staphylococcus Aureus on Contact Lenses Using 3d Imaging of Curved Surfaces and Machine Learning. ACS Nano 2018, 12, 2554–2559. [DOI] [PMC free article] [PubMed] [Google Scholar]
- (37).Mudanyali O; McLeod E; Luo W; Greenbaum A; Coskun AF; Hennequin Y; Allier CP; Ozcan A Wide-Field Optical Detection of Nanoparticles Using on-Chip Microscopy and Self-Assembled Nanolenses. Nat. Photonics 2013, 7, 247–254. [DOI] [PMC free article] [PubMed] [Google Scholar]
- (38).Adams JK; Boominathan V; Avants BW; Vercosa DG; Ye F; Baraniuk RG; Robinson JT; Veeraraghavan A Single-Frame 3d Fluorescence Microscopy With Ultraminiature Lensless Flatscope. Sci. Adv 2017, 3, e1701548. [DOI] [PMC free article] [PubMed] [Google Scholar]
- (39).Christiansen EM; Yang SJ; Ando DM; Javaherian A; Skibinski G; Lipnick S; Mount E; O’Neil A; Shah K; Lee AK; et al. In Silico Labeling: Predicting Fluorescent Labels in Unlabeled Images. Cell 2018, 173, 792–803. [DOI] [PMC free article] [PubMed] [Google Scholar]
- (40).Kingma DP; Ba J Adam: A Method for Stochastic Optimization. CoRR; 2014, abs/1412.6980 (accessed on August 13, 2018). [Google Scholar]
Associated Data
This section collects any data citations, data availability statements, or supplementary materials included in this article.
Supplementary Materials
SI
ASSOCIATED CONTENT
The Supporting Information is available free of charge on the ACS Publications website at DOI: . The supporting materials include the followings:
Fig. S1: Stand-alone AIDA device.
Fig. S2. Chromogenic substrate screening.
Fig. S3. Cancer cell capture with the quad-marker combination.
Fig. S4. Index matching strategy.
Fig. S5. Converting raw absorbances to dye concentrations.
Fig. S6. Architecture of AIDA neural networks.
Fig. S7. Model loss for deep neural networks.
Fig. S8. Training data for deep learning.
Fig. S9. Flow cytometry-based subtyping.
Fig. S10. Representative flow cytometry histograms of patient FNA samples.
Table S1. Cost breakdown for AIDA imaging system and reagent costs per single assay.
Table S2. List of antibodies used in this study.