Dual Ultrastructural Localization of μ-Opioid Receptors and NMDA-Type Glutamate Receptors in the Shell of the Rat Nucleus Accumbens (original) (raw)
Abstract
The effectiveness of NMDA antagonists in modulating the motor and motivational effects of opiates is attributed, in part, to functional associations involving NMDA receptors and μ-opioid receptors (MORs) in the shell of the nucleus accumbens (Acb). To determine the subcellular sites for potential functional interactions between opiate ligands and NMDA receptors in this region, we examined the ultrastructural localization of antipeptide antisera against MOR and the R1 subunit of the NMDA receptor in the Acb shell of the adult rat brain. MOR-like immunoreactivity (MOR-LI) was seen primarily in dendrites, whereas NMDAR1-like immunoreactivity (NMDAR1-LI) was detected more often in axon terminals forming asymmetric synapses. In these profiles, MOR labeling was localized mainly to extrasynaptic plasma membranes, whereas NMDAR1-LI was associated with both synaptic and extrasynaptic sites. Of 307 MOR-labeled processes, 17.9% of the dendrites and 9.4% of the axon terminals also contained NMDAR1-LI. In addition, 24.7% of the dendrites containing only MOR-LI were apposed to NMDAR1-labeled axons or terminals. We conclude that in the shell of the Acb, the output of single neurons can be dually modulated by (1) activation of MOR and NMDA receptors in the same dendrites or (2) combined activation of presynaptic NMDA receptors in afferents contacting dendrites containing MOR. In addition, the colocalization of MOR and NMDAR1 in certain axon terminals in the Acb suggests their dual involvement in the presynaptic release of neurotransmitters in this region.
Keywords: opiate, withdrawal, locomotion, addiction, glutamate, colocalization, immunocytochemistry, morphine, enkephalin
Behavioral studies suggest that the nucleus accumbens (Acb) is critically involved in locomotor and opiate tolerance/withdrawal effects produced by activation of the μ-opioid receptor (MOR). Infusion of MOR agonists into the Acb results in an initial decrease in locomotor activity followed by a period of hyperactivity (Pert and Sivit, 1977; Costall et al., 1978; Meyer et al., 1994). Depending on dopamine levels (Burns et al., 1994; Svensson et al., 1994), locomotor activity can also be increased by administration of NMDA receptor antagonists into the shell subregion of the Acb (Pulvirenti et al., 1992). This NMDA receptor antagonist-induced response can be attenuated by MOR agonists (Layer et al., 1991), thus suggesting that MOR and NMDA receptors have opposing behavioral effects in this region. The functional association between MOR and NMDA receptor ligands is further supported by observations in opiate addiction paradigms. Tolerance and withdrawal symptoms, for example, are both prevented by the administration of MOR or NMDA receptor antagonists (Gulya et al., 1988; Ben-Eliyahu et al., 1992;Kolesnikov et al., 1993; Trujillo and Akil, 1994). Opiate self-administration is also blocked by lesioning the Acb (Zito et al., 1985), providing further evidence that this region is involved in the motivational and withdrawal aspects of opiate addiction (Olds, 1982;Goeders et al., 1984; Koob et al., 1989). Thus, functional associations between the NMDA receptor and MOR in the Acb most likely contribute to the known effectiveness of NMDA receptor antagonists in the inhibition of opiate tolerance and withdrawal (Trujillo and Akil, 1994; Herman et al., 1995).
The susceptibility of both locomotor and opiate addictive behaviors to modulation by MOR and NMDA receptor ligands suggests that these receptors may be present in the same neurons in the Acb. Electrophysiological studies in the Acb support this hypothesis by showing that MOR activation increases postsynaptic NMDA-induced currents (Martin et al., 1997). Anatomical studies also indirectly suggest colocalization of MOR and NMDA receptors, because MOR and NMDA receptors have overlapping light microscopic distributions in the Acb (Hiller et al., 1994; Petralia et al., 1994). Furthermore, we have shown by electron microscopic immunocytochemical single labeling that MOR and NMDA receptors are each localized to dendritic plasma membranes and to axon terminals in the Acb (Gracy and Pickel, 1996; Svingos et al., 1996). These results suggest that MOR and NMDA receptor ligands may dually modulate the activity of single neurons or could differentially modulate pre- or postsynaptic components of single synapses. To test this hypothesis, we used dual-labeling immunogold and immunoperoxidase techniques to examine the electron microscopic immunocytochemical localization of antipeptide antisera against the intracellular C terminus of the cloned MOR protein and the R1 subunit of the NMDA receptor in sections through the shell of the rat Acb. Expressed throughout the CNS, the R1 subunit is necessary for NMDA channel function (Hollmann and Heinemann, 1994; Petralia et al., 1994). Analysis revealed that MOR is present in many NMDAR1-containing dendrites and in dendrites receiving input from NMDAR1-labeled terminals. MOR and NMDAR1 immunoreactivities were also seen colocalized in axon terminals.
MATERIALS AND METHODS
Tissue preparation. Four adult male Sprague Dawley rats (Hilltop Farms) (200–250 gm) were anesthetized deeply with 100 mg/kg sodium pentobarbital. They were then perfused transcardially through the ascending aorta with 50 ml of 3.75% acrolein followed by 200 ml of 2.0% paraformaldehyde in 0.1m phosphate buffer (PB), pH 7.4. The brains were removed and post-fixed in 2.0% paraformaldehyde for 30 min. Coronal sections 40–50 μm thick were cut through the Acb on a Vibratome (Technical Products International). The Acb was identified using plates 12–14 of the Paxinos and Watson Atlas (Paxinos and Watson, 1986).
Antisera. The MOR antiserum was raised in rabbit against the intracellular C terminus (amino acids 384–398) of the cloned receptor (Arvidsson et al., 1995). The monoclonal NMDAR1 antibody, which recognizes only the R1 subunit of the NMDA receptor, was made in mouse against a portion of the intracellular loop of the protein between transmembrane regions III and IV. This region is thought to be common to all of the eight NMDAR1 splice variants (Brose et al., 1994; Siegel et al., 1994; Zukin and Bennett, 1995).
Immunocytochemical labeling. The majority of Vibratome sections were processed using immunogold labeling for MOR detection and immunoperoxidase for NMDAR1 detection. A few sections were processed with reversed makers to verify the distribution of each receptor. Vibratome sections processed according to Chan et al. (1990) were placed in 1.0% sodium borohydride in 0.1 m PB for 30 min to bind reactive aldehydes. This procedure was followed by extensive rinsing in 0.1 m Tris-buffered saline (TBS) and incubation in 0.5% bovine serum albumin in 0.1 m TBS for 30 min. The tissue was then processed using a modification of the freeze–thaw method described by Descarries et al. (1992), in which sections were cryoprotected by incubation for 15 min in a solution of 30% sucrose and 0.07% glycerol in 0.1 m PBS. Sections were subsequently immersed in liquid freon, liquid nitrogen, and room temperature PB in rapid succession. After several rinses in TBS, the tissue was incubated for 2 d at 4°C in a solution containing rabbit anti-MOR antiserum (1:10,000 or 1:5000 for immunogold; 1:6500 for immunoperoxidase) (Incstar, Stillwater, MN) and mouse anti-NMDAR1 antibody (1:10 for immunogold; 1:10 or 1:25 for immunoperoxidase) (PharMingen, San Diego, CA).
The sections were rinsed in TBS and placed for 30 min in Jackson biotinylated horse anti-mouse IgG (1:200; Jackson, West Grove, PA) for peroxidase identification of NMDAR1. In reversed marker studies, a biotinylated goat anti-rabbit IgG (Vector Laboratories, Burlingame, CA) was used to identify MOR with immunoperoxidase. All tissue was incubated for 30 min in avidin–biotin complex (Vector) (Hsu et al., 1981) and rinsed in TBS. The biotinylated antibody was then visualized by a 6 min reaction in 22 mg of 3–3′-diaminobenzidine (Aldrich, Milwaukee, WI) and 10 μl of 30% hydrogen peroxide in 100 ml of 0.1m TBS.
Visualization of immunogold labeling proceeded with a rinse in 0.01m PBS followed by a 10 min incubation in 0.8% BSA with 0.1% gelatin in 0.01 m PBS. Sections then were incubated for 2 hr in goat anti-rabbit IgG (Amersham, Arlington Heights, IL) (for MOR immunogold identification) or goat anti-mouse IgG (Amersham) (for NMDA immunogold identification; 1:50) conjugated to 1 nmgold particles. They were rinsed in the 0.01 m PBS gelatin solution and in PBS alone, and then placed for 10 min in 1.25% glutaraldehyde in PBS. The tissue was rinsed in PBS, washed in 0.2m sodium citrate buffer, pH 7.4, and silver-intensified using a silver enhancement kit (Amersham) for 4–7 min.
After a rinse in 0.1 m PB, the sections were incubated for 1 hr in 2% osmium tetroxide in 0.2 m PB. They were washed in PB, dehydrated through a series of increasing alcohol concentrations, and incubated overnight in a 1:1 mixture of propylene oxide and Epon 812. They were then flat-embedded in Epon 812 (Leranth and Pickel, 1989), mounted on Epon blocks, and thin-sectioned with an LKB ultramicrotome using a diamond knife (Diatome, Fort Washington, PA). Thin sections of the shell region of the Acb were taken from the outer surface of the tissue. These were collected on copper grids, counterstained with uranyl acetate and Reynolds’ lead citrate (Reynolds, 1963), and examined on a Philips 201 electron microscope.
Electron micrographs used for illustrations were scanned with an AGFA Arcus II scanner (Agfa-Gevaert) to a Power Macintosh 8500/150 Computer (Apple Computer). The micrographs were minimally adjusted for contrast and sharpness using Adobe Photoshop (version 3.0.4, Adobe Systems). The lettering on the plates was composed using Adobe Illustrator (version 6.0; Adobe Systems) and QuarkXPress (version 3.32; Quark).
Data analysis. Electron micrographs were collected from four vibratome sections from each of four rats. A total area of 7640 μm2 of tissue from the shell of the Acb was used to determine the relative cellular distribution of immunoreactivity associated with neuronal and glial profiles for each antiserum. Furthermore, the number and type of immunolabeled profiles dually labeled with both antisera or apposed to other labeled elements were noted. Virtually all immunogold–silver labeling for MOR was associated with plasma or organelle membranes; there were few random particles. Medium or large profiles (0.50–5.0 μm) were counted only if they contained two or more gold particles, and small (0.10–0.50 μm) profiles were counted if they contained a single gold particle associated with the plasma membrane. The validity of this approach was shown previously by similarities in the number of immunogold versus immunoperoxidase-labeled profiles in reversed marker studies. Immunogold labeling was described as “perisynaptic” if the immunogold–silver particles were immediately adjacent to or up to 0.10 μm away from the synaptic density; labeling was described as “extrasynaptic” if the particles were localized to regions of the plasma membrane >0.10 μm away from the synaptic density. Elements labeled with peroxidase were identified by comparing the process with unlabeled elements of the same type within the adjacent neuropil. These immunoreactive profiles were recognized by their enhanced density and granularity in comparison with the unlabeled structures.
The cellular elements and synaptic types were classified according toPeters et al. (1991). Neuronal profiles not containing synaptic vesicles and receiving synaptic contacts from axon terminals were identified as dendrites. Structures 0.25 μm or smaller in diameter, which contained vesicles but did not make synaptic contacts, were identified as axons. Those profiles that contained vesicles and were 0.25–1.25 μm in diameter were classified as axon terminals. Glial processes were identified by the amorphous shape of the plasma membrane, by the lack of vesicles or synaptic contacts, and by the presence of glial filaments. Profiles with membranes contacting each other but not making a synapse were classified as “apposed” elements. Synaptic junctions were identified as symmetric or asymmetric on the basis of thin or thick postsynaptic specializations, respectively.
RESULTS
MOR-LI was most often localized to extrasynaptic plasmalemmal portions of dendrites or dendritic spines, whereas NMDAR1-LI was more commonly seen in axons. Of 307 profiles containing MOR-LI, 86 also contained NMDAR1-LI. Most colocalization was seen in dendrites, but one third was seen in axon terminals. In addition to colocalization, 76 processes containing MOR-LI were synaptically contacted by or directly apposed to NMDAR1-labeled elements. The remainder of MOR-labeled processes showed no apparent association with profiles containing NMDAR1-LI.
MOR-LI is localized mainly to extrasynaptic plasma membranes of dendrites and is rarely present in axons and terminals
MOR-LI was seen mainly in dendrites and dendritic spines in the shell of the Acb (Fig. 1). As described previously bySvingos et al. (1996), the immunogold labeling for MOR was primarily localized along perisynaptic and extrasynaptic regions of the dendritic plasma membrane (Figs. 2A, 3,4B). On rare occasions, MOR-LI was seen at intracellular sites associated with the smooth endoplasmic reticulum (Fig. 3A). Dendrites containing MOR-LI were most often apposed to unlabeled axons and terminals (Fig.2A). When junctions were seen, they were primarily asymmetric synapses (Fig. 4B).
Fig. 1.

Bar graph showing the distribution of immunogold-labeled MOR and immunoperoxidase-labeled NMDAR1 in neuronal compartments (dendrites, axons, terminals, somata) and in glial processes in the Acb. n = 307 MOR-labeled profiles and n = 397 NMDA-labeled profiles seen in 7640 μm2 area of tissue.
Fig. 2.
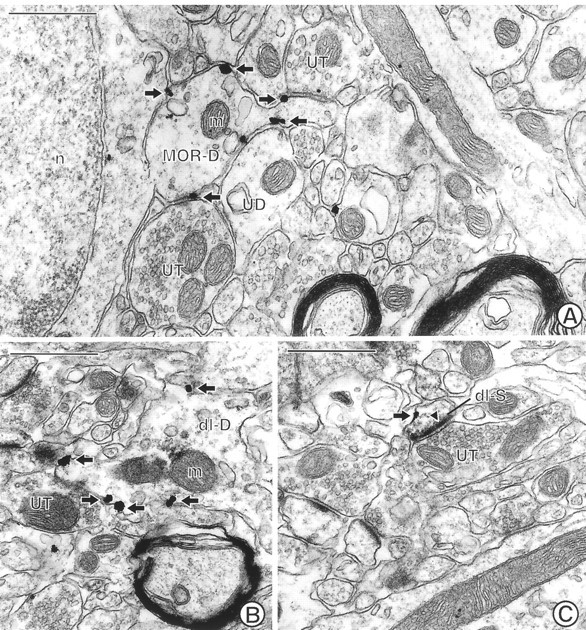
Electron micrographs through the Acb showing single MOR labeling and dual MOR and NMDAR1 labeling in spiny dendrites. A, A spiny dendrite (MOR-D) showing plasmalemmal immunogold labeling (arrows) for MOR is apposed to two unlabeled terminals (UT) and an unlabeled dendrite (UD). n, Nucleus; m, mitochondrion. B, A dendrite (dl-D) labeled with both immunogold (arrows) for MOR and immunoperoxidase for NMDAR1.UT, Unlabeled terminal. The electron dense peroxidase reaction product is most evident in the region above a mitochondrion (m) in the dendrite. C, A dually labeled small dendritic spine (dl-S) shows immunogold (arrow) MOR labeling along a nonsynaptic region of the plasma membrane. In contrast, immunoperoxidase for NMDAR1 is present within the asymmetric, excitatory-type contact (closed arrowhead) from an unlabeled terminal (UT). The peroxidase reaction product is also diffusely localized within the cytoplasm and the nonsynaptic regions of the plasma membrane. Scale bars, 0.5 μm.
Fig. 3.
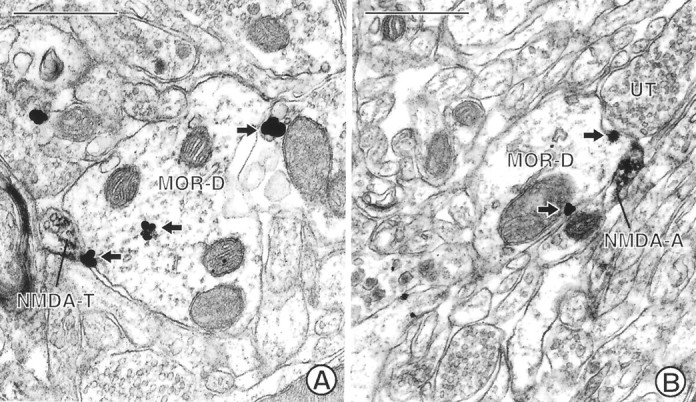
Electron micrographs showing MOR-immunoreactive dendrites in contact with NMDAR1-labeled terminals. A, A dendrite (MOR-D) labeled with immunogold (arrows) for MOR is apposed by a small terminal (NMDA-T) labeled with immunoperoxidase for NMDAR1. B, A small preterminal axon (NMDA-A) containing immunoperoxidase labeling for NMDAR1 apposes a dendrite (MOR-D) labeled with immunogold (arrows) for MOR. The dendrite is apposed by an unlabeled terminal (UT). Scale bars, 0.5 μm.
Fig. 4.
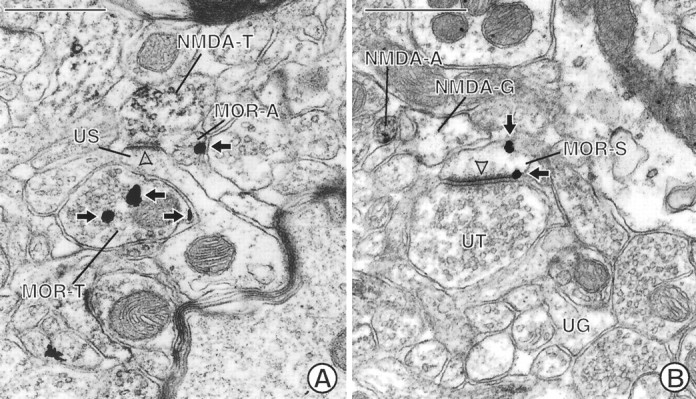
Electron micrographs showing appositional contacts between MOR-labeled neurons and NMDAR1-labeled neuronal and glial processes. A, An unlabeled dendritic spine (US) is apposed to a terminal (MOR-T) labeled with immunogold (arrows) for MOR. The spine also receives an asymmetric, excitatory-type contact (open arrowhead) from a terminal (NMDA-T) labeled with immunoperoxidase for NMDAR1. An apposed small unmyelinated axon (MOR-A) contains immunogold labeling (arrow) along the plasma membrane. B, A glial process (NMDA-G) shows immunoperoxidase reaction product that is recognizable by the granular precipitate within the cytoplasm and along its irregularly shaped plasma membrane. The peroxidase product can be seen by comparison with an unlabeled glial process (UG) in the micrograph. The labeled glial process apposes a dendritic spine (MOR-S) containing immunogold (arrows) for MOR on nonsynaptic regions of the plasma membrane. The spine receives an asymmetric contact (open arrowhead) from an unlabeled terminal (UT). NMDA-A, NMDAR1-labeled axon. Scale bars, 0.5 μm.
MOR-labeling in the Acb was seen less often in small unmyelinated axons and axon terminals (Fig. 1). In these axon terminals, immunogold particles were associated with both the plasma and vesicular membranes (Figs. 4A, 5A). MOR-labeled terminals were either without recognizable synapses or made asymmetric contact with unlabeled, or occasionally NMDAR1-labeled, dendrites or dendritic spines (Fig. 5A). In small, unmyelinated axons, MOR-LI was localized almost exclusively to the plasma membrane (Fig.4A); these axons were usually seen in bundles containing other unlabeled axons. Relatively few somata or glial processes contained detectable MOR-LI (Fig. 1).
Fig. 5.
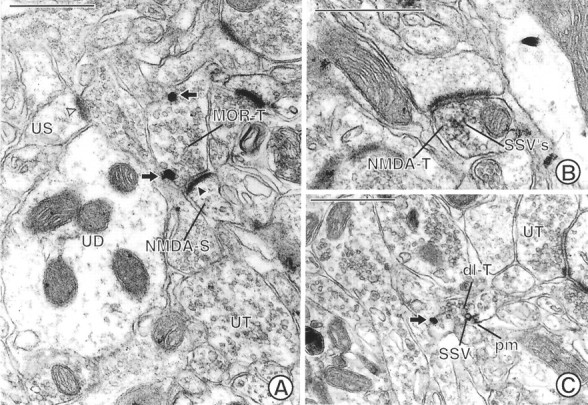
Electron micrographs showing labeling for MOR and/or NMDAR1 in axon terminals in the Acb. A, A terminal (MOR-T) shows immunogold labeling (arrows) for MOR along nonsynaptic regions of the plasma membrane. This terminal forms an asymmetric synapse with a dendritic spine (NMDA-S) containing immunoperoxidase reaction product for NMDA. The immunoperoxidase reaction product is associated with the asymmetric junction (closed arrowhead), which is notably more electron dense than that seen in an unlabeled spine (US) postsynaptic density (open arrowhead). UT, Unlabeled terminal;UD, unlabeled dendrite. B, A terminal (NMDA-T) showing dense immunoperoxidase reaction product for NMDAR1 that rims the membranes of many small synaptic vesicles (SSVs) forms an asymmetric contact on a dendritic spine. C, A dually labeled axon terminal (dl-T) contains both immunogold (arrow) labeling for MOR and immunoperoxidase labeling for NMDAR1. The gold particle is located on the plasma membrane of the terminal. The peroxidase reaction product is also associated with the plasma membrane (pm) and the membrane of adjacent SSVs. UT, Unlabeled terminal. Scale bars, 0.5 μm.
NMDAR1-LI is present most often in axons and terminals but is also seen in dendrites
Immunoperoxidase labeling for NMDAR1 was seen most frequently in axons and axon terminals (Fig. 1). Immunoperoxidase labeling for the NMDA receptor in presynaptic axons and axon terminals was usually diffusely distributed in the cytoplasm. The reaction product, however, was sometimes associated with the plasma membrane or the membranes of small synaptic vesicles (SSVs) (Figs. 3, 4A,5B). Although only slightly more terminals contained NMDAR1-LI than MOR-LI, substantially more unmyelinated axons were labeled for NMDAR1 versus MOR (Fig. 1). These axons and terminals apposed both unlabeled and MOR-labeled processes (Fig. 3), and the terminals often made asymmetric synapses with dendrites or dendritic spines (Figs. 4A, 5B).
NMDAR1-labeled dendrites were less numerous than MOR-labeled dendrites (Fig. 1). In dendrites containing NMDAR1-LI, the reaction product was distributed diffusely within the cytoplasm and was sometimes associated with smooth endoplasmic reticulum or nonsynaptic sites of the plasma membrane in larger dendrites. Unlike MOR, NMDAR1 labeling in dendritic spines was often seen along asymmetric synaptic junctions (Fig.5A). Reversed marker studies in which NMDAR1 was identified using immunogold showed that immunogold–silver particles were also occasionally associated with asymmetric postsynaptic junctions. In contrast, MOR immunoreactivity was not seen within synaptic specializations with the use of either immunogold or immunoperoxidase methods.
MOR- and NMDAR1-LI are colocalized in dendrites
Colocalization of MOR- and NMDAR1-LI was seen most commonly in dendrites (Fig. 6). More than half of the dendrites and dendritic spines containing NMDAR1-LI also expressed MOR-LI, whereas only 30.9% of the MOR-labeled dendrites contained detectable NMDAR1 (Fig. 7). As seen in singly labeled dendrites, immunogold localization of MOR was associated mainly with extrasynaptic regions of the plasma membranes in dendrites and dendritic spines (Figs. 2B,C). Within the same dendrites, immunoperoxidase labeling for the NMDA receptor was distributed diffusely within the cytoplasm and/or associated with smooth endoplasmic reticulum in larger dendrites (Fig. 2B). In dually labeled spines, the peroxidase reaction product was localized more intensely to asymmetric postsynaptic junctions (Fig.2C). The immunogold and immunoperoxidase labeling was occasionally seen along the same regions of the plasma membrane in dually labeled dendrites. Dendrites and spines that colocalized MOR and NMDAR1 immunoreactivities received asymmetric (Fig. 2C) and, more rarely, symmetric synapses from unlabeled terminals. Dendrites containing MOR- and NMDAR1-LI also were contacted infrequently by terminals containing NMDAR1-LI.
Fig. 6.

Bar graph showing the relative frequencies of colocalization of MOR and NMDAR1 in neuronal (dendrites, axons, and terminals) and glial processes in the Acb. The distribution represents the 28% (86/307) of immunogold MOR-labeled profiles that contained immunoperoxidase NMDAR1 labeling from 7640 μm2 area of tissue.
Fig. 7.

Bar graphs showing proportion of single versus dual labeling in MOR- and NMDAR1-labeled dendrites in the Acb. Analysis carried out in 7640 μm2 area of tissue processed for immunogold labeling of MOR and immunoperoxidase detection of NMDAR1.
Axons containing NMDAR1-LI show synaptic and appositional contacts with dendrites expressing MOR-LI
Synaptic and/or appositional contacts between neurons separately labeled for NMDAR1 and MOR were seen almost as frequently as dendritic colocalization. Of 76 observed MOR/NMDAR1 appositions, 42 were between MOR-labeled dendrites or spines and NMDAR1-immunoreactive axons or terminals (Fig. 3). On rare occasions, the dendrite or spine also contained detectable NMDAR1-LI. NMDAR1-labeled terminals most often apposed dendrites and spines without recognizable membrane specializations (Fig. 3), but they occasionally formed asymmetric synapses with MOR-immunoreactive dendrites. MOR-labeled dendrites were infrequently apposed to NMDAR1-labeled dendrites (6 of 76) or glial processes (3 of 76) (Fig. 4B).
MOR-labeled axon terminals and unmyelinated axons also apposed NMDAR1-labeled axons and terminals (18 of 76) (Fig.4A). Most often, MOR-labeled terminals apposed other terminals containing NMDAR1-LI, and MOR-labeled axons apposed other axons that were labeled with NMDAR1. Axo-axonic synapses were not observed, but terminals labeled with either MOR- or NMDAR1-LI sometimes made asymmetric contacts on unlabeled spines. In rare instances, terminals separately labeled for MOR or NMDAR1 converged on unlabeled spines (Fig. 4A). A few terminals containing MOR-LI also apposed or formed asymmetric synapses with dendrites or dendritic spines containing NMDAR1-LI (Fig. 5A) (5 of 76) or apposed glial processes (2 of 76).
MOR- and NMDAR1-LI are colocalized in axons
One third of all colocalization was seen in axons and terminals (Fig. 6). Terminals containing both receptors were generally 0.25–1.25 μm in diameter. These terminals contained numerous densely packed, round SSVs and occasional flattened clear vesicles or large dense-core vesicles. Immunogold labeling for MOR was associated with the plasma membrane or SSVs of terminals and axons (Fig.5C). In the same presynaptic processes, NMDAR1-LI was also associated with the plasma membrane and nearby SSVs (Fig.5C). Terminals containing both MOR- and NMDAR1-LI were most often surrounded by unlabeled profiles. When synaptic junctions were seen, dually labeled terminals formed asymmetric contacts with unlabeled dendrites or dendritic spines; these synapses occasionally appeared to be perforated. MOR-labeled terminals more frequently showed detectable NMDAR1-LI in comparison with the small percentage of NMDAR1-labeled terminals that contained MOR-LI (Fig.8).
Fig. 8.

Bar graph showing proportions of single versus dual labeling in MOR- and NMDAR1-labeled axons and terminals in the Acb. Analysis carried out in 7640 μm2 area of tissue processed for immunogold labeling of MOR and immunoperoxidase detection of NMDAR1.
Glial processes rarely contain MOR- or NMDAR1-LI
NMDAR1-LI was more commonly seen in glial processes than was MOR-LI (Fig. 1). The labeled glial processes, however, were still infrequent in comparison with dendritic or axonal localization of NMDAR1-LI. The NMDAR1-labeled astrocytic processes were usually apposed to unlabeled profiles, particularly unlabeled axons and axon terminals forming asymmetric junctions. Glial processes rarely contained both NMDAR1- and MOR-LI (1 of 86), although some (5 of 76) of the NMDAR1-labeled glial processes apposed profiles containing MOR-LI. In these processes, the NMDAR1-LI was seen most intensely along regions of the plasma membrane away from the apposed MOR-labeled profile (Fig.4B).
DISCUSSION
We have shown that in the shell of the Acb, MOR is localized mainly to extrasynaptic plasma membranes of dendrites that (1) express NMDAR1-LI or (2) receive input from NMDAR1-containing terminals. The results indicate that neurons responsive to MOR ligands may be subject to either direct or indirect (i.e., presynaptic) modulation by NMDA receptor ligands. We also present evidence that MOR and NMDAR1 are colocalized in certain axon terminals in the Acb, suggesting their dual involvement in presynaptic release of other neurotransmitters in this region.
Methodological considerations
MOR and NMDAR1 labeling have been referred to here as “-like immunoreactivity” (-LI) to include the possibility that other similar proteins may be recognized by the antisera and that both functional and nonfunctional receptors may be detected. We believe, however, that the localization reflects mainly functional receptors, because the specificity of both antisera was shown previously by Western blot, immunoisolation studies, and immunolabeling of transfected cells (Siegel et al., 1994; Arvidsson et al., 1995). Furthermore, the MOR and NMDAR1 labeling described here is consistent with receptor autoradiography studies using radiolabeled ligands (Jarvis et al., 1987; Jacobson and Cottrell, 1993; Mansour et al., 1994).
In the present study using the monoclonal antibody against NMDAR1, we found a lower incidence of glial labeling and a higher incidence of axonal labeling in the Acb than was observed previously using a polyclonal NMDAR1 antibody made against a different region of the R1 subunit (Gracy and Pickel, 1996). This disparity may reflect differences in the proportion of total neuronal versus glial processes labeled by each antibody as well as known differences in antibody specificity to splice variants expressed specifically in glia (Farb et al., 1995; Zukin and Bennett, 1995).
We may have underestimated the relative frequencies of association between MOR and NMDA receptors attributable to differences in sensitivity and/or penetration of peroxidase and colloidal gold markers, although we examined thin sections from only the surface of the tissue to minimize this problem. Furthermore, reversal of markers showed that the distribution of both MOR and NMDAR1 labeling was similar to that documented with the original markers, suggesting that the detection of immunoreactive profiles was largely independent of the detection method. The proportion of colocalization was also similar in reversed marker studies.
Dendrites and dendritic spines contain both MOR- and NMDAR1-LI
In dendrites containing NMDAR1- and/or MOR-LI, MOR labeling was seen almost exclusively along the plasma membrane. As described previously in this region (Hamel and Beaudet, 1984, 1987; Svingos et al., 1996), the MOR-LI was associated primarily with extrasynaptic or perisynaptic regions of the plasma membrane. This suggests that endogenous opioid ligands for this receptor (1) are released at synaptic sites and then diffuse to extrasynaptic functional sites (Sesack and Pickel, 1992) or (2) are released at nonsynaptic sites by exocytosis from dense-core vesicles (O’Connor et al., 1991). In contrast, in both singly and dually labeled dendrites, NMDAR1-LI was often localized to asymmetric postsynaptic junctions in dendritic spines, suggesting potentially closer associations between presynaptic release and postsynaptic functions for glutamate.
The presence of MOR in more than half of the NMDAR1-labeled dendrites suggests that the activity of at least one population of spiny neurons is subject to dual modulation by MOR and NMDA receptor ligands. Both may exert their physiological effects through calcium channels. MOR agonists decrease ion currents through calcium channels (Schroeder et al., 1991; Stefani et al., 1994; Wilding et al., 1995), which are distributed along the plasma membrane of dendrites (Hoehn et al., 1993;Westenbroek et al., 1995). Furthermore, the calcium channels have been shown to change the cellular responsiveness to NMDA receptor ligands (Huber et al., 1995; Hurt et al., 1995). Thus, when colocalized within dendrites, MOR activation may modulate the postsynaptic effects of NMDA receptor ligands by regulating calcium flux.
Colocalization of MOR and NMDA receptors in dendrites also suggests their involvement in common signal transduction mechanisms. In the Acb, MOR ligands increase postsynaptic responses to NMDA receptor stimulation through activation of protein kinase C (PKC) and calcium/calmodulin-dependent (CaM) kinase (Chen and Huang, 1991;Kitamura et al., 1993; Martin et al., 1997). This effect is believed to depend on the ability of PKC to remove the magnesium block from the NMDA receptor (Chen and Huang, 1992). Both PKC and CaM kinase are localized to the postsynaptic density of dendrites (Kitamura et al., 1993), suggesting that this may be a functional site of NMDA receptor activity.
Activation of NMDA receptors through PKC may also be a mechanism involved in the production of opiate tolerance. PKC agonists potentiate MOR desensitization (Mayer et al., 1995; Mestek et al., 1995), whereas PKC antagonists inhibit the development of tolerance (Mayer et al., 1995; Narita et al., 1995). NMDA receptor antagonists also prevent MOR-induced increases in PKC and tolerance (Mao et al., 1994, 1995), suggesting that dendritic MOR and NMDA receptors may interact through common mechanisms such as PKC or CaM kinase to modulate behaviors associated with opiate administration.
Many MOR-labeled dendrites receive input from NMDAR1-containing terminals
Dendrites containing MOR, but lacking detectable NMDAR1, often apposed or received synaptic input from morphologically heterogeneous NMDAR1-labeled terminals. Some were small and either lacked recognizable junctions or formed symmetric synapses. These features are typical of those described for dopaminergic afferents (Bouyer et al., 1984; Freund et al., 1984; Sesack et al., 1994). NMDAR1-LI is present in dopaminergic terminals (Gracy and Pickel, 1996) where it may modulate presynaptic dopamine release (Chowdhury and Fillenz, 1991;Krebs et al., 1991). This suggests that some of the dopamine-mediated effects of opiate administration (Sharp et al., 1995; Azaryan et al., 1996) may result from NMDA receptor modulation of dopamine release onto dendrites also affected by MOR ligands (Sharp et al., 1995).
Other NMDAR1-labeled terminals formed asymmetric synapses with MOR-immunoreactive dendrites and dendritic spines. Such asymmetric synapses are characteristically associated with glutamatergic afferents (Carlin et al., 1980), suggesting that autoregulation of glutamate release through activation of NMDA receptors may also contribute to the functional relationship between opiates and glutamate in the Acb.
MOR- and NMDAR1-LI are colocalized in terminals
The present demonstration that MOR- and NMDAR1-LI are also colocalized in many small axons and axon terminals provides direct ultrastructural evidence for functional associations between MOR and NMDA receptor ligands at presynaptic sites. In singly and dually labeled presynaptic processes, immunoreactivity for both MOR and NMDAR1 was associated mainly with nonsynaptic portions of the plasma membrane and nearby membranes of SSVs. This localization is comparable to that described in the Acb for MOR by Svingos et al. (1996) and for NMDAR1 byGracy and Pickel (1996). Many of the terminals containing MOR and NMDAR1-LI did not form recognizable synapses. This may indicate either that the terminals do not form synapses in this region or that the receptors are localized to sites away from the synapse.
Occasionally, terminals containing both MOR and NMDAR1 immunoreactivity formed asymmetric contacts with dendrites and dendritic spines in the Acb, thus suggesting the involvement of both receptors in the presynaptic release of excitatory neurotransmitters in this region. Although both MOR and NMDA receptors were shown previously to be present in axon terminals making asymmetric synapses (Gracy and Pickel, 1996; Svingos et al., 1996), this is the first demonstration that both MOR and NMDA receptor ligands target the same excitatory afferents to the Acb. These may include glutamatergic prefrontal cortical projections (Jaskiw et al., 1991). Several studies in other brain regions also indicate that enkephalin, acting at presynaptic opioid receptors on glutamatergic terminals, may inhibit the release of glutamate by suppressing calcium entry into axon terminals (Hori et al., 1992; Wilding et al., 1995). Conversely, NMDAR1 is believed to presynaptically autoregulate glutamate release through increased calcium entry (Sherman et al., 1992; Shew et al., 1995). These findings support the hypothesis that MOR and NMDAR1 receptor agonists have opposing effects in mediating presynaptic calcium influx in the same glutamatergic terminals.
Summary
The results of the present study provide morphological evidence that there are at least three relevant sites contributing to the reported functional interactions between MOR and NMDA receptor ligands in the shell of the Acb. First, colocalization in dendrites suggests that occupancy of either MOR or NMDA receptors could alter the postsynaptic responses to the other receptor ligand. The most likely mechanisms include changes in the permeability of calcium channels or activity of signal transduction pathways (Chen and Huang, 1991; Mao et al., 1995; Wilding et al., 1995). Second, our results indicate that NMDA receptor ligands may modulate the presynaptic release of other neurotransmitters (dopamine or glutamate) onto dendrites that are direct targets of neurons responsive to MOR but not NMDA receptor activation. Third, the colocalization of MOR and NMDAR1 in terminals indicates that ligands of both receptors can alter the presynaptic release of the same neurotransmitters. Each of these sites may play a distinct role in the locomotor and motivational effects of opiates in the Acb.
Footnotes
This research was supported by National Institute on Drug Abuse (DA04600) and National Institute of Mental Health (MH40342 and 00078) grants to V.M.P. and by an Aaron Diamond Postdoctoral Fellowship to A.L.S.
Correspondence should be addressed to K. Noelle Gracy, Division of Neurobiology, Cornell University Medical College, 411 East 69th Street, New York, NY 10021.
REFERENCES
- 1.Arvidsson U, Riedl M, Chakrabarti S, Lee J, Nakano A, Dado R, Loh H, Law P, Wessendorf M, Elde R. Distribution and targeting of a μ-opioid receptor (MOR1) in brain and spinal cord. J Neurosci. 1995;15:3328–3341. doi: 10.1523/JNEUROSCI.15-05-03328.1995. [DOI] [PMC free article] [PubMed] [Google Scholar]
- 2.Azaryan AV, Coughlin LJ, Buzas B, Clock BJ, Cox BM. Effects of chronic cocaine treatment on mu- and delta-opioid receptor mRNA levels in dopaminergically innervated brain regions. J Neurochem. 1996;66:443–448. doi: 10.1046/j.1471-4159.1996.66020443.x. [DOI] [PubMed] [Google Scholar]
- 3.Ben-Eliyahu S, Marek P, Vaccarino AL, Mogil JS, Sternberg WF, Liebeskind JC. The NMDA receptor antagonist MK-801 prevents long-lasting non-associative morphine tolerance in the rat. Brain Res. 1992;575:304–308. doi: 10.1016/0006-8993(92)90094-p. [DOI] [PubMed] [Google Scholar]
- 4.Bouyer JJ, Miller RJ, Pickel VM. Ultrastructural relation between cortical efferents and terminals containing enkephalin-like immunoreactivity in rat neostriatum. Regul Pept. 1984;8:105–115. doi: 10.1016/0167-0115(84)90165-4. [DOI] [PubMed] [Google Scholar]
- 5.Brose N, Huntley GW, Stern BY, Sharma G, Morrison JH, Heinemann SF. Differential assembly of coexpressed glutamate receptor subunits in neurons of rat cerebral cortex. J Biol Chem. 1994;269:16780–16784. [PubMed] [Google Scholar]
- 6.Burns LH, Everitt BJ, Kelley AE, Robbins TW. Glutamate-dopamine interactions in the ventral striatum: role in locomotor activity and responding with conditioned reinforcement. Psychopharmacology (Berl) 1994;115:516–528. doi: 10.1007/BF02245576. [DOI] [PubMed] [Google Scholar]
- 7.Carlin RK, Grab DJ, Cohen RS, Siekovitz P. Isolation and characterization of postsynaptic densities from various brain regions. Cell Biol. 1980;86:831–843. doi: 10.1083/jcb.86.3.831. [DOI] [PMC free article] [PubMed] [Google Scholar]
- 8.Chan J, Aoki C, Pickel VM. Optimization of differential immunogold-silver and peroxidase labeling with maintenance of ultrastructure in brain sections before plastic embedding. J Neurosci Methods. 1990;33:113–127. doi: 10.1016/0165-0270(90)90015-8. [DOI] [PMC free article] [PubMed] [Google Scholar]
- 9.Chen L, Huang L-YM. Sustained potentiation of NMDA receptor-mediated glutamate responses through activation of protein kinase C by a μ opioid. Neuron. 1991;7:319–326. doi: 10.1016/0896-6273(91)90270-a. [DOI] [PubMed] [Google Scholar]
- 10.Chen L, Huang L-YM. Protein kinase C reduces Mg2+ block of NMDA-receptor channels as a mechanism of modulation. Nature. 1992;356:521–523. doi: 10.1038/356521a0. [DOI] [PubMed] [Google Scholar]
- 11.Chowdhury M, Fillenz M. Presynaptic adenosine A2 and N-methyl-d-aspartate receptors regulate dopamine synthesis in rat striatal synaptosomes. J Neurochem. 1991;56:1783–1788. doi: 10.1111/j.1471-4159.1991.tb02081.x. [DOI] [PubMed] [Google Scholar]
- 12.Costall B, Fortune DH, Naylor RJ. The induction of catalepsy and hyperactivity by morphine administered directly into the nucleus accumbens of rats. Eur J Pharmacol. 1978;49:49–64. doi: 10.1016/0014-2999(78)90221-2. [DOI] [PubMed] [Google Scholar]
- 13.Descarries L, Soghomonian J-J, Garcia S, Doucet G, Bruno JP. Ultrastructural analysis of the serotonin hyperinnervation in adult rat neostriatum following neonatal dopamine denervation with 6-hydroxydopamine. Brain Res. 1992;569:1–13. doi: 10.1016/0006-8993(92)90363-e. [DOI] [PubMed] [Google Scholar]
- 14.Farb CR, Aoki C, LeDoux JE. Differential localization of NMDA and AMPA receptor subunits in the lateral and basal nuclei of the amygdala: a light and electron microscopic study. J Comp Neurol. 1995;362:86–108. doi: 10.1002/cne.903620106. [DOI] [PubMed] [Google Scholar]
- 15.Freund TF, Powell JF, Smith AD. Tyrosine hydroxylase-immunoreactive boutons in synaptic contact with identified striatonigral neurons, with particular reference to dendritic spines. Neuroscience. 1984;13:1189–1215. doi: 10.1016/0306-4522(84)90294-x. [DOI] [PubMed] [Google Scholar]
- 16.Goeders NE, Lane JD, Smith JE. Self-administration of methionine enkephalin into the nucleus accumbens. Pharmacol Biochem Behav. 1984;20:451–455. doi: 10.1016/0091-3057(84)90284-3. [DOI] [PubMed] [Google Scholar]
- 17.Gracy KN, Pickel VM. Ultrastructural immunocytochemical localization of the N-methyl-d-aspartate (NMDA) receptor and tyrosine hydroxylase in the shell of the rat nucleus accumbens. Brain Res. 1996;739:169–181. doi: 10.1016/s0006-8993(96)00822-0. [DOI] [PubMed] [Google Scholar]
- 18.Gulya K, Krivan M, Nyoczas N, Sarnyai Z, Kovacs GL. Central effects of the potent and highly selective mu opioid antagonist d-Phe-Cys-Tyr-d-Trp-Orn-Thr-Pen-Thr-NH2 (CTOP) in mice. Eur J Pharmacol. 1988;150:355–360. doi: 10.1016/0014-2999(88)90018-0. [DOI] [PubMed] [Google Scholar]
- 19.Hamel E, Beaudet A. Electron microscopic autoradiographic localization of opioid receptors in rat neostriatum. Nature. 1984;312:155–157. doi: 10.1038/312155a0. [DOI] [PubMed] [Google Scholar]
- 20.Hamel E, Beaudet A. Opioid receptors in rat neostriatum: radioautographic distribution at the electron microscopic level. Brain Res. 1987;401:239–257. doi: 10.1016/0006-8993(87)91409-0. [DOI] [PubMed] [Google Scholar]
- 21.Herman BH, Vocci F, Bridge P. The effects of NMDA receptor antagonists and nitric oxide synthase inhibitors on opioid tolerance and withdrawal: medication development issues for opiate addiction. Neuropsychopharmacology. 1995;13:269–293. doi: 10.1016/0893-133X(95)00140-9. [DOI] [PubMed] [Google Scholar]
- 22.Hiller JM, Zhang Y, Bing G, Gioannini TL, Stone EA, Simon EJ. Immunohistochemical localization of mu-opioid receptors in rat brain using antibodies generated against a peptide sequence present in a purified mu-opioid binding protein. Neuroscience. 1994;62:829–841. doi: 10.1016/0306-4522(94)90480-4. [DOI] [PubMed] [Google Scholar]
- 23.Hoehn K, Watson TWJ, MacVicar BA. Multiple types of calcium channels in acutely isolated rat neostriatal neurons. J Neurosci. 1993;13:1244–1257. doi: 10.1523/JNEUROSCI.13-03-01244.1993. [DOI] [PMC free article] [PubMed] [Google Scholar]
- 24.Hollmann M, Heinemann S. Cloned glutamate receptors. Annu Rev Neurosci. 1994;17:31–108. doi: 10.1146/annurev.ne.17.030194.000335. [DOI] [PubMed] [Google Scholar]
- 25.Hori Y, Endo K, Takahashi T. Presynaptic inhibitory action of enkephalin on excitatory transmission in superficial dorsal horn of rat spinal cord. J Physiol (Lond) 1992;450:673–685. doi: 10.1113/jphysiol.1992.sp019149. [DOI] [PMC free article] [PubMed] [Google Scholar]
- 26.Hsu S, Raine L, Fanger H. Use of avidin-biotin-peroxidase complex (ABC) in immunoperoxidase techniques: a comparison between ABC and unlabeled antibody (PAP) procedures. J Histochem Cytochem. 1981;29:577–580. doi: 10.1177/29.4.6166661. [DOI] [PubMed] [Google Scholar]
- 27.Huber KM, Mauk MD, Kelly PT. Distinct LTP induction mechanisms: contribution of NMDA receptors and voltage-dependent calcium channels. J Neurophysiol. 1995;73:270–279. doi: 10.1152/jn.1995.73.1.270. [DOI] [PubMed] [Google Scholar]
- 28.Hurt KJ, Fiskum G, Rosenthal RE, Werling LL. The role of L-type voltage dependent calcium channels in stimulated [3H]norepinephrine release from canine hippocampal slices following global cerebral ischemia and reperfusion. Brain Res. 1995;673:226–232. doi: 10.1016/0006-8993(94)01418-h. [DOI] [PubMed] [Google Scholar]
- 29.Jacobson W, Cottrell GA. Rapid visualization of NMDA receptors in the brain: characterization of (+)-3-[125I]-iodo-MK-801 binding to thin sections of rat brain. J Neurosci Methods. 1993;46:17–27. doi: 10.1016/0165-0270(93)90137-g. [DOI] [PubMed] [Google Scholar]
- 30.Jarvis MF, Murphy DE, Williams M. Quantitative autoradiographic localization of NMDA receptors in rat brain using [3H]CPP: comparison with [3H]TCP binding sites. Eur J Pharmacol. 1987;141:149–152. doi: 10.1016/0014-2999(87)90423-7. [DOI] [PubMed] [Google Scholar]
- 31.Jaskiw GE, Tizabi Y, Lipska BK, Kolachana BS, Wyatt RJ, Gilad GM. Evidence for a frontocortical-septal glutamatergic pathway and compensatory changes in septal glutamate uptake after cortical and fornix lesions in the rat. Brain Res. 1991;550:7–10. doi: 10.1016/0006-8993(91)90398-f. [DOI] [PubMed] [Google Scholar]
- 32.Kitamura Y, Miyazaki A, Nomura Y. Stimulatory effects of protein kinase C and calmodulin kinase II on N-methyl-d-aspartate receptor/channels in the postsynaptic density of rat brain. J Neurochem. 1993;61:100–109. doi: 10.1111/j.1471-4159.1993.tb03542.x. [DOI] [PubMed] [Google Scholar]
- 33.Kolesnikov YA, Ferkany J, Pasternak GW. Blockade of mu and kappa1 opioid analgesic tolerance by NPC17742, a novel NMDA antagonist. Life Sci. 1993;53:1489–1494. doi: 10.1016/0024-3205(93)90622-a. [DOI] [PubMed] [Google Scholar]
- 34.Koob GF, Wall TL, Bloom FE. Nucleus accumbens as a substrate for the aversive stimulus effects of opiate withdrawal. Psychopharmacology. 1989;98:530–534. doi: 10.1007/BF00441954. [DOI] [PubMed] [Google Scholar]
- 35.Krebs MO, Desce JM, Kemel ML, Gauchy C, Godeheu G, Cheramy A, Glowinski J. Glutamate control of dopamine release in the rat striatum: evidence for presynaptic N-methyl-d-aspartate receptors on dopaminergic nerve terminals. J Neurochem. 1991;56:81–85. doi: 10.1111/j.1471-4159.1991.tb02565.x. [DOI] [PubMed] [Google Scholar]
- 36.Layer RT, Uretsky NJ, Wallace LJ. Effects of morphine in the nucleus accumbens on stimulant-induced locomotion. Pharmacol Biochem Behav. 1991;40:21–26. doi: 10.1016/0091-3057(91)90315-s. [DOI] [PubMed] [Google Scholar]
- 37.Leranth C, Pickel VM. Electron microscopic pre-embedding double immunostaining methods. In: Heimer L, Zaborsky L, editors. Tract-tracing methods 2, recent progress. Plenum; New York: 1989. pp. 129–172. [Google Scholar]
- 38.Mansour A, Fox CA, Thompson RC, Akil H, Watson SJ. μ-opioid receptor mRNA expression in the rat CNS: comparison to μ-receptor binding. Brain Res. 1994;643:245–265. doi: 10.1016/0006-8993(94)90031-0. [DOI] [PubMed] [Google Scholar]
- 39.Mao J, Price DD, Mayer DJ. Thermal hyperalgesia in association with the development of morphine tolerance in rats: roles of excitatory amino acid receptors and protein kinase C. J Neurosci. 1994;14:2301–2312. doi: 10.1523/JNEUROSCI.14-04-02301.1994. [DOI] [PMC free article] [PubMed] [Google Scholar]
- 40.Mao J, Price DD, Phillips LL, Lu J, Mayer DJ. Increase in protein kinase C gamma immunoreactivity in the spinal cord of rats associated with tolerance to the analgesic effects of morphine. Brain Res. 1995;677:257–267. doi: 10.1016/0006-8993(95)00161-i. [DOI] [PubMed] [Google Scholar]
- 41.Martin G, Nie Z, Siggins GR. μ-Opioid receptors modulate NMDA receptor-mediated responses in nucleus accumbens neurons. J Neurosci. 1997;17:11–22. doi: 10.1523/JNEUROSCI.17-01-00011.1997. [DOI] [PMC free article] [PubMed] [Google Scholar]
- 42.Mayer DJ, Mao J, Price DD. The development of morphine tolerance and dependence is associated with translocation of protein kinase C. Pain. 1995;2813:365–374. doi: 10.1016/0304-3959(95)00023-L. [DOI] [PubMed] [Google Scholar]
- 43.Mestek A, Hurley JH, Bye LS, Campbell AD, Chen Y, Tian M, Liu J, Schulman H, Yu L. The human μ-opioid receptor: modulation of functional desensitization by calcium/calmodulin-dependent protein kinase and protein kinase C. J Neurosci. 1995;15:2396–2406. doi: 10.1523/JNEUROSCI.15-03-02396.1995. [DOI] [PMC free article] [PubMed] [Google Scholar]
- 44.Meyer ME, McLaurin BI, Allen M, Meyer ME. Biphasic effects of intraaccumbens μ-opioid peptide agonist DAMGO on locomotor activities. Pharmacol Biochem Behav. 1994;47:827–831. doi: 10.1016/0091-3057(94)90283-6. [DOI] [PubMed] [Google Scholar]
- 45.Narita M, Narita M, Mizoguchi H, Tseng LF. Inhibition of protein kinase C, but not protein kinase A, blocks the development of acute antinocioceptive tolerance to an intrathecally administered μ-opioid receptor agonist in the mouse. Eur J Pharmacol. 1995;280:R1–R3. doi: 10.1016/0014-2999(95)00322-c. [DOI] [PubMed] [Google Scholar]
- 46.O’Connor DT, Klein RL, Thureson-Klein AK, Barbosa JA. Chromogranin A: localization and stoichiometry in large dense core catecholamine storage vesicles from sympathetic nerve. Brain Res. 1991;567:188–196. doi: 10.1016/0006-8993(91)90795-w. [DOI] [PubMed] [Google Scholar]
- 47.Olds ME. Reinforcing effects of morphine in the nucleus accumbens. Brain Res. 1982;237:429–440. doi: 10.1016/0006-8993(82)90454-1. [DOI] [PubMed] [Google Scholar]
- 48.Paxinos G, Watson C. The rat brain in stereotaxic coordinates. Academic; New York: 1986. [DOI] [PubMed] [Google Scholar]
- 49.Pert A, Sivit C. Neuroanatomical focus for morphine and enkephalin-induced hypermotility. Nature. 1977;265:645–647. doi: 10.1038/265645a0. [DOI] [PubMed] [Google Scholar]
- 50.Peters A, Palay SL, Webster HD. The fine structure of the nervous system. Oxford UP; New York: 1991. [Google Scholar]
- 51.Petralia RS, Yokotani N, Wenthold RJ. Light and electron microscope distribution of the NMDA receptor subunit NMDAR1 in the rat nervous system using a selective anti-peptide antibody. J Neurosci. 1994;14:667–696. doi: 10.1523/JNEUROSCI.14-02-00667.1994. [DOI] [PMC free article] [PubMed] [Google Scholar]
- 52.Pulvirenti L, Maldonado-Lopez R, Koob GF. NMDA receptors in the nucleus accumbens modulate intravenous cocaine but not heroine self-administration in the rat. Brain Res. 1992;594:327–330. doi: 10.1016/0006-8993(92)91145-5. [DOI] [PubMed] [Google Scholar]
- 53.Reynolds ES. The use of lead citrate at high pH as an electron-opaque stain in electron microscopy. J Cell Biol. 1963;17:208. doi: 10.1083/jcb.17.1.208. [DOI] [PMC free article] [PubMed] [Google Scholar]
- 54.Schroeder JE, Fischback PS, Zeng D, McCleskey EW. Activation of μ opioid receptors inhibits transient high- and low-threshold Ca2+ currents, but spares a sustained current. Neuron. 1991;6:13–20. doi: 10.1016/0896-6273(91)90117-i. [DOI] [PubMed] [Google Scholar]
- 55.Sesack SR, Pickel VM. Dual ultrastructural localization of enkephalin and tyrosine hydroxylase immunoreactivity in the rat ventral tegmental area: multiple substrates for opiate-dopamine interactions. J Neurosci. 1992;12:1335–1350. doi: 10.1523/JNEUROSCI.12-04-01335.1992. [DOI] [PMC free article] [PubMed] [Google Scholar]
- 56.Sesack SR, Aoki C, Pickel VM. Ultrastructural localization of D2 receptor-like immunoreactivity in midbrain dopamine neurons and their striatal targets. J Neurosci. 1994;14:88–106. doi: 10.1523/JNEUROSCI.14-01-00088.1994. [DOI] [PMC free article] [PubMed] [Google Scholar]
- 57.Sharp FR, Liu J, Nickolenko J, Bontempi B. NMDA and D1 receptors mediate induction of cfos and junE genes in striatum following morphine administration: implications for studies of memory. Behav Brain Res. 1995;66:225–230. doi: 10.1016/0166-4328(94)00146-7. [DOI] [PubMed] [Google Scholar]
- 58.Sherman AD, Hegwood TS, Baruah S, Waziri R. Presynaptic modulation of amino acid release from synaptosomes. Neurochem Res. 1992;17:125–128. doi: 10.1007/BF00966789. [DOI] [PubMed] [Google Scholar]
- 59.Shew TR, Morishita W, Sastry BR. Presynaptic action of glutamate receptor agonists in the CA1 region of rat hippocampus in vitro. Eur J Pharmacol. 1995;284:93–99. doi: 10.1016/0014-2999(95)00371-q. [DOI] [PubMed] [Google Scholar]
- 60.Siegel SJ, Brose N, Gasic GP, Jahn R, Heinemann SF, Morrison JH. Regional, cellular, and ultrastructural distribution of N-methyl-d-aspartate receptor subunit 1 in monkey hippocampus. Proc Natl Acad Sci USA. 1994;91:564–568. doi: 10.1073/pnas.91.2.564. [DOI] [PMC free article] [PubMed] [Google Scholar]
- 61.Stefani A, Surmeier DJ, Bernardi G. Opioids decrease high-voltage activated calcium currents in acutely dissociated neostriatal neurons. Brain Res. 1994;642:339–343. doi: 10.1016/0006-8993(94)90940-7. [DOI] [PubMed] [Google Scholar]
- 62.Svensson A, Carlsson ML, Carlsson A. Glutamatergic neurons projecting to the nucleus accumbens can affect motor functions in opposite directions depending on the dopaminergic tone. Prog Neuropsychopharmacol Biol Psychiatry. 1994;18:1203–1218. doi: 10.1016/0278-5846(94)90121-x. [DOI] [PubMed] [Google Scholar]
- 63.Svingos AL, Moriwaki A, Wang JB, Uhl GR, Pickel VM. Ultrastructural immunocytochemical localization of μ-opioid receptors in rat nucleus accumbens: extrasynaptic plasmalemmal distribution and association with leu5-enkephalin. J Neurosci. 1996;16:4162–4173. doi: 10.1523/JNEUROSCI.16-13-04162.1996. [DOI] [PMC free article] [PubMed] [Google Scholar]
- 64.Trujillo KA, Akil H. Inhibition of opiate tolerance by non-competitive N-methyl-d-aspartate receptor antagonists. Brain Res. 1994;633:178–188. doi: 10.1016/0006-8993(94)91538-5. [DOI] [PubMed] [Google Scholar]
- 65.Westenbroek RE, Sakurai T, Elliot EM, Hell JW, Starr TV, Snutch TP, Catterall WA. Immunochemical identification and subcellular distribution of the α1A subunits of brain calcium channels. J Neurosci. 1995;15:6403–6418. doi: 10.1523/JNEUROSCI.15-10-06403.1995. [DOI] [PMC free article] [PubMed] [Google Scholar]
- 66.Wilding TJ, Womack MD, McCleskey EW. Fast, local signal transduction between the mu opioid receptor and Ca2+ channels. J Neurosci. 1995;15:4134–4132. doi: 10.1523/JNEUROSCI.15-05-04124.1995. [DOI] [PMC free article] [PubMed] [Google Scholar]
- 67.Zito KA, Vickers G, Roberts DCS. Disruption of cocaine and heroin self-administration following kainic acid lesions of the nucleus accumbens. Pharmacol Biochem Behav. 1985;23:1029–1036. doi: 10.1016/0091-3057(85)90110-8. [DOI] [PubMed] [Google Scholar]
- 68.Zukin RS, Bennett MV. Alternatively spliced isoforms of the NMDAR1 receptor subunit. Trends Neurosci. 1995;18:306–313. doi: 10.1016/0166-2236(95)93920-s. [DOI] [PubMed] [Google Scholar]