Coordinated Expression of Dopamine Receptors in Neostriatal Medium Spiny Neurons (original) (raw)
Abstract
In recent years, the distribution of dopamine receptor subtypes among the principal neurons of the neostriatum has been the subject of debate. Conventional anatomical and physiological approaches have yielded starkly different estimates of the extent to which D1 and D2 class dopamine receptors are colocalized. One plausible explanation for the discrepancy is that some dopamine receptors are present in physiologically significant numbers, but the mRNA for these receptors is not detectable with conventional techniques. To test this hypothesis, we examined the expression of DA receptors in individual neostriatal neurons by patch-clamp and RT-PCR techniques. Because of the strong correlation between peptide expression and projection site, medium spiny neurons were divided into three groups on the basis of expression of mRNA for enkephalin (ENK) and substance P (SP). Neurons expressing detectable levels of SP but not ENK had abundant mRNA for the D1a receptor. A subset of these cells (∼50%) coexpressed D3 or D4receptor mRNA. Neurons expressing detectable levels of ENK but not SP had abundant mRNA for D2 receptor isoforms (short and long). A subset (10–25%) of these neurons coexpressed D1aor D1b mRNAs. Neurons coexpressing ENK and SP mRNAs consistently coexpressed D1a and D2 mRNAs in relatively high abundance. Functional analysis of neurons expressing lower abundance mRNAs revealed clear physiological consequences that could be attributed to these receptors. These results suggest that, although colocalization of D1a and D2 receptors is limited, functional D1 and D2 class receptors are colocalized in nearly one-half of all medium spiny projection neurons.
Keywords: medium spiny neurons, single-cell PCR, voltage clamp, RT-PCR, mRNA, Ca2+ channels, neuromodulation
The signaling pathways activated by dopamine in the neostriatum have been the subject of intense study since it was discovered that the loss of dopamine leads to the psychomotor symptoms of Parkinson’s disease (Hornykiewcz, 1973). Subsequently, several other common psychomotor disorders, including schizophrenia and Tourette’s syndrome, have been linked to alterations in neostriatal dopaminergic signaling (Nemeroff and Bissette, 1988; Erenberg, 1992).
In recent years, significant progress has been made in characterizing the membrane receptors transducing the signals of dopamine in the neostriatum and the brain in general. Molecular cloning work has shown that there are at least five dopamine receptor genes (D1a, D2, D3, D4, D1b;Sibley, 1995). These receptors can be grouped into D1(D1a, D1b) and D2 classes (D2, D3, D4) on the basis of their affinities for classical dopaminergic ligands and their coupling to intracellular signaling cascades.
How these receptors are distributed among the principal neuronal cell types in the neostriatum has been the subject of debate (Surmeier et al., 1993). This controversy stems primarily from discrepancies in the results obtained from functional studies on the one hand and anatomical studies on the other. The most compelling anatomical data are in situ hybridization studies suggesting that D1a and D2 mRNA are segregated primarily in the two major efferent neostriatal populations (Gerfen, 1992; LeMoine and Bloch, 1995). In particular, D1a receptor mRNA is found in substance P-expressing (SP) neurons projecting to the substantia nigra, whereas D2 receptor mRNA is found in enkephalin-expressing (ENK) neurons projecting exclusively to the globus pallidus. More recent immunocytochemical work supports this conclusion (Hersch et al., 1995), although others have reported significant degrees of receptor protein colocalization (Ariano et al., 1995).
Functional studies, on the other hand, repeatedly have observed responses to D1 and D2 class agonists that are difficult to explain if these receptor classes are not colocalized (Uchimura et al., 1986; Akaike et al., 1987; Cepeda et al., 1993; for review, see Surmeier et al., 1993). The most compelling evidence comes from patch-clamp studies of acutely isolated neostriatal neurons—where synaptic interactions have been removed—showing neuromodulatory effects of both D1 and D2 class agonists in the same cell (Surmeier et al., 1992). In this study, it was also shown that neurons projecting axons to the substantia nigra coexpressed D1a and D2 receptor mRNAs. However, the sample of neurons in which the mRNA analysis was performed was small, making it unclear whether the molecular identification of the receptors mediating the physiological responses could be generalized.
An implicit assumption in this debate has been that the presence of D1a and D2 receptors can be inferred from the responses to D1 and D2 _class_ligands. The underpinnings for this line of argument are the apparent low level of D3, D4, and D1b mRNA expression in the dorsal neostriatum. In the experiments described below, the expression of dopamine receptor mRNAs in medium spiny neurons is reexamined with a newly developed technique—single-cell RT-PCR—that obviates some of the difficulties inherent in more conventional molecular techniques. Of particular interest to us was how dopamine receptor mRNA expression is coordinated in individual, identified neurons. Functional assays for particular receptor mRNAs were performed by applying whole-cell voltage-clamp techniques to neurons subjected to PCR-based analysis. Our results show that, although D1a and D2 mRNAs are coexpressed in only a subset of neurons, the presence of other dopamine receptor mRNAs (D3, D4, D1b) results in the coexpression of D1 and D2 class mRNAs in nearly one-half of all medium spiny neurons. Taken together, our results provide a framework within which previous anatomical and functional studies of dopaminergic signaling in the neostriatum can be reconciled.
MATERIALS AND METHODS
Acute dissociation procedure. Neostriatal neurons from young adult (>3 wks) rats were acutely dissociated by procedures similar to those we have described previously (Bargas et al., 1994;Surmeier et al., 1995a). All solutions coming into contact with the tissue during the dissociation procedure were prepared aseptically and nominally RNase-free. In brief, rats were anesthetized with methoxyflurane and decapitated; brains were removed quickly, iced, and then blocked for slicing. The blocked tissue was cut in 400 μm slices with a Vibroslice (Campden Instruments, London, UK) while bathed in a low Ca2+ (100 μm) HEPES-buffered salt solution (in mm): 140 Na isethionate, 2 KCl, 4 MgCl2, 0.1 CaCl2, 23 glucose, and 15 HEPES, pH 7.4, 300–305 mOsm/l. Then slices were incubated for 1–6 hr at room temperature (20–22°C) in an NaHCO3-buffered saline bubbled with 95% O2/5% CO2 (in mm): 126 NaCl, 2.5 KCl, 2 CaCl2, 2 MgCl2, 26 NaHCO3, 1.25 NaH2PO4, 1 pyruvic acid, and 10 glucose, pH 7.4, with NaOH, 300–305 mOsm/l. In later experiments ascorbic acid (200 μm),_N_G-nitro-l-arginine (100 μm), and kynurenic acid (1 mm) were added to the holding solutions, because their addition improved the apparent viability of dissociated neurons. All reagents were obtained from Sigma Chemical (St. Louis, MO). Then slices were removed into the low Ca2+ buffer, and, with the aid of a dissecting microscope, regions of the dorsal neostriatum were dissected and placed in an oxygenated Cell-Stir chamber (Wheaton, Millville, NJ) containing Pronase (1–3 mg/ml) in HEPES-buffered HBSS (Sigma Chemical) at 35°C. Dissections were limited to tissue rostral to the anterior commissure to reduce the possibility of contamination from pallidum. After 20–30 min of enzyme digestion, tissue was rinsed three times in the low Ca2+, HEPES-buffered saline and mechanically dissociated with a graded series of fire-polished Pasteur pipettes. Then the cell suspension was plated into a 35 mm Lux Petri dish mounted on the stage of an inverted microscope containing HEPES-buffered HBSS saline. After allowing the cells to settle, the solution bathing the cells was changed to our normal recording external solution.
Whole-cell recordings. Whole-cell recordings used standard techniques (Hamill et al., 1981; Bargas et al., 1994). Electrodes were pulled from Corning 7052 glass and fire-polished before use. The internal solution consisted of (in mm): 180 _N_-methyl-d-glucamine (NMG), 40 HEPES, 4 MgCl2, 0.1 BAPTA, 12 phosphocreatine, 2 Na2ATP, 0.2 Na3GTP, and 0.1 leupeptin, pH 7.2–7.3, with H2SO4, 265–270 mOsm/l. The pH of NMG solutions was measured with a Corning Model 476570 probe. The external solution consisted of (in mm): 135 NaCl, 20 CsCl, 1 MgCl2, 10 HEPES, 0.001 TTX, 5 BaCl2, 10 glucose, pH 7.3, with NaOH, 300–305 mOsm/l. All reagents were obtained from Sigma Chemical except ATP and GTP (Boehringer Mannheim, Indianapolis, IN), BAPTA and leupeptin (Calbiochem, La Jolla, CA), and sulfuric acid (Fluka, Ronkonkoma, NY).
Recordings were obtained with an Axon Instruments 200 patch-clamp amplifier and controlled and monitored with a PC 486 clone running pCLAMP (v. 6.0) with a 125 kHz interface (Axon Instruments, Foster City, CA). Electrode resistances were typically 3–6 mΩ in the bath. After seal rupture, series resistance (7–15 MΩ) was compensated (80–90%) and monitored periodically. Because whole-cell currents never exceeded 2 nA (usually <600 pA), errors in voltage attributable to inadequate compensation never should have exceeded a few mV. The adequacy of voltage control was assessed after compensation by examining the tail currents generated by strong depolarizations. Cells in which tail currents did not decay rapidly and smoothly at subthreshold potentials were discarded.
The D1 class agonist (+)-6-chloro-7,8-dihydroxy-1-phenyl-2,3,4,5-tetrahydro-1H-3-benzazepine hydrobromide (6-chloro-PB or SKF 81297) and the D2 class agonist_trans_-(−)-4aR-4,4a,5,6,7,8,8a,9-octahydro-5-propyl-1H-pyrazolo[3,4-g]quinoline hydrochloride (quinpirole or LY-171,555) and 5-hydroxytryptamine hydrochloride (5-HT) were made up as concentrated stocks in deoxygenated water containing 0.1% ascorbic acid or sodium metabisulfite. Stocks were thawed and diluted immediately before use; solutions were protected from ambient light and contained 0.01% metabisulfite. Drugs were applied with a gravity-fed “sewer pipe” system. The array of application capillaries (∼150 μm inner diameter) was positioned a few hundred microns from the cell under study. Solution changes were effected by altering the position of the array with a DC drive system controlled by a microprocessor-based controller (Newport-Klinger, Irvine, CA). Solution changes were complete within <1 sec; the time constant of Cd2+ block of Ca2+ current was 400 msec. Potentials were not corrected for the liquid junction potential with the NMG-SO4 internal solution, which was estimated to be 7 mV.
Poisson statistics were used to estimate blank probability as a function of cDNA abundance. After Feller’s (1950) treatment of the distribution of r balls in n boxes, the blank probability (_P_B) is given by:
Pb(r,n)=∑m=1n mnλmm!exp(−λ),
in which λ = n · exp(−r/n), r = copy number (× PCR threshold), n = (fraction of total cellular cDNA)−1. Simulations were run with Igor Pro (Wavemetrics, Lake Oswego, OR).
Single-neuron RT-PCR analysis. After recording, cells were lifted into a stream of control solution and aspirated into the electrode by applying negative pressure. External solutions were made with nominally RNase-free water (Milli-Q PF, Millipore, Bedford, MA). Electrodes contained ∼5 μl of sterile recording solution (see above). Some cells were harvested without recording with electrodes filled with water. The capillary glass used for making electrodes had been heated to 200°C for 4 hr. Sterile gloves were worn during the procedure to minimize RNase contamination.
After aspiration, the electrode was broken and the contents were ejected into a 0.5 ml Eppendorf tube containing 5 μl of diethyl pyrocarbonate (DEPC)-treated water, 0.5 μl RNAsin (28,000 U/ml), and 0.5 μl dithiothreitol (DTT; 0.1 m). Either oligo dT (0.5 μg/ml or random hexanucleotides (50 ng/μl) primers were added, and the mixture was heated to 70°C for 10 min and then incubated on ice for >1 min. Single-strand cDNA was synthesized from the cellular mRNA by adding SuperScript II reverse transcriptase (1 μl, 200 U/μl) and buffer [4 μl, 5× first-strand buffer containing (in mm): 250 Tris-HCl, 375 KCl, and 15 MgCl2], RNAsin (0.5 μl, 28,000 U/ml), DTT (1.5 μl, 0.1 m), and mixed dNTPs (1 μl, 10 mm). The reaction mixture (20 μl) was incubated at 42°C for 50 min. The reaction was terminated by heating the mixture to 70°C for 15 min and then icing. Then the RNA strand in the RNA–DNA hybrid was removed by adding 1 μl of RNase H (2 U/μl) and incubating for 20 min at 37°C. All reagents except for RNAsin (Promega, Madison, WI) were obtained from Life Technologies (Grand Island, NY). No attempt was made to quantify the cDNA from individual cells. The cDNA from the reverse transcription (RT) of RNA in single neostriatal neurons was amplified with the polymerase chain reaction (PCR).
PCR amplification was performed with a thermal cycler (MJ Research, Watertown, MA) with thin-walled plastic tubes. Amplification was performed with one of two protocols. In our initial experiments, a fraction of the single-cell cDNA was used as a template for conventional PCR amplification. Reaction mixtures contained 2–2.5 mm MgCl2, 0.5 mm of each of the dNTPs, 0.8–1 μm primers, 2.5 U Taq DNA polymerase (Promega), 5 μl of 10× buffer (Promega), and one-tenth to one-fifth (2–4 μl) of the cDNA template made from the single-cell RT reaction (see above). The thermal cycling program for all primer sets was 94°C for 1 min, 58°C for 1 min, and 72°C for 1.5 min for 45 cycles.
The second protocol was designed to maximize our ability to detect low abundance dopamine receptor mRNAs (in this protocol, peptide mRNAs were amplified as above with 2 μl of template). To this end, a two-stage amplification was designed. In the first step, targeted cDNAs were amplified with three-fourths of the single-cell cDNA (15 μl) as a template in a multiplex PCR reaction. All dopamine receptor primers were added to a reaction mixture containing the same concentration of reagents as with conventional PCR, except for slightly elevated MgCl2 (4.0 mm) and dNTPs (1.0 mm) (Chamberlain and Chamberlain, 1994). Twenty cycles were performed with the parameters of 94°C for 1 min, 58°C for 1 min, and 72°C for 3 min. Then an aliquot of this PCR product (2 μl) was used as a template for a second round (30 cycles) of “touchdown” PCR amplification with each pair of specific primers. In this round, after the first ten cycles, the annealing temperature was decreased one degree every other cycle, resulting in a final annealing temperature of 48°C.
The PCR primers were developed from GenBank sequences for dopamine receptors and peptides (ENK and SP) with commercially available software (OLIGO, National Biosciences, Plymouth, MN). Primers were synthesized either by the St. Jude’s Molecular Resource Center (Memphis, TN) or by Life Technologies. The DA receptor primers targeted regions, including the putative third cytoplasmic domain, where the greatest divergence in base sequences was present. For the D1a cDNA, the primers were D1aR1–5′-CAG TCC ATG CCA AGA ATT GCC AGA-3′ and 5′-AAT CGA TGC AGA ATG GCT GGG TCT-3′ (225 bp product) or D1aR2–5′-GAC AAC TGT GAC ACA AGG TTG AGC-3′ and 5′-ATT ACA GTC CTT GGA GAT GGA GCC-3′ (609 bp product; GenBank accession M35077). For the D2 cDNA, the primers were D2R–5′-GCA GTC GAG CTT TCA GAG CC-3′ and 5′-TCT GCG GCT CAT CGT CTT AAG-3′ (404 and 317 bp; GenBank accession M36831). For the D3 cDNA, the primers were D3R1–5′-CAT CCC ATT CGG CAG TTT TCA A-3′ and 5′-TGG GTG TCT CAA GGC AGT GTC T-3′ (201 bp) or D3R2–5′-AGC ATC TGC TCC ATC TCC AAC CC-3′ and 5′-A GGA GTT CCG AGT CCT TTC CAC G-3′ (461 bp product) (GenBank accession M69189). For the D4 cDNA, the primers were D4R1–5′-CTA CTC AGG GTC CCC TCT TC-3′ and 5′-TGA TCT TGG CGC CTC TCT TTC-3′ (189 bp product) or D4R2–5′-TC ATG CTA CTG CTT TAC TGG GCC A-3′ and 5′-T CTG AGA GAG GTC TGA CTC TGG TC-3′ (223 bp product; GenBank accession M84009). For the D1b cDNA, the primers were D1bR1–5′-AGT CGT GGA GCC TAT GAA CCT GAC-3′ and 5′-GCG TCG TTG GAG AGA TTT GAG ACA-3′ (517 bp product; GenBank accession M69118).
The primers for ENK cDNA (GenBank accession M28263; Howells, 1986) were 5′-AAC AGG ATG AGA GCC ACT TGC-3′ (nucleotides 314–334) and 5′-CTT CAT CCG AGG GTA GAG ACT-3′ (nucleotides 770–790). This set yielded a product of 476 bp. The primers for SP (Carter and Krause, 1990) were 5′-TGA GCA TCT TCT TCA GAG AA TCGC-3′, which targets exon 3, and 5′-ATC GCT GGC AAA CTT GTA CAA CTC-3′, which targets exon 7. This set should yield products of 513 or 468 bp, depending on splicing of exon 4. The product for genomic DNA is expected to be 5741 bp, which was never observed.
PCR products (amplicons) were visualized by staining with ethidium bromide and separated by electrophoresis in 1.5–2% agarose gels. Amplicons were sequenced with a dye termination procedure by the University of Tennessee Molecular Resource Center (Memphis, TN) and found to closely match published sequences.
Care was taken to insure that the PCR amplicons arose from cellular mRNA. RT and PCR reactions were performed following procedures designed to minimize the chances of cross contamination (Cimino et al., 1990). Negative controls for contamination from extraneous and genomic DNA were run for every batch of neurons. To insure that genomic DNA did not contribute to the PCR products, neurons were aspirated and processed in the normal manner, except that the reverse transcriptase was omitted. Contamination from extraneous sources was checked by replacing the cellular template with water. Both controls were consistently negative in these experiments.
Tissue RT-PCT. Dorsal neostriatum (see Fig.1A) was dissected from rat brain slices (400 μm) and homogenized in 1 ml of Trizol reagent (Life Technologies) per 10–30 mg of tissue. After 5 min of incubation at room temperature, 0.2 ml of chloroform was added and mixed with the homogenized sample. The tube was incubated at room temperature for 2–3 min and then centrifuged for 15 min at 4°C. The upper aqueous phase that contained RNA was transferred to a fresh tube. Then RNA was precipitated from the aqueous phase by mixing with 0.5 ml of isopropyl alcohol, incubating at room temperature for 10 min, and then centrifuging for 10 min at 4°C. The supernatant was removed, and the RNA pellet was washed with 75% ethanol. The RNA pellet was air-dried and then dissolved in DEPC-treated water. The isolated RNA had an_A_260/_A_280ratio of 1.6–1.8, and the RNA yield was ∼1.5 μg/mg of brain tissue.
Fig. 1.
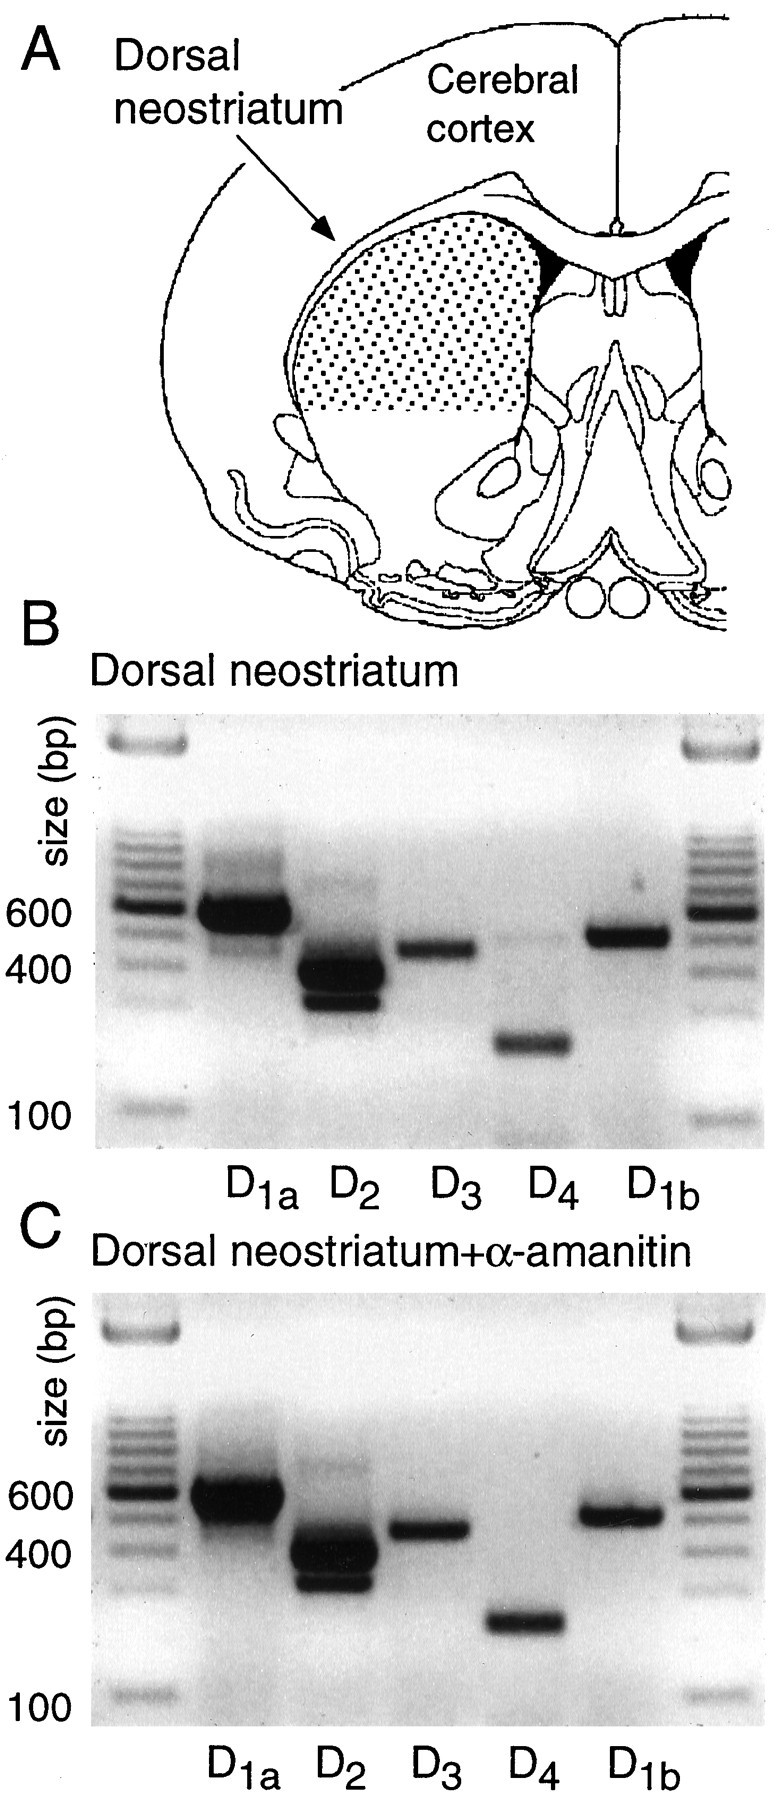
All five dopamine receptor mRNAs are expressed in the dorsal neostriatum. A, The region of dorsal striatum analyzed. Individual neurons were sampled from the same area.B, Photograph of an ethidium bromide-stained gel in which conventional PCR amplicons have been separated by electrophoresis. Note that D1a and D2 amplicons were the most abundant, but D3, D4, and D1b amplicons were clearly present. C, A photograph of an ethidium bromide-stained gel of amplicons derived as in B, but the tissue used as starting material was immersed in the RNA polymerase II inhibitor α-amanitin immediately after slicing. Note that there were no discernible changes in the pattern of expression.
Before RT-PCR, the isolated RNA was treated with amplification grade DNase I (Life Technologies) to eliminate genomic DNA. The reaction mixture (10 μl) contained 1 μg of RNA, 1 μl of 10× DNase I reaction buffer, 1 μl of DNase I (1 U/μl), and 8 μl of DEPC-treated water. The tube was incubated at room temperature for 15 min. The reaction was terminated by adding 1 μl of 25 mmEDTA and heating for 10 min at 65°C. Conventional PCR analysis of dopamine receptor cDNAs was performed as described above. After 40 cycles, products were separated by electrophoresis in a 1.5% agarose gel stained with ethidium bromide. As a control for genomic contamination, samples were prepared as described above, except that the reverse transcriptase was omitted. These experiments consistently yielded negative results.
RESULTS
All five DA receptor mRNAs are expressed in dorsal neostriatum
As a first step in the study of cellular localization of DA receptor mRNAs, tissue expression was examined. Conventional RT-PCR analysis of dorsal neostriatal mRNA isolated from coronal slices revealed that all five receptor mRNAs were present (Fig.1A,B). Although a quantitative analysis was not attempted, D1a and D2 mRNAs seemed to be the most abundant of the five in these assays, as suggested by other techniques (Sibley, 1995).
The isolation of single cells for patch-clamp analysis requires that slices be held for up to 1 hr before dissociation. During this period of time, it is possible that changes in the transcription of DA receptor genes take place. To test for this possibility, tissue was placed immediately after slicing into an inhibitor of RNA polymerase II, α-amanitin (10 μg/ml; Lewin, 1990), and held for 1 hr. As shown in Figure 1C, the RT-PCR profile of tissue in which RNA polymerase II had been inhibited was indistinguishable from untreated tissue (Fig. 1B; n = 3). As a consequence, it seems unlikely that significant alterations in the transcription of DA receptor mRNAs occur during tissue preparation or in the first hours after slicing.
Over one-half of all acutely isolated neostriatal neurons respond to both D1 and D2 class agonists
Previous electrophysiological studies of DA receptor function have found that substantial fractions of medium spiny neurons respond to both D1 and D2 class agonists (Uchimura et al., 1986; Akaike et al., 1987; Hu et al., 1990; Surmeier et al., 1992;Cepeda et al., 1993), suggesting that D1 and D2class receptors are colocalized, but much of this work is open to the criticism that direct and indirect effects of dopaminergic agonists were not convincingly discriminated, making strong inferences about receptor colocalization difficult.
To attempt to understand the extent to which these earlier estimates of receptor colocalization were a consequence of indirectly mediated effects, we studied acutely dissociated neostriatal neurons. We have shown earlier that sodium currents in acutely isolated, retrogradely labeled striatonigral neurons commonly were modulated by both D1 and D2 class agonists (Surmeier et al., 1992). To follow up these observations, we patch-clamped randomly sampled, medium-sized neurons (<10 pF) and determined the ability of D1 and D2 class agonists to modulate Ba2+ current through Ca2+ channels (Surmeier et al., 1995a,b). As shown previously, D1 and D2class agonists frequently were able to modulate currents in the same cell. A plot of peak current as a function of time and ligand application in one such cell is shown in Figure2A. In this cell, both quinpirole (Fig. 2B) and 6-chloro-PB (Fig. 2C) reversibly reduced peak currents. Of our sample (n = 26), ∼50% responded to both agonists, whereas ∼20% responded only to D1 class agonists and ∼20% responded only to D2 class agonists (Fig. 2D).
Fig. 2.

Approximately one-half of all medium spiny neurons coexpress functional D1 and D2 class linked to modulation of voltage-dependent Ca2+ channels.A, Plot of peak current evoked by a voltage step to 0 mV from a holding potential of −80 mV. The application of the D2 class agonist quinpirole (5 μm) reversibly decreased peak current in this cell, as did application of the specific D1 class agonist 6-chloro-PB (2 μm). 5-HT had little or no effect on Ca2+ currents in this cell.Inset, A photomicrograph of an acutely isolated medium spiny neuron. B, Representative current traces from the records used to construct A, showing the effects of quinpirole. C, Representative current traces from the records used to construct A, showing the effects of 6-chloro-PB. D, Summary of recordings in which D1 and D2 class agonists were applied to the same cell and the effects on Ca2+ currents were monitored (n = 26). Modulations < 10% of the peak current were disregarded.
Single-cell RT-PCR analysis of DA receptor mRNAs
To determine the molecular identity of the receptors mediating the responses to the dopaminergic ligands, single-cell RT-PCR techniques were used. Neurons initially were divided into three groups on the basis of ENK and SP mRNA expression. The expression of these releasable peptides is correlated strongly with the axonal projection pattern of medium spiny neurons (Graybiel, 1990; Gerfen, 1992). Neurons expressing ENK mRNA alone project primarily to the globus pallidus, whereas neurons expressing either SP alone or both ENK and SP project to both the globus pallidus and the substantia nigra (Kawaguchi et al., 1990; our unpublished observations). As described below, the DA receptor mRNAs expressed by these three groups differed markedly.
An obvious problem in attempting to determine how the expression of several mRNAs is coordinated in the same cell is that low abundance mRNAs may be missed inadvertently. For example, to assay for five different mRNAs, we must divide the total compliment of reverse-transcribed cDNA into at least five separate aliquots using conventional PCR techniques. If there were only one or two times the number of templates needed to reach the detection threshold for the PCR reaction, then there would be a significant chance of missing that particular cDNA. To generate a model of the probability of such an occurrence, we used Poisson statistics (Feller, 1950). Shown in Figure3 are plots of blank probability as a function of cDNA abundance (expressed in PCR threshold units). As the fraction of the total cellular cDNA used in the detection reaction increased (from one-twentieth to one-half), the probability of detection increased (as expected). This simulation suggests that the relationship between detection probability and the fraction of total cellular cDNA used in the detection reaction can be used to draw inferences about mRNA abundance at an ordinal scale of measurement.
Fig. 3.

The probability of detecting a particular mRNA transcript decreases as the fraction of the total cellular cDNA used as a template decreases. A Poisson model (see Materials and Methods) was used to estimate the probability that a PCR reaction would fail to detect a transcript. Parametric curves generated by using 1/20th, 1/10th, 1/8th, 1/4, and 1/2 of the cellular cDNA are shown.
Enk+/SP− neurons express primarily D2 class DA receptor mRNAs
Medium spiny neurons having detectable levels of enkephalin, but not substance P mRNA (ENK+/SP−), expressed high levels of D2 receptor mRNA. With a one-tenth aliquot, D2 cDNA was detected in nearly 90% of this group. A photomicrograph of an agarose gel in which the PCR products from an individual cell have been separated by electrophoresis is shown in Figure 4A. The other DA receptor mRNAs were rarely detected with this small aliquot. The pattern of DA receptor mRNA expression in ENK+/SP− neurons studied in this way is summarized in Figure 4B. In this panel (and in subsequent summary diagrams), the extent to which particular mRNAs were found together is coded by the extent to which their lanes are shaded at similar points along the abscissa. For example, two mRNAs that were always found together would have lanes that were shaded at the same points along the horizontal axis; mRNAs that did not colocalize would have lane shading that did not overlap.
Fig. 4.
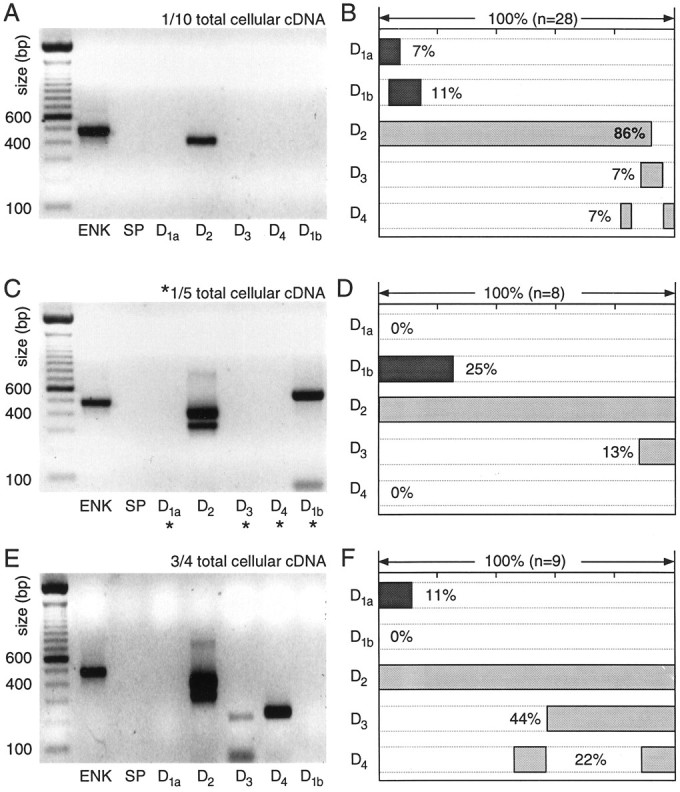
Neurons expressing detectable levels of enkephalin (ENK) but not substance P (SP) mRNA express D2 mRNA at high levels and other dopamine receptor mRNAs at lower levels. A, Photograph of an ethidium bromide-stained agarose gel in which dopamine receptor and peptide mRNA amplicons from a single medium spiny neuron have been separated by electrophoresis. One-tenth of the total cDNA was used for each PCR reaction. Note the presence of ENK and D2l amplicons.B, Summary of the coordinated DA receptor mRNA expression in 28 neurons expressing ENK, but not SP. Coexpression for any set of mRNAs can be deduced by the extent to which shaded bars in their lanes overlap. C, Photograph of a gel containing amplicons from another neuron in which one-fifth of the total cDNA was used for mRNAs not detected with one-tenth of the starting material (denoted by asterisks). Note the presence of both short and long isoforms of the D2 receptor mRNA. D, Summary of coexpression in eight neurons processed in the same manner. E, Photograph of a gel containing amplicons from a single medium spiny neuron in which a multiplex procedure with three-fourths of the total cellular cDNA was used for detection of DA receptor mRNAs. F, Summary of coexpression detected with the multiplex procedure in nine ENK+/SP− neurons.
As the fraction of the total cellular cDNA used in the PCR reactions increased, other DA receptor mRNAs emerged. Doubling the template concentration for D1a, D1b, D3, and D4 reactions led to a modest increase in the detection frequency of D1b mRNA (Fig. 4C,D). The short isoform of the D2 mRNA was seen consistently in this condition (Fig. 4C,D). Using a two-stage multiplex procedure to maximize the detectability of low abundance mRNAs increased the detection rate of D3 and D4 mRNAs, primarily. An example of an ENK+/SP− cell in which D2, D3, and D4 mRNAs were seen is shown in Figure 4E. Using this approach, we found D3 and/or D4 mRNAs in >50% of ENK+/SP− neurons. The increasing detection frequency of these mRNAs with aliquot size suggests that they were present in low abundance, as compared with D2 mRNAs. The variation in the detection frequency of D1a and D1b mRNAs suggests that they are present in moderate abundance in a relatively small percentage (10–25%) of these neurons.
ENK−/SP+ neurons express D1amRNA in addition to D3 or D4 receptor mRNAs
Medium spiny neurons having detectable levels of substance P, but not enkephalin mRNA (ENK−/SP+), expressed high levels of D1a receptor mRNA. With one-tenth aliquots, D1a mRNA was detected in 80% of the sample (Fig.5A,B). D3 mRNA was detected in one-half of this sample, but the other receptor mRNAs either were not seen or were seen rarely. Doubling the aliquot size increased the D1a detection rate to 100% and did not change the detection rate for the D3 mRNA (Fig. 5C,D).
Fig. 5.
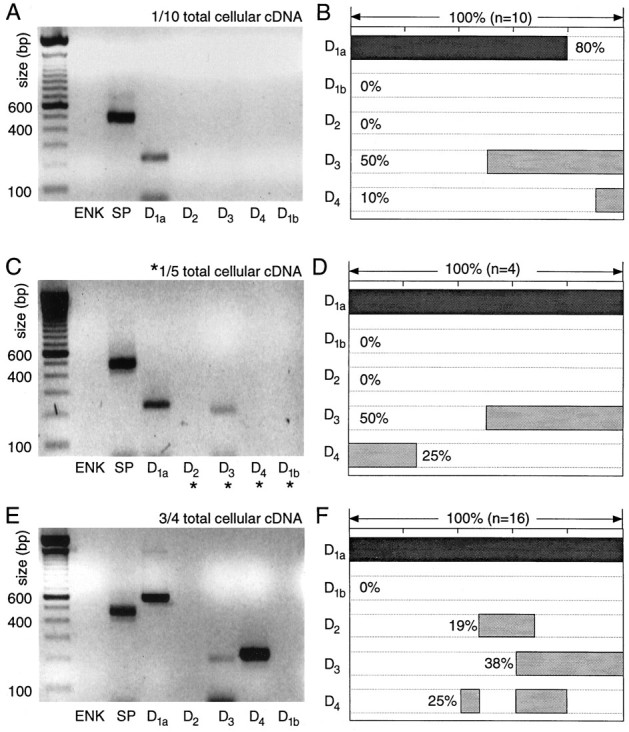
Neurons expressing detectable levels of SP, but not ENK, mRNA express D1a mRNA at high levels and other dopamine receptor mRNAs at lower levels. A, Photograph of an ethidium bromide-stained agarose gel in which dopamine receptor and peptide mRNA amplicons from a single medium spiny neuron have been separated by electrophoresis. One-tenth of the total cDNA was used for each PCR reaction. Note the presence of SP and D1aamplicons. B, Summary of the coordinated DA receptor mRNA expression in 10 neurons expressing SP, but not ENK. Coexpression for any set of mRNAs can be deduced by the extent to which_shaded bars_ in their lanes overlap. C, Photograph of a gel containing amplicons from another neuron in which one-fifth of the total cDNA was used for mRNAs not detected with one-tenth of the starting material (denoted by_asterisks_). D, Summary of coexpression in four neurons processed in the same manner. E, Photograph of a gel containing amplicons from a single medium spiny neuron in which a multiplex procedure with three-fourths of the total cellular cDNA was used for detection of DA receptor mRNAs. Note that in these amplifications the D1a primer set yielding the longer amplicon was used. F, Summary of coexpression detected with the multiplex procedure in 16 ENK−/SP+neurons.
With the multiplex protocol, the detection frequencies for D1a and D3 mRNAs were similar to those seen with smaller aliquots (Fig. 5F). However, the detection frequency of D4 mRNA increased to 25% (as seen with one-fifth aliquots; Fig. 5E,F). In addition, D2 mRNA, which had not been seen with one-tenth or one-fifth aliquots, was seen in ∼20% of the sample, suggesting that D2 mRNAs were of relatively low abundance in this group.
Enk+/SP+ neurons coexpress D1aand D2 mRNAs
Neurons coexpressing detectable levels of substance P and enkephalin (ENK+/SP+) were the only group in which a large percentage of neurons coexpressed D1a and D2 mRNAs. With one-tenth aliquots, D2 mRNA was detected most commonly in this sample (78%; Fig.6A,B). D1a receptor amplicons were seen less frequently, and both amplicons were detected in approximately one-fifth of the sample. The other receptor mRNAs either were not detected or were seen rarely with the small aliquot. Doubling the aliquot did not change the D1a and D2 detection frequencies significantly (Fig.6D).
Fig. 6.
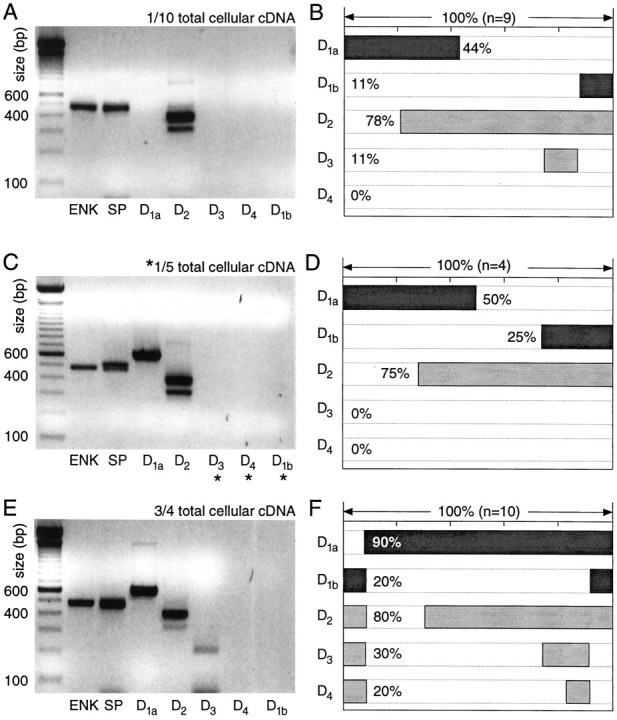
Neurons coexpressing detectable levels of ENK and SP mRNA coexpress D1a and D2 mRNAs.A, Photograph of an ethidium bromide-stained agarose gel in which dopamine receptor and peptide mRNA amplicons from a single medium spiny neuron have been separated by electrophoresis. One-tenth of the total cDNA was used for each PCR reaction. Note the presence of ENK, SP, and D2 amplicons. B, Summary of the coordinated DA receptor mRNA expression in nine neurons expressing both ENK and SP. C, Photograph of a gel containing amplicons from another neuron in which one-fifth of the total cDNA was used for mRNAs not detected with one-tenth of the starting material (denoted by_asterisks_). D, Summary of coexpression in four neurons processed in the same manner. E, Photograph of a gel containing amplicons from a single medium spiny neuron in which a multiplex procedure with three-fourths of the total cellular cDNA was used for detection of DA receptor mRNAs. F, Summary of coexpression detected with the multiplex procedure in 10 ENK+/SP+ neurons.
However, with the multiplex protocol, the detection rate for D1a mRNA increased to 90% (Fig. 6F). As a consequence, D1a and D2 mRNAs were detected in 70% of this group (Fig. 6E,F). The detection frequency of D3, D4, and D1b mRNAs also increased with the size of the aliquot used, suggesting that they were expressed at relatively low levels in 20–30% of ENK+/SP+ neurons.
Low abundance DA receptor mRNAs give rise to functional protein
Although the RT-PCR technique was capable of detecting the presence of mRNAs for D3, D4, and D1b receptors, there is no guarantee that functionally significant levels of receptor protein were generated from these transcripts. In an attempt to determine whether these transcripts could give rise to functional protein, whole-cell recording was combined with conventional single-cell RT-PCR. Several neurons were found to express detectable levels of D2 and D1b mRNA, but not D1a mRNA (Fig. 7A, see above). In two of three neurons with this expression profile, the application of the D1 class agonist 6-chloro-PB brought about a robust modulation of Ca2+ currents, suggesting that D1b receptors were responsible (Fig. 7B). As shown above, in other cells D3 or D4 mRNA was detected, but not D2 mRNA (Fig. 7C). In two of three neurons with this expression profile, the application of the D2 class agonist quinpirole reversibly decreased Ca2+ currents, suggesting that D4 receptors were responsible for the modulation (Fig. 7D). It is possible in both of these experimental series that undetected levels of D1a or D2 receptor mRNA were responsible for the protein mediating the response, but this seems unlikely. Providing evidence that D3 receptors possessed a similar coupling proved difficult, in that all of the cells studied that expressed D3 receptors also had detectable levels of another D2 class receptor mRNA (n = 5). Although these results do not prove that D3, D4, and D1b receptor mRNAs invariably give rise to functional protein, they do suggest that these mRNAs are capable of being translated and properly processed.
Fig. 7.

Low-abundance mRNAs give rise to functional protein. A, Photograph of an ethidium bromide-stained gel in which the amplicons from a single cell have been separated by electrophoresis. Note that this cell expressed detectable levels of D2 and D1b mRNA. B, Whole-cell recording from the same cell showing that the application of the D1 class agonist 6-chloro-PB (5 μm) reversibly reduced Ba2+ currents evoked by a voltage ramp.C, Photograph of an ethidium bromide-stained gel in which the amplicons from another cell have been separated by electrophoresis. Note that this cell expressed detectable levels of D4 but not D2 or D3 mRNA.D, Whole-cell recording from the same cell (from_C_) showing that the application of the D2class agonist quinpirole (2 μm) reversibly reduced Ba2+ currents evoked by a voltage ramp.
D2 receptor splice variants are colocalized in the majority of ENK+ neurons
In the whole-striatum RT-PCR analysis and in the single-cell analyses, the long-splice variant of the D2 receptor mRNA (D2l) was the most abundant. This agrees with previous estimates of D2 isoform expression in the neostriatum (Sibley, 1995). Although less abundant, the short-splice variant (D2s) was seen in a significant number of neurons, usually in conjunction with D2l mRNA. For example, in the ENK+/SP− group, over one-half of the neurons coexpressed detectable levels of short and long isoforms (as seen with the multiplex protocol; n = 36; Fig.8A). Neurons expressing detectable levels of only the short form were a small fraction of the total (8%). In the ENK+/SP+ group, there was a similar pattern of expression (approximately one-half of the neurons coexpressed D2s and D2l) with a slightly higher percentage of neurons (20%, n = 15) expressing only the short isoform (Fig. 8B). Although the number of ENK−/SP+ neurons expressing D2isoforms was small (n = 3/54), the short and long isoforms were never found together in this group (Fig. 8C).
Fig. 8.
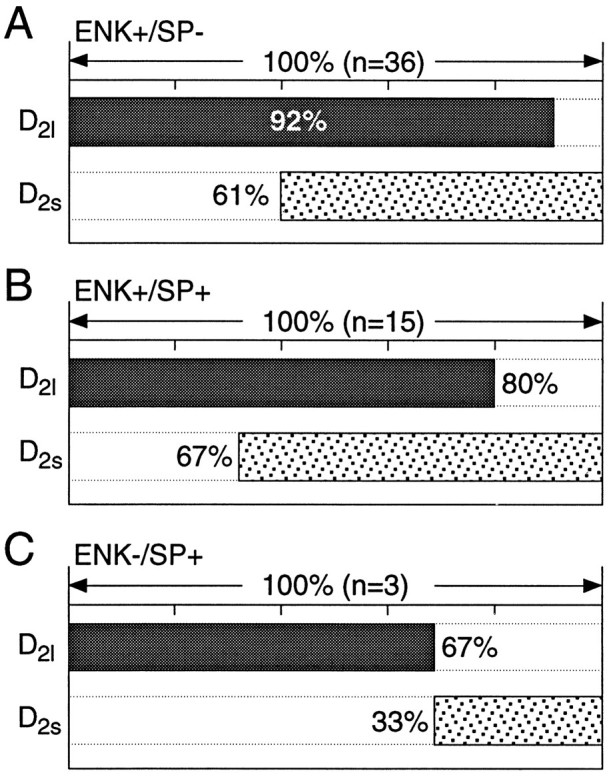
D2 isoforms frequently were colocalized. A, Bar plot summarizing the coexpression of short and long transcripts in ENK+/SP−neurons. The extent of coexpression is coded by the extent to which the D2l and D2s lanes are shaded at the same point along the abscissa. B, Bar plot summarizing coexpression in ENK+/SP+ neurons.C, Summary of coexpression in ENK−/SP+ neurons.
DISCUSSION
The principal goal of this study was to understand why anatomical and functional studies of DA receptor localization in the neostriatum have been so discordant (Gerfen, 1992; Surmeier et al., 1993). The issue is obviously an important one, having a direct bearing on treatment strategies for a variety of psychomotor disorders of the basal ganglia, most prominently Parkinson’s disease.
It was our working hypothesis that at the heart of the dispute was the assumption that only D1a and D2receptors were functionally significant in the workings of the dorsal neostriatum. This inference allowed the equation of responsiveness to D1 class agonists with the presence of D1areceptors and responsiveness to D2 class agonists with the presence of D2 receptors. In agreement with a number of other studies (Ariano and Sibley, 1994; Bergson et al., 1995; Booze and Wallace, 1995; Choi et al., 1995; Larson and Ariano, 1995; Schoots et al., 1995; Vrana et al., 1995), our results argue that, in fact, this assumption is incorrect. Significant levels of D3, D4, and D1b receptor mRNAs are present in medium spiny neurons, and their expression is correlated with that of the releasable peptides SP and ENK.
Strengths and weaknesses of single-cell RT-PCR
The view that only D1a and D2 receptors are important in the dorsal neostriatum derives primarily from in situ hybridization studies (Bouthenet et al., 1991; Gerfen, 1992;Meador-Woodruff et al., 1992; Diaz et al., 1995). Although this approach has proven to be an important tool in localizing mRNAs, it cannot be used definitively to exclude the presence of particular mRNAs. Several factors can compromise the ability of this technique to accurately localize mRNAs, such as secondary structure and protein binding (Chesselet et al., 1995). In addition, mRNA must be localized in relatively high abundance within the soma to be detected. A number of studies have shown that mRNAs coding for proteins found in dendritic synapses (like DA receptors) are moved to these dendritic sites for translation (Steward and Banker, 1992; Miyashiro et al., 1994).
RT-PCR techniques are not encumbered by the same limitations. The detection threshold for these techniques is in principle only a few mRNA copies (Mullis et al., 1994). However, conventional RT-PCR techniques with mRNA pooled from all the cell types in a brain region obviously lack the ability to resolve heterogeneity within a population of cells. This shortcoming is of obvious importance not only in distinguishing between mRNAs originating from neuronal and non-neuronal sources but also in distinguishing between mRNAs originating from different neuronal phenotypes within a region. Single-cell RT-PCR (Monyer and Lambolez, 1995; Yan and Surmeier, 1996) and RT-aRNA (Van Gelder et al., 1990; Eberwine et al., 1992; Surmeier et al., 1992) techniques overcome this problem. However, these approaches are not without shortcomings. RNAs that are exclusively or primarily dendritic may be missed. This is potentially a problem in our experiments and may have led to an underestimate of colocalization.
However, the converse argument can also be made, at least for the somatic compartment. Although in situ hybridization techniques may miss particular mRNAs, the exquisite sensitivity of RT-PCR techniques makes them capable of detecting mRNAs with very low copy numbers. At the extreme, genomic DNA may be amplified. This was a major concern in our initial studies. Although there were obvious differences in cellular PCR profiles (arguing against genomic amplification), we tried explicitly to design primer sets that spanned a splice site when possible (D2 class receptor genes all contain introns). If genomic DNA were amplified, then a high-molecular-weight, unspliced product would be present in the amplified material. We have never seen any evidence for this in our experiments, including those using 80 rounds of amplification. Johansen et al. (1995) have also found that genomic material is not amplified in single-cell preparations.
Given that the RT-PCR procedure amplifies transcripts generated from mRNA, can inferences be drawn about relative mRNA abundance? A number of studies have attempted to generate abundance estimates at the interval or ratio scale of measurement with PCR (Ramakrishnan et al., 1994). Although the PCR amplification stage is capable of accurate quantitation, the reverse transcription (RT) step is not, at present. Although there is no way to escape the limitations this uncertainty poses completely, restricting the level of quantitation to an ordinal scale (rank order) mitigates the consequences of deficiencies in the RT step. The simplest, least-assumption-bound way of generating ordinal estimates of mRNA abundance was to look at correlations between the probability of detection and the fraction of the total cellular cDNA used as template. This approach showed that, when the cellular analysis was restricted to only high abundance mRNAs, a pattern very similar to that found with in situ hybridization was seen. Namely, D1a mRNA was detected in SP-expressing neurons and D2 mRNA was detected in ENK-expressing neurons, whereas D3 mRNA was seen in a small population of cells (∼20%) and D4 and D1b mRNAs were virtually undetected. Increasing the sensitivity of our mRNA assay revealed more colocalization of D1a and D2 mRNAs but also more widespread expression of D3, D4, and D1b mRNAs. The frequency with which medium spiny neurons responded to both D1 and D2 class agonists can be explained only if these lower abundance receptors give rise to functionally significant receptors.
The expression patterns of D3, D4, and D1b mRNAs
Previous work had shown that D3 receptor mRNA and protein are present in the dorsal neostriatum, albeit at lower levels than in ventral neostriatum (Ariano and Sibley, 1994; Booze and Wallace, 1995; Larson and Ariano, 1995; Vrana et al., 1995). Our work extends these studies in showing that D3 mRNA is clearly present and most abundant in neurons expressing SP but not ENK. Approximately one-half of these neurons had detectable levels of D3 mRNA. This proportion did not change significantly with increasing amounts of cellular cDNA, suggesting that it was relatively abundant in this subset of cells and not expressed or expressed at very low levels in other SP+/ENK− neurons. In contrast, the D3 mRNA detection probability steadily increased with the amount of cellular cDNA used as starting material in the ENK+/SP− population, suggesting that D3 mRNA was expressed at lower levels in these neurons. Even lower levels of D3 mRNA were present in the group of neurons coexpressing SP and ENK.
Although the presence of D4 mRNA and receptors in dorsal neostriatal neurons has been controversial (O’Malley et al., 1992;Murray et al., 1995; Schoots et al., 1995; Vrana et al., 1995), our results suggest that they are present at low-to-moderate levels in a subset of medium spiny neurons. To ensure that the D4transcript was properly identified, we used two different primer sets [one that spanned a splice site (O’Malley et al., 1992)], and the PCR product was sequenced (as for the other amplicons). D4mRNA was found to some extent in all three groups of neurons but seemed to be the most abundant in neurons expressing SP, but not ENK. Our results also suggest that these transcripts give rise to functional receptor protein. In many of these neurons, D3 mRNA was also present. Because all of the neurons in this group expressed D1a mRNA, the presence of D3 and D4mRNAs argues that D1 and D2 class receptors should be colocalized in nearly 60% of ENK−/SP+ neurons (Fig.9A).
Fig. 9.
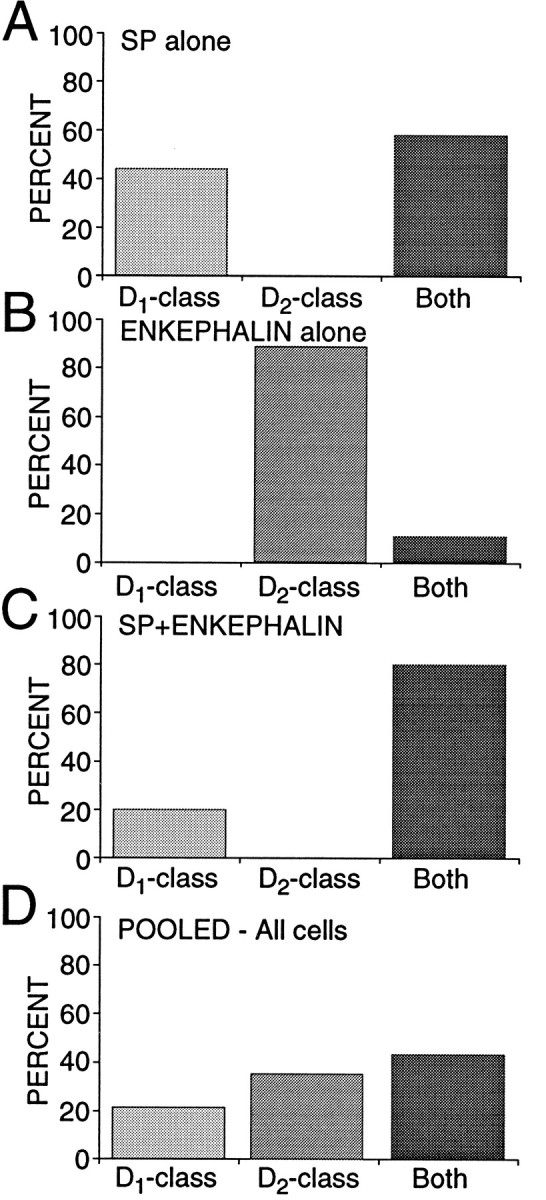
D1 and D2 class receptor mRNAs were coexpressed most commonly in neurons expressing SP.A, Bar graph showing the percentage of ENK−/SP+ neurons expressing only_D_1 class (D1a, D1b), only D_2_class (D2, D3, D4), or at least one member of each class (Both). B, Bar graph showing the summary for ENK+/SP− neurons. C, Bar graph showing the summary for ENK+/SP+ neurons. All results were derived from multiplex PCR experiments.D, Bar graph showing pooled data in which ENK+/SP− and ENK−/SP+groups each were 40% of the total and the ENK+/SP+ group was 20% of the total. Note the similarity to Figure 2D.
In contrast, presumptive striatopallidal neurons (ENK+/SP−) did not commonly have detectable levels of both D1 and D2 class mRNAs (Fig.9B). All of the neurons in this group had D2mRNA, frequently coexpressing short and long isoforms, but D1a and D1b mRNAs seemed to be present in only a small subset of neurons (∼10-25%). Previous _in situ_hybridization work had suggested that D1b mRNA was not present in the rat dorsal striatum (Meador-Woodruff et al., 1992; cf.Laurier et al., 1994). Given its restriction to a small subset of neurons, this is not surprising. However, within this group, activation of the receptor does have functionally significant consequences, as our results show. Furthermore, in another numerically small but functionally significant group of neurons—the cholinergic interneuron—D1b mRNA is found in nearly every cell tested (n = 34; Yan, Song and Surmeier, unpublished observations). The pattern of D1b expression seen here and its presence in cholinergic neurons agree well with the distribution of mRNA (Choi et al., 1995) and protein (Bergson et al., 1995) found in the primate brain.
The only group of neurons that consistently coexpressed D1aand D2 mRNAs also coexpressed SP and ENK mRNAs. Nearly all of these neurons (80%) had both D1 and D2class mRNAs (Fig. 9C). The restriction of high levels of D1a and D2 mRNA to this group of cells is in agreement with previous in situ hybridization work showing a strong correlation between the expression of ENK and D2mRNA on the one hand and SP and D1a mRNA on the other (Gerfen, 1992; LeMoine and Bloch, 1995).
An unresolved issue is how large a population coexpresses these peptides (and receptors). In a sample of acutely isolated medium-sized neurons profiled just for peptide mRNA (n = 64), 17% had detectable levels of SP and ENK, whereas 38% were ENK+/SP−, 42% ENK−/SP+, and 3% were ENK−/SP−. Both ENK−/SP+ and ENK+/SP+neurons (but not ENK+/SP− neurons) are retrogradely labeled by rhodamine bead injections into the substantia nigra (data not shown). Previous peptide colocalization estimates from immunocytochemical studies have varied widely—from >30 to 1–2% (Penny et al., 1986; Anderson and Reiner, 1990; Besson et al., 1990). The variance in the estimates of D1a and D2mRNA colocalization is surprisingly similar (cf. Gerfen, 1992; Lester et al., 1993; LeMoine and Bloch, 1995). The lack of agreement in these studies undoubtedly turns on the substantial technical obstacles facing attempts to judge protein or mRNA coexpression. These obstacles are considerably less significant in our situation. If our estimate of the relative sizes of the three efferent populations is taken at face value (Fig. 9), then it suggests that nearly 70% of the medium spiny neurons in the “direct” efferent pathway (projecting to substantia nigra/entopeduncular nucleus) colocalizes D1 and D2 class receptors—in stark contrast to neurons presumably projecting exclusively to the globus pallidus (ENK+/SP−). A schematic summary of our results is shown in Figure 10, in which we have assumed the well established correlation between peptide expression and projection site. An important question is whether these groups can be subdivided further on the basis of membership in other functionally significant classes or compartments (most notably the striosomal and matrix compartments).
Fig. 10.

A schematic summary of the pattern of dopamine receptor expression in medium spiny efferent populations (as inferred from peptide expression). Receptor abundance is coded by the size of the subtype label.
Functional implications
The demonstration that D1 and D2class receptors are coexpressed by a significant percentage of medium spiny neurons, particularly those within the striatonigral pathway, establishes a cellular and molecular foundation for the well known interactions between these signaling pathways that does not require the postulation of poorly defined circuit level interactions. An understanding of the functional consequences of the differences in receptor expression hinges on a more complete characterization of the subcellular distribution of the lower abundance receptors (particularly D3 and D4 receptors) and how their intracellular linkages differ from D1a and D2receptors. It is evident, however, that the striatopallidal and striatonigral systems cannot be viewed as functionally homogeneous. This is particularly true of the striatonigral system in that there are at least three neuronal subsets (all of approximately the same size) that can be distinguished on the basis of their expression of D2 class receptors. It is tempting to speculate that these basal ganglia subsystems may represent components of parallel processing modules identified by other criteria (Alexander et al., 1986; Graybiel et al., 1994).
Footnotes
This work was supported by U.S. Public Health Service Grants NS28889 and NS34696 to D.J.S., NS26487 to D.J.S. and S. T. Kitai, and a Parkinson’s Disease Foundation fellowship to W.J.S. We thank Drs. Jim Eberwine, Marie-Francoise Chesselet, and Kent and Sheila Vrana for many helpful discussions, Drs. Kent and Sheila Vrana for help in the initial PCR experiments, and Dr. Lorina Dudkin for her excellent technical assistance.
Correspondence should be addressed to Dr. D. James Surmeier, Department of Anatomy and Neurobiology, University of Tennessee, Memphis, TN 38163.
REFERENCES
- 1.Akaike A, Ohno Y, Sasa M, Takaori S. Excitatory and inhibitory effects of dopamine on neuronal activity of the caudate neurons in vitro. Brain Res. 1987;418:262–272. doi: 10.1016/0006-8993(87)90094-1. [DOI] [PubMed] [Google Scholar]
- 2.Alexander GE, DeLong MR, Strick PL. Parallel organization of functionally segregated circuits linking basal ganglia and cortex. Annu Rev Neurosci. 1986;9:357–381. doi: 10.1146/annurev.ne.09.030186.002041. [DOI] [PubMed] [Google Scholar]
- 3.Anderson KD, Reiner A. The patterns of neurotransmitter and neuropeptide co-occurrence among striatal projection neurons: conclusions based on recent findings. Brain Res Rev. 1990;15:251–265. doi: 10.1016/0165-0173(90)90003-7. [DOI] [PubMed] [Google Scholar]
- 4.Ariano MA, Sibley DR. Dopamine receptor distribution in the rat CNS: elucidation using anti-peptide antisera directed against D1A and D3 subtypes. Brain Res. 1994;649:95–110. doi: 10.1016/0006-8993(94)91052-9. [DOI] [PubMed] [Google Scholar]
- 5.Ariano MA, Larson ER, Noblett KL. Cellular dopamine receptor subtype localization. In: Ariano MA, Surmeier DJ, editors. Molecular and cellular mechanisms of neostriatal function. Landes; Austin, TX: 1995. pp. 59–70. [Google Scholar]
- 6.Bergson C, Mrzljak L, Smiley JF, Pappy M, Levenson R, Goldman-Rakic PS. Regional, cellular, and subcellular variation in the distribution of D1 and D5 dopamine receptors in primate brain. J Neurosci. 1995;15:7821–7836. doi: 10.1523/JNEUROSCI.15-12-07821.1995. [DOI] [PMC free article] [PubMed] [Google Scholar]
- 7.Bargas J, Howe A, Eberwine J, Cao Y, Surmeier DJ. Cellular and molecular characterization of Ca2+ currents in acutely isolated, adult rat neostriatal neurons. J Neurosci. 1994;14:6667–6686. doi: 10.1523/JNEUROSCI.14-11-06667.1994. [DOI] [PMC free article] [PubMed] [Google Scholar]
- 8.Besson MJ, Graybiel AM, Quinn B. Coexpression of neuropeptides in the cat’s striatum: an immunohistochemical study of substance P, dynorphin B, and enkephalin. Neuroscience. 1990;39:33–58. doi: 10.1016/0306-4522(90)90220-x. [DOI] [PubMed] [Google Scholar]
- 9.Booze RM, Wallace DR. Dopamine D2 and D3 receptors in the rat striatum and nucleus accumbens: use of 7-OH-DPAT and [125I]-iodosulpiride. Synapse. 1995;19:1–13. doi: 10.1002/syn.890190102. [DOI] [PubMed] [Google Scholar]
- 10.Bouthenet M-L, Soil E, Martres M-P, Sokoloff P, Giros B, Schwartz J-C. Localization of dopamine D3 receptor mRNA in the rat brain using in situ hybridization histochemistry: comparison with dopamine D2 receptor mRNA. Brain Res. 1991;564:203–219. doi: 10.1016/0006-8993(91)91456-b. [DOI] [PubMed] [Google Scholar]
- 11.Carter MS, Krause JE. Structure, expression, and some regulatory mechanisms of the rat preprotachykinin gene encoding substance P, neurokinin A, neuropeptide K, and neuropeptide gamma. J Neurosci. 1990;10:2203–2214. doi: 10.1523/JNEUROSCI.10-07-02203.1990. [DOI] [PMC free article] [PubMed] [Google Scholar]
- 12.Cepeda C, Buchwald NA, Levine MS. Neuromodulatory actions of dopamine in the neostriatum are dependent upon the excitatory amino acid receptor subtypes activated. Proc Natl Acad Sci USA. 1993;90:9576–9580. doi: 10.1073/pnas.90.20.9576. [DOI] [PMC free article] [PubMed] [Google Scholar]
- 13.Chamberlain JS, Chamberlain JR. Optimization of multiplex PCRs. In: Mullis KB, Ferré F, Gibbs RA, editors. The polymerase chain reaction. Birkhäuser; Boston: 1994. pp. 38–46. [Google Scholar]
- 14.Chesselet M-F, Delfs JM, Ghasemzadeh B, Lenz S, Mercugliano M, Qin Y, Salin P, Soghomonian J-J. Cell-specific mRNA expression in the striatum. In: Ariano MA, Surmeier DJ, editors. Molecular and cellular mechanisms of neostriatal function. Landes; Austin, TX: 1995. pp. 89–102. [Google Scholar]
- 15.Choi WS, Machida CA, Ronnekleiv OK. Distribution of dopamine D1, D2, and D5 receptor mRNAs in the monkey brain: ribonuclease protection assay analysis. Brain Res Mol Brain Res. 1995;31:86–94. doi: 10.1016/0169-328x(95)00038-t. [DOI] [PubMed] [Google Scholar]
- 16.Cimino GD, Metchette K, Isaacs ST, Zhu YS. More false-positive problems [letter/comment]. Nature. 1990;345:773–774. doi: 10.1038/345773b0. [DOI] [PubMed] [Google Scholar]
- 17.Diaz J, Levesque D, Lammers CH, Griffon N, Martres MP, Schwartz JC, Sokoloff P. Phenotypical characterization of neurons expressing the dopamine D3 receptor in the rat brain. Neuroscience. 1995;65:731–745. doi: 10.1016/0306-4522(94)00527-c. [DOI] [PubMed] [Google Scholar]
- 18.Eberwine J, Yeh H, Miyashiro K, Cao Y, Nair S, Finnell R, Zettel M, Coleman P. Analysis of gene expression in single live neurons. Proc Natl Acad Sci USA. 1992;89:3010–3014. doi: 10.1073/pnas.89.7.3010. [DOI] [PMC free article] [PubMed] [Google Scholar]
- 19.Erenberg G. Treatment of Tourette syndrome with neuroleptic drugs. Adv Neurol. 1992;58:241–243. [PubMed] [Google Scholar]
- 20.Feller W. Wiley; New York: 1950. An introduction to probability theory and its applications. . [Google Scholar]
- 21.Gerfen CR. The neostriatal mosaic: multiple levels of compartmental organization. Trends Neurosci. 1992;15:133–139. doi: 10.1016/0166-2236(92)90355-c. [DOI] [PubMed] [Google Scholar]
- 22.Graybiel AM. Neurotransmitters and neuromodulators in the basal ganglia. Trends Neurosci. 1990;13:244–254. doi: 10.1016/0166-2236(90)90104-i. [DOI] [PubMed] [Google Scholar]
- 23.Graybiel AM, Aosaki T, Flaherty AW, Kimura M. The basal ganglia and adaptive motor control. Science. 1994;265:1826–1831. doi: 10.1126/science.8091209. [DOI] [PubMed] [Google Scholar]
- 24.Hamill OP, Marty A, Neher E, Sakmann B, Sigworth FJ. Improved patch-clamp techniques for high resolution current recording from cells and cell-free membrane patches. Pflügers Arch. 1981;391:85–100. doi: 10.1007/BF00656997. [DOI] [PubMed] [Google Scholar]
- 25.Hersch SM, Ciliax BJ, Gutekunst CA, Rees HD, Heilman CJ, Yung KK, Bolam JP, Ince E, Yi H, Levey AI. Electron microscopic analysis of D1 and D2 dopamine receptor proteins in the dorsal striatum and their synaptic relationships with motor corticostriatal afferents. J Neurosci. 1995;15:5222–5237. doi: 10.1523/JNEUROSCI.15-07-05222.1995. [DOI] [PMC free article] [PubMed] [Google Scholar]
- 26.Hornykiewcz O. Dopamine in the basal ganglia. Its role and therapeutic implications. Br Med Bull. 1973;29:172–178. doi: 10.1093/oxfordjournals.bmb.a070990. [DOI] [PubMed] [Google Scholar]
- 27.Howells RD. Proenkephalin biosynthesis in the rat. NIDA Res Monogr. 1986;70:43–65. [PubMed] [Google Scholar]
- 28.Hu X-T, Wachtel SR, Galloway MP, White FJ. Lesions of the nigrostriatal dopamine projection increase the inhibitory effects of D1 and D2 dopamine agonists on caudate-putamen neurons and relieve D2 receptors from the necessity of D1 receptor stimulation. J Neurosci. 1990;10:2318–2329. doi: 10.1523/JNEUROSCI.10-07-02318.1990. [DOI] [PMC free article] [PubMed] [Google Scholar]
- 29.Johansen FF, Lambolez B, Audinat E, Bochet P, Rossier J. Single-cell RT-PCR proceeds without the risk of genomic DNA amplification. Neurochem Int. 1995;26:239–243. doi: 10.1016/0197-0186(94)00129-i. [DOI] [PubMed] [Google Scholar]
- 30.Kawaguchi Y, Wilson CJ, Emson PC. Projection subtypes of rat neostriatal matrix cells revealed by intracellular injection of biocytin. J Neurosci. 1990;10:3421–3438. doi: 10.1523/JNEUROSCI.10-10-03421.1990. [DOI] [PMC free article] [PubMed] [Google Scholar]
- 31.Larson ER, Ariano MA. D3 and D2 dopamine receptors: visualization of cellular expression patterns in motor and limbic structures. Synapse. 1995;20:325–337. doi: 10.1002/syn.890200406. [DOI] [PubMed] [Google Scholar]
- 32.Laurier LG, O’Dowd BF, George SR. Heterogeneous tissue-specific transcription of dopamine receptor subtype messenger RNA in rat brain. Brain Res Mol Brain Res. 1994;26:344–350. doi: 10.1016/0169-328x(94)90170-8. [DOI] [PubMed] [Google Scholar]
- 33.Le Moine C, Bloch B. D1 and D2 dopamine receptor gene expression in the rat striatum: sensitive cRNA probes demonstrate prominent segregation of D1 and D2 mRNAs in distinct neuronal populations of the dorsal and ventral striatum. J Comp Neurol. 1995;355:418–426. doi: 10.1002/cne.903550308. [DOI] [PubMed] [Google Scholar]
- 34.Lester J, Fink S, Aronin N, DiFiglia M. Colocalization of D1 and D2 dopamine receptor mRNAs in striatal neurons. Brain Res. 1993;621:106–110. doi: 10.1016/0006-8993(93)90303-5. [DOI] [PubMed] [Google Scholar]
- 35.Lewin B. Oxford UP; New York: 1990. Genes, Vol IV. . [Google Scholar]
- 36.Miyashiro K, Dichter M, Eberwine J. On the nature and differential distribution of mRNAs in hippocampal neurites: implications for neuronal functioning. Proc Natl Acad Sci USA. 1994;91:10766–10768. doi: 10.1073/pnas.91.23.10800. [DOI] [PMC free article] [PubMed] [Google Scholar]
- 37.Meador-Woodruff JH, Mansour A, Grandy DK, Damask SP, Civelli O, Watson SJ., Jr Distribution of D5 dopamine receptor mRNA in rat brain. Neurosci Lett. 1992;145:209–212. doi: 10.1016/0304-3940(92)90024-2. [DOI] [PubMed] [Google Scholar]
- 38.Monyer H, Lambolez B. Molecular biology and physiology at the single-cell level. Curr Opin Neurobiol. 1995;5:382–387. doi: 10.1016/0959-4388(95)80052-2. [DOI] [PubMed] [Google Scholar]
- 39.Mullis KB, Ferré F, Gibbs RA. Birkhäuser; Boston: 1994. The polymerase chain reaction. . [Google Scholar]
- 40.Murray AM, Hyde TM, Knable MB, Herman MM, Bigelow LB, Carter JM, Weinberger DR, Kleinman JE. Distribution of putative D4 dopamine receptors in postmortem striatum from patients with schizophrenia. J Neurosci. 1995;15:2186–2191. doi: 10.1523/JNEUROSCI.15-03-02186.1995. [DOI] [PMC free article] [PubMed] [Google Scholar]
- 41.Nemeroff CB, Bissette G. Neuropeptides, dopamine, and schizophrenia. Ann NY Acad Sci. 1988;537:273–291. doi: 10.1111/j.1749-6632.1988.tb42113.x. [DOI] [PubMed] [Google Scholar]
- 42.O’Malley KL, Harmon S, Tang L, Todd RD. The rat dopamine D4 receptor: sequence, gene structure, and demonstration of expression in the cardiovascular system. New Biol. 1992;4:137–146. [PubMed] [Google Scholar]
- 43.Penny GR, Afsharpour S, Kitai ST. The glutamate decarboxylase-, leucine enkephalin-, methionine enkephalin-, and substance P-immunoreactive neurons in the neostriatum of the rat and cat: evidence for partial overlap. Neuroscience. 1986;17:1011–1045. doi: 10.1016/0306-4522(86)90076-x. [DOI] [PubMed] [Google Scholar]
- 44.Ramakrishnan R, Fink DJ, Jiang G, Desai P, Glorioso JC, Levine M. Competitive quantitative PCR analysis of herpes simplex virus type 1 DNA and latency-associated transcript RNA in latently infected cells of the rat brain. J Virol. 1994;68:1864–1873. doi: 10.1128/jvi.68.3.1864-1873.1994. [DOI] [PMC free article] [PubMed] [Google Scholar]
- 45.Schoots O, Seeman P, Guan HC, Paterson AD, Van-Tol HH. Long-term haloperidol elevates dopamine D4 receptors by 2-fold in rats. Eur J Pharmacol. 1995;289:67–72. doi: 10.1016/0922-4106(95)90169-8. [DOI] [PubMed] [Google Scholar]
- 46.Sibley DR. Molecular biology of dopamine receptors. In: Surmeier DJ, Ariano MA, editors. Molecular and cellular mechanisms of the neostriatal function. Landes; Austin, TX: 1995. pp. 255–272. [Google Scholar]
- 47.Steward O, Banker G. Getting the message from the gene to the synapse: sorting and intracellular transport of RNA in neurons. Trends Neurosci. 1992;15:180–186. doi: 10.1016/0166-2236(92)90170-d. [DOI] [PubMed] [Google Scholar]
- 48.Surmeier DJ, Eberwine J, Wilson CJ, Stefani A, Kitai ST. Dopamine receptor subtypes colocalize in rat striatonigral neurons. Proc Natl Acad Sci USA. 1992;89:10178–10182. doi: 10.1073/pnas.89.21.10178. [DOI] [PMC free article] [PubMed] [Google Scholar]
- 49.Surmeier DJ, Reiner A, Levine MS, Ariano MA. Are neostriatal dopamine receptors colocalized? Trends Neurosci. 1993;16:299–305. doi: 10.1016/0166-2236(93)90103-s. [DOI] [PubMed] [Google Scholar]
- 50.Surmeier DJ, Bargas J, Hemmings HC, Jr, Nairn AC, Greengard P. Modulation of calcium currents by a D1 dopaminergic protein kinase/phosphatase cascade in rat neostriatal neurons. Neuron. 1995a;14:385–397. doi: 10.1016/0896-6273(95)90294-5. [DOI] [PubMed] [Google Scholar]
- 51.Surmeier DJ, Cantrell AR, Carter-Russell H. Dopaminergic and cholinergic modulation of calcium conductances in neostriatal neurons. In: Ariano MA, Surmeier DJ, editors. Molecular and cellular mechanisms of neostriatal function. Landes; Austin, TX: 1995b. pp. 193–216. [Google Scholar]
- 52.Uchimura N, Higashi H, Nishi S. Hyperpolarizing and depolarizing actions of dopamine via D1 and D2 receptors on nucleus accumbens neurons. Brain Res. 1986;375:368–372. doi: 10.1016/0006-8993(86)90760-2. [DOI] [PubMed] [Google Scholar]
- 53.Van Gelder RN, von Zastrow ME, Yool A, Dement WC, Barchas JD, Eberwine JH. Amplified RNA synthesized from limited quantities of heterogeneous cDNA. Proc Natl Acad Sci USA. 1990;87:1663–1667. doi: 10.1073/pnas.87.5.1663. [DOI] [PMC free article] [PubMed] [Google Scholar]
- 54.Vrana SL, Kluttz BW, Vrana KE. Application of quantitative RT-PCR to the analysis of dopamine receptor mRNA levels in rat striatum. Mol Brain Res. 1995;34:127–134. doi: 10.1016/0169-328x(95)00152-i. [DOI] [PubMed] [Google Scholar]
- 55.Yan Z, Surmeier DJ. Muscarinic (m2/m4) receptors reduce N- and P-type Ca2+ currents in rat neostriatal cholinergic interneurons through a fast, membrane-delimited, G-protein pathway. J Neurosci. 1996;16:2592–2604. doi: 10.1523/JNEUROSCI.16-08-02592.1996. [DOI] [PMC free article] [PubMed] [Google Scholar]