Hypersensitivity of the Anesthesia-Induced Comatose Brain (original) (raw)
Abstract
Increasing levels of anesthesia are thought to produce a progressive loss of brain responsiveness to external stimuli. Here, we present the first report of a state window within anesthesia-induced coma, usually associated with an EEG pattern of burst suppression, during which brain excitability is dramatically increased so that even subliminal stimuli elicit bursts of whole-brain activity. We investigated this phenomenon in vivo using intracellular recordings of both neurons and glia, as well as extracellular calcium and EEG recordings. The results indicate that the bursting activity elicited with mechanical microstimulations, but also with auditory and visual stimuli, is dependent on complex mechanisms, including modulation of excitatory (NMDA) components, gap junction transmission, as well as the extracellular calcium concentration. The occurrence of bursting events is associated with a postburst refractory period that underlies the genesis of the alternating burst-suppression pattern. These findings raise the issue of what burst spontaneity during anesthesia-induced coma means and opens new venues for the handling of comatose patients.
Keywords: cortical excitability, intracellular, neurons, glia, extracellular calcium, EEG
Introduction
Burst suppression (BS) activity was first described by Swank and Watson (1949). Its main feature at the EEG level consists of quasi-periodical bursts of bilateral high-voltage slow waves (mainly <15 Hz) separated by low-voltage or absent activity lasting from a few seconds to minutes (Chatrian, 1990). BS is associated with coma (Brenner, 1985) and generally develops during hypoxia (Silverman, 1975; Brenner, 1985), cardiac arrest (Zaret, 1985; Young, 2000), drug-related intoxications (Brenner, 1985; Weissenborn et al., 1991; Ostermann et al., 2000; De Rubeis and Young, 2001), childhood encephalopathies (Niedermeyer et al., 1999; Scher, 1999), hypothermia (Pagni and Courjon, 1964; Michenfelder and Milde, 1991; Nakashima et al., 1995), etc.
The neurophysiological mechanisms responsible for generating BS patterns are not fully understood. Several facts were established during EEG experiments: functional or anatomical impairment of cortical afferents leads to BS (Echlin et al., 1952; Henry and Scoville, 1952; Hughes, 1986), which corroborates with the idea that generators of bursts are localized within the cortex (Hughes, 1986). Lesions of the corpus callosum produced asymmetric BS patterns, emphasizing the role of callosal axons in synchronizing BS patterns between the hemispheres (Lambrakis et al., 1999; Lazar et al., 1999).
BS is also induced by various anesthetics among which, in clinical use, is isoflurane at concentrations of 2–4% (Newberg et al., 1983). The anesthetic effect of isoflurane can be situated at both the level of the spinal cord by blocking noxious stimulation (Antognini et al., 2000) and the level of the thalamus, in which it contributes to the loss of discrimination (Ries and Puil, 1993, 1999; Detsch et al., 1999). In slices, isoflurane reduced excitatory synaptic transmission in hippocampus (Berg-Johnsen and Langmoen, 1986; MacIver and Roth, 1988; Miu and Puil, 1989) and amygdala (Ranft et al., 2004) and increased inhibitory synaptic potentials at concentrations above 1% (Miu and Puil, 1989; Ranft et al., 2004). This could explain the neuroprotective action of volatile anesthetics and the hyperpolarization of cortical neurons, as observed in vitro (Berg-Johnsen and Langmoen, 1987, 1990) and in vivo (Steriade et al., 1994).
The way from consciousness to loss of consciousness is believed to be associated with a continuous (linear) decrease in responsiveness (for review, see Schiff and Plum, 2003). In this study, we show that this is not the case, a noteworthy exception occurring during BS.
Materials and Methods
Animal preparation.
Thirty cats (2.5–4.5 kg) of both sexes were used for these experiments. The surgical procedure started with the administration of one dose of ketamine–xylazine anesthesia (15 and 3 mg/kg, respectively), before performing tracheotomy for intubation and muscle paralysis with gallamine triethiodide. The animals were artificially ventilated (20–30 cycles/min), and the end-tidal CO2 concentration was maintained ∼3.7 ± 0.2% by adjusting the O2 concentration in the airflow of the ventilation. Starting with the tracheotomy and throughout the experiment, all incision and pressure points were infiltrated with lidocaine. After the initial dose of ketamine–xylazine, the anesthesia was switched to isoflurane (2–3%) to induce the burst-suppression pattern. In two animals, the burst-suppression pattern was induced with either propofol (continuous infusion 20–30 μl · kg−1 · min−1, i.v.) or thiopental (0.4 ml/kg, i.v.). The presence of high-amplitude slow waves in the EEG and a heart rate below 110 beats/min were continuously monitored during the whole experiment and considered to reflect a state of deep and painless anesthesia. The craniotomy exposed the suprasylvian gyrus, in which intracellular, field potential, and/or Ca2+-sensitive pipettes were lowered into the cortex. Stability of the recordings was enhanced by cisternal drainage, bilateral pneumothorax, and filling the hole in the calvarium with a 4% solution of agar. Fluid loss during the experiment was compensated for by intravenous injections of saline (20–30 ml/experiment). All chemicals used in these experiments were purchased from Sigma (St. Louis, MO). At the end of the experiments, the animals received a lethal dose of sodium pentobarbital. All experimental procedures were performed according to National Institutes of Health guiding principles and were also approved by the committee for animal care of Laval University.
Electrode preparation and recordings.
Intracellular recordings were obtained from the association areas 5 and 7 of the suprasylvian gyrus with glass micropipettes (tip diameter, <0.5 μm) filled with a 3 m solution of potassium acetate (in situ impedance, 30–75 MΩ). The EEG was recorded monopolarly with stainless steel screws in the skull (with a common silver chlorided reference in the paralyzed neck muscles) in the immediate vicinity (∼2 mm) of the cellular recordings. In a few experiments, we also tested auditory (EEG electrodes above the ectosylvian gyrus) and visual (EEG electrodes above the marginal gyrus) modalities. The EEG potentials were bandpass filtered between 0.3 Hz and 1 kHz. The Ca2+-sensitive microelectrodes were made according to the procedure described in other studies (Massimini and Amzica, 2001). We used double-barrel pipettes in which the Ca2+-sensitive electrode was pretreated with dimethylchlorosilane and dried at 120°C for 2 h, and the tip was filled with the Ca2+ ionophore I–cocktail A (Fluka, Neu-Ulm, Germany). The rest of the barrel was filled with CaCl2 (2 m), whereas the other barrel was filled with NaCl (2 m). The Ca2+-sensitive electrode was calibrated in solutions containing the following: 126 mm NaCl, 2.3 mm KCl, 26 mm NaHCO3, 1.3 mm MgSO4, 1.2 mm KH2PO4, 15 mm glucose, 5 mm HEPES, 0.4 mm thiourea, and 3% dextran 70.000, pH 7.3. The Ca2+ concentration was adjusted between 0.2 and 6 mm. The relationship between concentration and voltage was derived in accordance with the Nicolsky–Eisenmann equation (Ammann, 1986). Intracellular, ion-sensitive, and field potential signals were passed through a high-impedance amplifier with active bridge circuitry (Neurodata Instruments, New York, NY).
The time course of the response of Ca2+-sensitive microelectrodes was measured stepping the electrodes through drops containing different Ca2+ concentrations (0.2, 0.5, 1, 1.5, 2, 4, and 6 mm). The drops were held at close distance by silver rings, which were connected to the ground. Only electrodes reaching 90% of the response in <20 ms were used. Thus, the electrodes were far faster than the phenomena under investigation. Because ion potentials could be contaminated through capacitive coupling by field potentials, the latter were measured with the pair electrode and subtracted from the former. The resulting signal was linearized and transposed into concentration values using the parameters extracted from the logarithmic fitting of the calibration points. The head-stage amplifier for Ca2+-sensitive electrodes was modified with an ultra ultra low input current (<25 fA) amplifier (National Semiconductor, Santa Clara, CA). All signals were digitally converted (20 kHz sampling rate) and recorded on computer for off-line analysis.
Neuroanatomical evidence for glia was occasionally obtained by staining these cells with Neurobiotin (2%; Vector Laboratories, Burlingame, CA). The filling of glia with Neurobiotin was performed by applying depolarizing pulses (150 ms at 3.3 Hz) of 1–2 nA for 5–15 min. At the end of the experiments in which Neurobiotin was used, the deeply anesthetized cats were perfused transcardially with saline followed by 10% paraformaldehyde. The brain was removed and stored in Formalin with 30% sucrose for 2–3 d, and then it was sectioned at 50 μm and processed with the avidin–biotin standard kit (ABC standard kit; Vector Laboratories): the sections were incubated overnight at room temperature in the avidin–biotin–horseradish peroxidase complex solution at a dilution of 1:200 and 0.5% Triton X-100.
Stimulation.
The mechanical stimuli that elicited the responses reported in this study were generated by a spare remote-controlled stepping device (Kopf 662; David Kopf Instruments, Tujunga, CA), normally used for lowering the intracellular pipettes during the cellular impaling procedure. The stepping device was mounted on the stereotaxical frame but did not carry any electrode and did not touch the animal. Each stimulus consisted of a brisk step of 1 μm and lasting for 250 μs. This stimulus was subliminal for the experimenters hearing and was most probably transposed onto the animal's perception as a short vibration through the stereotaxical frame and ear fixation bars. As micromechanical stimulation, it was considered to be subliminal because it was not sufficient to compromise the intracellular impalements performed during these experiments.
Auditory stimuli were delivered through a loudspeaker situated at 1 m from the animal's ear. It consisted of a short (50 ms) tone with a pure frequency of 20 kHz and an intensity of 30 dB measured on a sound level meter (Brüel & Kjær, Norcross, GA) at 1 m from the source. Visual stimuli consisted of a short (50 ms) light flash conveyed to the eye by a green light emitting diode (LED) situated at 10 mm in front of the cat's eye. The intensity of the stimulus had a luminous intensity of 20 mcd, equivalent to 8 lux.
Analysis.
The core of our analysis was performed with software from WaveMetrics (Lake Oswego, OR) and relies on time relationships between the recorded voltage (concentration) time series. Most of the results are presented as stimulus-triggered averages (evoked potentials). They were obtained after extracting from the intracellular or extracellular field/EEG potential sweeps synchronized with the triggering stimulus. The duration of an EEG burst was measured between the moments at which the EEG potential deflected for the first and last time, respectively, with more than 1 SD from the isoelectric line preceding the onset of a stimulus. The SD was calculated over a period of 1 s. Statistical analysis was calculated with XLSTAT.
Results
Database
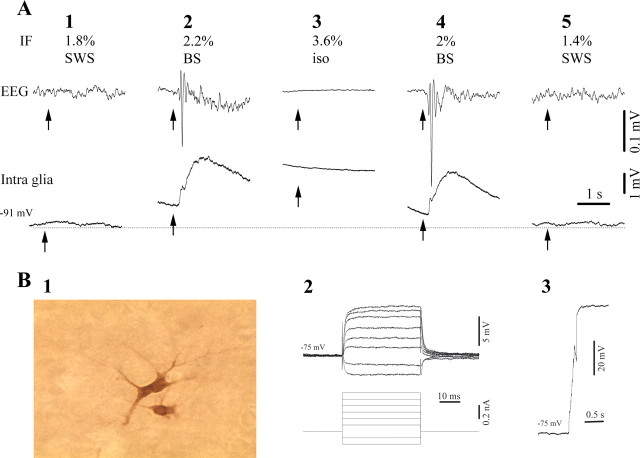
Experiments were performed on 30 cats, and a total of 46 intracellular neurons and 19 glial cells were recorded. Quality criteria for intraneuronal impalements were as follows: stable membrane potentials more negative than −60 mV without holding current and overshooting action potentials. We retained only glial cells with a stable membrane potential more negative than −70 mV and without action potentials on impalement, imposed depolarizing pulses or at the withdrawing from the cell (see Fig. 3B3). A few glial cells (n = 6) were filled with Neurobiotin and retrieved after experiments for morphological confirmation. They displayed astrocytic shapes, and, in one case (see Fig. 3B1), a double staining was obtained. All glial recordings displayed stable membrane potentials for the whole period of recording, which, for the need of the present experimental protocol, had to last at least 50 min. The values of the membrane potential, time constants (calculated from the charging curves), and input resistance are presented in Table 1.
Figure 3.
Glial behavior and neuroanatomical characterization. A, Intracellular responses of a cortical glia during various concentrations of isoflurane (IF) anesthesia. Each panel represents an averaged response to 100 stimuli. Note the absence of responses during SWS patterns (A1, A5) and isoelectric line (A3). B1, Glial reconstruction after filling with Neurobiotin displays astrocytic shapes with ramifying processes. Only one glia was recorded at this location (cortical depth, 0.9 mm), but two cells were filled. Only glial cells were impaled and kept during this experiment. B2, Responses of the glia in 1 to depolarizing and hyperpolarizing pulses. B3, Withdrawal of the recording electrode from the same glial cell showing transmembrane potential and absence of action potential discharges.
Table 1.
Values of membrane potential (before/after induction of BS; if only one value is given, it corresponds to the SWS recording), as well as time constants and input resistance measured immediately after impalement
| Mean | SD | Minimum | Maximum | |
|---|---|---|---|---|
| Neurons (n = 46) | ||||
| Vm(mV) | −73.2/−82.4 | 3.1/3.9 | −88 | −60 |
| TC (ms) | 4.32 | 0.3 | 2.4 | 5.6 |
| _R_IN (MΩ) | 22.8 | 5.8 | 15.7 | 26 |
| Glia (n = 19) | ||||
| Vm(mV) | −88.6/−84.7 | 3/2.4 | −99 | −75 |
| TC (ms) | 0.173 | 0.04 | 0.12 | 0.21 |
| _R_IN (MΩ) | 10.2 | 2.4 | 5.4 | 14.5 |
Patterns
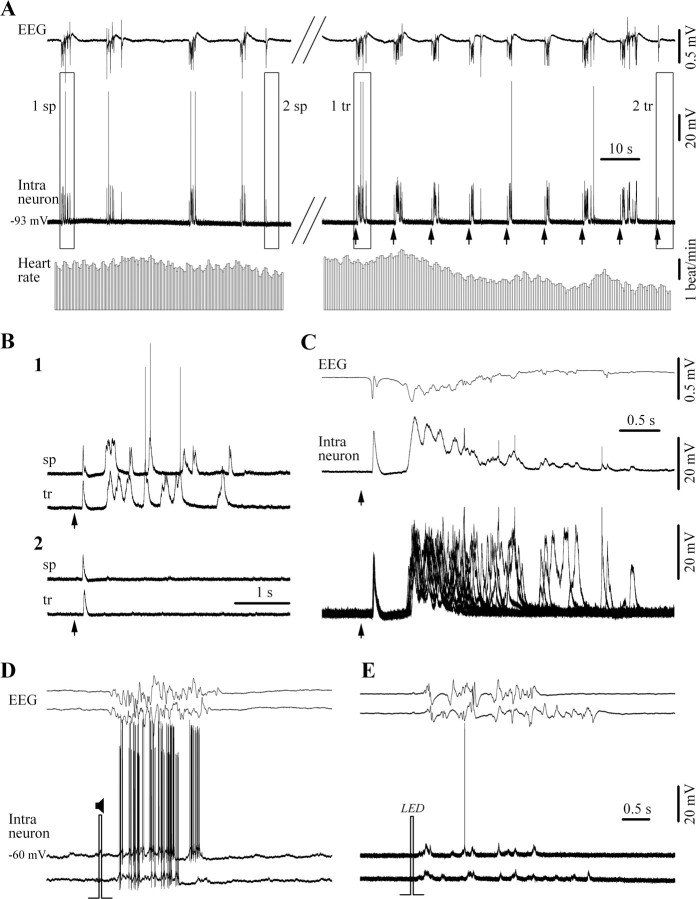
The main finding of this study is that the brain becomes reactive to subliminal stimuli in a state of deep anesthesia induced by various anesthetics (isoflurane, barbiturates, and propofol) associated with an electroencephalographic pattern of BS. These stimuli do not provoke any overt responses in states of lighter or deeper anesthesia. BS was obtained with higher doses of anesthetic (in the case of isoflurane, >2%), and its patterns, in accordance with previous descriptions, were characterized at the EEG level by alternating periods of (1) bursts of high-amplitude and low-frequency (<15 Hz) waves, and (2) isoelectric EEG. During the former components, neurons displayed depolarizing potentials, whereas a flat, hyperpolarized membrane potential was recorded during the latter phase (Fig. 1). Interestingly, the cortical neuronal activity within bursts bore the features of the slow-wave patterns recorded under lower doses of anesthesia (see below). Thus, the BS pattern appears as an alternation between periods with slow-wave activities and periods with silent cortical activities.
Figure 1.
Intraneuronal and electroencephalographic structure of spontaneous (left) and triggered (right) bursts during BS patterns. A, Arrows indicate the moments at which micromechanical stimuli were delivered. Below, Variation of the heart rate during the recording shows no consistent relationship to the stimuli. Two spontaneous (sp) and two triggered (tr) events within rectangles are expanded in B to show a full burst after a single excitatory event (B1) and a single response (B2). C, Averaged (first 2 traces) and superimposed (n = 11; below) responses. Note the stereotyped initial excitatory component in all responses, followed by precise onset of the burst. D, Cortical neuron and EEG responding to auditory stimuli with full-blown bursts. The two traces are artificially offset. E, Another cortical neuron and EEG responding to low-intensity light flashes (LED). In this and following figures, all signals are represented with positivity upwards, and arrows indicate the moment of micromechanical stimulation.
In all animals, micromechanical stimuli elicited responses that had all the features of the spontaneous bursts (Fig. 1). The comparison relied on the following parameters: duration, amplitude, and dominant spectral feature of the evoked versus spontaneous bursts. The average ± SD duration of spontaneous bursts was 2.05 ± 0.52 s, whereas it was 2.1 ± 0.6 s for triggered bursts, with no significant difference between the series of individual values (signed-rank Wilcoxon's test, p = 0.4; n = 30). The amplitude values were 1.2 ± 0.3 and 0.98 ± 0.16 mV for spontaneous and triggered bursts, respectively, and no significant difference was found (signed-rank Wilcoxon's test, p = 0.07; n = 30). Dominant frequencies within bursts were 1.51 ± 1.7 and 1.85 ± 1.6 Hz for spontaneous and triggered bursts, respectively. The rows of values were not significantly different (signed-rank Wilcoxon's test, p = 0.28; n = 30). Both spontaneous and triggered bursts were not timely related with any changes in the heart rate (Fig. 1A).
In the majority of cases (80.4%, n = 37 neurons of the 46 recorded), the intracellular responses consisted of an initial excitatory component followed by a short period of membrane repolarization and a sustained sequence of depolarizing events, constituting the actual burst (Fig. 1B1,C). Occasionally, responses consisted of only the initial excitatory response (Fig. 1B2), probably in relation to the refractory period (see below). These components were always paralleled by phasic events in the EEG (Fig. 1C). In the rest of the cases (19.6%), responses to micromechanical stimulations consisted only of bursting components, without a clear separation between initial and later excitatory components (Fig. 2C). Similar to micromechanical stimuli, in five animals we also tested auditory and visual stimulations and showed that they were also able to induce bursting responses during isoflurane-induced BS (Fig. 1D,E).
Figure 2.
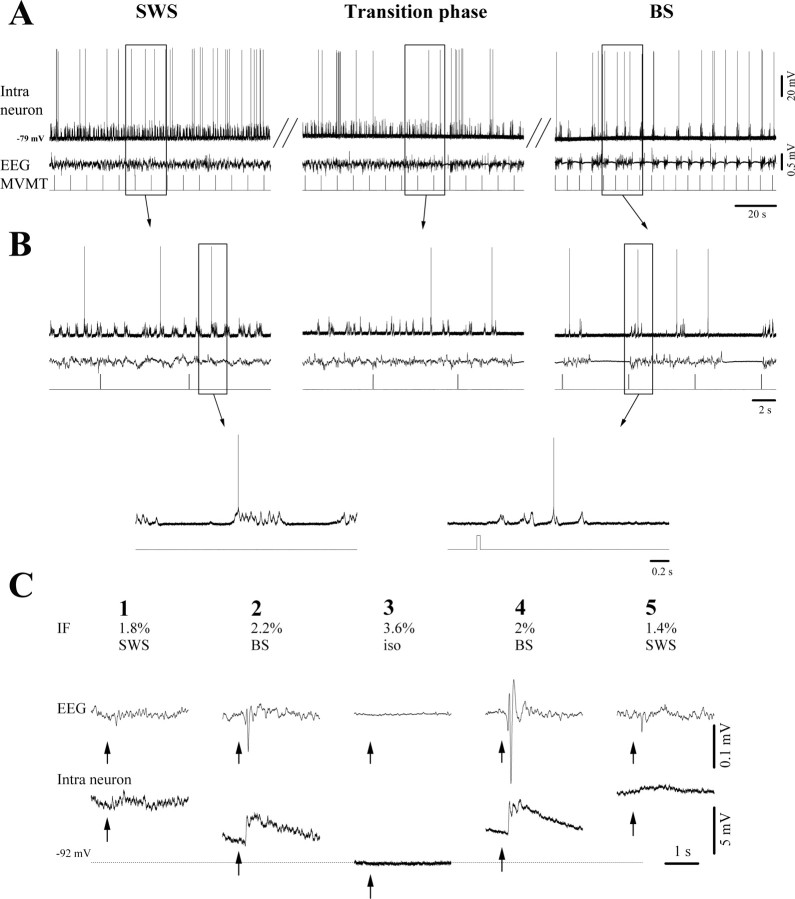
Selective responsiveness of cortical neurons during various behavioral states. A, Same neuron recorded in cortical area 5 during light anesthesia (1.5% isoflurane; left) and after increased isoflurane (3%; middle and right). Light anesthesia displays continuous slow (∼1 Hz) oscillations similar to SWS and no responsiveness to mechanical microstimuli (MVMT). The transition phase is also devoid of responsiveness, despite the progressive appearance of suppression episodes. Only full-blown BS (right) is associated with reliable responses to stimuli. B, Expanded episodes marked with rectangles in A. Note that a stimulus delivered during a burst does not elicit any overt response. Periods with rectangles in B are further expanded below. C, Cortical averaged responses (n = 100) of an intraneuronal recording together with the simultaneously recorded EEG during various depths of anesthesia. The concentrations of applied isoflurane (IF), indicated above, led to distinct patterns of SWS, BS, and isoelectric EEG line (iso). The recordings were kept stable during the whole cycle.
Micromechanical stimulations were successful in inducing bursting responses only within a narrow window of the isoflurane anesthesia that was associated with the maintenance of the BS pattern (Figs. 2, 3). Lower doses (1–2% isoflurane), sufficient for painless surgical procedures, produced a pattern of continuous sleep-like slow waves (Fig. 2A, SWS) (see also Fig. 4A) that was similar to the one described both under various anesthetics (Steriade et al., 1993; Amzica and Steriade, 1995; Contreras and Steriade, 1995) and during natural slow-wave sleep (SWS) (Steriade et al., 1993, 2001). During this state, the membrane potential of neurons basically oscillated between hyperpolarized and depolarized levels with a frequency of ∼1 Hz.
Figure 4.
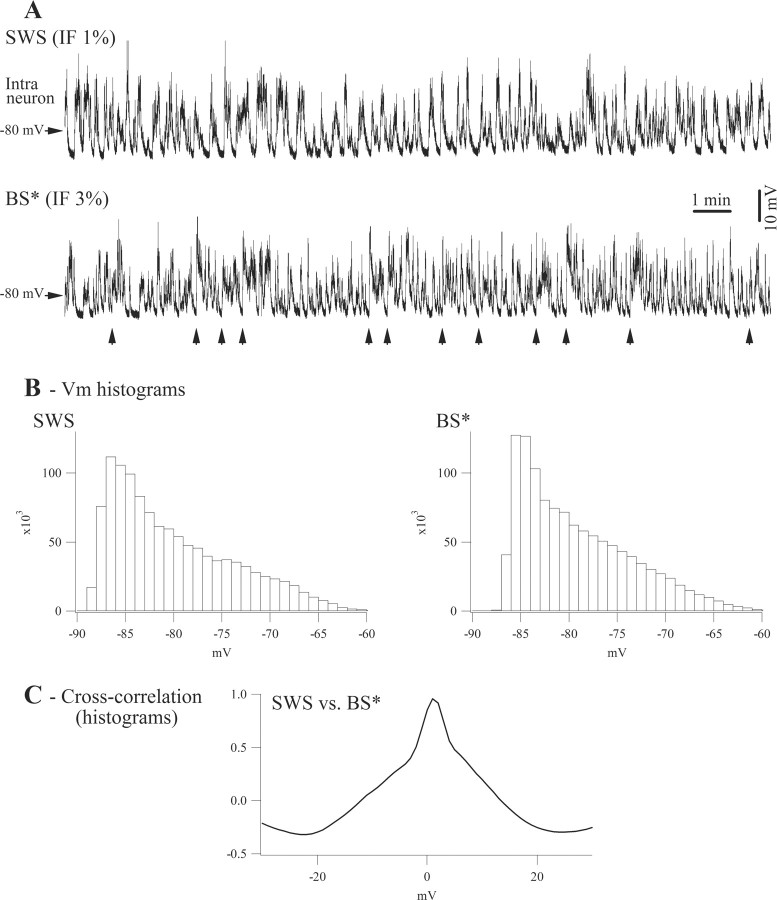
Comparison of continuous SWS patterns with bursting activities during BS. A, The trace above represents 20 min of slow oscillations during light anesthesia [1.7% isoflurane (IF)], whereas the trace below (BS*), of equivalent duration, was recorded under high isoflurane (3%) and resulted from artificial elimination of all suppression episodes. Vertical arrows mark the moments at which suppression episodes occurred. B, Histograms (bin width, 1 mV) of the respective membrane potential signals in A. C, Cross-correlation between the histograms depicted in B showing high correlation peak (98%).
The increase of anesthesia (>2% isoflurane) produced, after a transitory period (Fig. 2A, middle), a stable pattern of BS (Fig. 2A, right). The SWS pattern was not associated with overt responses in either neurons (Fig. 2C1,C5) or glia (Fig. 3A1,A5). Similarly, no responses could be triggered during very deep anesthesia (isoflurane doses of >3.5%) that were inducing a state of continuous isoelectric EEG (Figs. 2C3 for neurons, 3A3 for glia). This result was verified in all experiments (n = 30) by challenging each animal with at least 50 micromechanical stimulations before, during, and beyond the BS state. It suggests that the pattern of BS is the only state during which the responsiveness to these micromechanical stimuli is preserved.
The issue was raised whether the burst responses elicited during the hyperexcitable state of BS were similar in nature to the spontaneous, cyclic depolarizing phases of the slow oscillations present during lighter anesthesia. A first indication that they were of different nature was suggested by the fact that our stimulation was unable to trigger such responses during the slow oscillation. We further verified the neuronal membrane potential distribution during the spontaneous slow oscillation under light anesthesia (1–2%) and the membrane potential distribution during the bursting activity of BS (Fig. 4). For this purpose, we artificially eliminated all suppression epochs and obtained a signal with continuous bursting activities (Fig. 4A, BS*). The comparison was performed in a total of 10 intraneuronal recordings by using signals of equal durations (at least 20 min for each state). It shows that the membrane potential distribution was strikingly similar between SWS and BS* (Fig. 4B), with an average correlation factor between histograms of 95% (Fig. 4C). This lends additional support to the fact that bursts during BS, evoked or spontaneous, are not the equivalent of depolarizing phases of the slow oscillation. Furthermore, it shows that a burst of BS is made of several cycles of the slow oscillation, in other words, of depolarizing and hyperpolarizing phases of the slow oscillation (see Discussion).
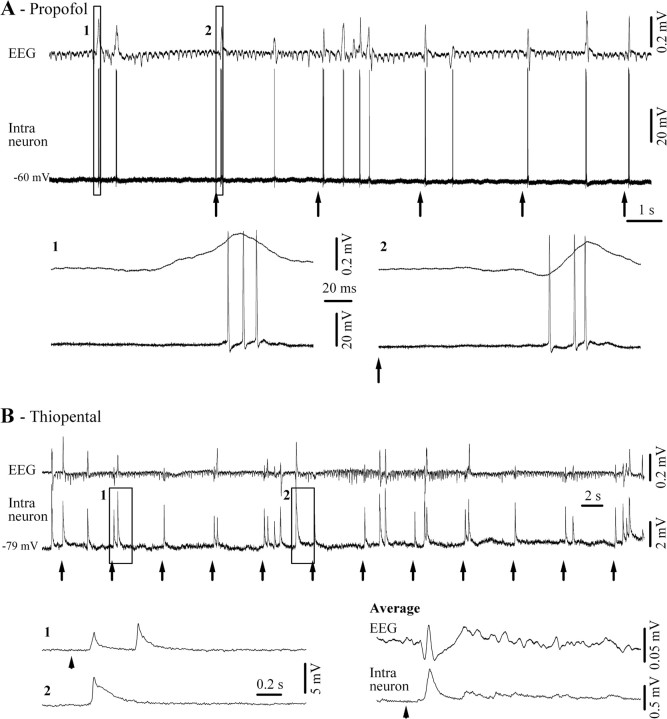
The property of the cortical networks to respond to such stimulations was not dependent on the use of isoflurane anesthesia. Two animals were anesthetized with propofol and thiopental up to the induction of BS. In both cases, micromechanical stimulation induced bursting activity similar to the spontaneous one (Fig. 5). During the periods between bursts, the EEG of animals anesthetized with propofol or thiopental displayed low-amplitude rhythmic activities. These potentials were not paralleled by any phasic events in the intracellular cortical recordings, suggesting that the dipole(s) generating them were not located within the cortex. This point is further supported by a previous report (Steriade et al., 1994) mentioning that a subpopulation of thalamocortical neurons is rhythmically oscillating during the suppressed epochs.
Figure 5.
Micromechanical stimulation also elicited bursts during BS induced with other types of anesthetics. A, Intraneuronal recording in association cortical areas 5–7 together with nearby EEG during propofol-induced BS. The epochs within rectangles are expanded below to compare a spontaneous burst (A1) with a mechanically triggered burst (A2). B, Intracellular recording in cortical area 7 during BS under thiopental. Periods within rectangles are detailed below to show a spontaneous (B1) and triggered (B2) burst. The bottom right displays the averaged responses to micromechanical stimulation (n = 100).
Refractory period
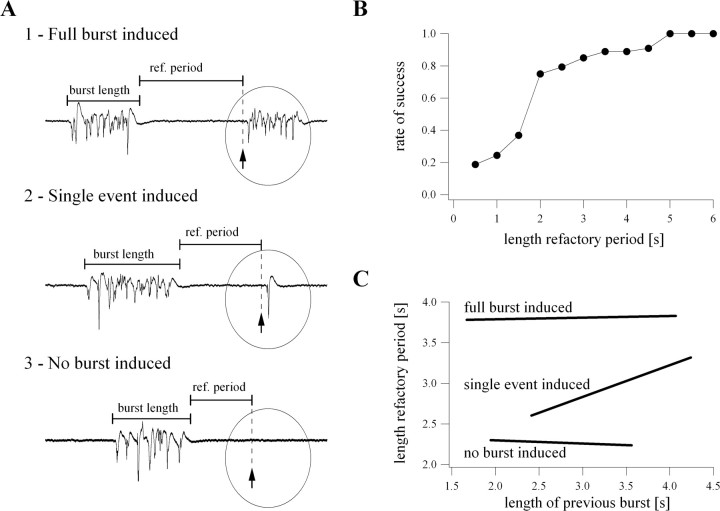
The ability to elicit micromechanically induced responses during BS was dependent on the duration of the silent period preceding the delivery of the stimulus, suggesting the presence of a refractory period. Experiments confirmed that, indeed, the genesis of a burst is followed by a period of refractoriness during which the network is unable or poorly able to generate another burst. The proof for this hypothesis was achieved by delivering micromechanical stimuli at variable delays (0.5–6 s in increments of 0.5 s) from the end of a spontaneous or triggered burst (Fig. 6). At least 25 stimuli were delivered for each delay value. Three situations were encountered: (1) a full-blown burst was generated (Fig. 6A1), (2) the response consisted of only one single event (Fig. 6A2), and (3) no response was observed (Fig. 6A3).
Figure 6.
Refractoriness of the micromechanically induced bursts. A, Testing procedure of the refractoriness. The two tested parameters were the length of the spontaneous burst and the timespan between the end of this burst and the delivery of the micromechanical stimulation. Three situations could appear: full burst induced (A1), single burst induced (A2), or no response (A3). B, Rate of success in eliciting bursts as a function of the refractory period. Grand averages from two animals, each animal undergoing at least 20 trials for each refractory period tested. Bin width was 0.5 s. The scoring system was as follows: 1 if a full burst was elicited, 0.5 in the case of a single event, and 0 if no response was obtained. C, Relationship between the length of the refractory period and the duration of the preceding burst as reflected by linear fits of the pooled data from two animals. Note that full bursts and failures were independent of the length of the previous burst, whereas the refractory period was linearly related to the length of the preceding burst in the case of single events.
The quantification of the refractory period relied on experiments performed on two animals. Through a scoring system, we awarded 1 for a full burst, 0.5 for a single response, and 0 for no response (Fig. 6A). For each animal, an average of these values was calculated and then the average of the two animals was displayed (Fig. 6). The success rate in triggering a response followed a sigmoidal law (Fig. 6B) with virtually no failure in inducing full-blown bursts in cases in which the delay exceeded 3.5 s. The equation of the sigmoidal law was as follows:
where x represents the length of the refractory period in seconds, and the goodness of the fit was 0.03.
The dependence of the refractory period on the length of the preceding burst followed either one of the two rules (Fig. 6C). (1) The refractory period for full bursts showed little dependence (correlation coefficient of 6%) on the duration of the previous burst; similarly, the timespan during which no bursts could be elicited was not correlated (4%) with the duration of the preceding burst. (2) Conversely, the refractory period for the generation of single events was proportional (correlation coefficient of 69%) to the duration of the preceding burst.
Overall, the relationship between refractory period and duration of the preceding burst suggests the existence of an absolute refractory period within the first 2.5 s after the end of the preceding burst, followed by a relative refractoriness (2.5–3.5 s). At this point, the question arises what mechanism underlies the presence of a refractory period. Neurons during BS were capable of discharging action potentials triggered by intracellularly imposed depolarizing current pulses regardless of whether they were challenged during silent or bursting epochs (data not shown). This suggests that the refractory period might not rely on the impairment of the intrinsic membrane properties but rather on changes in the ability of the network to support intercellular communication. We thus tested the hypothesis that the refractoriness might result from a disfacilitation process.
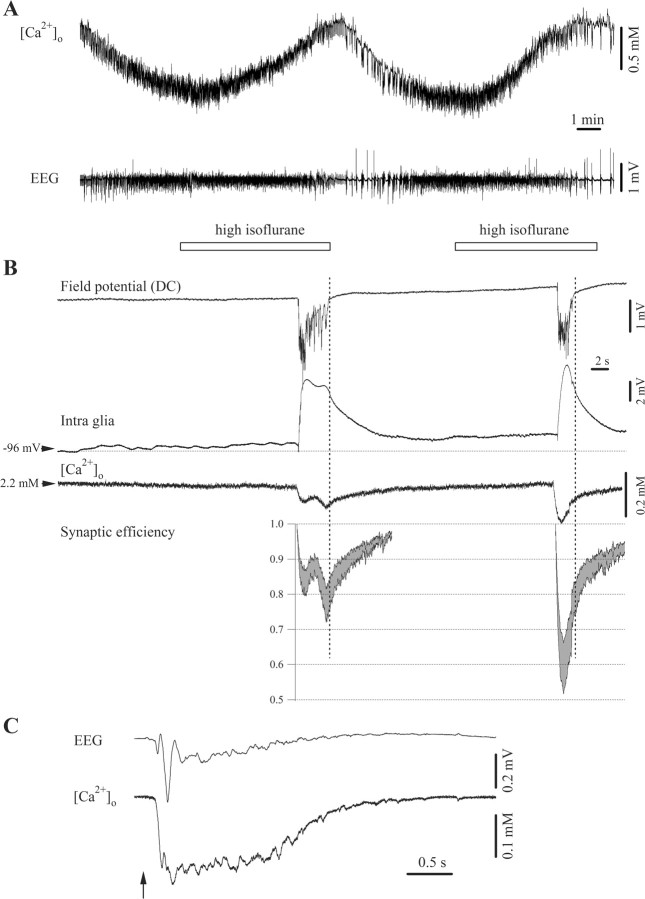
Starting from the assumption that extracellular Ca2+ is a critical element in supporting and generating synaptic events (Dodge and Rahamimoff, 1967; Katz and Miledi, 1970; Bootman and Berridge, 1995; Mintz et al., 1995; Qian et al., 1997), we measured its extracellular concentration with Ca2+-sensitive probes during BS patterns. A first finding consisted of an overall increase of the extracellular Ca2+ concentration during the induction of BS with high (3%) isoflurane anesthesia (Fig. 7A). This was a consistent finding in the two tested animals, each of them undergoing five cycles of BS induction. The average increase of extracellular Ca2+ in the cortex was of 0.9 mm measured at the moment when isoflurane was switched back to basic anesthesia (1–2%). Interestingly, the increase in extracellular Ca2+ was more associated with the levels of isoflurane than with the state of the brain such as reflected in the EEG (Fig. 7A). Indeed, shortly after diminishing the concentration of isoflurane, the extracellular Ca2+ concentration started to decline, whereas the EEG still displayed a state of BS. This overall increase in baseline Ca2+ could constitute the primary factor triggering the cortical hyperexcitability during BS.
Figure 7.
Calcium dynamics during BS. A, Extracellular Ca2+ concentration ([Ca2+]o) and EEG recordings during successive BS episodes. Every application of high (3%) doses of isoflurane led to increased [Ca2+]o. B, Intraglial and [Ca2+]o recordings during spontaneous BS showing phasic drops in extracellular Ca2+ during bursts and gradual return to control levels during suppression. Bottom, Estimations of the synaptic efficiency during bursts. DC, Direct current. C, Averaged (n = 100) responses to mechanical microstimulation (arrow) of the [Ca2+]o and EEG showing similar Ca2+ drops as during spontaneous bursts.
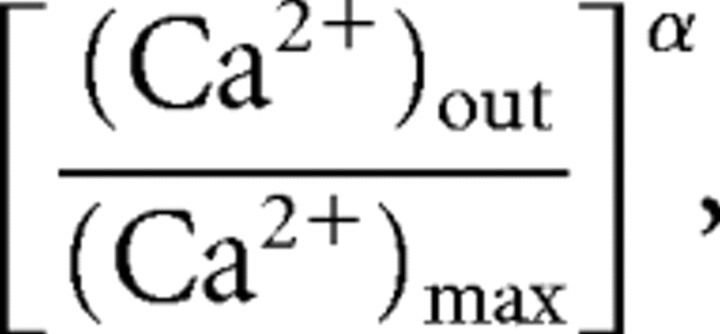
Extracellular Ca2+ variations were also recorded in relation to phasic events such as bursts, both spontaneous and triggered. In all cases (experiments performed in eight animals, at least 50 spontaneous cycles of BS or 50 stimuli in each animal), bursting activity was associated with a drop of the extracellular Ca2+ concentration (Fig. 7B,C) followed by a slow return. The grand average of the peak Ca2+ depletion was of 0.27 ± 0.09 mm (range of 0.08–0.35 mm) during spontaneous bursts and 0.22 ± 0.07 mm (range of 0.06–0.28 mm) during stimulation. No statistical difference could be established between these values (p = 0.055, Mann–Whitney test). In accordance with in vitro studies, the transmitter release probability was estimated as a power function of the percentage variation of the extracellular Ca2+ variation with respect to its maximum concentration previous to the onset of the burst:
where α assumed one of the two extreme values 2.5 (Mintz et al., 1995) or 4 (Qian et al., 1997). Thus, the release probability was safely contained within the gray area of Figure 7B. The extracellular Ca2+ depletion during bursting translated under these conditions into a diminished synaptic efficiency of 28–49% (grand average values of superior and inferior limits). These values reflect the lowest Ca2+ concentrations reached during a burst. Furthermore, as indicated by the vertical dotted lines in Figure 7B, the end of a burst always preceded the return of extracellular Ca2+ concentrations to control values, suggesting that consecutive to the arrest of bursts the network was still in a state of disfacilitation during which external stimuli (e.g., our microstimulation) were unable to elicit responses.
Mechanisms
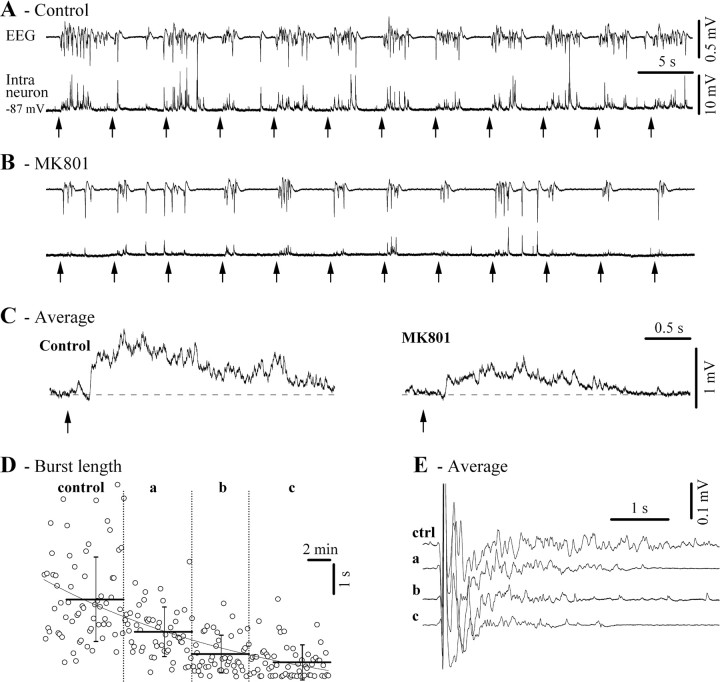
The duration, amplitude, and shape of the bursts evoked by microstimulation were dependent on NMDA receptors. Systemic application of the NMDA antagonist MK801 [(+)-5-methyl-10,11-dihydro-5_H_-dibenzo [a,d] cyclohepten-5,10-imine maleate] did not affect the success rate in eliciting responses (Fig. 8, compare a, b). However, the amplitude of the burst response was diminished by 43% (Fig. 8C). The evaluation was performed in two animals for a total of eight recordings, each recording producing an average of the type displayed in Figure 8C. The duration of the burst was also reduced in a dose-dependent manner: 1 mg/kg of MK801 reduced the average duration of a burst from 3.22 ± 1.68 to 2.11 ± 0.96 s, corresponding to an overall drop of 34%. Successive applications of similar doses (1 mg/kg) of MK801 further reduced the duration of the length of the evoked burst (Fig. 8D). The evolution of these values followed an exponential decrement with a time constant of 950.2 s. The average EEG bursts elicited during successive applications of MK801 are displayed in Figure 8E.
Figure 8.
Blockage of NMDA receptors impairs the amplitude and duration of bursts elicited by micromechanical stimulations. A, Cortical intracellular and EEG control recording during which micromechanical stimulations (arrows) reliably elicited bursts under isoflurane-induced BS. B, The NMDA antagonist MK801 reduced both burst duration and amplitude but did not prevent responsiveness. The neuron was kept at the same membrane potential as during the control period by intracellular current injection to avoid voltage-dependent phenomena. C, Averaged responses (n = 50) to micromechanical stimulation before (left) and after (right) MK801 application. D, Dynamic evolution of the length of the evoked bursts during successive applications of MK801 at the beginning of the periods marked with vertical dotted lines. Open circles represent individual values, horizontal lines are average values over the period covered by the line, and vertical lines indicate SD. The _x_-axis represents the actual time during the experiment. E, Averaged responses during periods of control (ctrl) and with successive application of MK801 (a–c) as indicated in D.
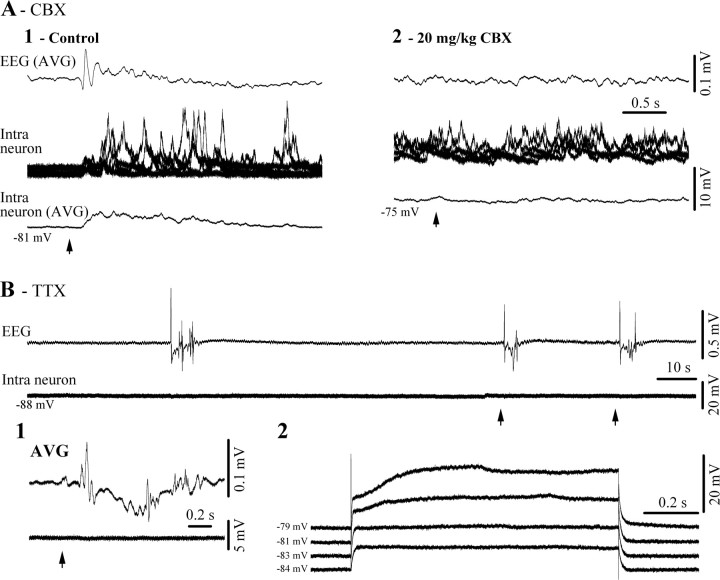
Taking into consideration the generally long latencies of the bursting responses to micromechanical stimulation (∼90 ms), which are significantly higher than those expected from the quick transmission through the trigeminal-thalamo-cortical pathway (<10 ms), we hypothesized that the stimulation transmission might use a nonsynaptic pathway, possibly across the syncytium of gap junctions between glial cells. The systemic application of the gap junction blocker carbenoxolone (CBX) (20 mg/kg, i.v.) completely abolished the micromechanical induced responses (Fig. 9A). This situation was verified in all three animals that were tested. Thus, a functional gap junction syncytium appears as a prerequisite for the expression of cortical responses during BS.
Figure 9.
Pharmacological manipulation of the micromechanically induced bursts. A, Blockage of the responses to micromechanical stimulation with the gap junction blocker CBX (20 mg/kg). Control responsiveness (A1) and absent responses after CBX (A2) as recorded in individual responses (superimposed traces) and averaged (AVG; n = 50). B, Topic application of TTX blocked all spontaneous or triggered intraneuronal potentials. EEG recorded outside the area inactivated with TTX. B1, Averaged activities. B2, Depolarizing pulses applied to the neuron to demonstrate the ability of the neuron to generate active responses, presumably calcium spikes.
The production of micromechanical responses was also dependent on neuronal intercommunication. Topical application of the action potential blocker tetrodotoxin (TTX) (0.25 mm) on the cortex locally prevented responsiveness but did not affect either spontaneous or triggered bursts outside the inactivated area (Fig. 9B). Neurons recorded under TTX (n = 5) displayed a flat hyperpolarized membrane potential with no phasic events related to the EEG evoked potential. The integrity of the impaled neuron was verified with intracellular depolarizing pulses (Fig. 9B2) delivered at various imposed membrane potentials. Although such pulses were unable to evoke action potentials attributable to the presence of TTX, they were able to generate active responses, presumably high-threshold Ca2+ spikes, at depolarized membrane potentials (Fig. 9B2).
Discussion
This study reports for the first time the existence of a state of cortical somatosensory hyperexcitability during deep anesthesia usually associated with an EEG pattern of BS. This finding raises numerous issues related to the handling of patients reaching this state as a consequence of anesthesia-induced coma. Despite the fact that other comas with different etiologies (e.g., various encephalopathies) share similar BS patterns with the ones presented in this study, suggesting the involvement of common pathways of generation, additional investigations are necessary to ascertain whether such types of coma display the same hypersensitivity.
The burst responses could be evoked by a variety of stimuli (auditory, visual, and somatosensory). We chose to emphasize, however, a type of stimulus that was clearly, in both amplitude and duration, subthreshold. The stimulus was conveyed to the skull through the ear bars of the stereotaxical frame. Although ill defined, the nature of these stimuli contains several advantages. First, as a mechanical stimulation, it is of extremely reduced amplitude because it does not produce the loss of the intracellular impalement (cells with a diameter of ∼10 μm). Second, the duration of the stimulus is extremely confined in time (250 μs), which confers the advantage of a precise triggering timing and precludes overlapping on–off effects in the response.
The fact that bursting responses can be evoked during BS is not completely new. Yli-Hankala et al. (1993) have used vibration stimuli (3 s duration) applied to the hand of patients under isoflurane anesthesia. They elicited EEG bursts with a latency of ∼0.5 s that were associated with increased heart rate and had different features from the spontaneous bursts. They concluded that their evoked bursts were dependent on the autonomic reactions triggered by the stimulus.
At difference with that study, our results emphasize the lack of involvement of the autonomous nervous system because no related heart rate variations were recorded in response to the stimulation. Moreover, bursts were evoked under various anesthetics, some of them being vasodilators [isoflurane (Sakabe and Nakakimura, 1994)] and others vasoconstrictors [barbiturates (Tsuji and Chiba, 1987)], suggesting that at least the vasomotricity did not influence the generation of bursts.
In a recent study dedicated to the mechanisms of slow sleep oscillations, the in vitro thalamocortical slice was shown to be able to produce spontaneous alternating Up and Down states (Rigas and Castro-Alamancos, 2007). Because of the essentially disconnected nature of this preparation, its activity resembles very much that of the BS patterns mentioned in the comatose brain successive to deafferentation (Echlin et al., 1952; Henry and Scoville, 1952; Hughes, 1986). Thus, the bursts elicited in our study might very well be essentially similar in nature to those of the above mentioned study. However, we emphasize that, during various behavioral states, the so-called “Up states” may reflect distinct realities and result from different mechanisms. As an example, a single burst during in vivo BS is made of a sequence of several Up and Down states similar in nature to the continuous slowly oscillating pattern present during SWS (Fig. 4). Moreover, bursts during BS are dissimilar from depolarizing periods (Up states) of the slow sleep oscillation because, in contrast to the former, the latter could not be elicited with microstimulation.
Thus, we established the presence of a relatively narrow state window associated with BS during which somatosensory stimulation elicits bursts in the brain. Outside this state (at more superficial or at deeper levels of anesthesia), no overt responses could be detected, which is not to say that the brain is unresponsive, but rather that microstimuli of the kind used in this study were unable to elicit responses. This further supports the claim that the state of BS is a state of hyperexcitability. The onset of this state window is prefigured by a progressive increase in the extracellular Ca2+ concentrations that may, on the one hand, transiently enhance cortical synaptic processes, and, on the other hand, reduce spontaneous firing of neurons through enhanced screening of Na+ channels (Hille, 2001), thus contributing to the gradual onset of suppression episodes. Moreover, the fact that the global trend of Ca2+ rather followed the levels of isoflurane than the BS state itself suggests that other phenomena, in need of additional investigation, are at work in modulating the excitability of the cortical network.
The refractoriness of the bursts was most likely related to the phasic extracellular Ca2+ depletion and could be explained by the phasic drop in synaptic efficiency. As such, the refractoriness would result from a process of disfacilitation, similar to the one described in the case of the slow (<1 Hz) slow-wave sleep oscillation (Massimini and Amzica, 2001). Bursting activity is accompanied by neuronal synaptic activity, especially NMDA, and discharges of action potentials (Steriade et al., 1994) (also present data), which in turn would increase Ca2+ influx into cells. Whether this input occurs at the presynaptic or postsynaptic level is difficult to determine in vivo. However, a series of studies suggest the preponderance of the postsynaptic uptake (Heinemann and Pumain, 1981; Bollmann et al., 1998; Borst and Sakmann, 1999; Rusakov et al., 1999; King et al., 2000). If this is also the case during BS, it would imply that the arrest of the bursting activity results from the progressive drop in the synaptic transmission during the bursting phase. Once the neuronal activity has ceased, ATP pumps may restore the extracellular Ca2+ concentration to control values. The dynamics of the extracellular Ca2+ return to control levels, if within the same order of magnitude with the duration of the refractory period, would support the idea that the generation of a new burst is possible only after the synaptic efficiency has crossed a threshold.
The neuroprotective features of all anesthetic agents used in this study rely, among others, on a dose-dependent diminution of the cerebral metabolic rate (Sakabe and Nakakimura, 1994). It is thus safe to consider that ATP reserves should not be affected during BS and are unlikely to play a role in influencing the duration of the refractory period. This aspect requires, however, additional verification.
The intraglial recordings presented in this paper are for the first time disclosing the following two aspects. First, the bursting activity is associated with phasic depolarizing potentials, as expected considering the intense neuronal activity displayed during bursts. Because the glial membrane potential is intimately related to the extracellular K+ concentration (Kuffler and Nicholls, 1964; Kuffler et al., 1966; Somjen, 1979; Ballanyi et al., 1987; Amzica et al., 2002), this depolarization probably reflects increased extracellular K+. Second, the progression of depth of anesthesia from sleep-like patterns to an isoelectric line was associated with a continuous depolarization of the glial membrane potential by ∼3 mV. This depolarization reflects, according to the Nernst equation, an increase of ∼0.5 mm of the extracellular K+ concentration. Assuming that the intracellular K+ concentration amounts to 125 mm (Somjen, 2004) and taking into calculation a membrane potential of −90 mV, one obtains an extracellular K+ variation from 4 to 4.5 mm. The latter value corresponds to the point at which the overall neuronal excitability switches from facilitated to impaired excitability (Kocsis et al., 1983).
The burst itself was significantly reduced in duration and amplitude by blocking NMDA receptors, despite the fact that bursting occurred at quite hyperpolarized membrane potentials. This apparent incongruity might be explained by the remote location of the NMDA receptors with respect to the somatic site in which the presumed impalement of our neurons occurred. Indeed, NMDA receptors are only found at low densities on the extrasynaptic plasma membranes of the somata, dendritic shafts, and spines and never in membrane specializations that are postsynaptic to GABAergic terminals (Nusser, 2000).
As reported previously, BS is characterized by wide synchronization of neuronal activities (Steriade et al., 1994; Lambrakis et al., 1999; Lazar et al., 1999). The substrate of this synchronization was always supposed to rely on neuronal transmission, and the abolition of evoked responses by TTX gives additional support to this claim. Noteworthy, a similar effect was obtained by closing gap junctions, presumably within the glial syncytium, which opens the discussion for the implication of the glial cells in the spreading of bursting activity. The glial network was demonstrated to underlie the spatial buffering of K+ (Orkand et al., 1966; Walz, 1989; Newman, 1995), and this appears to be at work during various states of the brain, such as sleep and epileptic discharges (Amzica et al., 2002). However, endowing at this point the glial syncytium with the responsibility of spreading bursting activity during BS might be hasty because, on the one hand, CBX is a broad-spectrum gap junction blocker (Gajda et al., 2005), and, on the other, it is blocking the network activity of cultured neurons not involving gap junctions (Rouach et al., 2003). Thus, its systemic application might have displaced the general state of the brain outside the window of hyperexcitability. This aspect needs additional investigation.
The new finding of hyperexcitability during BS prompts for the revision of two essential aspects: (1) the origin of “spontaneous” bursts, and (2) the impact of any somatosensory stimulation on comatose patients.
The spontaneity of bursts was generally assumed in all previous studies on BS. Some of them have dealt with the pseudorhythmicity of the bursts (Beydoun et al., 1991), others with their occurrence in deafferented preparations (Henry and Scoville, 1952). In view of our data, it might be that many, if not all, bursts could be the result of subliminal, undetected stimuli. These stimuli might be of external as well as internal nature. The fact that brain pulsations arising in the blood stream were unable to elicit burst responses pleads, however, against the possibility that pure mechanical shocks within the parenchyma generate such burst responses. This favors rather a sequence of relays conveying sensory information from the periphery to the brain. The variability of the interburst intervals would in this case result from the combination of the timing of stimuli and the moment in the refractory period at which these stimuli arrive.
The second aspect pertains to the ability of a deeply anesthetized or comatose brain to perceive signals from the external world. The present data emphasize the fact that subliminal stimuli, imperceptible to a conscious brain, elicit persistent and complex responses during BS. They probably will not leave memory traces in the brain because of the known amnesic properties of anesthesia (Antognini et al., 2005; Heinke and Koelsch, 2005) but could play a role in maintaining a rudiment of cellular activity, similar to the presumable effect of some sleep oscillations in modulating plasticity (Steriade, 2006). This might prove of utmost importance for the handling of comatose patients and for the postcomatose recovery.
Footnotes
This work was supported by Canadian Institutes for Health Research Grants MSH-69176 and MOP-67175 (F.A.). D.K. is a doctoral student. We are grateful to Pierre Giguère for technical assistance.
References
- Ammann D. Berlin: Springer; 1986. Ion sensitive microelectrodes. [Google Scholar]
- Amzica F, Neckelmann D. Membrane capacitance of cortical neurons and glia during sleep oscillations and spike-wave seizures. J Neurophysiol. 1999;82:2731–2746. doi: 10.1152/jn.1999.82.5.2731. [DOI] [PubMed] [Google Scholar]
- Amzica F, Steriade M. Short- and long-range neuronal synchronization of the slow (<1 Hz) cortical oscillation. J Neurophysiol. 1995;73:20–38. doi: 10.1152/jn.1995.73.1.20. [DOI] [PubMed] [Google Scholar]
- Amzica F, Massimini M, Manfridi A. Spatial buffering during slow and paroxysmal sleep oscillations in cortical networks of glial cells in vivo. J Neurosci. 2002;22:1042–1053. doi: 10.1523/JNEUROSCI.22-03-01042.2002. [DOI] [PMC free article] [PubMed] [Google Scholar]
- Antognini JF, Carstens E, Sudo M, Sudo S. Isoflurane depresses electroencephalographic and medial thalamic responses to noxious stimulation via an indirect spinal action. Anesth Analg. 2000;91:1282–1288. [PubMed] [Google Scholar]
- Antognini JF, Barter L, Carstens E. Overview movement as an index of anesthetic depth in humans and experimental animals. Comp Med. 2005;55:413–418. [PubMed] [Google Scholar]
- Ballanyi K, Grafe P, ten Bruggencate G. Ion activities and potassium uptake mechanisms of glial cells in guinea-pig olfactory cortex slices. J Physiol (Lond) 1987;382:159–174. doi: 10.1113/jphysiol.1987.sp016361. [DOI] [PMC free article] [PubMed] [Google Scholar]
- Berg-Johnsen J, Langmoen IA. Isoflurane effects in rat hippocampal cortex: a quantitative evaluation of different cellular sites of action. Acta Physiol Scand. 1986;128:613–618. doi: 10.1111/j.1748-1716.1986.tb08019.x. [DOI] [PubMed] [Google Scholar]
- Berg-Johnsen J, Langmoen IA. Isoflurane hyperpolarizes neurones in rat and human cerebral cortex. Acta Physiol Scand. 1987;130:679–685. doi: 10.1111/j.1748-1716.1987.tb08192.x. [DOI] [PubMed] [Google Scholar]
- Berg-Johnsen J, Langmoen IA. Mechanisms concerned in the direct effect of isoflurane on rat hippocampal and human neocortical neurons. Brain Res. 1990;507:28–34. doi: 10.1016/0006-8993(90)90517-f. [DOI] [PubMed] [Google Scholar]
- Beydoun A, Yen CE, Drury I. Variance of interburst intervals in burst suppression. Electroencephalogr Clin Neurophysiol. 1991;79:435–439. doi: 10.1016/0013-4694(91)90162-w. [DOI] [PubMed] [Google Scholar]
- Bollmann JH, Helmchen F, Borst JG, Sakmann B. Postsynaptic Ca2+ influx mediated by three different pathways during synaptic transmission at a calyx-type synapse. J Neurosci. 1998;18:10409–10419. doi: 10.1523/JNEUROSCI.18-24-10409.1998. [DOI] [PMC free article] [PubMed] [Google Scholar]
- Bootman MD, Berridge MJ. The elemental principles of calcium signaling. Cell. 1995;83:675–678. doi: 10.1016/0092-8674(95)90179-5. [DOI] [PubMed] [Google Scholar]
- Borst JG, Sakmann B. Depletion of calcium in the synaptic cleft of a calyx-type synapse in the rat brainstem. J Physiol (Lond) 1999;521:123–133. doi: 10.1111/j.1469-7793.1999.00123.x. [DOI] [PMC free article] [PubMed] [Google Scholar]
- Brenner RP. The electroencephalogram in altered states of consciousness. Neurol Clin. 1985;3:615–631. [PubMed] [Google Scholar]
- Chatrian GE. Coma, other states of altered responsiveness, and brain death. In: Daly DD, Pedley TA, editors. Current practice in clinical electroencephalography. New York: Raven; 1990. pp. 425–487. [Google Scholar]
- Contreras D, Steriade M. Cellular basis of EEG slow rhythms: a study of dynamic corticothalamic relationships. J Neurosci. 1995;15:604–622. doi: 10.1523/JNEUROSCI.15-01-00604.1995. [DOI] [PMC free article] [PubMed] [Google Scholar]
- De Rubeis DA, Young GB. Continuous EEG monitoring in a patient with massive carbamazepine overdose. J Clin Neurophysiol. 2001;18:166–168. doi: 10.1097/00004691-200103000-00008. [DOI] [PubMed] [Google Scholar]
- Detsch O, Vahle-Hinz C, Kochs E, Siemers M, Bromm B. Isoflurane induces dose-dependent changes of thalamic somatosensory information transfer. Brain Res. 1999;829:77–89. doi: 10.1016/s0006-8993(99)01341-4. [DOI] [PubMed] [Google Scholar]
- Dodge FA, Jr, Rahamimoff R. Co-operative action a calcium ions in transmitter release at the neuromuscular junction. J Physiol (Lond) 1967;193:419–432. doi: 10.1113/jphysiol.1967.sp008367. [DOI] [PMC free article] [PubMed] [Google Scholar]
- Echlin FA, Arnett V, Zoll J. Paroxysmal high voltage discharges from isolated and partially isolated human and animal cerebral cortex. Electroencephalogr Clin Neurophysiol. 1952;4:147–164. doi: 10.1016/0013-4694(52)90004-7. [DOI] [PubMed] [Google Scholar]
- Gajda Z, Szupera Z, Blazso G, Szente M. Quinine, a blocker of neuronal cx36 channels, suppresses seizure activity in rat neocortex in vivo. Epilepsia. 2005;46:1581–1591. doi: 10.1111/j.1528-1167.2005.00254.x. [DOI] [PubMed] [Google Scholar]
- Heinemann U, Pumain R. Effects of tetrodotoxin on changes in extracellular free calcium induced by repetitive electrical stimulation and iontophoretic application of excitatory amino acids in the sensorimotor cortex of cats. Neurosci Lett. 1981;21:87–91. doi: 10.1016/0304-3940(81)90063-x. [DOI] [PubMed] [Google Scholar]
- Heinke W, Koelsch S. The effects of anesthetics on brain activity and cognitive function. Curr Opin Anesthesiol. 2005;18:625–631. doi: 10.1097/01.aco.0000189879.67092.12. [DOI] [PubMed] [Google Scholar]
- Henry CE, Scoville WB. Suppression-burst activity from isolated cerebral cortex in man. Electroenceph Clin Neurophysiol. 1952;4:1–22. doi: 10.1016/0013-4694(52)90027-8. [DOI] [PubMed] [Google Scholar]
- Hille B. Sunderland, MA: Sinauer; 2001. Ion channels of excitable membranes. [Google Scholar]
- Hughes JR. Extreme stereotypy in the burst suppression pattern. Clin Electroencephalogr. 1986;17:162–168. [PubMed] [Google Scholar]
- Katz B, Miledi R. Further study of the role of calcium in synaptic transmission. J Physiol (Lond) 1970;207:789–801. doi: 10.1113/jphysiol.1970.sp009095. [DOI] [PMC free article] [PubMed] [Google Scholar]
- King RD, Wiest MC, Montague PR, Eagleman DM. Do extracellular Ca2+ signals carry information through neural tissue? Trends Neurosci. 2000;23:12–13. doi: 10.1016/s0166-2236(99)01516-7. [DOI] [PubMed] [Google Scholar]
- Kocsis JD, Malenka RC, Waxman SG. Effects of extracellular potassium concentration on the excitability of the parallel fibres of the rat cerebellum. J Physiol (Lond) 1983;334:225–244. doi: 10.1113/jphysiol.1983.sp014491. [DOI] [PMC free article] [PubMed] [Google Scholar]
- Kuffler SW, Nicholls JG. Glial cells in the central nervous system of the leech: their membrane potential and potassium current. Naunyn Schmiedebergs Arch Pharmacol. 1964;248:216–222. doi: 10.1007/BF00348592. [DOI] [PubMed] [Google Scholar]
- Kuffler SW, Nicholls JG, Orkand RK. Physiological properties of glial cells in the central nervous system of amphibia. J Neurophysiol. 1966;29:768–787. doi: 10.1152/jn.1966.29.4.768. [DOI] [PubMed] [Google Scholar]
- Lambrakis CC, Lancman ME, Romano C. Asynchronous and asymmetric burst-suppression in a patient with a corpus callosum lesion. Clin Neurophysiol. 1999;110:103–105. doi: 10.1016/s0013-4694(98)00102-3. [DOI] [PubMed] [Google Scholar]
- Lazar LM, Milrod LM, Solomon GE, Labar DR. Asynchronous pentobarbital-induced burst suppression with corpus callosum hemorrhage. Clin Neurophysiol. 1999;110:1036–1040. doi: 10.1016/s1388-2457(99)00046-2. [DOI] [PubMed] [Google Scholar]
- MacIver MB, Roth SH. Inhalation anaesthetics exhibit pathway-specific and differential actions on hippocampal synaptic responses in vitro. Br J Anaesth. 1988;60:680–691. doi: 10.1093/bja/60.6.680. [DOI] [PubMed] [Google Scholar]
- Massimini M, Amzica F. Extracellular calcium fluctuations and intracellular potentials in the cortex during the slow sleep oscillation. J Neurophysiol. 2001;85:1346–1350. doi: 10.1152/jn.2001.85.3.1346. [DOI] [PubMed] [Google Scholar]
- Michenfelder JD, Milde JH. The relationship among canine brain temperature, metabolism, and function during hypothermia. Anesthesiology. 1991;75:130–136. doi: 10.1097/00000542-199107000-00021. [DOI] [PubMed] [Google Scholar]
- Mintz IM, Sabatini BL, Regehr WG. Calcium control of transmitter release at a cerebellar synapse. Neuron. 1995;15:675–688. doi: 10.1016/0896-6273(95)90155-8. [DOI] [PubMed] [Google Scholar]
- Miu P, Puil E. Isoflurane-induced impairment of synaptic transmission in hippocampal neurons. Exp Brain Res. 1989;75:354–360. doi: 10.1007/BF00247941. [DOI] [PubMed] [Google Scholar]
- Nakashima K, Todd MM, Warner DS. The relation between cerebral metabolic rate and ischemic depolarization. A comparison of the effects of hypothermia, pentobarbital, and isoflurane. Anesthesiology. 1995;82:1199–1208. doi: 10.1097/00000542-199505000-00015. [DOI] [PubMed] [Google Scholar]
- Newberg LA, Milde JH, Michenfelder JD. The cerebral metabolic effects of isoflurane at and above concentrations that suppress cortical electrical activity. Anesthesiology. 1983;59:23–28. doi: 10.1097/00000542-198307000-00005. [DOI] [PubMed] [Google Scholar]
- Newman EA. Glial cell regulation of extracellular potassium. In: Kettenmann H, Ransom BR, editors. Neuroglia. New York: Oxford UP; 1995. pp. 717–731. [Google Scholar]
- Niedermeyer E, Sherman DL, Geocadin RJ, Hansen HC, Hanley DF. The burst-suppression electroencephalogram. Clin Electroencephalogr. 1999;30:99–105. doi: 10.1177/155005949903000305. [DOI] [PubMed] [Google Scholar]
- Nusser Z. AMPA and NMDA receptors: similarities and differences in their synaptic distribution. Curr Opin Neurobiol. 2000;10:337–341. doi: 10.1016/s0959-4388(00)00086-6. [DOI] [PubMed] [Google Scholar]
- Orkand RK, Nicholls JG, Kuffler SW. Effect of nerve impulses on the membrane potential of glial cells in the central nervous system of amphibia. J Neurophysiol. 1966;29:788–806. doi: 10.1152/jn.1966.29.4.788. [DOI] [PubMed] [Google Scholar]
- Ostermann ME, Young B, Sibbald WJ, Nicolle MW. Coma mimicking brain death following baclofen overdose. Intensive Care Med. 2000;26:1144–1146. doi: 10.1007/s001340051330. [DOI] [PubMed] [Google Scholar]
- Pagni CA, Courjon J. Electroencephalographic modifications induced by moderate and deep hypothermia in man. Acta Neurochir Suppl. 1964;14:35–49. [PubMed] [Google Scholar]
- Qian J, Colmers WF, Saggau P. Inhibition of synaptic transmission by neuropeptide Y in rat hippocampal area CA1: modulation of presynaptic Ca2+ entry. J Neurosci. 1997;17:8169–8177. doi: 10.1523/JNEUROSCI.17-21-08169.1997. [DOI] [PMC free article] [PubMed] [Google Scholar]
- Ranft A, Kurz J, Deuringer M, Haseneder R, Dodt HU, Zieglgansberger W, Kochs E, Eder M, Hapfelmeier G. Isoflurane modulates glutamatergic and GABAergic neurotransmission in the amygdala. Eur J Neurosci. 2004;20:1276–1280. doi: 10.1111/j.1460-9568.2004.03603.x. [DOI] [PubMed] [Google Scholar]
- Ries CR, Puil E. Isoflurane prevents transitions to tonic and burst firing modes in thalamic neurons. Neurosci Lett. 1993;159:91–94. doi: 10.1016/0304-3940(93)90806-v. [DOI] [PubMed] [Google Scholar]
- Ries CR, Puil E. Mechanism of anesthesia revealed by shunting actions of isoflurane on thalamocortical neurons. J Neurophysiol. 1999;81:1795–1801. doi: 10.1152/jn.1999.81.4.1795. [DOI] [PubMed] [Google Scholar]
- Rigas P, Castro-Alamancos MA. Thalamocortical Up states: differential effects of intrinsic and extrinsic cortical inputs on persistent activity. J Neurosci. 2007;27:4261–4272. doi: 10.1523/JNEUROSCI.0003-07.2007. [DOI] [PMC free article] [PubMed] [Google Scholar]
- Rouach N, Segal M, Koulakoff A, Giaume C, Avignone E. Carbenoxolone blockade of neuronal network activity in culture is not mediated by an action on gap junctions. J Physiol (Lond) 2003;553:729–745. doi: 10.1113/jphysiol.2003.053439. [DOI] [PMC free article] [PubMed] [Google Scholar]
- Rusakov DA, Kullmann DM, Stewart MG. Hippocampal synapses: do they talk to their neighbours? Trends Neurosci. 1999;22:382–388. doi: 10.1016/s0166-2236(99)01425-3. [DOI] [PubMed] [Google Scholar]
- Sakabe T, Nakakimura K. Effects of anesthetic agents and other drugs on cerebral blood flow, metabolism, and intracranial pressure. In: Cottrell JE, Smith DS, editors. Anesthesia and neurosurgery. St. Louis: Mosby; 1994. pp. 129–143. [Google Scholar]
- Scher MS. Electroencephalography of the newborn: normal and abnormal features. In: Niedermeyer E, Lopes da Silva F, editors. Electroencephalography: basic principles, clinical applications and related fields. Baltimore: Williams and Wilkins; 1999. pp. 896–946. [Google Scholar]
- Schiff N, Plum F. Possible relationships of anesthetic coma and pathological disorders of consciousness. In: Antognini JF, Carstens E, Raines DE, editors. Neural mechanisms of anesthesia. Totowa, NJ: Humana; 2003. pp. 75–89. [Google Scholar]
- Silverman D. The electroencephalogram in anoxic coma. In: Rémond A, editor. Handbook of electroencephalography and clinical neurophysiology. Amsterdam: Elsevier; 1975. pp. 81–94. [Google Scholar]
- Somjen GG. Extracellular potassium in the mammalian central nervous system. Annu Rev Physiol. 1979;41:159–177. doi: 10.1146/annurev.ph.41.030179.001111. [DOI] [PubMed] [Google Scholar]
- Somjen GG. New York: Oxford UP; 2004. Ions in the brain. [Google Scholar]
- Steriade M. Grouping of brain rhythms in corticothalamic systems. Neuroscience. 2006;137:1087–1106. doi: 10.1016/j.neuroscience.2005.10.029. [DOI] [PubMed] [Google Scholar]
- Steriade M, Nunez A, Amzica F. A novel slow (<1 Hz) oscillation of neocortical neurons in vivo: depolarizing and hyperpolarizing components. J Neurosci. 1993;13:3252–3265. doi: 10.1523/JNEUROSCI.13-08-03252.1993. [DOI] [PMC free article] [PubMed] [Google Scholar]
- Steriade M, Amzica F, Contreras D. Cortical and thalamic cellular correlates of electroencephalographic burst-suppression. Electroencephalogr Clin Neurophysiol. 1994;90:1–16. doi: 10.1016/0013-4694(94)90108-2. [DOI] [PubMed] [Google Scholar]
- Steriade M, Timofeev I, Grenier F. Natural waking and sleep states: a view from inside neocortical neurons. J Neurophysiol. 2001;85:1969–1985. doi: 10.1152/jn.2001.85.5.1969. [DOI] [PubMed] [Google Scholar]
- Swank RL, Watson CW. Effects of barbiturates and ether on spontaneous electrical activity of dog brain. J Neurophysiol. 1949;12:137–160. doi: 10.1152/jn.1949.12.2.137. [DOI] [PubMed] [Google Scholar]
- Trachtenberg MC, Pollen DA. Neuroglia: biophysical properties and physiologic function. Science. 1970;167:1248–1252. doi: 10.1126/science.167.3922.1248. [DOI] [PubMed] [Google Scholar]
- Tsuji T, Chiba S. Mechanism of vascular responsiveness to barbiturates in isolated and perfused canine basilar arteries. Neurosurgery. 1987;21:161–166. doi: 10.1227/00006123-198708000-00005. [DOI] [PubMed] [Google Scholar]
- Walz W. Role of glial cells in the regulation of the brain ion microenvironment. Prog Neurobiol. 1989;33:309–333. doi: 10.1016/0301-0082(89)90005-1. [DOI] [PubMed] [Google Scholar]
- Weissenborn K, Wilkens H, Hausmann E, Degen PH. Burst suppression EEG with baclofen overdose. Clin Neurol Neurosurg. 1991;93:77–80. doi: 10.1016/0303-8467(91)90015-h. [DOI] [PubMed] [Google Scholar]
- Yli-Hankala A, Jantti V, Pyykko I, Lindgren L. Vibration stimulus induced EEG bursts in isoflurane anaesthesia. Electroencephalogr Clin Neurophysiol. 1993;87:215–220. doi: 10.1016/0013-4694(93)90021-m. [DOI] [PubMed] [Google Scholar]
- Young GB. The EEG in coma. J Clin Neurophysiol. 2000;17:473–485. doi: 10.1097/00004691-200009000-00006. [DOI] [PubMed] [Google Scholar]
- Zaret BS. Prognostic and neurophysiological implications of concurrent burst suppression and alpha patterns in the EEG of post-anoxic coma. Electroencephalogr Clin Neurophysiol. 1985;61:199–209. doi: 10.1016/0013-4694(85)91085-5. [DOI] [PubMed] [Google Scholar]
