Subsets of exhausted CD8+ T cells differentially mediate tumor control and respond to checkpoint blockade (original) (raw)
. Author manuscript; available in PMC: 2019 Aug 1.
Published in final edited form as: Nat Immunol. 2019 Feb 18;20(3):326–336. doi: 10.1038/s41590-019-0312-6
Abstract
T cell dysfunction is a hallmark of many cancers, but the basis for T cell dysfunction and the mechanisms by which antibody blockade of the inhibitory receptor PD-1 (anti-PD-1) reinvigorates T cells are not fully understood. Here we show that such therapy acts on a specific subpopulation of exhausted CD8+ tumor-infiltrating lymphocytes (TILs). Dysfunctional CD8+ TILs possess canonical epigenetic and transcriptional features of exhaustion that mirror those seen in chronic viral infection. Exhausted CD8+ TILs include a subpopulation of ‘progenitor exhausted’ cells that retain polyfunctionality, persist long term and differentiate into ‘terminally exhausted’ TILs. Consequently, progenitor exhausted CD8+ TILs are better able to control tumor growth than are terminally exhausted T cells. Progenitor exhausted TILs can respond to anti-PD-1 therapy, but terminally exhausted TILs cannot. Patients with melanoma who have a higher percentage of progenitor exhausted cells experience a longer duration of response to checkpoint-blockade therapy. Thus, approaches to expand the population of progenitor exhausted CD8+ T cells might be an important component of improving the response to checkpoint blockade.
The functional impairment of T cell-mediated immunity in the tumor microenvironment (TME) is a defining feature of many cancers1. Checkpoint-blockade therapy seeks to reinvigorate T cell responses by targeting inhibitory receptors such as PD-1, which are upregulated by dysfunctional TILs2. However, the fundamental mechanisms underlying T cell dysfunction in the TME remain poorly understood, as are the mechanisms by which checkpoint blockade overcomes this dysfunction.
Insight into T cell dysfunction has come from studying the T cell response to chronic viral infections such as lymphocytic choriomeningitis virus (LCMV) that induce a specific state called ‘exhaustion’3–7. Transcriptional and epigenetic studies have demonstrated that exhaustion is not simply a transient inhibition of otherwise functional cells but instead represents a distinct and stable state of T cell differentiation8–11.
Exhausted CD8+ T cells responding to chronic LCMV infection are phenotypically and functionally heterogeneous12–17. ‘Progenitor’12 or ‘stem-like’14 exhausted CD8+ T cells can be defined by intermediate expression of PD-1 and expression of the chemokine receptor CXCR5. In contrast, terminally exhausted cells co-express high levels of PD-1, Tim-3 and other co-inhibitory receptors12,14. These two subpopulations have important functional differences, and only progenitor exhausted cells proliferate after anti-PD-1 therapy in models of chronic viral infection13–15,18.
Initial studies of dysfunctional CD8+ T cells in tumors indicated that they share features of T cell exhaustion1,2,19,20. However, subsequent studies have indicated that TIL dysfunction is a unique state that is distinct from T cell exhaustion21–23. Thus, it remains unknown whether the cell state of dysfunctional CD8+ TILs recapitulates the canonical state of T cell exhaustion. Moreover, it is not clear whether PD-1 checkpoint blockade affects all heterogeneous CD8+ TIL populations22,24 equivalently to mediate tumor control or whether specific subsets preferentially mediate response.
Here we show that CD8+ TILs acquire a state of exhaustion analogous to that elicited by chronic viral infection. Among exhausted CD8+ TILs, a small population of progenitor exhausted cells can differentiate into the majority population of highly cytotoxic, terminally exhausted TILs, mediate long-term tumor control and respond to anti-PD-1 therapy. Our data indicate that the efficacy of PD-1 checkpoint blockade is due in part to its selective activity on a functionally distinct subpopulation of exhausted CD8+ TILs.
Results
Chronic viral infection and tumors elicit analogous subsets of exhausted CD8+ T cells.
To define the basis for T cell dysfunction in TILs, we compared single-cell expression profiles of exhausted CD8+ T cells during chronic viral infection with those of CD8+ T cells in tumors. We analyzed the single-cell RNA-sequencing (scRNA-seq) profiles of 9,194 gp33 tetramer+ CD8+ T cells in mice chronically infected with LCMV Clone 13 (Cl13) on day 28 after infection (Fig. 1a and Supplementary Fig. 1a). Unsupervised clustering analysis identified four major populations of cells, each of which expressed genes encoding molecules characteristic of exhausted cells, including PD-1 and Tox, an exhaustion-specific transcription factor9 (Fig. 1b). Most T cells were enriched for a signature of T cell exhaustion11 (Fig. 1c).
Fig. 1 |. Chronic viral infection and tumors elicit analogous subsets of exhausted CD8+ T cells.
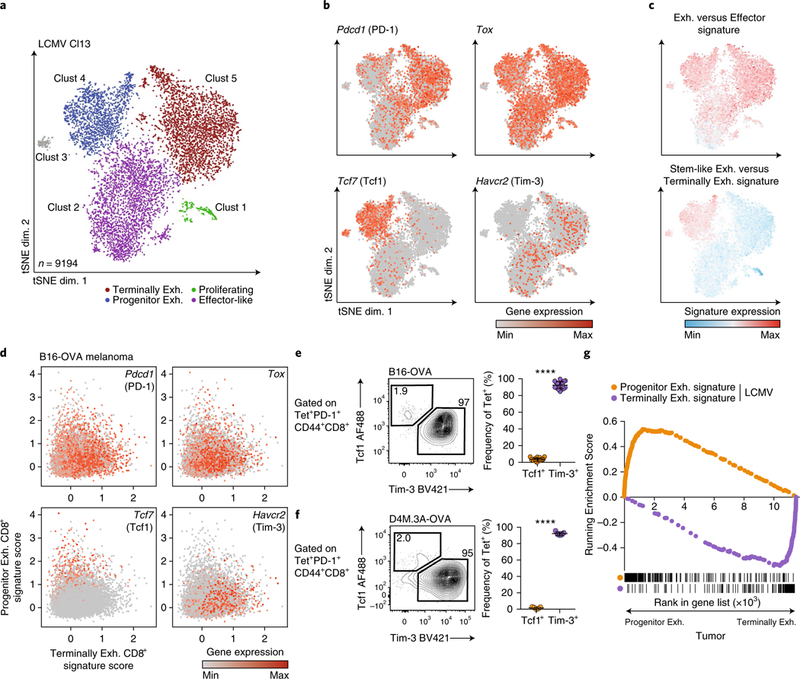
a, tSNE projection of scRNA-seq profiles from 9,194 gp33 tetramer+ CD8+ T cells responding to chronic LCMV (day 28 after infection), colored by cluster. exh., exhausted. b, Expression of indicated genes in individual cells from a. c, Enrichment of a signature of genes upregulated in exhausted versus effector CD8+ T cells (GSE9650) or stem-like exhausted versus terminally exhausted CD8+ T cells (GSE84105), P<1 × 10⁻⁶ by two-sided Kolmogorov–Smirnov test for each comparison. d, scRNA-seq profiles of 11,212 PD-1+CD44+CD8+ T cells isolated from day-10 and day-20 B16-OVA tumors. Cells were scored for expression of the progenitor exhausted CD8+ T cell signature and terminally exhausted CD8+ T cell signature from the LCMV dataset in a. Cells were projected in a two-dimensional (2D) scatter plot on the basis of their scores. e, Frequency of progenitor exhausted (Tcf1+Tim-3-) and terminally exhausted (Tcf1-Tim-3+) CD8+ T cells from B16-OVA tumors, gated on tetramer+ cells. Representative flow plot (left) and summary (right) of three independent experiments, n = 17 mice. f, Frequency of progenitor and terminally exhausted CD8+ T cells from D4M.3A-OVA tumors, gated on tetramer+ cells. Representative flow plot (left) and summary (right) of one of two independent experiments, n = 5 mice. g, GSEA of a signature of LCMV progenitor exhausted CD8+ T cells versus terminally exhausted CD8+ T cells (orange) or the inverse (purple) in the ranked list of genes differentially expressed by progenitor exhausted CD8+ TILs versus terminally exhausted CD8+ TILs from B16-OVA tumors. All RNA-seq data are representative of two biologically independent pooled samples. FDR < 0.001 for each comparison, by gene-set permutation test. Mean ± s.d.; two-sided Student’s _t_-test (e,f); ****P ≤ 0.0001.
Cluster 1 expressed genes encoding markers of actively dividing cells (Mki67 and Top2a), while cluster 2 was distinguished by transcripts encoding molecules associated with effector CD8+ T cells (Cx3cr1, Klrc1 and Klrd1) (Supplementary Fig. 1b,c and Supplementary Table 1). A small cluster (cluster 3, 1.3% of total cells) expressed genes encoding markers of naive cells (Ccr7, Lef1 and Sell), probably representative of contaminating naive T cells. Several transcripts upregulated in cluster 4 (Tcf7 and Id3) were associated with a stem-like or progenitor population of exhausted CD8+ T cells in LCMV12–17 (Fig. 1b, Supplementary Fig. 1b and Supplementary Table 1). Consistent with this, cluster 4 was significantly enriched for a published signature of stem-like exhausted versus terminally exhausted CD8+ T cells14 (Fig. 1c). Conversely, Tim-3+ T cells, previously defined as terminally exhausted cells, were found predominantly in clusters 2 and 5 and expressed several genes encoding inhibitory receptors (Entpd1 and Cd244)25 (Supplementary Fig. 1c). The heterogeneity of T cells during LCMV infection was not captured solely by T-bet and Eomes expression, two markers previously used to define progenitor exhausted and terminally exhausted populations12 (Supplementary Fig. 1c).
We next asked whether CD8+ T cells isolated from ovalbumin (OVA)-expressing B16.F10 mouse melanoma tumors (B16-OVA tumors)26 contained analogous subpopulations. We derived signatures defining the progenitor exhausted and terminally exhausted populations from the LCMV dataset and projected scRNA-seq profiles from B16-OVA CD8+ TILs in the space of these signatures (Fig. 1d). Tetramer-sorted CD8+ T cells from day-20 tumors demonstrated nearly uniform PD-1 and Tox expression and were considerably enriched for the signature of exhausted CD8+ T cells (Supplementary Fig. 1d–f). We identified a subpopulation of CD8+ T cells with marked transcriptional similarity to progenitor exhausted CD8+ T cells that expressed Tcf7 (which encodes the transcription factor Tcf1), in contrast to the majority populations that expressed Havcr2 (Fig. 1d and Supplementary Fig. 1e–g).
We confirmed the presence of these two populations by flow cytometry. We identified TILs with a progenitor (Tcf1+Tim-3-) or terminally exhausted (Tcf1-Tim-3+) phenotype among both OVA-specific (tetramer+) and total antigen-experienced (PD1+CD44+) CD8+ TILs (Fig. 1e and Supplementary Fig. 2a,b). The two populations could also be identified in B16.F10 tumors without a model antigen (Supplementary Fig. 2b) and in a second mouse melanoma model, D4M.3A-OVA27 (Fig. 1f and Supplementary Fig. 2b).
To isolate live progenitor exhausted cells for further characterization, we identified Slamf6 as a cell-surface marker that distinguished progenitor exhausted CD8+ T cells from terminally exhausted CD8+ T cells (Supplementary Fig. 1c). Tcf1 and Slamf6 were highly coexpressed by progenitor exhausted cells (76% of Slamf6+Tim-3- cells expressed Tcf1; 88% of Tcf1+Tim-3- cells expressed Slamf6), and very few terminally exhausted (Slamf6-Tim-3+) cells expressed Tcf1 (4%; Supplementary Fig. 2c).
We next compared the bulk gene-expression profiles of Slamf6+Tim-3- (progenitor exhausted) and Slamf6-Tim-3+ (terminally exhausted) tetramer+ cells from LCMV Cl13 infection and B16-OVA tumors (Supplementary Fig. 2d and Supplementary Table 2). Gene-set-enrichment analysis (GSEA) demonstrated significant transcriptional similarity between the corresponding populations (Fig. 1g). We also found clear overlap with expression profiles previously defined from similar subpopulations in other studies (Supplementary Fig. 2e). Thus, the same two phenotypically and transcriptionally distinct subpopulations of exhausted CD8+ T cells arise during chronic viral infection and in tumors.
Progenitor exhausted and terminally exhausted CD8+ TILs have distinct epigenetic and transcriptional states.
To determine whether subpopulations of exhausted CD8+ T cells in tumors shared the same epigenetic state as that elicited by chronic infection, we defined chromatin accessibility in CD8+ T cell subsets from B16-OVA tumors and LCMV Cl13 infection (Supplementary Fig. 3a and Supplementary Table 3) and compared it with that of functional memory CD8+ T cells isolated after LCMV Armstrong infection. Both exhausted subpopulations showed canonical epigenetic features of exhausted cells, including chromatin-accessible regions (ChARs) around Tox and an exhaustion-specific enhancer in the gene encoding PD-1 (Pdcd1)8,10 (Fig. 2a). Indeed, the epigenetic profiles elicited by tumors and LCMV Cl13 infection were more correlated with each other than with memory CD8+ T cells (Fig. 2b). We identified 8,909 ChARs with increased accessibility in exhausted CD8+ cells relative to that in memory T cells. Pathway enrichment of the genes near these ChARs highlighted signatures of interferon signaling, PD-1 signaling and the cytokine IL-10 response, whereas memory T cells enriched for signatures of memory and fatty acid metabolism (Fig. 2c and Supplementary Table 4).
Fig. 2 |. Progenitor and terminally exhausted CD8+ TILs have distinct epigenetic and transcriptional features.
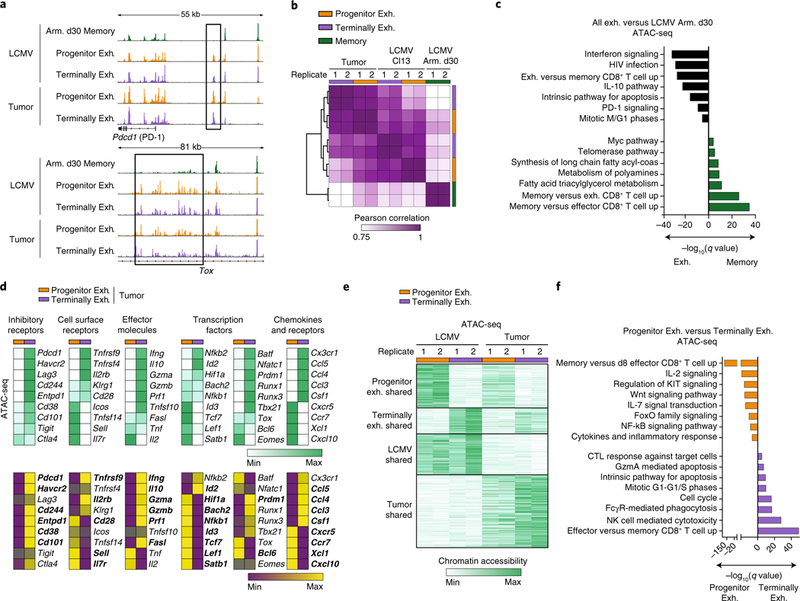
a, Representative ATAC-seq tracks at the Pdcd1 (top) and Tox (bottom) loci from CD8+ T cells sorted from mice at day 30 after infection with LCMV-Armstrong (Arm.) or at day 30 after infection with LCMV Cl13 or day-22 B16-OVA tumors. All ATAC-seq data representative of two biologically independent pooled samples. b, Pearson correlation of ATAC-seq profiles from progenitor exhausted cells, terminally exhausted cells and memory cells. c, Enrichment of gene signatures from the MSigDB database (rows) from regions in shared exhaustion program. q values (hypergeometric test) presented as -log10. d, Heatmap illustrating the average ATAC-seq peak intensity (top) or transcript expression (bottom) of the indicated genes. Rows represent averaged _z_-scores. Bolded names in RNA-seq represent transcripts with significant differential expression by DESeq2 (q < 0.05). e, _K_-means clustering of open chromatin regions from LCMV Cl13 and tumor CD8+ T cells (k = 4). Universe of all differential peaks (n = 56,404). f, Enrichment of gene signatures from MSigDB (rows) from the cluster of open chromatin regions specific to progenitor exhausted or terminally exhausted cells in e. q values (hypergeometric test) presented as -log10. NK, natural killer; CTL, cytotoxic T lymphocyte.
Next, we examined regions that varied in accessibility between the two subsets both in tumors and during chronic infection. We found differential ChARs adjacent to Slamf6 specifically in progenitor exhausted cells and adjacent to Havcr2 (which encodes Tim-3) in terminally exhausted cells, consistent with their phenotype (Supplementary Fig. 3b). Progenitor exhausted cells had greater chromatin accessibility and higher transcript levels of genes encoding cytokines (Tnf and Il2), costimulatory molecules (Icos and Tnfsf14) and survival/memory molecules (Il7r, Id3 and Satb1) (Fig. 2d). Conversely, terminally exhausted cells had more accessibility and expression of genes encoding co-inhibitory cell-surface receptors (Entpd1 and Cd244), effector molecules (Gzmb, Prf1 and Ifng) and transcription factors associated with effector and exhausted cells (Id2, Runx1 and Prdm1).
Unsupervised clustering of differential regions identified the following four clusters: two that distinguished progenitor exhausted cells from terminally exhausted cells in both model systems, and two that distinguished exhausted T cells arising in tumors from those in chronic viral infection (Fig. 2e). ChARs in each cluster were positively correlated with expression of adjacent genes, confirming that most ChARs had enhancer activity (Supplementary Fig. 3c). Enhancers specific to chronic infection were adjacent to genes encoding molecules involved in type I interferon signaling, while tumor-specific regions were associated with signatures related to growth-factor signaling (Supplementary Fig. 3d and Supplementary Table 4). Thus, in addition to a shared epigenetic program of exhaustion, different microenvironmental signals in infection and tumors imprint distinct epigenetic features.
We next identified 13,430 ChARs and 8,085 ChARs unique to progenitor exhausted cells and terminally exhausted cells, respectively, which were independent of the microenvironment. This suggests that the two subpopulations represent distinct cell states. Transcription-factor-motif enrichment indicated that these states were maintained by the activity of different transcription factors (Supplementary Fig. 3e), such as pro-survival TCF28 and NF-kB29 family members in progenitor exhausted cells, and exhaustion- and/or effector-associated transcription factors (Runx family members30, the AP-1 family8, NFAT31 and ETS31) in terminally exhausted cells. Pathway enrichment of genes associated with state-specific ChARs indicated unique biological properties of each population: progenitor exhausted cells were enriched for signatures of cytokine production, survival and memory, whereas terminally exhausted cells were marked by programs of cell division, apoptosis and cytotoxicity (Fig. 2f and Supplementary Table 4). GSEA of transcriptional differences identified similar changes (Supplementary Fig. 3f). Therefore, progenitor exhausted CD8+ T cells and terminally exhausted CD8+ T cells represent two transcriptionally distinct substates in T cell exhaustion that are maintained by state-specific epigenetic regulation.
Progenitor exhausted and terminally exhausted CD8+ TILs are functionally distinct.
On the basis of differences in the transcriptional and epigenetic states, we hypothesized that CD8+ TIL subsets would have different functions. We found that a greater proportion of terminally exhausted T cells than progenitor exhausted T cells produced interferon-γ (IFN-γ) after in vitro stimulation (44% versus 21%; Fig. 3a and Supplementary Fig. 4a). Conversely, progenitor exhausted CD8+ T cells were more polyfunctional, as measured by IFN-γ and tumor necrosis factor (TNF) co-production (13% versus 2%) or IL-2 production (18% versus 0%; Fig. 3b and Supplementary Fig. 4b).
Fig. 3 |. Progenitor exhausted and terminally exhausted CD8+ TILs have distinct functional properties.
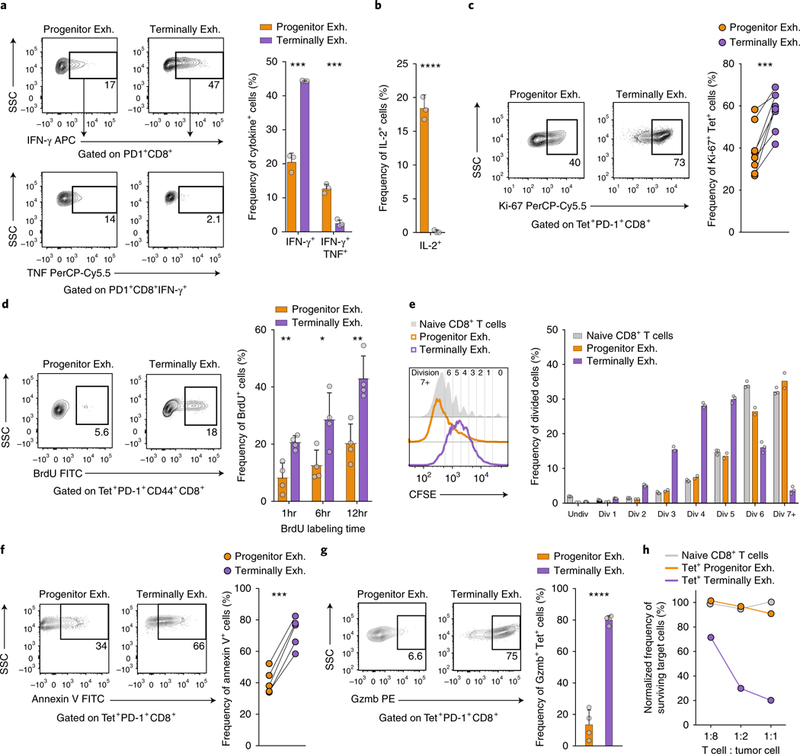
a, Frequency of IFN-γ+ and IFN-γ+TNF+ progenitor exhausted (Slamf6+Tim-3-) or terminally exhausted (Slamf6-Tim-3+) TILs stimulated for 6h ex vivo with SIINFEKL (OVA) peptide. Representative flow plots (left) and summary (right) of one of two independent experiments, n = 3 independent wells. b, Frequency of IL-2+ progenitor exhausted or terminally exhausted TILs stimulated for 6h ex vivo with the phorbol ester PMA plusionomycin; n = 3 independent wells. c, Frequency of Ki-67+ progenitor exhausted or terminally exhausted TILs ex vivo. Representative flow plots (left) and summary (right) of one of three independent experiments, n = 8 mice. d, Frequency of BrdU+ progenitor exhausted or terminally exhausted TILs after indicated times of in vivo labeling. Representative flow plots (left) and summary (right) of one of three independent experiments, n = 4 mice. e, Dilution of the division-tracking dye CFSE by naive, progenitor exhausted or terminally exhausted CD8+ T cells stimulated ex vivo with the antibodies anti-CD3 and anti-CD28. Representative histograms (left) and summary (right) of one of two independent experiments, n = 2 wells (progenitor exh.) or n = 3 wells (terminally exh. and naive). f, Frequency of annexin V+ progenitor exhausted or terminally exhausted TILs ex vivo. Representative flow plots (left) and summary (right) of five independent mice. g, Frequency of granzyme B–positive (Gzmb+) progenitor exhausted or terminally exhausted TILs ex vivo. Representative flow plots (left) and summary (right) of one of three independent experiments, n = 4 mice. h, Frequency of surviving target cells (B16-OVA) relative to that of control cells (B2m-null B16-OVA), normalized to wells with no T cells added. One of two independent experiments shown, n = 2 independent wells per T cell to tumor cell ratio. Mean ± s.d.; two-sided Student’s _t_-test (a,b,d,g); two-sided paired Student’s _t_-test (c,f); NS, not significant (P > 0.05), *P ≤ 0.05, **P ≤ 0.01, ***P ≤ 0.001, ****P ≤ 0.0001.
Terminally exhausted cells expressed higher levels of Ki-67 ex vivo (58% versus 39%; Fig. 3c) and incorporated more of the thymidine analog BrdU than did progenitor exhausted T cells (43% versus 20% after 12 h; Fig. 3d). Despite their reduced proliferation in vivo, we found that progenitor exhausted cells underwent more rounds of division than did terminally exhausted CD8+ T cells after in vitro restimulation (Fig. 3e). A larger fraction of terminally exhausted CD8+ T cells stained with the apoptosis marker annexin V ex vivo (72% versus 41%) (Fig. 3f). Thus, while terminally exhausted CD8+ T cells proliferated more in the TME, they had reduced proliferative capacity—that is, the ability to further divide after restimulation—and greater cell death compared to progenitor exhausted CD8+ T cells12,18.
Terminally exhausted CD8+ T cells expressed more granzyme B than did progenitor exhausted cells (80% versus 12%; Fig. 3g) and were more cytotoxic in direct cytotoxicity assays with tumor-cell targets (Fig. 3h and Supplementary Fig. 4c–f). Indeed, progenitor exhausted cells killed target cells no more efficiently than did naive CD8+ T cells, indicating that they contribute little or no direct cytotoxicity in the TME.
Progenitor exhausted CD8+ T cells differentiate into terminally exhausted CD8+ T cells.
Previous studies of chronic viral infection have shown that progenitor exhausted cells can give rise to terminally exhausted cells12,14,15. To understand their lineage relationship in tumors, we analyzed CD8+ TILs over a time course of tumor growth and observed an increasing ratio of terminally exhausted cells to progenitor exhausted cells (Fig. 4a). Progenitor exhausted cells had a more diverse T cell antigen receptor (TCR) repertoire than that of terminally exhausted cells (Fig. 4b and Supplementary Table 5). Less than 10% of clonotypes in progenitor exhausted cells overlapped those in terminally exhausted cells, whereas nearly 50% of the clonotypes in terminally exhausted cells were shared (Fig. 4c). These data are consistent with a model in which progenitor exhausted cells differentiate to give rise to terminally exhausted cells.
Fig. 4 |. Progenitor exhausted CD8+ T cells differentiate into terminally exhausted CD8+ T cells.
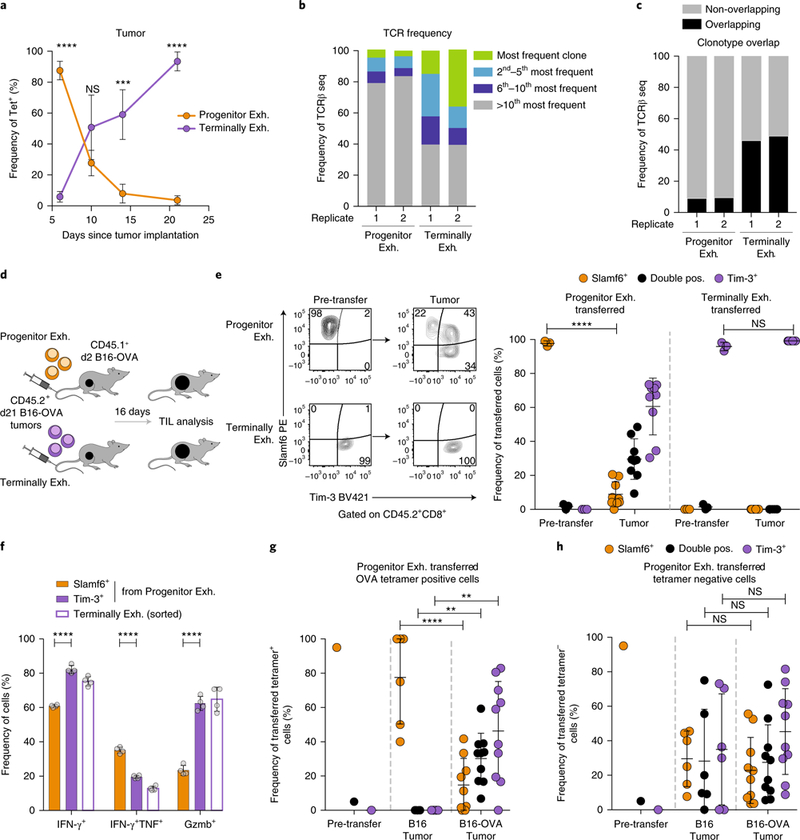
a, Longitudinal analysis of the frequency of progenitor exhausted (Tcf1+Tim-3-) and terminally exhausted (Tcf1-Tim-3+) tetramer+ CD8+ TILs in B16-OVA tumors; n = 5 mice (days 6 and 14), 4 mice (day 10) or 3 mice (day 21). b, Frequency of the most common TCRβ clonotypes in two biologic replicates of progenitor exhausted or terminally exhausted tetramer-PD-1+CD44+ CD8+ TILs from B16-OVA tumors. c, Frequency of TCRβ clonotypes shared by progenitor exhausted TILs and terminally exhausted TILs. Overlapping clonotypes are black; all others are gray. d, Experimental design for in vivo transfer assay. e, Representative flow plots (left) of the cell surface phenotype of progenitor exhausted or terminally exhausted sorted cells before transfer and in recipient mouse tumors 16d after transfer. Summary (right) of the phenotype of transferred progenitor exhausted cells or terminally exhausted cells in recipient mouse tumors from one of three independent experiments, n = 9 mice after transfer. f, Frequency of IFN-γ+, IFN-γ+TNF+ or Gzmb+ cells from sorted terminally exhausted or progenitor exhausted cells after 42 h of anti-CD3 plusanti-CD28 stimulation in vitro; n = 4 independent wells. Sorted progenitor exhausted cells gated on Slamf6+Tim-3- or Slamf6- Tim-3+ expression after culture. g,h, Summary of the phenotype of progenitor exhausted cells transferred into mice with B16 or B16-OVA tumors, gated on transferred tetramer+ (g) or tetramer- (h) cells from the recipient tumors; n = 6 mice (B16 tumor) or 10 mice (B16-OVA tumor). Mean ± s.d., two-sided Student’s _t_-test (a,e–h); *P ≤ 0.05, **P ≤ 0.01, ***P ≤ 0.001, ****P ≤ 0.0001.
To formally test a lineage relationship, we transferred each population into congenically marked, tumor-bearing mice and assessed the phenotype of the transferred population 16 d later (Fig. 4d). After transferring progenitor exhausted cells (Slamf6+Tim-3-), we recovered both Slamf6+ cells and Tim-3+ cells in the TME (Fig. 4e). However, after transferring terminally exhausted cells (Slamf6-Tim-3+), we recovered only Tim-3+ cells (Fig. 4e). Similar results were obtained after in vitro stimulation of both subsets (Supplementary Fig. 5a,b).
To test if this differentiation was associated with expected functional changes, we assessed progenitor exhausted cells that remained Slamf6+Tim-3- or become Slamf6-Tim-3+ after in vitro stimulation. Progenitor exhausted cells that acquired the phenotype of terminally exhausted cells showed increased IFN-γ production (82% versus 61%) and granzyme B production (63% versus 23%; Fig. 4f). Conversely, newly formed Slamf6-Tim-3+ had decreased IFN-γ and TNF co-production (20% versus 35%; Fig. 4f), suggesting that in vitro TCR stimulation was sufficient to induce phenotypic and functional differentiation of progenitor exhausted cells.
To ask if TCR stimulation was required for differentiation in vivo, we transferred progenitor exhausted cells into congenically marked mice without tumors (Supplementary Fig. 5c). When recovered from the spleens of recipient mice 30–40 d later, the transferred cells maintained their progenitor exhausted phenotype (Supplementary Fig. 5d). However, when the mice were implanted with B16-OVA tumors 30–40 d later, the transferred progenitor exhausted cells had acquired a terminally exhausted phenotype in the TME (Supplementary Fig. 5d).
To isolate the contribution of antigen encounter versus other factors in the TME, we transferred progenitor exhausted cells from B16-OVA tumors into host mice bearing either B16-OVA tumors or B16 tumors lacking OVA antigen. While tetramer+ progenitor exhausted cells (which recognize the OVA antigen) readily differentiated into Tim-3+ cells in B16-OVA tumors, they maintained the progenitor exhausted phenotype in B16 tumors with no source of OVA antigen (Fig. 4g). In contrast, tetramer- progenitor exhausted cells in the same TME differentiated into terminally exhausted cells, probably in response to antigens shared by B16 and B16-OVA tumors (Fig. 4h). Thus, progenitor exhausted T cells gave rise to terminally exhausted cells through a process that required TCR stimulation.
Progenitor exhausted cells can persist in the absence of antigen.
We next asked whether progenitor exhausted CD8+ T cells and terminally exhausted CD8+ T cells had differential ability to persist in the TME. We analyzed the relative frequency of the two populations in tumors following in vivo transfer (Fig. 4d). We recovered roughly 100-fold more transferred progenitor exhausted cells (Fig. 5a and Supplementary Fig. 6a) and recovered progenitor exhausted cells, but not terminally exhausted cells, from tumor-draining lymph nodes (Supplementary Fig. 6b). These results are consistent with the increased proliferative potential (Fig. 3e) and decreased apoptosis (Fig. 3f) of progenitor exhausted CD8+ TILs. Importantly, despite expressing genes encoding molecules for homing to secondary lymphoid organs (Sell and Ccr7) (Fig. 2d), transferred progenitor exhausted cells trafficked to the TME.
Fig. 5 |. Progenitor exhausted CD8+ T cells persist in the absence of antigen and mediate long-term tumor control in vivo.
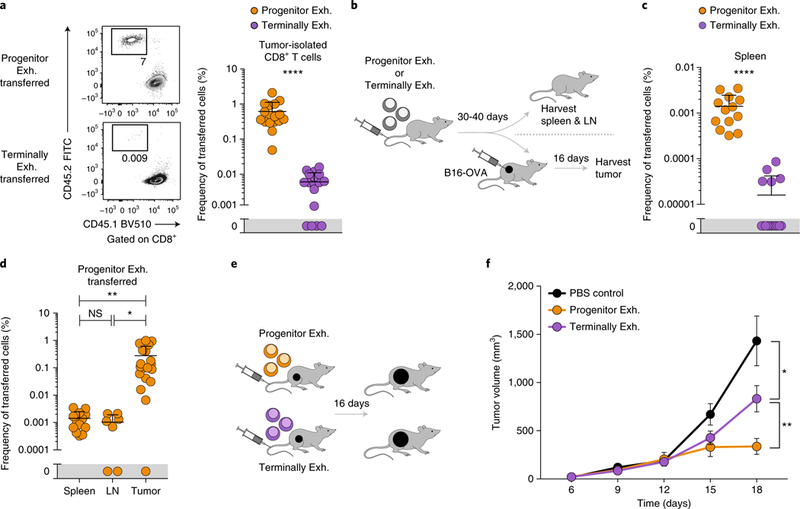
a, Representative flow plots (left) and frequency (right) of transferred (CD45.2+) progenitor exhausted or terminally exhausted cells isolated from the tumors of recipient mice. Summary of two of three independent experiments, n = 17 mice. b, Experimental design for in vivo persistence and tumor-challenge assay. c, Frequency of transferred progenitor exhausted or terminally exhausted cells in spleens of recipient mice. Summary of two independent experiments, n = 13 mice. d, Frequency of transferred progenitor exhausted cells in spleens, lymph nodes (LN) or tumors of recipient mice. Summary of two independent experiments, n = 13 (spleen), 7 (lymph node) or 19 (tumor) mice. e, Experimental design for in vivo transfer assay. f, Growth curves of B16-OVA tumors after transfer of progenitor exhausted cells or terminally exhausted cells or PBS control injection on day 2. Summary of three independent experiments, n = 14 mice (PBS), 16 mice (progenitor exhausted) or 17 mice (terminally exhausted). Mean ± s.e.m. (f), mean ± s.d. (a,c,d); two-sided Student’s _t_-test; *P ≤ 0.05, **P ≤ 0.01, ***P ≤ 0.001, ****P ≤ 0.0001.
To determine whether antigen stimulation was required for differential persistence, we transferred each cell population into naive congenically marked mice and assayed cell recovery 30–40 d later (Fig. 5b). Significantly more transferred progenitor exhausted cells were recovered from secondary lymphoid organs (89-fold in spleen and sevenfold in pooled lymph nodes; Fig. 5c and Supplementary Fig. 6c), consistent with their higher expression of transcripts encoding central memory–associated molecules, such as Il7r and Satb1 (Fig. 2d). However, progenitor exhausted cells had poor enrichment for a central memory signature versus an effector memory signature, relative to that of true central memory cells (0.15 versus 0.38, ES), consistent with their exhausted state (Supplementary Fig. 6d). We then implanted B16-OVA tumors 30–40 d after cell transfer and recovered significantly more transferred progenitor exhausted cells from the tumor than from secondary lymphoid organs (roughly 100-fold enrichment; Fig. 5d), suggesting improved trafficking to or proliferation in the TME.
Given the differences in functionality and persistence, we reasoned that progenitor exhausted TILs would have superior ability to control tumors after transfer (Fig. 5e). Tumor growth was slower after transfer of either population than in control-treated mice, suggesting that both populations could mediate some degree of antitumor immunity. However, tumor control was significantly greater in animals that received progenitor exhausted cells (Fig. 5f), probably due to their improved proliferative capacity, survival and ability to differentiate into cytotoxic terminally exhausted CD8+ T cells.
Progenitor exhausted CD8+ T cells respond to PD-1 blockade.
To determine how anti-PD-1 therapy affects exhausted TIL subpopulations, we treated B16-OVA tumor–bearing mice with PD-1-blocking antibody. As expected, checkpoint blockade improved tumor control and increased tumor infiltration by CD8**+** T cells32 (Fig. 6a and Supplementary Fig. 7a). We recovered increased numbers of both subpopulations after PD-1 therapy but observed a greater relative frequency of terminally exhausted CD8**+** T cells (Fig. 6b and Supplementary Fig. 7b,c). Similar results were obtained with combination immunotherapy (anti-PD-1 plus anti-CTLA-4), although no additive therapeutic effect was observed (Supplementary Fig. 7d,e).
Fig. 6 |. Anti-PD-1 treatment increases progenitor exhausted cell numbers and differentiation into terminally exhausted cells.
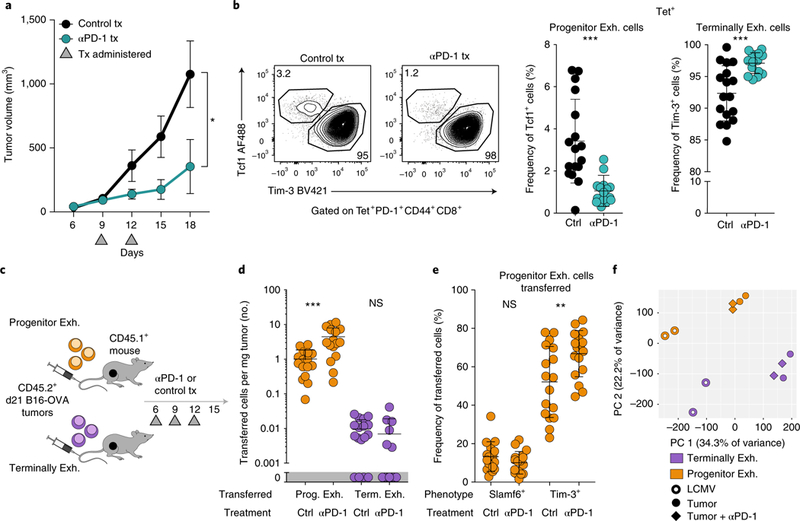
a, Growth curves of B16-OVA tumors treated with 100anti-PD-1 or isotype-matched control antibody on days 9 and 12. One of four independent experiments, n = 5 mice. b, Frequency of progenitor exhausted (Tcf1+Tim-3-) and terminally exhausted (Tcf1-Tim-3+) CD8+ T cells from B16-OVA tumors treated with isotype-matched control antibody or anti-PD-1, pre-gated on tetramer+ cells. Representative flow plots (left) and summary (right) from three independent experiments, n = 17 (control) or 15 (anti-PD-1) mice. c, Experimental design of the in vivo transfer with anti-PD-1. d, Cells per mg tumor of transferred (CD45.2+) progenitor exhausted or terminally exhausted CD8+ T cells in tumors from mice treated with isotype-matched control antibody or anti-PD-1. Summary of two independent experiments, n = 16 (progenitor exhausted) or 17 (terminally exhasuted) mice. e, Phenotype of transferred (CD45.2+) progenitor exhausted cells isolated from recipient mice treated with isotype-matched control antibody or anti-PD-1. Summary of two independent experiments, n = 17 mice. f, Principal-component analysis (PCA) of replicate samples from ATAC-seq analysis of progenitor exhausted and terminally exhausted CD8+ T cells sorted from LCMV-infected mice or B16-OVA tumors treated with isotype-matched control antibody or anti-PD-1, as indicated. Mean ± s.e.m. (a), mean ± s.d. (b,d,e); two-sided Student’s _t_-test; *P ≤ 0.05, **P ≤ 0.01, ***P ≤ 0.001.
To assess the relative effects of anti-PD-1 therapy on each population, we transferred progenitor or terminally exhausted cells into tumor-bearing mice that received anti-PD-1 or control treatment (Fig. 6c). Transferred progenitor exhausted cells in the TME significantly increased in number (4.4-fold) following PD-1 blockade, while terminally exhausted cells did not (Fig. 6d). Treatment with anti-PD-1 resulted in a significant increase in the conversion of progenitor exhausted cells to a terminally exhausted phenotype (67% versus 52%; Fig. 6e).
To assess if anti-PD-1 therapy altered the differentiation state of exhausted TILs, we performed ATAC-seq and RNA-seq on CD8+ TILs treated with anti-PD-1 or control antibody. We observed a minimal change in the transcriptional and epigenetic profiles of progenitor or terminally exhausted cells33 (less than 2.6% of all genes or regions, false-discovery rate (FDR) < 0.05; Fig. 6f and Supplementary Tables 2 and 3). Thus, anti-PD-1 treatment increased the number of progenitor exhausted cells and promoted their differentiation into terminally exhausted cells without fundamentally changing the epigenetic state of either population in the tumor (Supplementary Fig. 8a).
Finally, we asked if we could identify progenitor exhausted CD8+ T cells in patients with melanoma. We performed quantitative multiplex immunofluorescence of pre-treatment biopsies from 25 patients with advanced melanoma treated with nivolumab (anti-PD-1) and ipilimumab (anti-CTLA-4) (Fig. 7a, Supplementary Fig. 8b and Supplementary Table 6). TCF1+PD-1+CD8+ T cells, consistent with the progenitor exhausted phenotype, were readily identified in almost all biopsies, and their percentage among the total PD-1+CD8+ population varied widely (Fig. 7b,c).
Fig. 7 |. Increased fraction of progenitor exhausted CD8+ T cells is associated with duration of response to checkpoint blockade in patients with advanced melanoma.
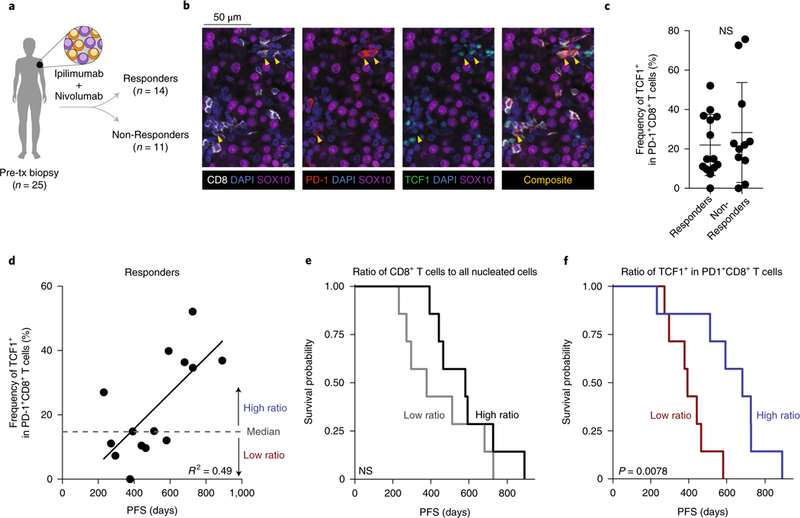
a, Classification of patients with stage III–IV melanoma from whom pre-treatment biopsies were obtained. b, Multiplex immunofluorescence image of representative progenitor exhausted cells (yellow arrowheads), identified as TCF1+PD-1+CD8+SOX10- cells. c, Frequency of TCF1+ cells among PD-1+CD8+ cells in patients with durable clinical benefit (responders, n = 14) or no clinical benefit (non-responders, n = 11). d, Frequency of progenitor exhausted cells in all activated/exhausted cells plotted against PFS (duration, in days) in patients with durable clinical benefit (responders, n = 14). Linear regression line shown. e,f, Kaplan–Meier curves of PFS in responders (n = 14) by high versus low percentage of total CD8+ T cells among all nucleated cells (e, cutoff at median 7.6%) or by percentage of progenitor exhausted cells (TCF1+) in all activated/exhausted PD-1+CD8+ T cells (f, cutoff at median 14.9%). Mean ± s.d. (c); two-sided Student’s _t_-test (c); two-sided likelihood ratio test (e,f).
No significant difference in the frequency of TCF1+PD-1+CD8+ T cells was seen between patients who achieved durable clinical benefit to immunotherapy (responders) and those who did not (non-responders) (Fig. 7c). Among responders, the duration of response correlated with the frequency of TCF1+PD-1+CD8+ T cells (Fig. 7d), but no correlation was observed in non-responders (Supplementary Fig. 8c). An increased frequency of TCF1+PD-1+CD8+ T cells was significantly associated with prolonged progression-free survival (PFS) and overall survival (pFs hazard ratio, 0.43 (95% CI, 0.19–0.77); P = 0.002; Supplementary Table 7). Among responders, patients with higher total CD8+ T cell infiltration did not have a longer duration of PFS or overall survival (Fig. 7e and Supplementary Fig. 8d,e). In contrast, patients with a higher-than-median frequency of TCF1+ cells among PD-1+CD8+ T cells experienced significantly longer PFS and overall survival on therapy (median PFS of 681 d versus 392 d; Fig. 7f and Supplementary Fig. 8d,f). Therefore, a larger fraction of progenitor exhausted CD8+ T cells is associated with anti-PD-1 efficacy in patients with melanoma.
Discussion
The basis for T cell dysfunction in cancer is not well understood; nor is the mechanism by which anti-PD-1 therapy reinvigorates T cell function. Here, we defined the heterogeneity in exhausted T cells from chronic viral infection and used this to better understand the heterogeneity of exhausted CD8+ TILs. We found that CD8+ T cells from mouse transplantable tumors share phenotypic, transcriptional, epigenetic and functional properties with populations of exhausted CD8+ T cells from a chronic viral infection model. As in chronic viral infection, we found two major subsets of exhausted T cells in the TME: a progenitor population with greater polyfunctionality and the ability to persist in the absence of antigen, as well as a terminally exhausted population with superior cytotoxicity but reduced long-term survival. The progenitor population gave rise to terminally exhausted T cells, mediated enhanced tumor control and retained responsiveness to PD-1 blockade. Cells phenotypically similar to progenitor exhausted CD8+ T cells were found in human melanoma, where they were associated with long-term responses to checkpoint-blockade therapy. Our study has three important implications for understanding the role of exhausted T cells in tumor immunity.
First, despite differences between chronic viral infection and cancer that result in disease-specific epigenetic imprinting, both disease contexts elicit largely similar states of exhausted CD8+ T cells. T cell exhaustion therefore represents a fundamental adaptation to conditions of chronic antigen stimulation and inflammation. Previous studies have found that CD8+ TILs seem exhausted2,19,20; however, recent studies indicate that dysfunctional CD8+ TILs are distinct from exhausted cells in chronic viral infection21,22. Our study helps resolve this contradiction by establishing both common features of T cell exhaustion and disease-specific features that reflect an additional imprint of the unique microenvironment. Critically, we identified a shared epigenetic program of exhaustion that is independent of the disease-specific milieu. Further analysis of this epigenetic program may help highlight the most important regulators of T cell exhaustion. In addition to having shared regions, exhausted TILs also demonstrate unique epigenetic changes that may reflect the distinct microenvironment of cancer, including those involved in metabolism34 and cytokine signaling that may fine-tune the underlying program of T cell exhaustion.
Second, we have identified subpopulations of exhausted CD8+ TILs with important and complementary functional specialization. Effective T cell–mediated immunity requires both cells with robust anti-tumor functionality and cells to sustain a durable response. We show that terminally exhausted cells are the primary cytotoxic CD8+ T cells in the TME but are short-lived35, whereas progenitor exhausted cells are poorly cytolytic but can persist long term. This suggests that a balance of both progenitor exhausted cell types and terminally exhausted cell types may be required for effective tumor control, as in chronic viral infection12. It may seem counter-intuitive that populations of exhausted CD8+ T cells are capable of potent anti-tumor properties, given previous studies showing that exhausted cells are impaired in functional attributes relative to those of memory T cells3,18. However, our findings are consistent with observations that exhausted CD8+ T cells still possess effector functions in chronic viral infection12,36. Furthermore, single-cell analysis of exhausted CD8+ T cells demonstrates significant heterogeneity of Tim-3+ cells, which may explain contradictory results in the literature about the functionality of these cells.
Finally, these results may have important implications for cancer immunotherapy. Transfer experiments in the mouse model show that anti-PD-1 therapy acts on progenitor exhausted CD8+ T cells but not terminally exhausted CD8+ T cells. On the basis of these data, we propose that anti-PD-1 therapy induces the proliferation and differentiation of progenitor exhausted cells in the TME, leading to an increase in cytotoxic, but short-lived, terminally exhausted cells. Consistent with this, in patients with advanced melanoma, the relative frequency of progenitor exhausted CD8+ T cells correlates with improved duration of response to checkpoint-blockade therapy. Unlike other studies that identified these populations in human tumors37 and demonstrated their predictive value for checkpoint-blockade response38,39, we did not find a difference between responders and non-responders in their percentage of progenitor exhausted cells. This may be due to the limited cohort size or other unmeasured but potentially important parameters, such as tumor mutational burden, resistance mutations (such as B2m loss40) and expression of the PD-1 ligand PD-L1, which may also affect the response. Nevertheless, these data indicate that the ultimate outcome of checkpoint-blockade therapy may depend on the representation of more durable progenitor exhausted CD8+ T cells in the pool of exhausted cells.
In this study, we define the population of TILs—progenitor exhausted CD8+ T cells—that mediate superior tumor control and can respond to PD-1 blockade. This suggests that efforts to increase their frequency may represent an important therapeutic strategy. Moreover, given the intense interest in understanding the biomarkers that predict response to checkpoint blockade, our findings indicate that evaluating the specific state of exhaustion in CD8+ TILs, not just their numbers, may be an important predictor of immunotherapy response.
online content
Any methods, additional references, Nature Research reporting summaries, source data, statements of data availability and associated accession codes are available at https://doi.org/10.1038/s41590–019-0312–6.
Methods
Mice, cell lines and TIL isolation.
Female C57BL/6J mice and CD45.1+ congenic mice (strain B6.SJL-Ptprc a Pepc b/BoyJ) were purchased from The Jackson Laboratory. B16.F10 cells and GVAX (B16 cells secreting GM-CSF) were a gift from G. Dranoff. D4M.3A cells were a gift from D. Fisher27. Cells underwent intermittent mycoplasma testing using the LookOut Mycoplasma PCR detection kit (Sigma). Lentiviral transduction was used to express ovalbumin under control of the PGK promoter in all three cell lines. B2m-null B16-OVA cells were generated by CRISPR/Cas9-mediated deletion of B2m by transient transfection with PX459 (Addgene), a plasmid expressing Cas9 and a guide targeting B2m (sequence: CACCGACAAGCACCAGAAAGACCA). Cells were selected in puromycin and B2m deletion was confirmed by flow cytometry (Supplementary Fig. 4c). Mice were subcutaneously implanted with 3 × 10⁵ B16-OVA or 3 × 10⁵ D4M.3A-OVA cells in 1 × HBSS (Life Technologies). When needed, mice were vaccinated with an equal number of irradiated GVAX-OVA cells (3,500 cGy). Tumors were measured starting at day 6 every 3 d. 100 μg anti-PD-1 (clone 29 F.1A12, BioXcell) or 100 μg isotype-matched control antibody (Rat IgG2a, BioXCell) and 100 μg anti-CTLA-4 (clone 9D9, BioXCell) or 100 μg isotype-matched control antibody (Mouse IgG2b, BioXCell) were administered via intraperitoneal injection on days 9 and 12. On the indicated days after cancer-cell injection, tumors were dissected from the surrounding fascia, mechanically minced and treated with collagenase P (2 mg ml−1, Sigma) and DNAse I (50 μg ml−1, Sigma) for 10 min at 37 °C. Tumor-infiltrating leukocytes were enriched using an Optiprep (Sigma) density gradient, followed by CD45+ or CD8+ MACS positive selection (Miltenyi). When necessary, cells were sorted on a FACS Aria II (BD Biosciences) to obtain greater than 95% purity. Spleen and lymph nodes were dissected from euthanized mice, mechanically minced and filtered to single-cell suspension. RBC lysis (ACK lysis buffer, Quality Biological) was performed on all spleen samples, followed by CD8+ MACS positive selection (Miltenyi). From B16-OVA tumors, the following gating strategies were used: progenitor exhausted cells (live CD45+CD8+PD-1+CD44+Slamf6+Tim-3-); terminally exhausted cells (Live CD45+CD8+PD-1+CD44+Slamf6-Tim-3+), further gated on SIINFEKL-tetramer+ or tetramer- populations as indicated. From LCMV-infected spleens, the following gating strategies were used: progenitor exhausted cells (gp33-tetramer+ Live CD45+CD8+CD44+Slamf6+Tim-3-); terminally exhausted cells (gp33-tetramer+ live CD45+CD8+CD44+Slamf6-Tim-3+). All in vitro T cell assays were performed using complete RPMI-10: RPMI-1640 (Gibco), 10% FCS (Gemini Bio-Products), 1% HEPES (Gibco), 0.5% penicillin/streptomycin (Life Technologies) and 0.1% β-mercaptoethanol (Gibco). All tumor cell lines were grown in complete DMEM-10: DMEM (Gibco), 10% FCS (Gemini Bio-Products) and 0.5% penicillin/streptomycin (Life Technologies). All animal procedures were performed in accordance with ethical regulations and pre-approved by the Dana-Farber Cancer Institute Institutional Animal Care and Use Committee.
Flow cytometry.
Cells were blocked with anti–mouse CD16/32 (BioLegend) and surface stained with indicated antibodies (Supplementary Table 8) for 20 min at 4 °C. Dead cells were excluded using Live/Dead (1/1,000, ThermoFisher Scientific) added concurrently with surface antibodies. When needed, cells were fixed with the Foxp3/Transcription Factor Staining Buffer Set (eBiosciences) for all stains except IL-2, as per the manufacturer’s instructions, were blocked again with 5% mouse and rat serum plus anti–mouse CD16/32 and then were stained with intracellular antibodies. For IL-2 staining, cells were fixed overnight with the BD Cytofix/Cytoperm Fixation and Permeabilization Solution (Fisher Scientific) as per the manufacturer’s instructions, blocked with 5% mouse and rat serum plus anti–mouse CD16/32 and then stained with intracellular antibodies. Annexin V (Fisher Scientific) staining was performed after cell surface staining per the manufacturer’s instructions. For BrdU experiments, mice were administered 1 mg BrdU (BD Pharmingen) via intraperitoneal injection at the indicated times before tumor harvest. BrdU staining was performed after cell-surface staining as per the BrdU kit protocol. Spherotech AccuCount Fluorescent particles were added for cell quantification before analysis on a LSR Fortessa (BD Biosciences). Data was collected using a FACSDiva (v.8.0.1, BD Pharmingen). Analysis was performed using FlowJo software (v.10.4.1, TreeStar) using single-color compensation controls and fluorescence-minus-one thresholds to set gate margins.
LCMV viral infection.
Mice were infected with LCMV Clone 13 (4 × 10⁶ plaque-forming units (pfu) by intravenous injection) or LCMV Armstrong (2 × 10⁵ pfu intraperitoneal) as previously described3. Viral titers were assessed as previously described41. Briefly, diluted serum from infected animals was plated on Vero cells. The cells were covered with an agarose layer and were allowed to form plaques over 96 h. Live cells were stained with neutral red and plaques were counted 14 h later. All counts were normalized to serum volume.
In vivo transfer assay.
7-to 10-week-old female C57BL/6 J (CD45.2+) mice were subcutaneously implanted with 3 × 10⁵ B16-OVA cells on day 0. On days 3–5, they were vaccinated once with 3 × 10⁵ GVAX-OVA cells. Progenitor exhausted or terminally exhausted TILs were sorted from tumors on days 19–21 (roughly 1,000–2,000 mm3) as described above. After sorting, cells were centrifuged at 350 r.c.f. (relative centrifugal force) and were resuspended in PBS. 50,000 progenitor or terminally exhausted cells were transferred via retroorbital intravenous injection into 7- to 10-week-old female C57BL/6 (CD45.2+) or CD45.1+ congenic mice who had been subcutaneously implanted with 3 × 10⁵ B16-OVA or 3 × 10⁵ B16.F10 cells 2 d before. Tumors were measured at day 6 and every 3 d afterward. TILs were isolated on days 17–18 for analysis as previously described.
In vivo persistence and tumor-challenge assays.
Progenitor exhausted or terminally exhausted TILs were isolated from tumors at days 19–21 as per the in vivo transfer assay above, and 50,000 cells of each cell type were IV injected into two cohorts of female CD45.1+ mice without tumors. After 30–40 d, the first cohort of mice was sacrificed to analyze secondary lymphoid organs. In the second cohort, after 30–40 d, mice were subcutaneously implanted with 3 × 10⁵ B16-OVA cells. On days 15–16 after tumor implantation, TILs were isolated as previously described to determine transferred cell numbers and phenotypes.
In vivo transfer with anti-PD-1 assay.
Progenitor exhausted or terminally exhausted TILs were isolated from tumors at days 19–21 as per the in vivo transfer assay above, and 50,000 cells of each cell type were intravenously injected into female CD45.1+ mice who had been subcutaneously implanted with 1 × 10⁶ B16-OVA cells 2 d before. Mice were treated with 100 μg isotype-matched control antibody or anti-PD-1 on days 6, 9 and 12. Tumors were harvested on day 15 or 16 for analysis.
In vitro cytotoxicity, cytokine production, CFSE proliferation and conversion.
To compare the cytotoxicity of both subpopulations, we plated tetramer-positive progenitor exhausted or terminally exhausted CD8+ T cells with a 1:1 mixture of target cells (B16-OVA) and control cells (B2m-null B16-OVA in which B2m has been deleted using CRISPR/Cas9, making them resistant to cell-mediated cytotoxicity) (Supplementary Fig. 4c–e). This competitive cytotoxicity assay allowed us to measure direct cytotoxicity while controlling for cytokine-mediated effects on tumor cell viability. Specifically, the in vitro killing assay was performed by plating 5,000 B16-OVA (target) and 5,000 B2m-null B16-OVA (non-target) cells into 96-well flat-bottomed plates for 24 h with IFN-γ (100 ng ml−1, Cell Signaling Technology) to upregulate MHC-I, washing the cells with PBS, then adding the indicated numbers of naive CD8+ T splenocytes, sorted tetramer+ progenitor exhausted cells or tetramer+ terminally exhausted cells to each well. After 40 h, cells were trypsinized from the wells and stained for CD45, Slamf6, Tim-3, live/dead and H-2Kb to determine the ratio of the two tumor cell populations and phenotype of the T cells. The ratio of target cells to non-target cells was normalized to the ratio of the populations in wells in which no T cells were added. As expected, OVA-specific CD8+ TILs selectively lysed wild-type B16-OVA cells in a dose-dependent fashion, while naive CD8+ T cells did not (Supplementary Fig. 4f).
Evaluation of in vitro cytokine production was performed by sorting tetramer+ CD8+ TILs from B16-OVA tumors at days 19–21 and plating 100,000 CD8+ T cells with 100,000 irradiated splenic dendritic cells (isolated by CD11c+ MACS positive selection and irradiated with 3,000 cGy) with SIINFEKL peptide (1 μM, Invivogen) and brefeldin A 3.0 μg ml−1 for 6 h. Alternatively, we isolated CD8+ TILs from B16-OVA tumors at days 19–21 using CD8+ MACS positive selection (Miltenyi) and plated 2 × 10⁵ cells in 96-well plates with PMA 50 ng ml−1 plus ionomycin 1 μg ml−1 plus brefeldin A 3.0 μg ml−1 for 6 h. The cells were stained for surface antigens, then were fixed and stained for intracellular cytokines as described above.
In vitro CFSE proliferation was performed by sorting progenitor or terminally exhausted T cells from B16-OVA tumors at days 19–21 or MACS-enriched naive CD8+ splenocytes and labeling with 0.5 μM CFSE for 8 min at 37 °C. Cells were washed twice with RPMI-10, then counted. 50,000 cells per well were plated in 96-well U-bottomed plates coated with 1 μg ml−1 anti-CD3 (Fisher Scientific) and 1 μg ml−1 anti-CD28 (Fisher Scientific) in RPMI-10 with recombinant human IL-2 100 U per ml (DFCI supply center). Cells were harvested after 4 d and stained against CD8+ and live/dead and analyzed as previously described.
In vitro conversion was performed by sorting progenitor or terminally exhausted CD8+ T cells from B16-OVA tumors at days 19–21 and plating 50,000 cells per well in 96-well U-bottomed plates coated with 1 μg ml−1 anti-CD3 (Fisher Scientific) and 1 μg ml−1 anti-CD28 (Fisher Scientific) in RPMI-10 without IL-2. After 36 h of culture, brefeldin A 3.0 μg ml−1 was added to the cultures for 6 h, then the cells were stained for surface antigens, fixed and stained for intracellular antigens as described above.
TCR sequencing.
Tetramer-negative progenitor exhausted or terminally exhausted cells were sorted from two separate pools of day-20 B16-OVA tumors as previously described to generate independent replicates. Genomic DNA was isolated using QIAamp DNA Blood Mini Kit (Qiagen), eluted in TE buffer and sent to Adaptive Biotechnologies for sequencing. Analysis was performed on genomic TCRβ sequences using the ImmunoSEQ Analyzer platform (v.3.0).
Bulk RNA-seq library preparation and analysis.
Tetramer-positive progenitor exhausted or terminally exhausted cells were sorted from spleens of day 30 LCMV Cl13 infected mice or day 22 B16-OVA tumors in pools of 400 cells into a microplate containing 20 μl of RLT buffer (Qiagen) with 1% v/v β-mercaptoethanol in each well. Immediately following sorting, the plates were sealed, vortexed briefly, spun at 400_g_ for 1 min and were flash-frozen on dry ice for storage at −80 °C until library preparation. Cellular lysates were converted to cDNA in an adapted SmartSeq2 protocol as previously described42.
Libraries were sequenced on a NextSeq500 instrument by 37 -base-pair paired-end reads. After demultiplexing, low-quality reads were trimmed with Trimmomatic (v.0.33) using the following parameters: LEADING: 15, TRAILING: 15, SLIDINGWINDOW: 4:15 and MINLEN: 16. Trimmed reads were aligned to the mm10 mouse genome using Bowtie2 (v.2.2.4). HTSeq (v.0.6.1p1) was used to map aligned reads to genes and generate a gene count matrix. Technical replicates were averaged for each biologically independent sample. Gene counts were normalized by library size and differential expression analysis was performed using DESeq2 (v.1.18.1) (Supplementary Table 2). Following differential expression analysis between phenotypic groups, a ranking metric was calculated for each gene as R = −log10(q), where q is the FDR-adjusted P value. Preranked GSEA43 (v.3.0) was performed using the C2, C5 and C7 gene sets in the MSigDB database. To compare our data with other RNA-seq datasets from the literature, the top 150 differentially expressed genes (ranked by q value) were determined between the two indicated states for each sample generated as previously described or identified from the literature. A hypergeometric overlap test was performed to determine the overlap of each gene set with all others.
Single-cell RNA-seq library preparation and analysis.
The following cells were sorted for single-cell RNA-seq: gp33-tetramer+ live CD8+PD-1+CD44+ cells from spleens of day-28 LCMV Cl13-infected mice; SIINFEKL- tetramer+ live CD45+CD8+ cells from day-20 B16-OVA tumors and live PD-1+CD44+CD45+CD8+ cells from day-10 B16-OVA tumors. Cells were counted and loaded onto the Chromium Controller (10X Genomics) for a target recovery of 5,000 single cells. Samples were processed per the manufacturer’s protocol and sequenced on an Illumina NextSeq500 sequencer using a 75-bp kit with paired-end reads. Sample demultiplexing, barcode processing, alignment, filtering, UMI counting and aggregation of sequencing runs were performed using the Cell Ranger analysis pipeline (v.1.2). Downstream analyses were performed in R using the Seurat package44 (v.2.1.0).
For each cell, two quality control metrics were calculated: (1) the total number of genes detected, and (2) the proportion of UMIs contributed by mitochondrially encoded transcripts. Cells in which fewer than 200 genes were detected and in which mitochondrially encoded transcripts constituted greater than 10% of the total library were excluded from downstream analysis. Genes detected in fewer than three cells across the dataset were also excluded, yielding an expression matrix of 9,194 cells by 13,642 genes (LCMV), 11,212 cells by 14,496 genes (day 10 + 20 tumor), or 4,313 cells by 13,880 genes (day 20 tumor). Each gene expression measurement was normalized by total expression in the corresponding cell and multiplied by a scaling factor of 10,000. Mean and dispersion values were calculated for each gene across all cells; 1,653 genes (LCMV), 1,234 genes (day 10 + 20 tumor) or 914 genes (day 20 tumor) classified as highly variable. Highly variable genes were used for PCA. Principal components were determined to be significant (P < 0.01) using the jackstraw method, and tSNE was performed on these significant principle components using default parameters for 1,000 iterations for visualization in two dimensions. Unsupervised clustering was performed using a shared nearest neighbor modularity optimization-based algorithm45. Differential expression analysis was performed between each cluster and all other cells using a Wilcoxon rank sum test. Single-cell signature scoring using FastProject46 (v.0.9.2) was performed with a curated version of the C7 Immune Signatures database from MSigDB. Significance of signature enrichment in single-cell datasets of one cluster relative to other clusters was determined using a Kolmogorov–Smirnov test. FastProject signature scoring of CD8+ T cells from tumors was performed in the scope of transcriptional signatures derived from the subpopulations we identified in LCMV or from signatures derived from the literature. Tumor cells were plotted on a two-dimensional axis on the basis of their scores for the terminally exhausted and progenitor exhausted signatures on the x axis and y axis, respectively.
ATAC-seq library preparation and analysis.
5,000–50,000 tetramer-positive progenitor exhausted or terminally exhausted cells per replicate were sorted from spleens of day-30 LCMV Cl13–infected mice or day-22 B16-OVA tumors into PBS with 10% FBS. Pelleted cells were incubated in 5–50 μl of reaction mix (containing 2 × TD, Tn5 enzyme, 2% digitonin in nuclease-free water) as previously described47. The reaction was performed at 37 °C for 30 min with agitation at 300 RPM. DNA was purified using a QIAgen MinElute Reaction Cleanup kit. Post-PCR bead cleanup was done using Agencourt AMPure XP bead cleanup (Beckman Coulter/Agencourt), and library quality was verified using Tapestation analysis. Samples were sequenced on an Illumina NextSeq500 sequencer using paired-end 37 bp reads.
Quality trimming and primer removal in raw fastq files were done with Trimmomatic (v.0.33) using the following parameters: LEADING:15 TRAILING:15 SLIDINGWINDOW:4:15 MINLEN:36. Trimmed reads were aligned to mm9 with Bowtie2 (v.2.2.4) using a maximum insert size of 1,000. Aligned bams were sorted, duplicates marked, and reads mapping to the blacklist region removed48. Peak-calling using MACS (v.2.1.1) was performed on merged bam files (Samtools v.1.3) from biological replicates using a q value threshold of 0.001. Consensus peaks from all biological conditions were merged to create a single peak universe. Cut sites were extracted from each biological replicate and the number of cuts in each peak region was quantified to generate a raw counts matrix. DESeq2 (v.1.18.1) was used to normalize the counts matrix and perform differential accessibility analysis between all relevant comparisons (Supplementary Table 3). Tracks were visualized using Integrative Genomics Viewer (v.2.3.77, Broad Institute). Gene-to-peak associations were determined using the GREAT software package (v.3.0.0, http://bejerano.stanford.edu/great/public/html/) with default settings. _K_-means clustering was applied using GENE-E (v.3.0.215, Broad Institute) to differential ChAR signal intensity across cell states. GENE-E was also used for heatmap visualization and similarity matrix calculations (Pearson). PCA was carried out using R (v.3.3.1, R Core Team). Gene ontology term enrichment was performed for each biological condition using GREAT, with default settings and binomial enrichment. Motif-enrichment analysis was performed using HOMER (v.3.0) with default settings.
Human multiplex immunofluorescence and survival analysis.
Through the Center for Immuno-Oncology, IRB-approved consent was obtained from patients with advanced melanoma to collect and analyze tumor samples as companion to the combination treatment of ipilimumab and nivolumab they received (Supplementary Table 6). All human studies were performed in accordance with ethical regulations and pre-approved by the Dana-Farber Cancer Institute IRB (2016P002770). Formalin-fixed, paraffin embedded whole tissues from tumors were obtained from Department of Pathology, Brigham and Women’s Hospital. Hematoxylin- and eosin-stained tissue sections and the diagnostic reports were reviewed by expert pathologists (S.J.R. and G.K.G.). Tissue sections 4 μM in thickness were obtained for each sample and were stained with primary antibodies sequentially and paired with unique fluorochromes, followed by DAPI staining per a published protocol49 (Supplementary Table 8). In brief, tissue sections were baked for 3 h at 60 °C before loading onto BOND RX fully automated stainers (Leica Biosystems) for roughly 9 h. Slides were deparaffinized (BOND DeWax Solution, Leica Biosystems) and were rehydrated with sequential washes in graded ethanol to deionized water, followed by antigen retrieval in BOND Epitope Retrieval Solution 1 (ER1, Leica Biosystems) at pH 6 for 10 min at 98 °C. Next, slides were serially stained with primary antibodies for 40 min. Anti-rabbit polymeric horseradish peroxidase (Poly-HRP, BOND Polymer Refine Detection Kit, Leica Biosystems) was applied as a secondary label for 10 min. Signal for antibody complexes was visualized by their corresponding Opal Fluorophore Reagents (PerkinElmer) by incubating the slides for 5 min. Slides were air dried, mounted with Prolong Diamond Anti-fade mounting medium (Life Technologies) and stored in a light-proof box at 4 °C before imaging. Three to five images per sample were obtained using the Mantra multispectral imaging platform (Vectra 3, PerkinElmer) at 20 × resolution. Areas without tumor or with residual normal tissue (such as normal lymph node) were excluded. For each region, tiled fields of view were acquired at 20 × resolution as multispectral images. Each field of view was spectrally separated and analyzed using Inform 2.3 software (PerkinElmer), a supervised machine-learning algorithm that assigns phenotypes to all cells in the image, according to a combination of immunofluorescence characteristics associated with nuclei (DAPI signal). Thresholds for ‘positive’ staining and the accuracy of phenotypic algorithms were confirmed by the pathologist (S.J.R.) for each case.
Patients were characterized as having either a durable clinical benefit or no clinical benefit as defined before50. Durable clinical benefit was defined as at least 6 months of freedom from disease or stable/decreased tumor burden from the first radiological scan following treatment. Increased tumor volume or a clinical benefit lasting less than 6 months from the first post treatment radiological scan was defined as no durable clinical benefit. PFS was calculated from the date of treatment until radiological evidence of progression or unequivocal clinical progression as determined by the clinician, leading to treatment discontinuation/switch or death, whichever occurred first. Overall survival was calculated from the date of treatment until date of death or censure.
Statistical analysis.
All mouse experiments were randomized before treatment without investigator blinding, and sample sizes of five to ten animals per experimental arm were chosen to ensure adequate power. Paired two-sided _t_-tests were run on comparisons within experimental animals, and all other experimental data were analyzed using unpaired two-sided Student’s _t_-tests in Graphpad Prism 7. Rout outlier tests were run with default parameters in Prism on all mouse experimental data. Statistical analysis of differential gene expression and differential chromatin accessibility tests was done using DESeq2 (v.1.18.1), and FDR correction was performed using the Benjamini-Hochberg method in R (v.3.3.1). Significance of gene ontology term enrichments and motif enrichments were calculated with binomial tests and hypergeometric tests. Survival analysis was performed using the Cox proportional hazards model and likelihood ratio tests using the Survminor (v.0.4.1) and Survival (v.2.43.3) packages in R. All significant variables from the univariable analysis were included in the multivariable analysis. P values and q values <0.05 were considered to indicate a significant difference. Asterisks used to indicate significance correspond to the following: NS, not significant (_P_ > 0.05), *P ≤ 0.05, **P ≤ 0.01, ***P ≤ 0.001 and ****P ≤ 0.0001. Please see the Life Sciences Reporting Summary for additional details.
Reporting Summary.
Further information on research design is available in the Nature Research Reporting Summary linked to this article.
Supplementary Material
SUPP
SUPPTB1
SUPPTB2
SUPPTB3
SUPPTB4
SUPPTB5
SUPPTB6
SUPPTB7
SUPPTB8
Acknowledgements
W.N.H. received support from NIAID R01 AI115712, NIAID U19 AI133524, Parker Institute for Cancer Immunotherapy, and Mathers Charitable Trust. A.H.S. was supported by NIAID P01 AI56299 and funding from the Ludwig Center at Harvard Medical School. B.C.M. was supported by the 2016 AACR-Bristol-Myers Squibb Fellowship in Translational Immuno-oncology grant number 16–40-15-MILL, Wong Family Awards in Translational Oncology, National Center for Advancing Translational Sciences/National Institutes of Health Award KL2 TR002542, NCI T32 CA009172, and the Jane C. Wright, MD, Endowed Young Investigator Award from ASCO. J.J.I. received funding from NCI T32 CA009172. Y.V.V. received funding from NIAID K23 AI130408. M.W.L. received funding from NCI T32 CA207021. J.R.K. and S.A.W. were supported by NIGMS T32 GM007753. G.K.G. received funding from NHLBI T32 HL007627. This work was supported, in part, by the Center for Immuno-Oncology at DFCI. We would like to thank the Dana-Farber Flow Cytometry Core for their assistance.
Footnotes
Competing interests
W.N.H. receives funding from Roche and Novartis. A.H.S. has patents on the PD-1 pathway licensed by Roche/Genentech and Novartis and consults for Novartis. S.J.R. receives research support from Bristol-Myers Squibb, Merck, Affimed, and KITE pharmaceuticals. G.S.N. is a current employee of Leap Therapeutics. F.S.H. receives research support from Bristol-Myers Squibb, personal fees from Bristol-Myers Squibb, Merck, EMD Serono, Novartis, Celldex, Amgen, Genentech/Roche, Incyte, Apricity, Bayer, Aduro, Partners Therapeutics, Sanofi, Pfizer, Pionyr, Verastem, Compass Therapeutics, and Takeda. F.S.H. is an advisor for 7 Hills Pharma and Torque. F.S.H. has the following patents: Methods for Treating MICA-Related Disorders (no. 20100111973) with royalties paid, Tumor antigens and uses thereof (no. 7250291) issued, Angiopoiten-2 Biomarkers Predictive of Anti-immune checkpoint response (no. 20170248603) pending, Compositions and Methods for Identification, Assessment, Prevention, and Treatment of Melanoma using PD-L1 Isoforms (no. 20160340407) pending, Therapeutic peptides (no. 20160046716) pending, Therapeutic Peptides (no. 20140004112) pending, Therapeutic Peptides (no. 20170022275) pending, Therapeutic Peptides (no. 20170008962) pending, Therapeutic Peptides (no. 9402905) issued and Methods of Using Pembrolizumab and Trebananib pending.
Data availability
All sequencing data from this study have been deposited in the National Center for Biotechnology Information Gene Expression Omnibus (GEO) and are accessible through the GEO Series accession code GSE122713. All other relevant data are available from the corresponding author on request.
References
- 1.Thommen DS & Schumacher TN T cell dysfunction in cancer. Cancer Cell. 33, 547–562 (2018). [DOI] [PMC free article] [PubMed] [Google Scholar]
- 2.Ahmadzadeh M et al. Tumor antigen-specific CD8 T cells infiltrating the tumor express high levels of PD-1 and are functionally impaired. Blood 114, 1537–1544 (2009). [DOI] [PMC free article] [PubMed] [Google Scholar]
- 3.Zajac AJ et al. Viral immune evasion due to persistence of activated T cells without effector function. J. Exp. Med. 188, 2205–2213 (1998). [DOI] [PMC free article] [PubMed] [Google Scholar]
- 4.Moskophidis D, Lechner F, Pircher H & Zinkernagel RM Virus persistence in acutely infected immunocompetent mice by exhaustion of antiviral cytotoxic effector T cells. Nature 362, 758–761 (1993). [DOI] [PubMed] [Google Scholar]
- 5.Wherry EJ T cell exhaustion. Nat. Immunol. 12, 492–499 (2011). [DOI] [PubMed] [Google Scholar]
- 6.Gallimore A et al. Induction and exhaustion of lymphocytic choriomeningitis virus-specific cytotoxic T lymphocytes visualized using soluble tetrameric major histocompatibility complex class I–peptide complexes. J. Exp. Med. 187, 1383–1393 (1998). [DOI] [PMC free article] [PubMed] [Google Scholar]
- 7.Barber DL et al. Restoring function in exhausted CD8 T cells during chronic viral infection. Nature 439, 682–687 (2006). [DOI] [PubMed] [Google Scholar]
- 8.Sen DR et al. The epigenetic landscape of T cell exhaustion. Science 354, 1165–1169 (2016). [DOI] [PMC free article] [PubMed] [Google Scholar]
- 9.Doering TA et al. Network analysis reveals centrally connected genes and pathways involved in CD8+. T cell exhaustion versus memory. Immunity 37, 1130–1144 (2012). [DOI] [PMC free article] [PubMed] [Google Scholar]
- 10.Mognol GP et al. Exhaustion-associated regulatory regions in CD8+ tumor-infiltrating T cells. Proc. Natl Acad. Sci. USA 114, E2776–E2785 (2017). [DOI] [PMC free article] [PubMed] [Google Scholar]
- 11.Wherry EJ et al. Molecular signature of CD8+ T cell exhaustion during chronic viral infection. Immunity 27, 670–684 (2007). [DOI] [PubMed] [Google Scholar]
- 12.Paley MA et al. Progenitor and terminal subsets of CD8+ T cells cooperate to contain chronic viral infection. Science 338, 1220–1225 (2012). [DOI] [PMC free article] [PubMed] [Google Scholar]
- 13.Utzschneider DT et al. T cell factor 1-expressing memory-like CD8+ T cells sustain the immune response to chronic viral infections. Immunity 45, 415–427 (2016). [DOI] [PubMed] [Google Scholar]
- 14.Im SJ et al. Defining CD8+ T cells that provide the proliferative burst after PD-1 therapy. Nature 537, 417–421 (2016). [DOI] [PMC free article] [PubMed] [Google Scholar]
- 15.He R et al. Follicular CXCR5-expressing CD8+ T cells curtail chronic viral infection. Nature 537, 412–428 (2016). [DOI] [PubMed] [Google Scholar]
- 16.Leong YA et al. CXCR5+ follicular cytotoxic T cells control viral infection in B cell follicles. Nat. Immunol. 17, 1187–1196 (2016). [DOI] [PubMed] [Google Scholar]
- 17.Wu T et al. The TCF1-Bcl6 axis counteracts type I interferon to repress exhaustion and maintain T cell stemness.Sci. Immunol. 1, 1–12 (2016). [DOI] [PMC free article] [PubMed] [Google Scholar]
- 18.Blackburn SD, Shin H, Freeman GJ & Wherry EJ Selective expansion of a subset of exhausted CD8 T cells by αPD-L1 blockade. Proc. Natl Acad Sci. USA 105, 15016–15021 (2008). [DOI] [PMC free article] [PubMed] [Google Scholar]
- 19.Baitsch L et al. Exhaustion of tumor-specific CD8+ T cells in metastases from melanoma patients. J. Clin. Invest. 121, 2350–2360 (2011). [DOI] [PMC free article] [PubMed] [Google Scholar]
- 20.Sakuishi K et al. Targeting Tim-3 and PD-1 pathways to reverse T cell exhaustion and restore anti-tumor immunity. J. Exp. Med. 207, 2187–2194 (2010). [DOI] [PMC free article] [PubMed] [Google Scholar]
- 21.Schietinger A et al. Tumor-specific T cell dysfunction is a dynamic antigen-driven differentiation program initiated early during tumorigenesis. Immunity 45, 389–401 (2016). [DOI] [PMC free article] [PubMed] [Google Scholar]
- 22.Singer M et al. A distinct gene module for dysfunction uncoupled from activation in tumor-infiltrating T cells. Cell 166, 1500–1511 e1509 (2016). [DOI] [PMC free article] [PubMed] [Google Scholar]
- 23.Philip M et al. Chromatin states define tumour-specific T cell dysfunction and reprogramming. Nature 545, 452–456 (2017). [DOI] [PMC free article] [PubMed] [Google Scholar]
- 24.Wei SC et al. Distinct cellular mechanisms underlie anti-CTLA-4 and anti-PD-1 checkpoint blockade. Cell 170, 1120–1133 e1117 (2017). [DOI] [PMC free article] [PubMed] [Google Scholar]
- 25.Blackburn SD et al. Coregulation of CD8+ T cell exhaustion by multiple inhibitory receptors during chronic viral infection. Nat. Immunol. 10, 29–37 (2009). [DOI] [PMC free article] [PubMed] [Google Scholar]
- 26.Fidler IJ Biological behavior of malignant melanoma cells correlated to their survival in vivo. Cancer Res. 35, 218–224 (1975). [PubMed] [Google Scholar]
- 27.Jenkins MH et al. Multiple murine BRaf(V600E) melanoma cell lines with sensitivity to PLX4032. Pigment. Cell. Melanoma. Res. 27, 495–501 (2014). [DOI] [PMC free article] [PubMed] [Google Scholar]
- 28.Wang R et al. T cell factor 1 regulates thymocyte survival via a RORγt-dependent pathway. J. Immunol. 187, 5964–5973 (2011). [DOI] [PMC free article] [PubMed] [Google Scholar]
- 29.Ferreira V et al. In vivo inhibition of NF-κB in T-lineage cells leads to a dramatic decrease in cell proliferation and cytokine production and to increased cell apoptosis in response to mitogenic stimuli, but not to abnormal thymopoiesis. J. Immunol. 162, 6442–6450 (1999). [PubMed] [Google Scholar]
- 30.Woolf E et al. Runx3 and Runx1 are required for CD8 T cell development during thymopoiesis. Proc. Natl Acad. Sci. USA 100, 7731–7736 (2003). [DOI] [PMC free article] [PubMed] [Google Scholar]
- 31.Martinez GJ et al. The transcription factor NFAT promotes exhaustion of activated CD8+ T cells. Immunity 42, 265–278 (2015). [DOI] [PMC free article] [PubMed] [Google Scholar]
- 32.Tumeh PC et al. PD-1 blockade induces responses by inhibiting adaptive immune resistance. Nature 515, 568–571 (2014). [DOI] [PMC free article] [PubMed] [Google Scholar]
- 33.Pauken KE et al. Epigenetic stability of exhausted T cells limits durability of reinvigoration by PD-1 blockade. Science 354, 1160–1165 (2016). [DOI] [PMC free article] [PubMed] [Google Scholar]
- 34.Ho PC et al. Phosphoenolpyruvate is a metabolic checkpoint of anti-tumor T cell responses. Cell 162, 1217–1228 (2015). [DOI] [PMC free article] [PubMed] [Google Scholar]
- 35.Horton BL, Williams JB, Cabanov A, Spranger S & Gajewski TF Intratumoral CD8+ T-cell apoptosis is a major component of T-cell dysfunction and impedes antitumor immunity. Cancer Immunol. Res. 6, 14–24 (2018). [DOI] [PMC free article] [PubMed] [Google Scholar]
- 36.Schmitz JE et al. Control of viremia in simian immunodeficiency virus infection by CD8+ lymphocytes. Science 283, 857–860 (1999). [DOI] [PubMed] [Google Scholar]
- 37.Brummelman J et al. High-dimensional single cell analysis identifies stem-like cytotoxic CD8+ T cells infiltrating human tumors. J. Exp. Med. 215, 2520–2535 (2018). [DOI] [PMC free article] [PubMed] [Google Scholar]
- 38.Sade-Feldman M et al. Defining T cell states associated with response to checkpoint immunotherapy in melanoma. Cell 175, 998–1013 e1020 (2018). [DOI] [PMC free article] [PubMed] [Google Scholar]
- 39.Thommen DS et al. A transcriptionally and functionally distinct PD-1+ CD8+ T cell pool with predictive potential in non-small-cell lung cancer treated with PD-1 blockade. Nat. Med. 24, 994–1004 (2018). [DOI] [PMC free article] [PubMed] [Google Scholar]
- 40.Sade-Feldman M et al. Resistance to checkpoint blockade therapy through inactivation of antigen presentation. Nat. Commun. 8, 1136 (2017). [DOI] [PMC free article] [PubMed] [Google Scholar]
References
- 41.Welsh RM & Seedhom MO Lymphocytic choriomeningitis virus (LCMV): propagation, quantitation, and storage. Curr. Protoc. Microbiol. 8, 15A.1.1–15A.1.11 (2008). [DOI] [PMC free article] [PubMed] [Google Scholar]
- 42.Yates K, Bi K, Haining WN, Cantor H & Kim HJ Comparative transcriptome analysis reveals distinct genetic modules associated with Helios expression in intratumoral regulatory T cells. Proc. Natl Acad. Sci. USA 115, 2162–2167 (2018). [DOI] [PMC free article] [PubMed] [Google Scholar]
- 43.Subramanian A et al. Gene set enrichment analysis: a knowledge-based approach for interpreting genome-wide expression profiles. Proc. Natl Acad. Sci. USA 102, 15545–15550 (2005). [DOI] [PMC free article] [PubMed] [Google Scholar]
- 44.Satija R, Farrell JA, Gennert D, Schier AF & Regev A Spatial reconstruction of single-cell gene expression data. Nat. Biotechnol. 33, 495–502 (2015). [DOI] [PMC free article] [PubMed] [Google Scholar]
- 45.Waltman L & van Eck NJ A smart local moving algorithm for large-scale modularity-based community detection. Europ. Phys. J. B 86, 013). [Google Scholar]
- 46.DeTomaso D & Yosef N FastProject: a tool for low-dimensional analysis of single-cell RNA-Seq data. BMC Bioinformatics 17, 016). [DOI] [PMC free article] [PubMed] [Google Scholar]
- 47.Corces MR et al. Lineage-specific and single-cell chromatin accessibility charts human hematopoiesis and leukemia evolution. Nat. Genet. 48, 1193–1203 (2016). [DOI] [PMC free article] [PubMed] [Google Scholar]
- 48.Buenrostro JD, Giresi PG, Zaba LC, Chang HY & Greenleaf WJ Transposition of native chromatin for fast and sensitive epigenomic profiling of open chromatin, DNA-binding proteins and nucleosome position. Nat. Methods 10, 1213–1218 (2013). [DOI] [PMC free article] [PubMed] [Google Scholar]
- 49.Carey CD et al. Topological analysis reveals a PD-L1-associated microenvironmental niche for Reed-Sternberg cells in Hodgkin lymphoma. Blood 130, 2420–2430 (2017). [DOI] [PMC free article] [PubMed] [Google Scholar]
- 50.Snyder A et al. Genetic basis for clinical response to CTLA-4 blockade in melanoma. N. Engl. J. Med. 371, 2189–2199 (2014). [DOI] [PMC free article] [PubMed] [Google Scholar]
Associated Data
This section collects any data citations, data availability statements, or supplementary materials included in this article.
Supplementary Materials
SUPP
SUPPTB1
SUPPTB2
SUPPTB3
SUPPTB4
SUPPTB5
SUPPTB6
SUPPTB7
SUPPTB8